Regulation of Eag1 gating by its intracellular domains
- The Rockefeller University, Howard Hughes Medical Institute, United States
Figures
Figure 1
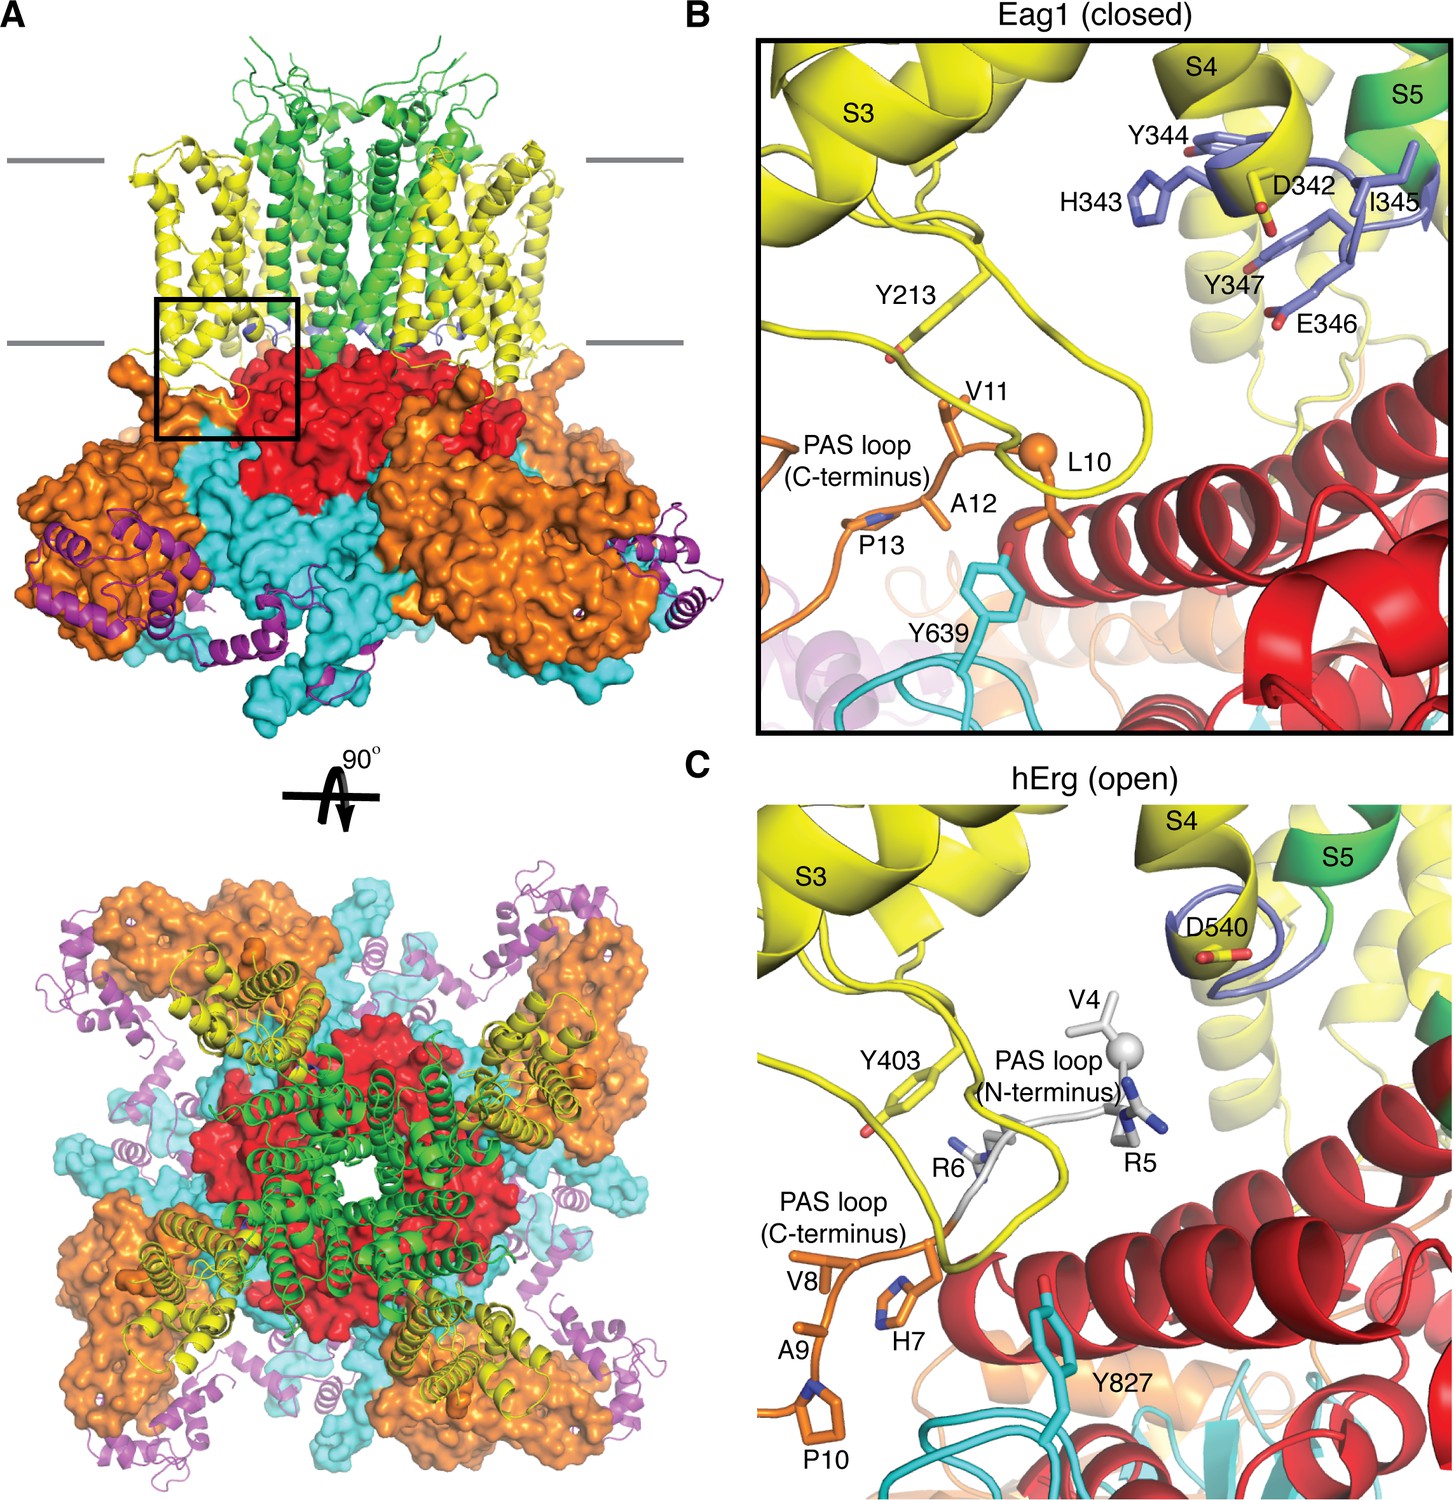
Comparison of the PAS loop in Eag1 and hErg.
(A) Structure of Eag1 (PDB: 5K7L) in the closed conformation (PAS is orange, VS is yellow, S4-S5 linker is blue, pore is green, C-linker is red, CNBHD is cyan, CaM is purple, and membrane is indicated by gray bars) with a black box indicating the view for panel (B). (B) View of interaction between PAS loop, VS and CNBHD in the closed conformation of Eag1 with the same coloring as in (A). The N-terminus of the protein is shown as a sphere. The PAS loop N-terminus is not observed in this structure. (C) View of the interaction between PAS loop, VS and CNBHD in the open conformation of hErg (PDB: 5VA2) with the same coloring and orientation as in (B). The N-terminus is shown as a sphere and the PAS loop N-terminus is shown in gray.
Figure 2
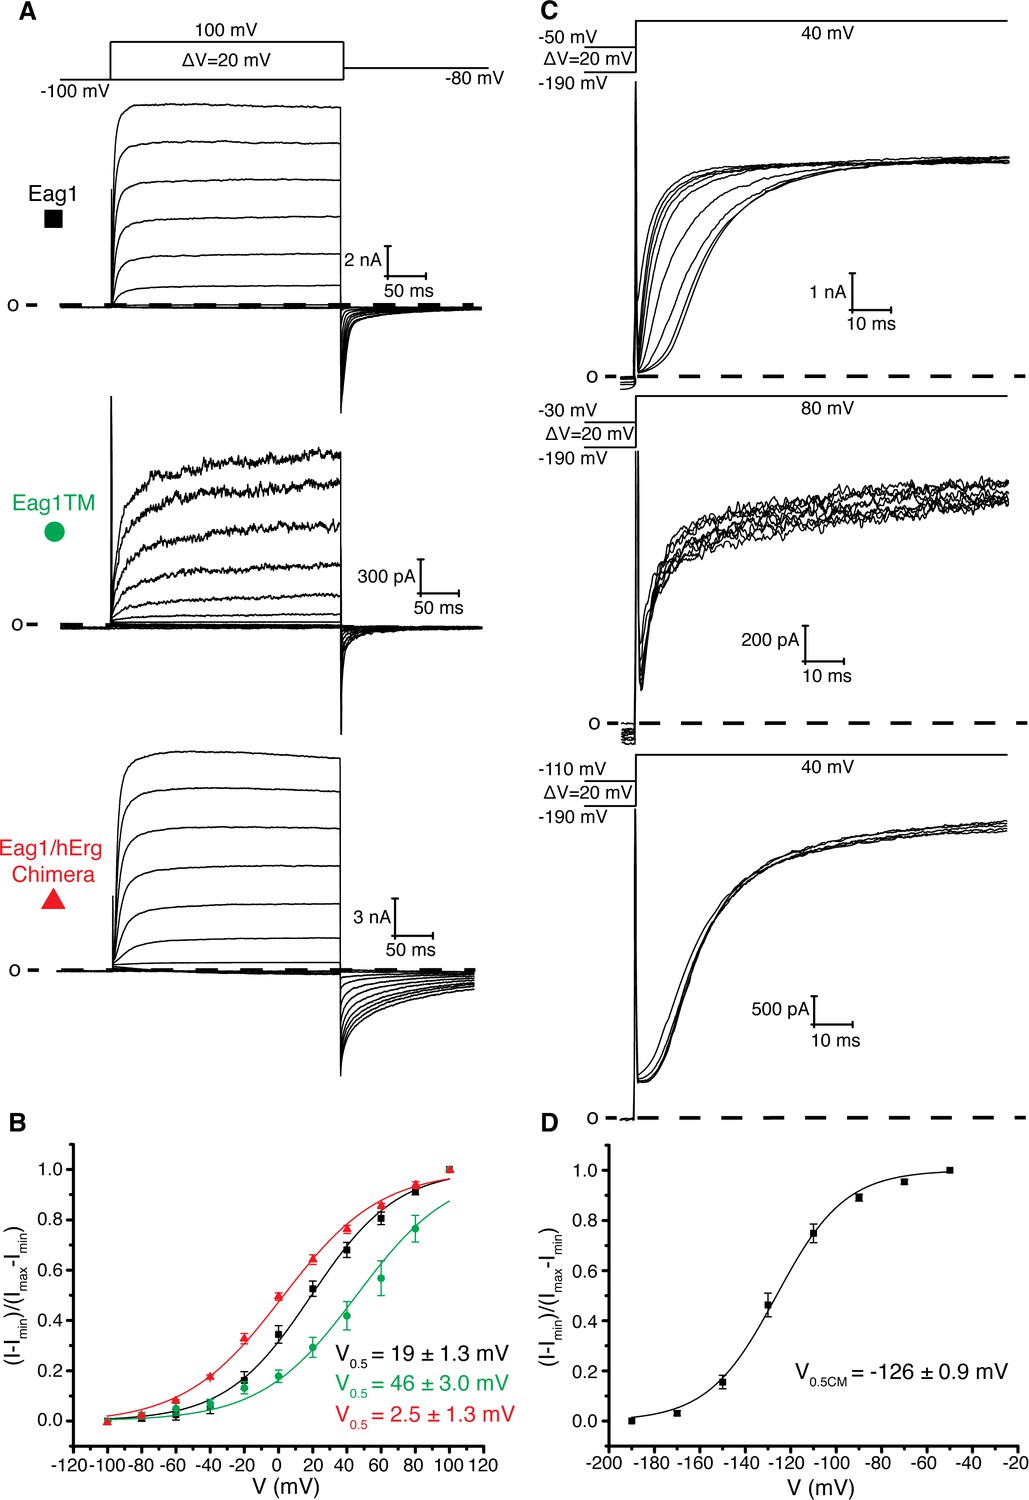
Role of intracellular domains in voltage-dependent gating.
(A) Voltage family current trace of WT Eag1, Eag1TM, and the Eag1/hErg chimera with the voltage-pulse protocol shown above. (B) Normalized tail current vs. depolarization voltage plot for WT Eag1 (black square, n = 6), Eag1TM (green circle, n = 4), and the Eag1/hErg chimera (red triangle, n = 4) with V0.5 values (mean ± sd). Eag1TM did not reach saturation up to 100 mV. (C) Cole-Moore effect of WT Eag1, Eag1TM, and the Eag1/hErg chimera with the voltage-pulse protocol shown above. (D) Plot of normalized current at 10 ms following the depolarization step vs holding potential for WT Eag1 (Cole-Moore I-V plot). The Cole-Moore I-V plot was fit with a Boltzmann function to estimate the holding potential that produces half maximal rates of activation (V0.5CM = −126 ± 0.9 mV, mean ± sd, n = 6).
Figure 3 with 1 supplement
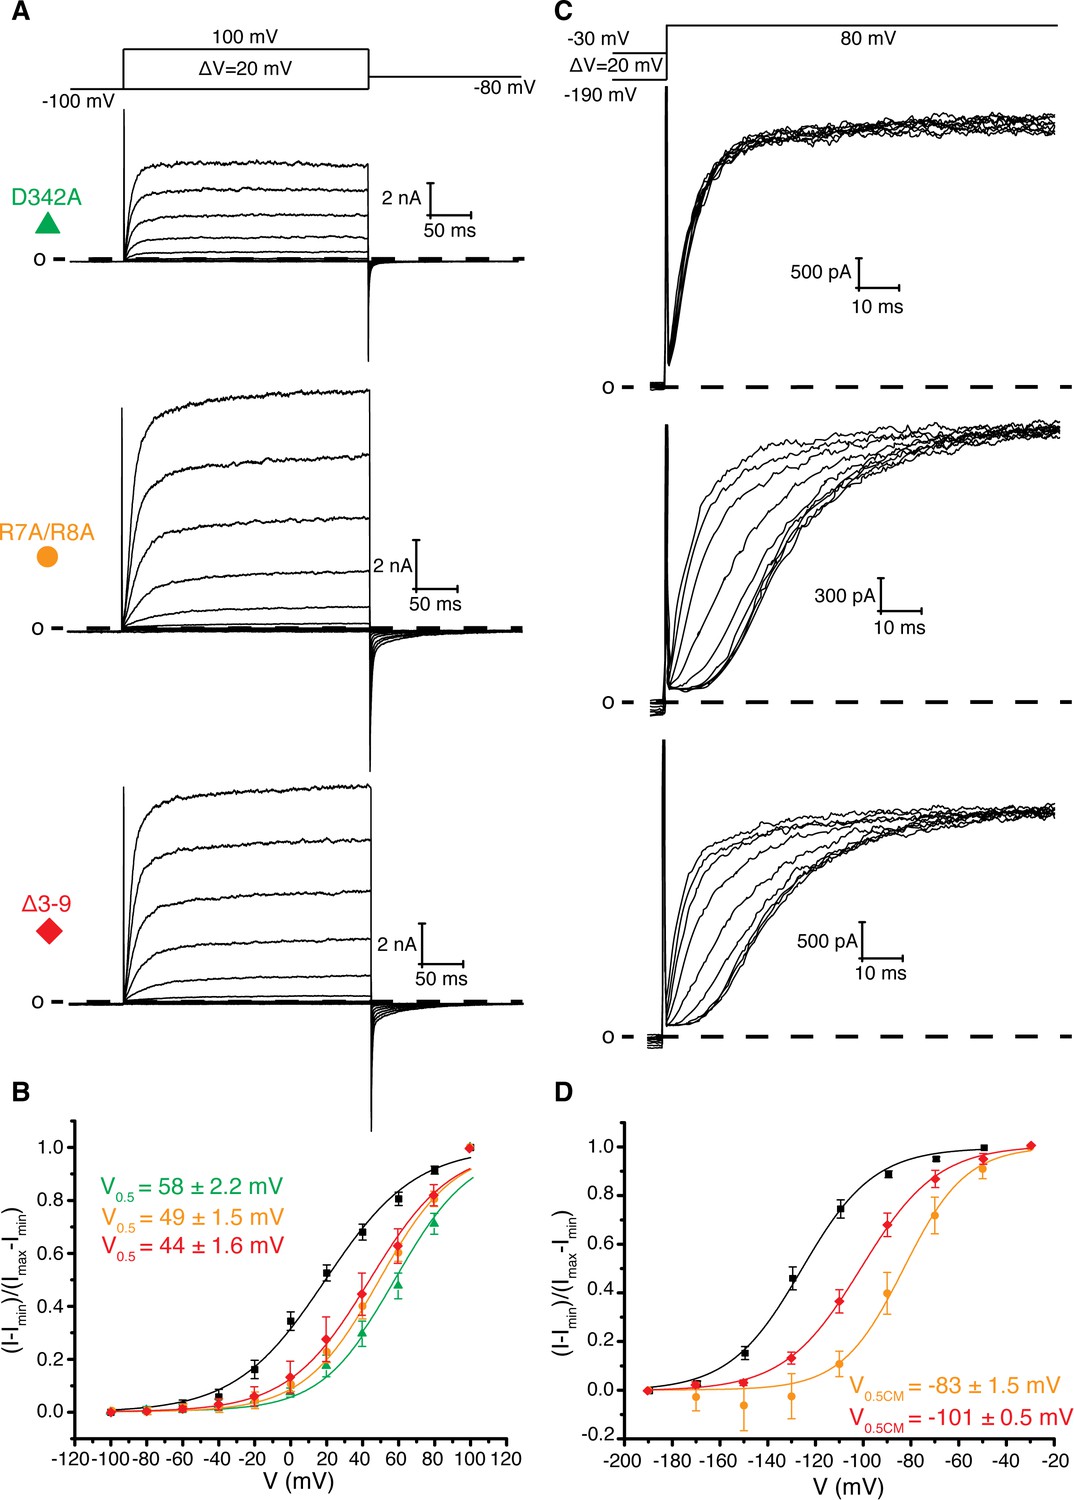
Role of Arg 7, Arg 8, and Asp 342 in voltage dependent gating.
(A) Voltage family current trace for D342A, R7A/R8A, and Δ3–9 with the voltage-pulse protocol shown above. (B) Normalized tail current vs. depolarization voltage plot of WT Eag1 (black square, n = 6), D342A (green triangle, n = 5), R7A/R8A (orange circle, n = 5), and Δ3–9 (red diamond, n = 5) with V0.5 values (mean ± sd). D342A, R7A/R8A, and Δ3–9 did not reach saturation up to 100 mV. (C) Cole-Moore effect of D342A, R7A/R8A, and Δ3–9 with the voltage-pulse protocol shown above. (D) Cole-Moore I-V plot for WT Eag1 (black square, n = 6), R7A/R8A (orange cirlce, n = 5), and Δ3–9 (red diamond, n = 5) with V0.5CM values (mean ± sd).
Figure 3—figure supplement 1

S4-S5 linker mutations.
(A) Voltage family current trace for H343A, Y344A, I345A, E346A, and Y347A with the voltage-pulse protocol shown above. (B) Normalized tail current vs. depolarization voltage plot of WT Eag1 (black square, n = 6), H343A (cyan triangle, n = 4), Y344A (green triangle, n = 5), I345A (red diamond, n = 5), E346A (orange circle, n = 6), and Y347A (blue unfilled square, n = 5) with V0.5 values (mean ± sd). (C) Cole-Moore effect of H343A, Y344A, I345A, E346A, and Y347A with the voltage-pulse protocol shown above. (D) Cole-Moore I-V plot for WT Eag1 (black square, n = 6), H343A (cyan triangle n = 3), Y344A (green triangle, n = 5), I345A (red diamond, n = 4), E346A (orange circle, n = 4), and Y347A (blue unfilled square, n = 5) with V0.5CM values (mean ± sd).
Figure 4 with 1 supplement
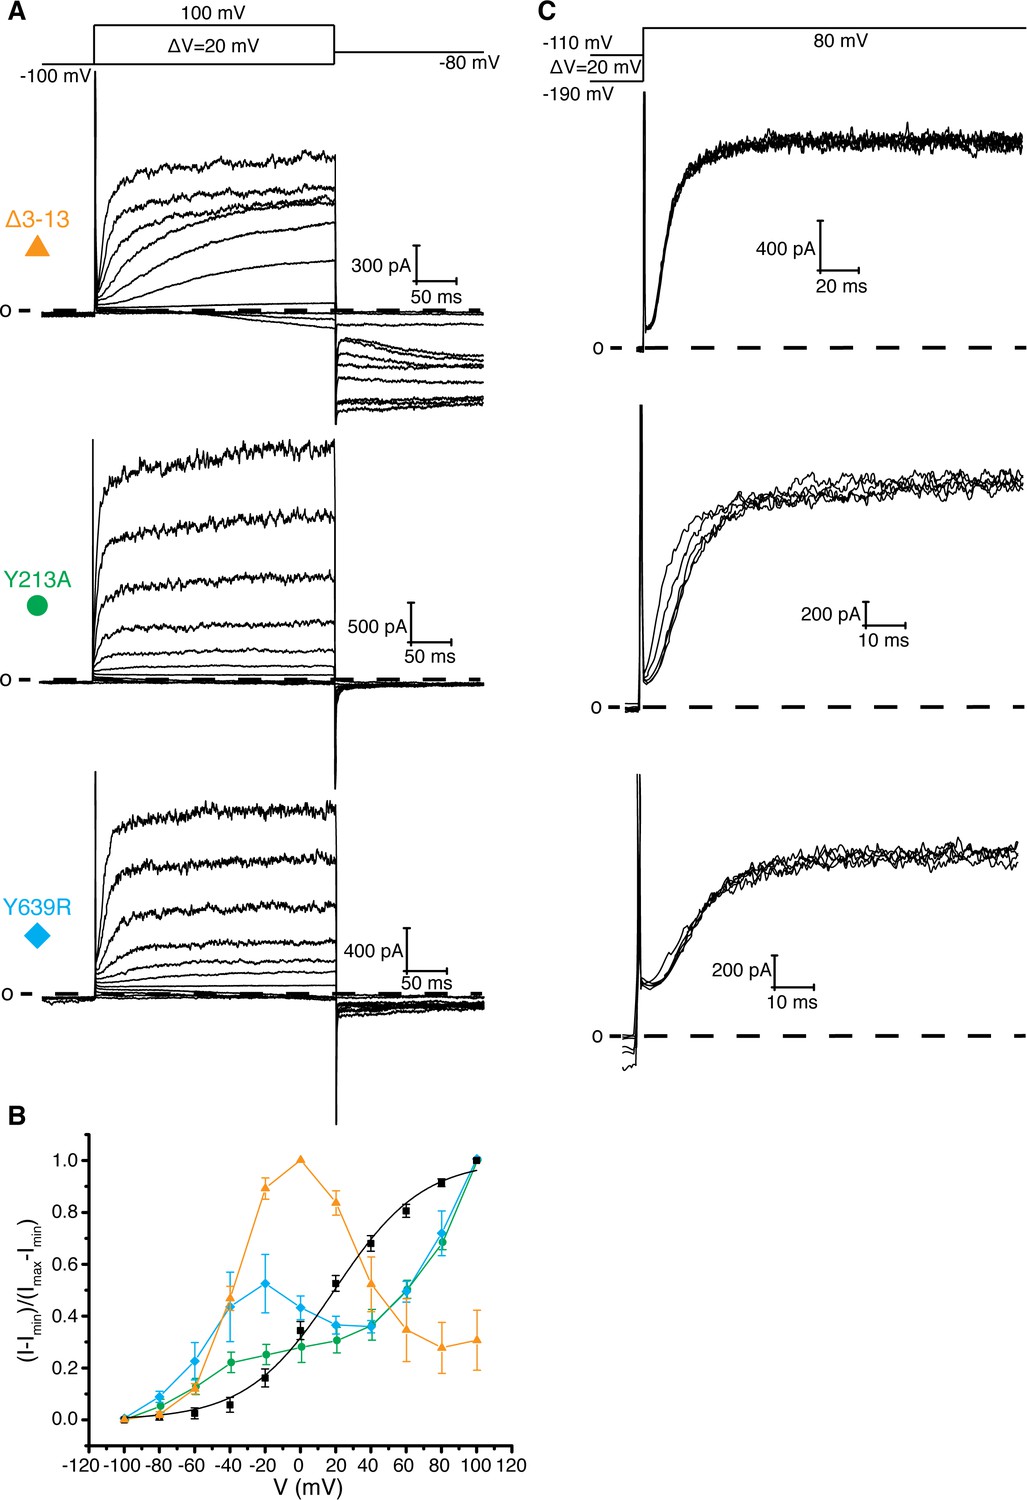
Interaction between residues 10–13, Tyr 213, and Tyr 639.
(A) Voltage family current trace for the Δ3–13, Y213A, and Y639R with the voltage-pulse protocol shown above. (B) Normalized tail current vs. depolarization voltage plot of WT Eag1 (black square, n = 6), Δ3–13 (orange triangle, n = 5), Y213A (green circle, n = 5), and Y639R (cyan diamond, n = 5) (mean ± sd). (C) Cole-Moore effect of Δ3–13, Y213A, and Y639R with the voltage-pulse protocol shown above.
Figure 4—figure supplement 1
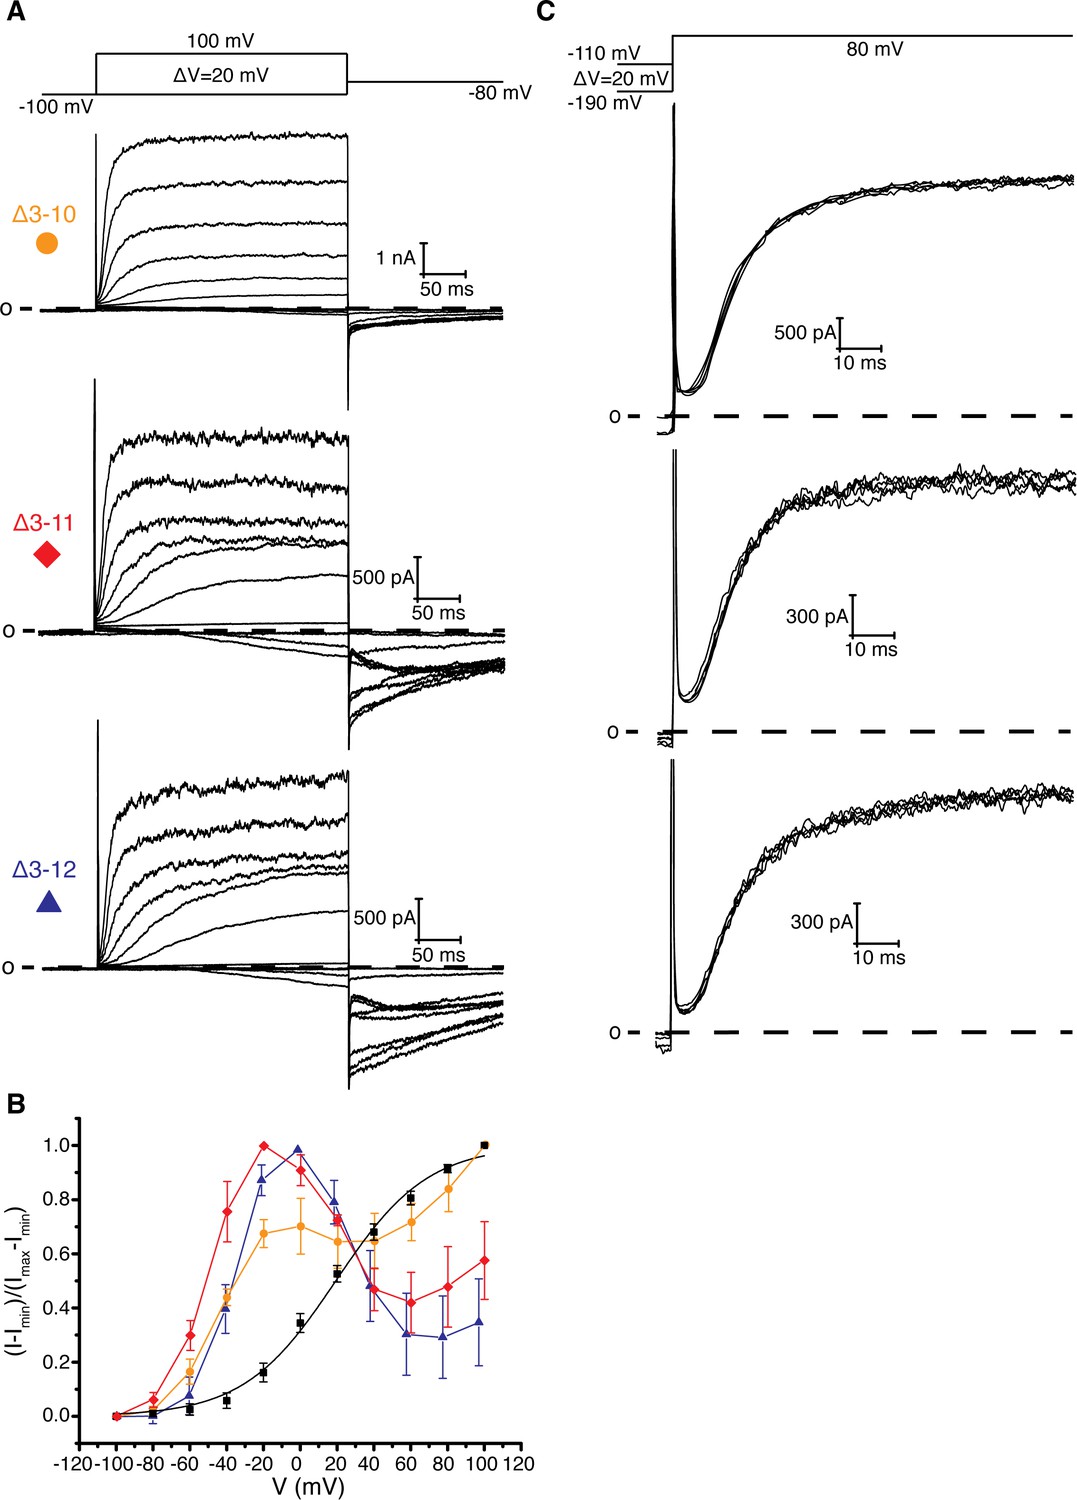
PAS loop deletions.
(A) Voltage family current trace for Δ3–10, Δ3–11, and Δ3–12 with the voltage-pulse protocol shown above. (B) Normalized tail current vs. depolarization voltage plot of WT Eag1 (black square, n = 6), Δ3–10 (orange circle, n = 5), Δ3–11 (red diamond, n = 3), and Δ3–12 (blue triangle, n = 3). (C) Cole-Moore effect of Δ3–10, Δ3–11, and Δ3–12 with the voltage-pulse protocol shown above (mean ± sd).
Figure 5
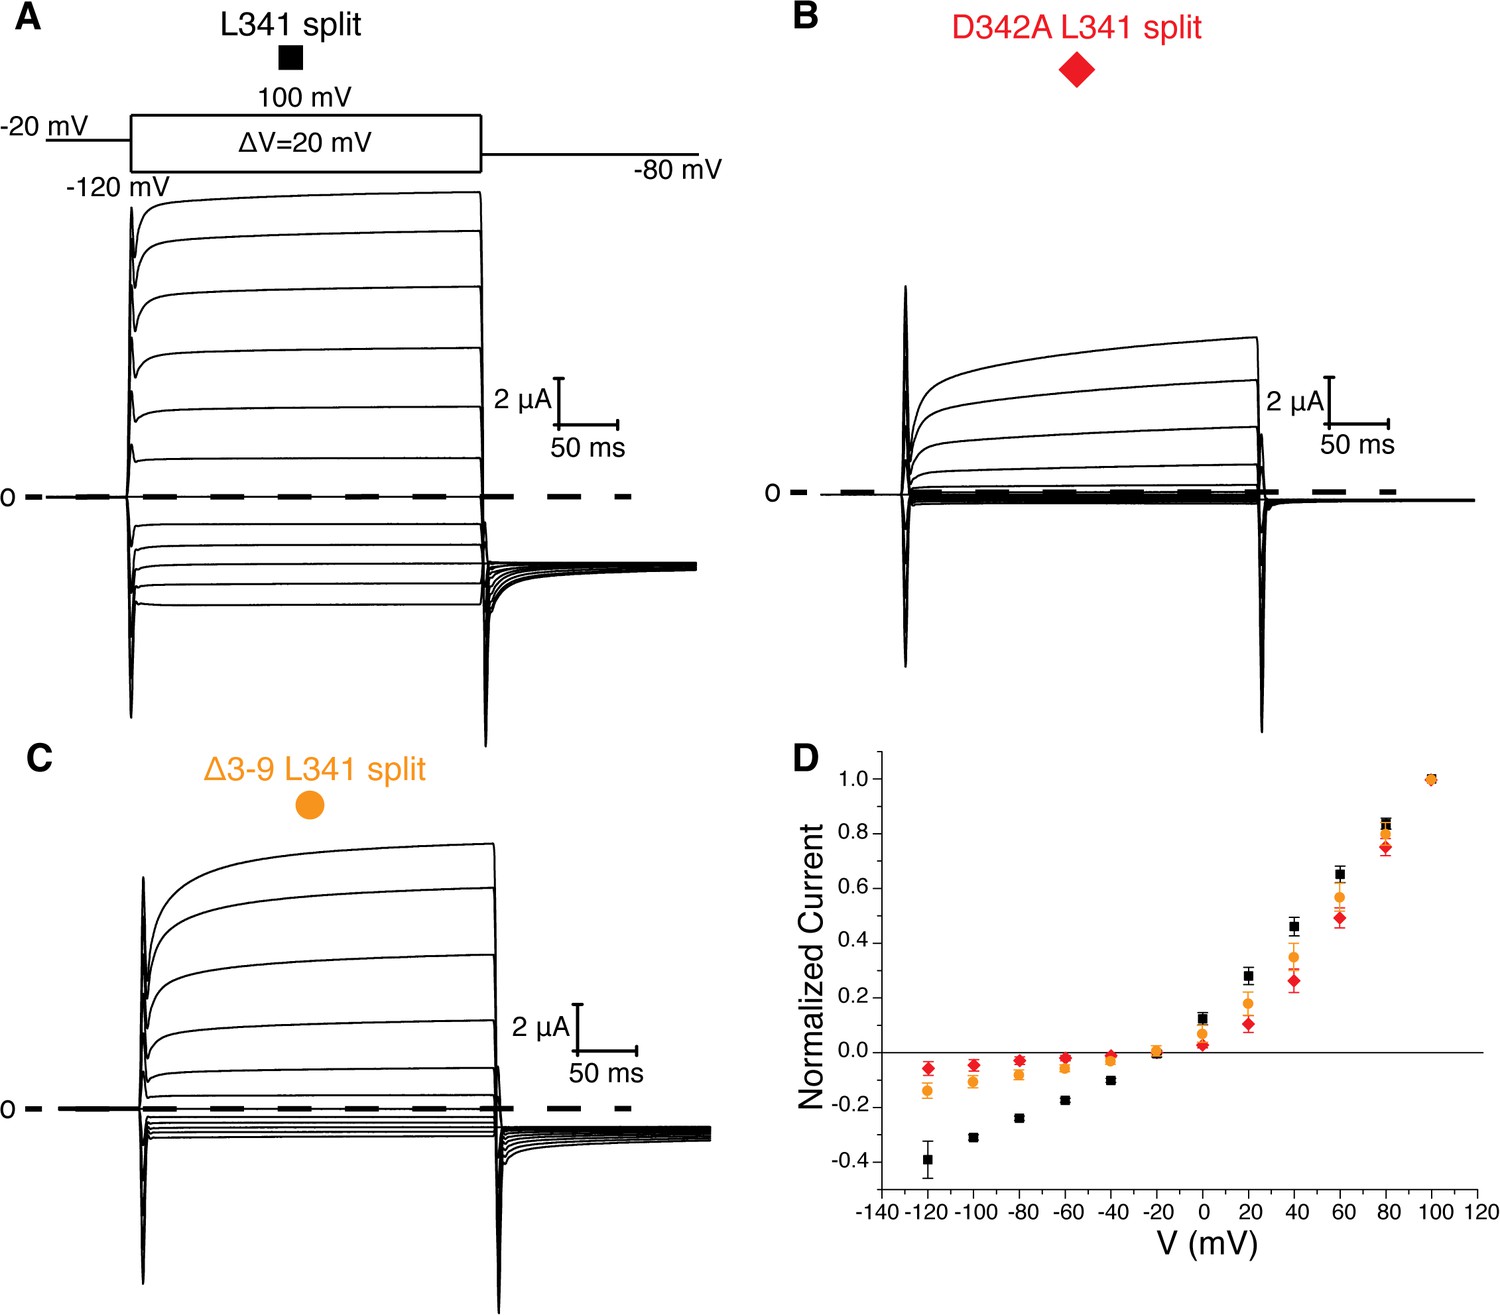
L341 split channels.
Voltage family current trace for the L341 split (A), D342A L341 split (B), and Δ3–9 L341 split (C) with the voltage-pulse protocol shown above. (D) Normalized current vs depolarization voltage for L341 split (black square, n = 11), D342A L341 split (red diamond, n = 7), and Δ3–9 L341 split (orange circle, n = 7) (mean ± sd).
Figure 6 with 4 supplements
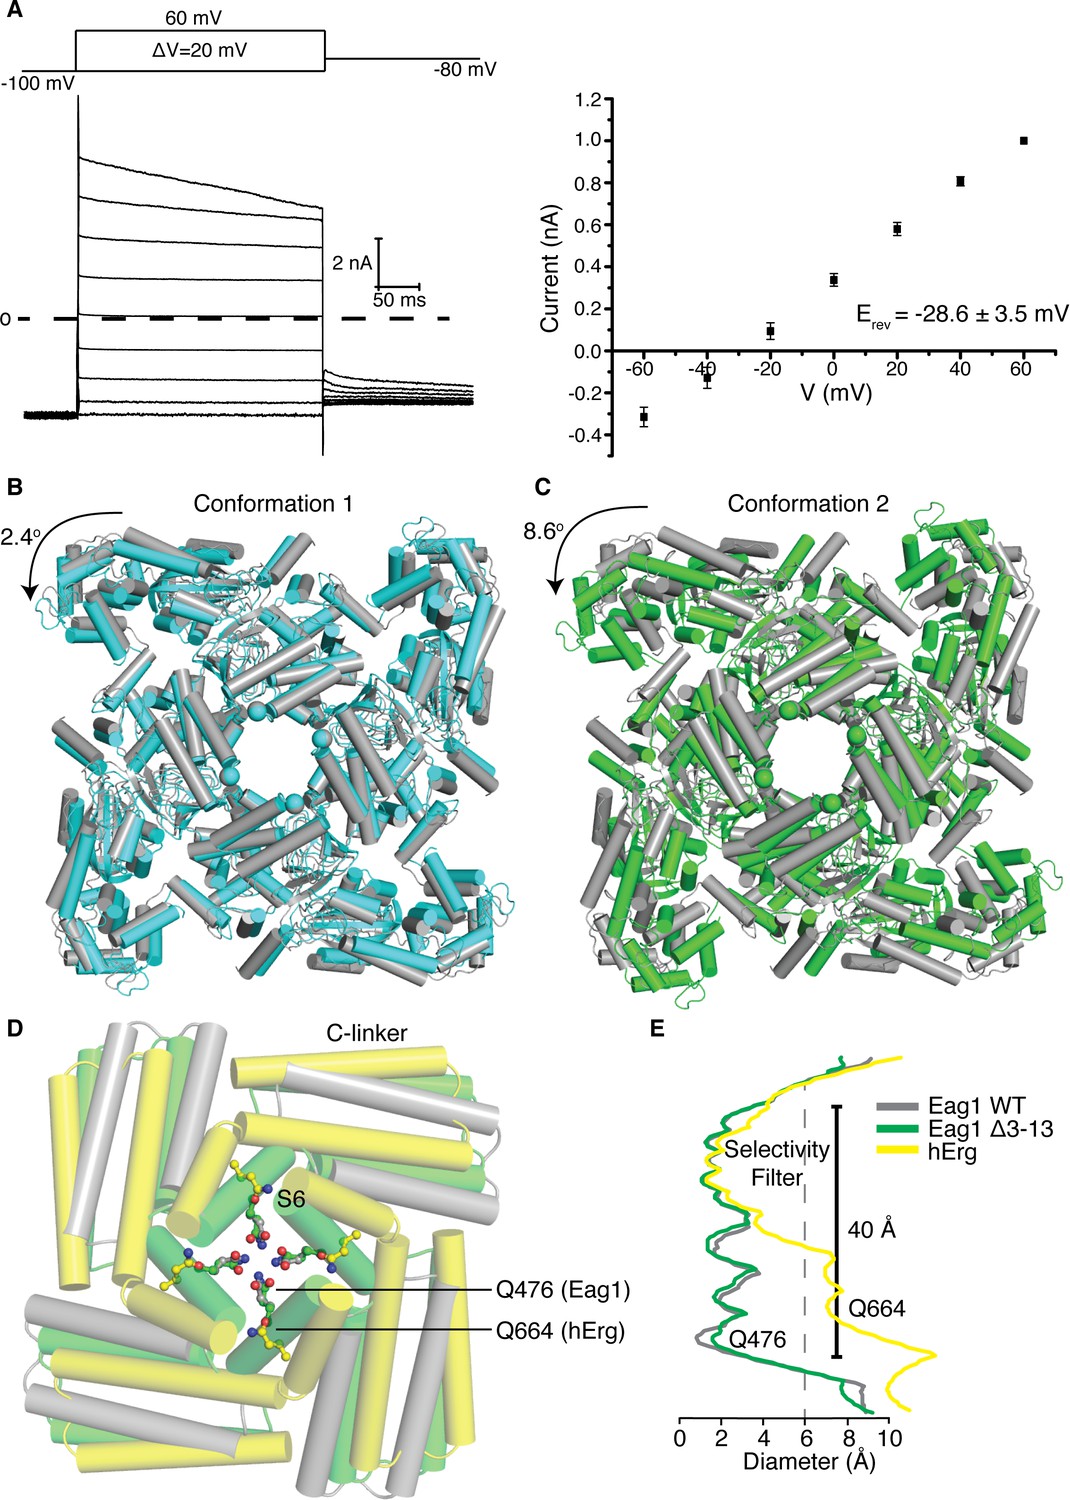
Structure of Eag1 Δ3–13/CaM.
(A) Left, Voltage family current trace for Eag1 Δ3–13 in the presence of 1 mM CaCl2 with the voltage-pulse protocol shown above. Right, normalized current vs depolarization voltage for Eag1 Δ3–13 in the presence of 1 mM CaCl2 (black square, n = 3) with reversal potential (Erev) (mean ± sd). (B) Structural superposition of Eag1 Δ3–13/CaM conformation 1 (cyan) and Eag1/CaM (PDB-5K7L, (gray) using the selectivity filter. Only the intracellular domains are shown from an extracellular view and the location of the S6 helices are indicated with spheres. Degree of rotation is indicated by the arrow. (C) Structural superposition of Eag1 Δ3–13/CaM conformation 2 (green) and Eag1/CaM (gray) using the selectivity filter with the same view as (B). (D) Structural superposition of Eag1 Δ3–13/CaM conformation 2 (green C, red O, blue N), Eag1/CaM (gray C, red O, blue N), and hErg (PDB-5VA2, yellow C, red O, blue N) using the selectivity filter. Location of the intracellular gate Gln (Q476 for Eag1 and Q664 for hErg) are shown as ball and stick. (E) Plot of pore diameter for Eag1 Δ3–13/CaM conformation 2 (green), Eag1 (gray), and hErg (yellow). The location of the selectivity filter and intracellular gate are indicated and the dashed gray line at 6 Å indicates the diameter of hydrated potassium.
Figure 6—figure supplement 1
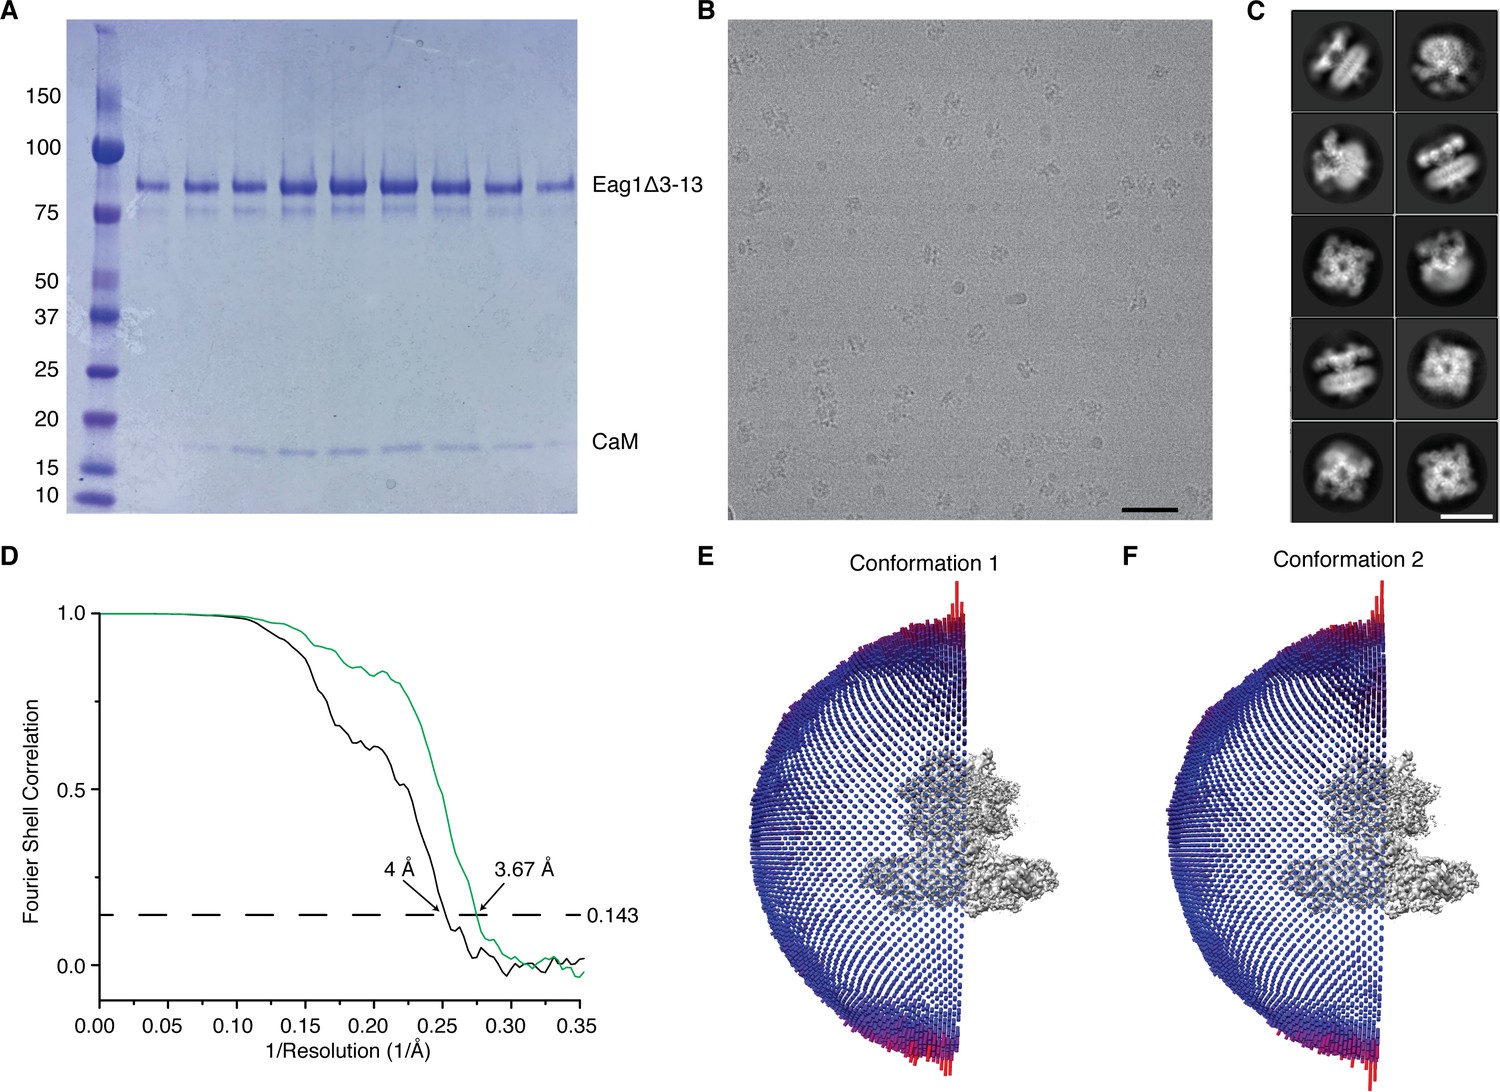
Single-particle cryo-EM structure determination of Eag1 Δ3–13/CaM.
(A) SDS-PAGE gel of fractions from the final gel filtration column of Eag1 Δ3–13/CaM (molecular weight standards are in kDa). (B) Representative micrograph of Eag1 Δ3–13/CaM in vitreous ice (scale bar = 500 Å). (C) Representative class averages from 2D classification (scale bar = 100 Å). (D) Gold standard FSC of conformation 1 (green) and conformation 2 (black) of Eag1 Δ3–13 bound to CaM. The dotted line indicates the 0.143 FSC cutoff which corresponds to the indicated resolutions. Orientation distribution of particles in the final reconstruction of conformation 1 (E) and conformation 2 (F) of Eag1 Δ3–13 bound to CaM. Each column indicates one view and the number of particles in each view is indicated by the size and color of the column (larger columns colored red contain a higher number of particles).
Figure 6—figure supplement 2
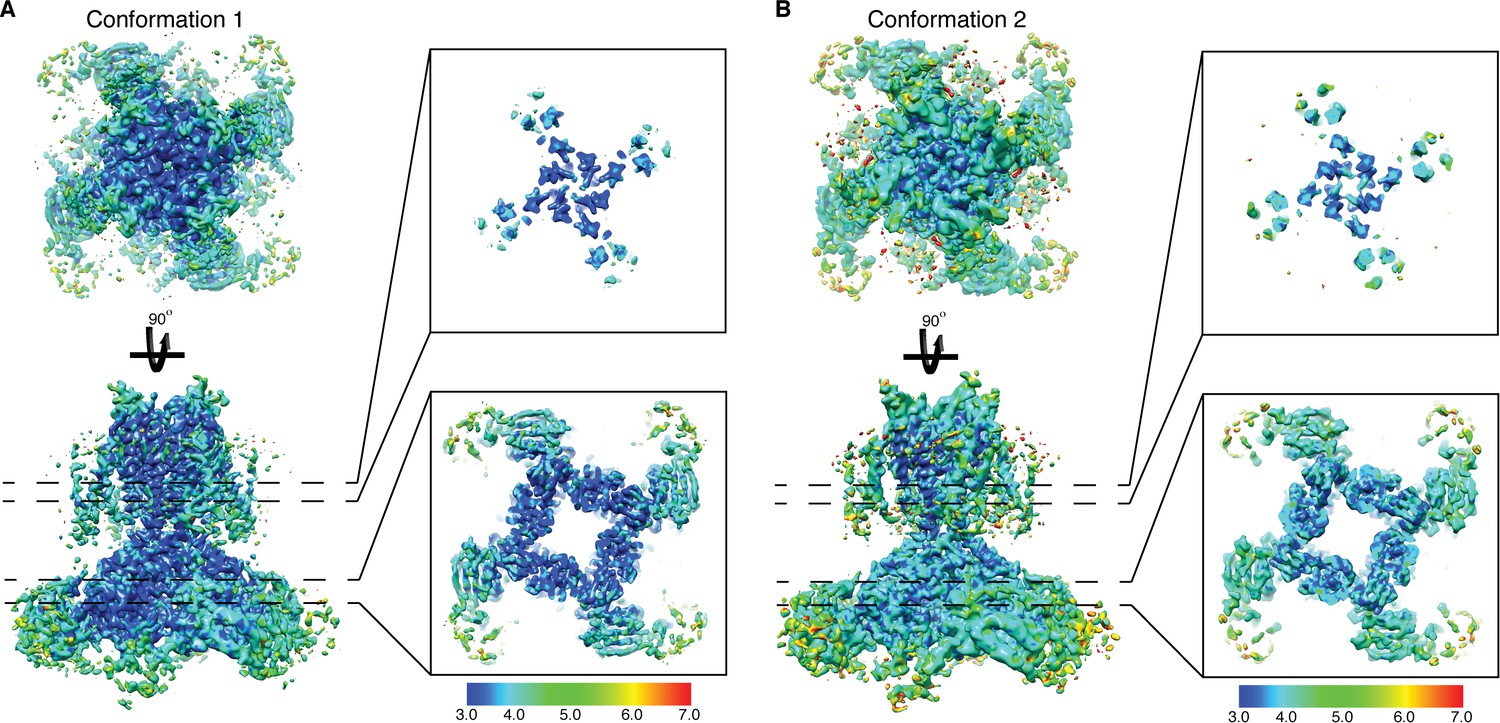
Cryo-EM density map of Eag1 Δ3–13/CaM.
Cryo-EM maps of conformation 1 (A) and conformation 2 (B) colored based on local resolution estimated by ResMap. Slices of the transmembrane domain (top panel) and intracellular domains (bottom panel) colored by local resolution are shown on the right.
Figure 6—figure supplement 3
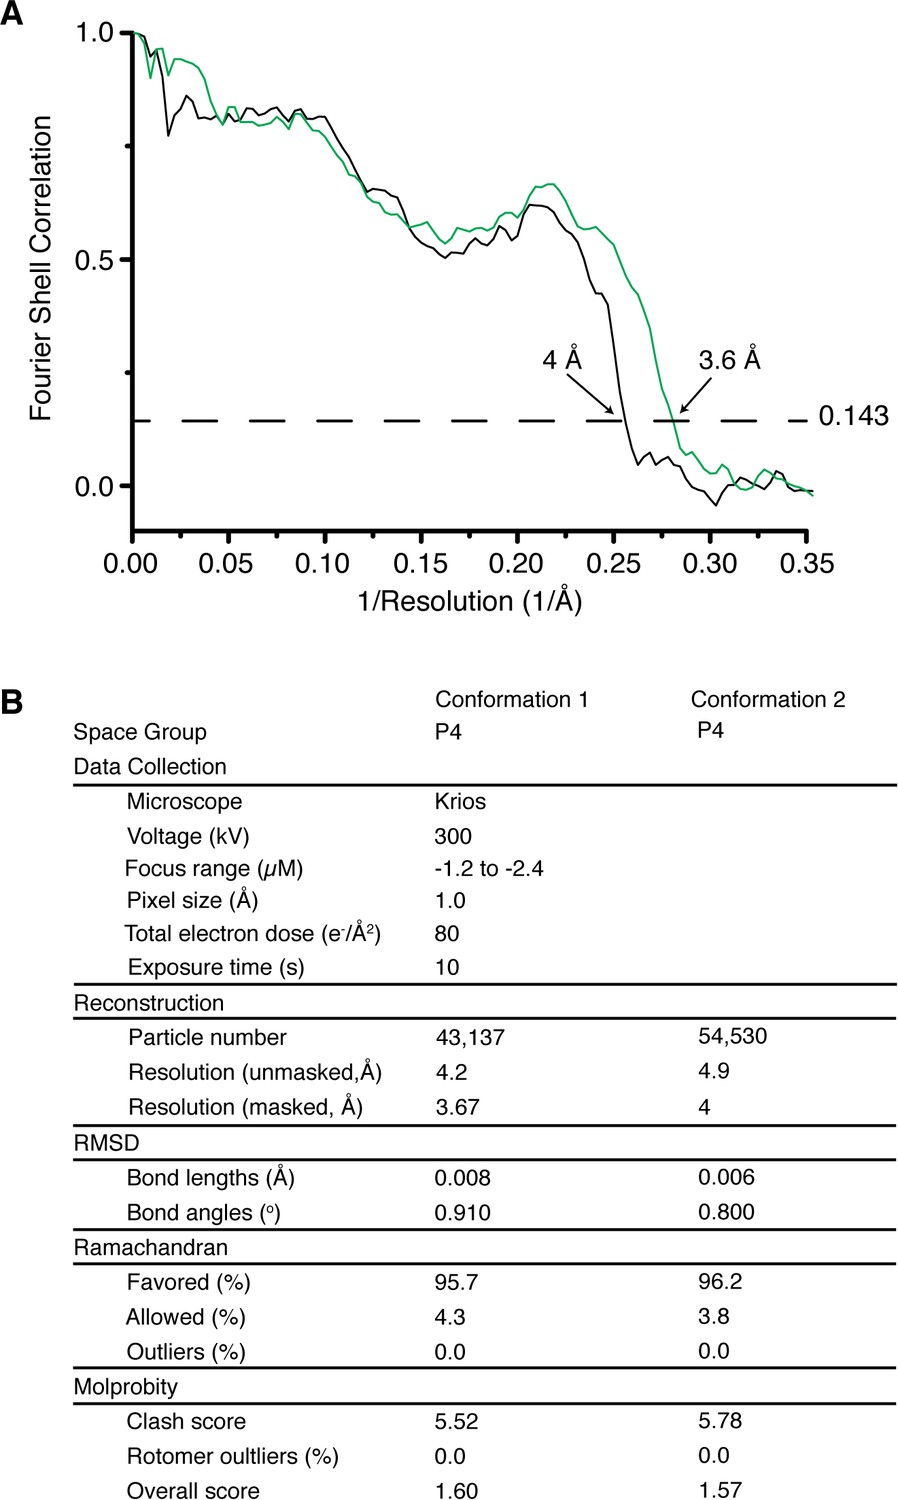
Structure validation of the atomic model of Eag1 Δ3–13/CaM.
( A) FSC cross validation between the Eag1 Δ3–13/CaM model and the full map used for refinement for conformation 1 (green) and conformation 2 (black). (B). Collection parameters and refinement statistics for Eag1 Δ3–13/CaM conformation 1 and 2.
Figure 6—figure supplement 4
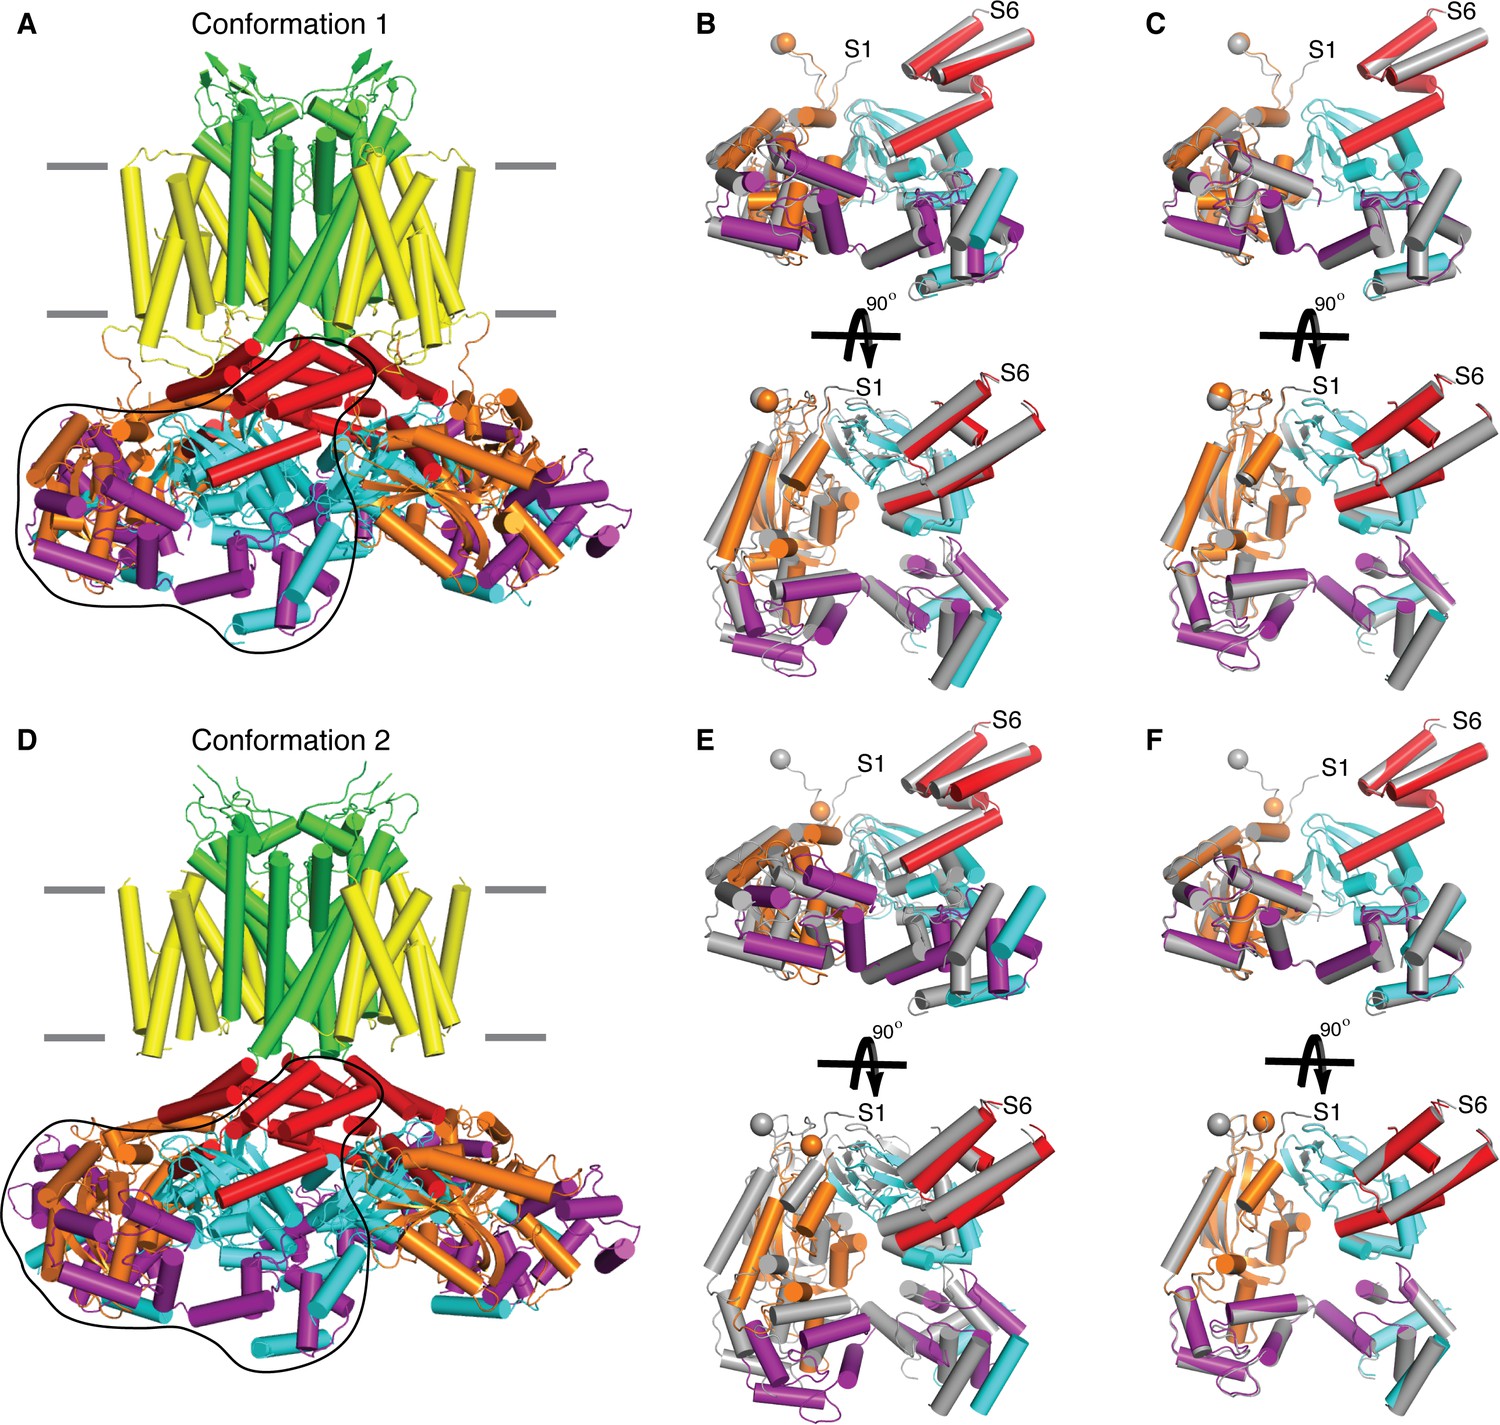
Structural superposition of the intracellular domains.
(A) Side view of conformation 1 of Eag1 Δ3–13 bound to CaM. Position of the membrane is indicated by gray lines and domain coloring is as follows: PAS-orange, VS-yellow, S5-S6-green, C-linker-red, CNBHD-cyan, and CaM-purple. Black trace indicates the subunit shown in (B) and (C). (B) Structural superposition of the intracellular domains of Eag1 Δ3–13/CaM conformation 1 (colored) and Eag1/CaM (PDB-5K7L, gray) using the selectivity filter for alignment. (C) Structural superposition of the intracellular domains of Eag1 Δ3–13/CaM conformation 1 (colored) and Eag1/CaM (gray) using the intracellular domains for alignment. (D) Side view of conformation 2 of Eag1 Δ3–13 bound to CaM. Position of the membrane is indicated by gray lines and domain coloring is the same as in (A). Black trace indicates the subunit shown in (E) and (F). (E) Structural superposition of the intracellular domains of Eag1 Δ3–13/CaM conformation 2 (colored) and Eag1/CaM (gray) using the selectivity filter for alignment. (F) Structural superposition of the intracellular domains of Eag1 Δ3–13/CaM conformation 2 (colored) and Eag1/CaM (gray) using the intracellular domains for alignment.
Figure 7

Eag1 pore mutants.
(A) Phe 475 and Gln 477 (shown as green sticks, with red O, and blue N) are at the interface of the S6 helices (green). C-linker is shown in red. (B) Voltage family current trace for F475I/Q477R and Eag1TM F475I/Q477R with the voltage-pulse protocol shown above. (C) Normalized tail current vs. depolarization voltage plot of WT Eag1 (black square, n = 6), F475I/Q477R (green triangle, n = 7), and Eag1TM F475I/Q477R (red diamond, n = 6) with V0.5 values (mean ± sd). (D) Top, Voltage family current trace for Eag1/hErg chimera F475I/Q477R with the voltage-pulse protocol shown above. Bottom, normalized current vs depolarization voltage for Eag1/hErg chimera F475I/Q477R (black square, n = 5) with reversal potential (Erev) (mean ± sd).
Tables
Key resources table
| Reagent type (species) or resource | Designation | Source or reference | Identifiers | Additional information |
|---|---|---|---|---|
| Gene (Rattus norvegicus) | Kv10.1/Eag1/Kcnh1 | Synthetic | Uniprot: Q63472 | |
| Gene (Homo sapiens) | Calmodulin | Synthetic | Uniprot: P0DP24 | |
| Cell line (Homo sapiens) | HEK293S GnTI- | ATCC | ATCC: CRL-3022 RRID:CVCL_A785 | |
| Cell line (Spodopterafrugiperda) | Sf9 | ATCC | ATCC: CRL-1711 RRID:CVCL_0549 | |
| Cell line (Cricetulus griseus) | Chinese Hamster Ovary cells | Sigma | RRID: CVCL_0213 | |
| Recombinant DNA reagent | pEG Bacmam | doi: https://doi.org/10.1038/nprot.2014.173 | ||
| Recombinant DNA reagent | pGEM-T vector | Promega | Catalog number: A1360 | |
| Software, algorithm | pClampfit 10.5 | Molecular Devices | RRID: SCR_011323 | |
| Software, algorithm | MotionCor2 | doi: 10.1038/nmeth.4193 | RRID: SCR_016499 | http://msg.ucsf.edu/em/software/motioncor2.html |
| Software, algorithm | CTFFIND4 | doi: 10.1016/j.jsb.2015.08.008 | RRID: SCR_016732 | http://grigoriefflab.janelia.org/ctffind4 |
| Software, algorithm | RELION-3 | doi: 10.1016/j.jsb.2012.09.006 | RRID: SCR_016274 | https://www2.mrc-lmb.cam.ac.uk/relion/index.php?title=Main_Page |
| Ssoftware, algorithm | ResMap | doi: 10.1038/nmeth.2727 | http://resmap.sourceforge.net | |
| Software, algorithm | Coot | doi: 10.1107/S0907444910007493 | RRID: SCR_014222 | https://www2.mrc-lmb.cam.ac.uk/personal/pemsley/coot/ |
| Software, algorithm | Phenix | doi: 10.1107/S0907444909052925 | RRID: SCR_014224 | http://phenix-online.org/ |
| Software, algorithm | Pymol | PyMOL Molecular Graphics System, Schrödinger, LLC | RRID: SCR_000305 | http://www.pymol.org/ |
| Software, algorithm | UCSF Chimera | UCSF Resource for Biocomputing, Visualization,and Bioinformatics | RRID: SCR_004097 | http://plato.cgl.ucsf.edu/chimera/ |
| Software, algorithm | HOLE | doi:10.1016/S0263-7855(97)00009-X | http://www.holeprogram.org |
Additional files
-
Transparent reporting form
- https://doi.org/10.7554/eLife.49188.015
Download links
A two-part list of links to download the article, or parts of the article, in various formats.
Downloads (link to download the article as PDF)
Open citations (links to open the citations from this article in various online reference manager services)
Cite this article (links to download the citations from this article in formats compatible with various reference manager tools)
Regulation of Eag1 gating by its intracellular domains
eLife 8:e49188.
https://doi.org/10.7554/eLife.49188


