Calretinin positive neurons form an excitatory amplifier network in the spinal cord dorsal horn
- University of Newcastle, Australia
- Hunter Medical Research Institute (HMRI), Australia
- University of Pittsburgh, United States
- University of Glasgow, United Kingdom
- Hokkaido University School of Medicine, Japan
Figures
Figure 1 with 2 supplements
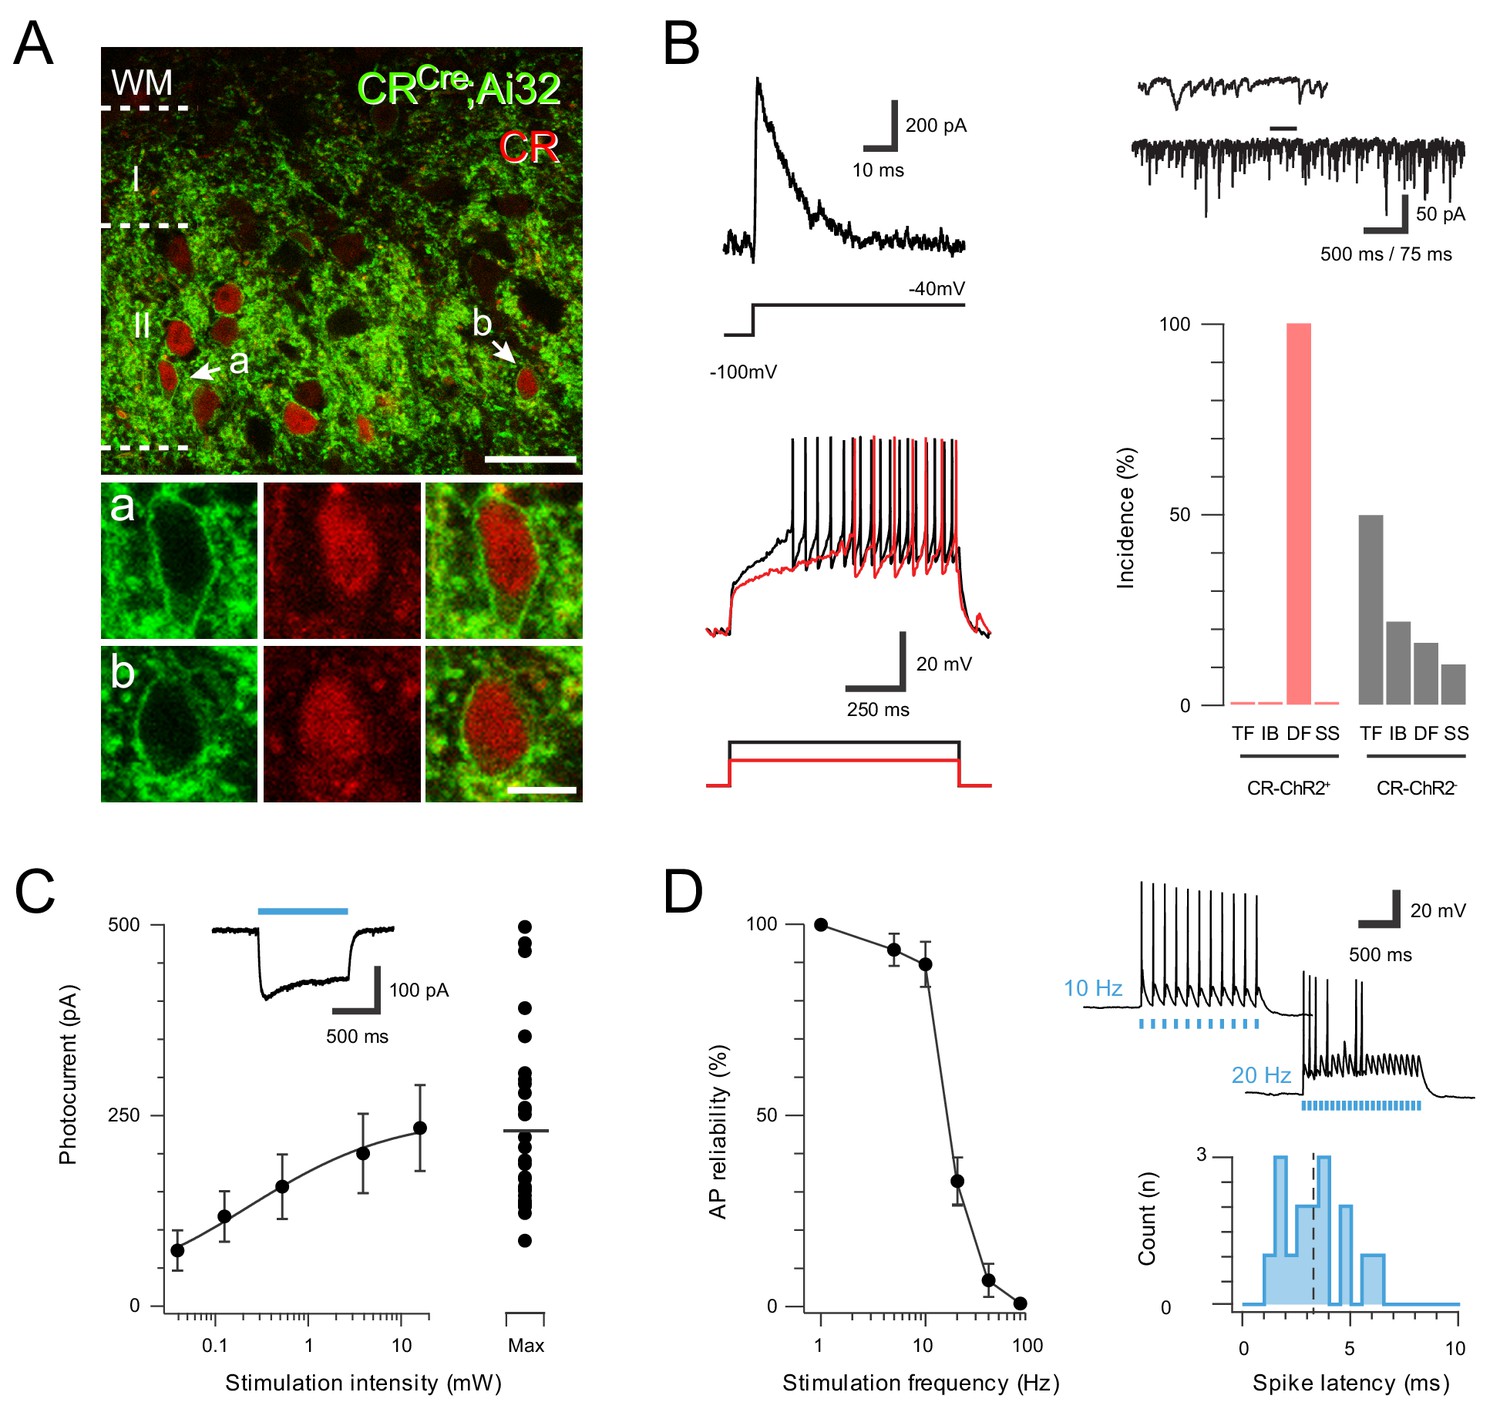
ChR2 expression in Excitatory CR+ neurons.
(A) Upper panel compares ChR2YFP-IR (green) and CR-IR profiles (red). There is a high degree of colocalization in LII (71 ± 2% ChR2YFP-IR neurons express CR-IR, and 78 ± 4% of CR-IR neurons express ChR2YFP-IR). Lower panels show neurons denoted ‘a’ and ‘b’ from upper panel at high magnification; ChR2YFP-IR (left), CR-IR (right), merge (center), scale = 25 μm (upper) and 5 μm (lower). (B) Excitatory CR+ neurons exhibited several characteristic electrophysiological features including the voltage gated potassium current Ia (upper left, protocol below), high frequency spontaneous excitatory drive (upper right), and delayed firing (DF) discharge in response to depolarizing current injection (lower left, current step protocol below). Bar graph (lower, right) highlights the uniform incidence of DF-AP discharge in excitatory CR+ positive neurons (red) when compared to a random sample of CR negative neurons (grey) in the same region (TF = tonic firing, IB = Initial bursting, DF = Delayed firing, SS = Single spiking). (C) Plot shows relationship between photostimulation intensities (0.039–16 mW) and photocurrent amplitude, error bars = SEM. Note maximum photostimulation intensity (16 mW) shows photocurrent data for individual recordings. Inset, example photocurrent response with blue bar indicating photostimulus duration. (D) Plot (left) shows reliability of evoked AP discharge at various photostimulation frequencies. APs were reliably evoked by frequencies up to 10 Hz. Representative traces (upper, right) showing reliable responses at 10 Hz but not 20 Hz photostimulation. Histogram (lower, right) shows the distribution of recruitment latency (time between the onset of photostimulation and the AP response) for CR-ChR2 recordings (dashed line shows mean of 3.2 ms).
Figure 1—figure supplement 1
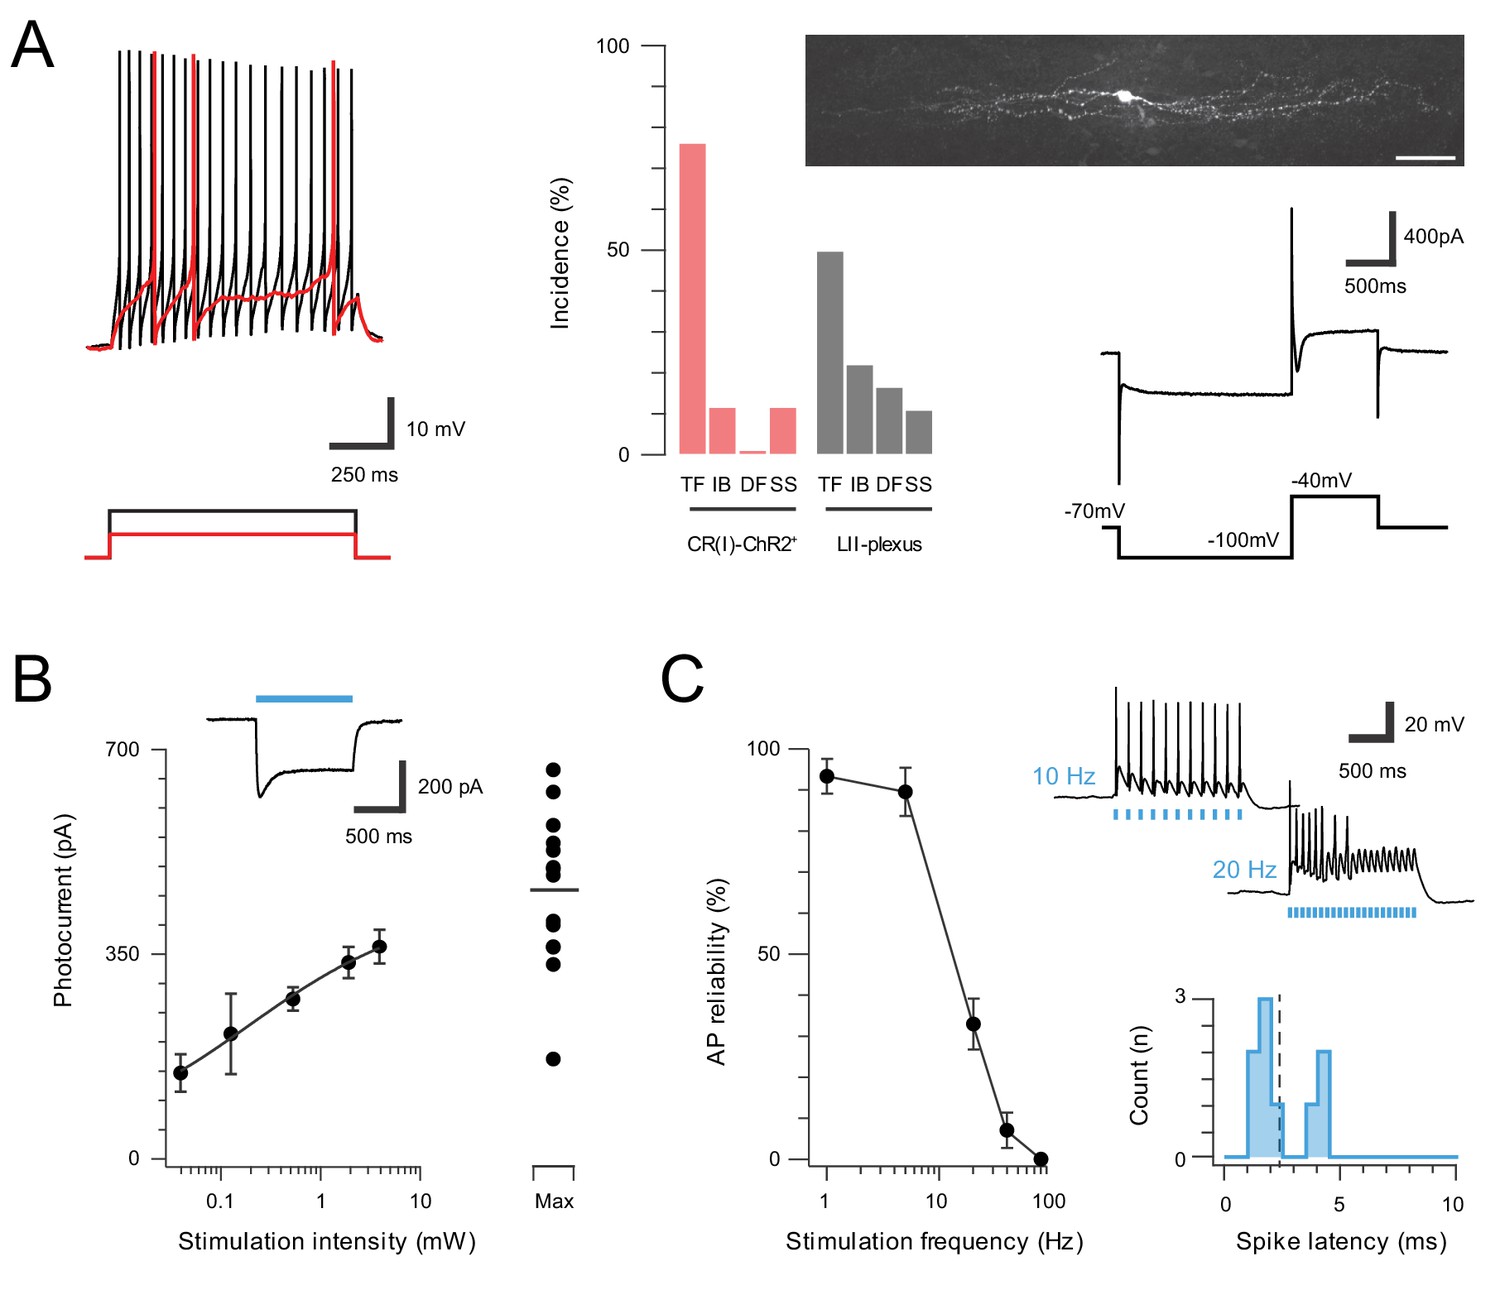
Inhibitory CR neurons express ChR2.
A subset of inhibitory CR+ neurons, identified by extensive rostrocaudal processes, exhibited characteristic electrophysiological features described in previous work (Smith et al., 2015). (A) Most inhibitory CR+ cells responded with a tonic AP discharge. (top left, protocol below). Bar graph (middle) shows elevated incidence of tonic discharge in inhibitory CR+ neurons when compared to a random sample of CR negative neurons (grey) from the same region (TF = tonic firing, IB = Initial bursting, DF = Delayed firing, SS = Single spiking). All neurobiotin-recovered inhibitory CR+ neurons exhibited islet like morphology (upper, right, scale = 20 μm) and expressed the Ih and ICa voltage activated currents (lower right, protocol below). (B), Group data for photocurrent amplitude at different light intensities (0.039–16 mW; error bars = SEM). Inset shows example photocurrent response for a 1 s blue light stimulus, blue bar highlights photostimulus duration. Note, maximum photostimulation intensity (16 mW) shows photocurrent data for individual recordings. (C), Plot (left) shows reliability of evoked AP discharge at various photostimulation frequencies. APs were reliably evoked for stimulation frequencies of up to 10 Hz. Representative traces (upper, right) showing reliable responses at 10 Hz but not 20 Hz photostimulation. Histogram (lower, right) shows the distribution of recruitment latency (time between the onset of photostimulation and the AP response) for CR-ChR2+ recordings (dashed line = mean,2.2 ms).
Figure 1—figure supplement 2
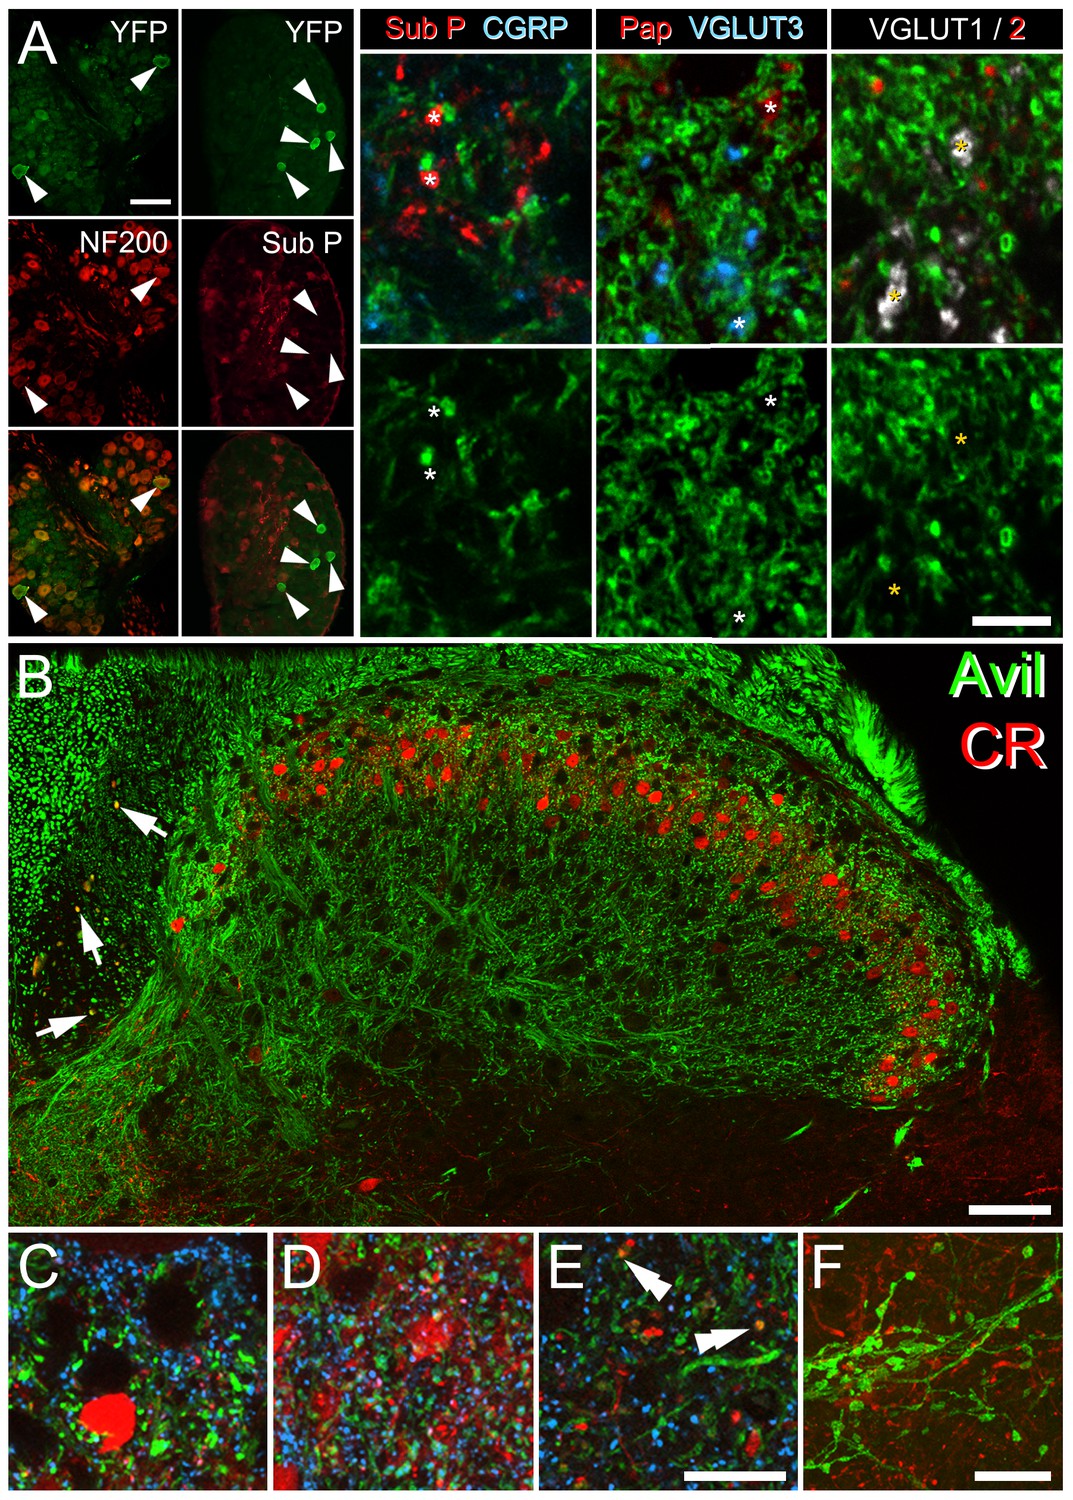
CR and YFP expression in sensory afferents.
(A) In CRCre;Ai32 mice, YFP-labelled cell bodies were only rarely seen in dorsal root ganglia (green; arrowheads). These had large cell diameters (24.5 ± 5.1 µm), were typically enriched in NF200, but did not express substance P (both in red). Closer inspection of YFP expression in laminae I-III of spinal cord sections from these animals showed minimal co-expression of YFP with neurochemically-defined primary afferent populations: YFP expressed in 5 out of 136 terminals immunolabelled for both substance P and CGRP (peptidergic C-fibres), 0 out of 124 terminals immunolabelled for prostatic acid phosphatase (Pap; non-peptidergic C-fibres), 2 out of 178 terminals immunolabelled for VGLUT3 (C-fibre low threshold mechanoreceptors; CLTMRs), and 4 out of 350 terminals immunolabelled for VGLUT1 (myelinated low threshold mechanoreceptors; ALTMRs). Asterisks denote position of peptidergic C-fibres, non-peptidergic C-fibres, CLTMRs and ALTMRs, highlighting the absence of YFP immunolabelling surrounding these profiles. (B) The expression of CR-immunolabelling (red) was also assessed in the central terminals of sensory afferents labelled using spinal cord sections from Advillin-eGFP mice (green). Occasional GFP-labelled axons in the dorsal columns co-expressed immunolabelling for CR (yellow; arrows). (C, D, E) CR- immunolabelling was absent from GFP-labelled axons in laminae I and II outer (C), and IIi-III (D), but often colocalised with VGLUT2 (blue), indicating the presence of CR in the axon terminals of excitatory interneurons. (E) Co-expression of GFP and CR-IR (arrowheads; yellow) was only seen in a small number of axon terminals in the deep medial dorsal horn, lamina V. (F) CR-immunolabelling was absent in GFP-labelled axons in lamina IX. Scale bars (µm); A = 75; B = 50; C-E = 10; F = 20.
Figure 2 with 2 supplements
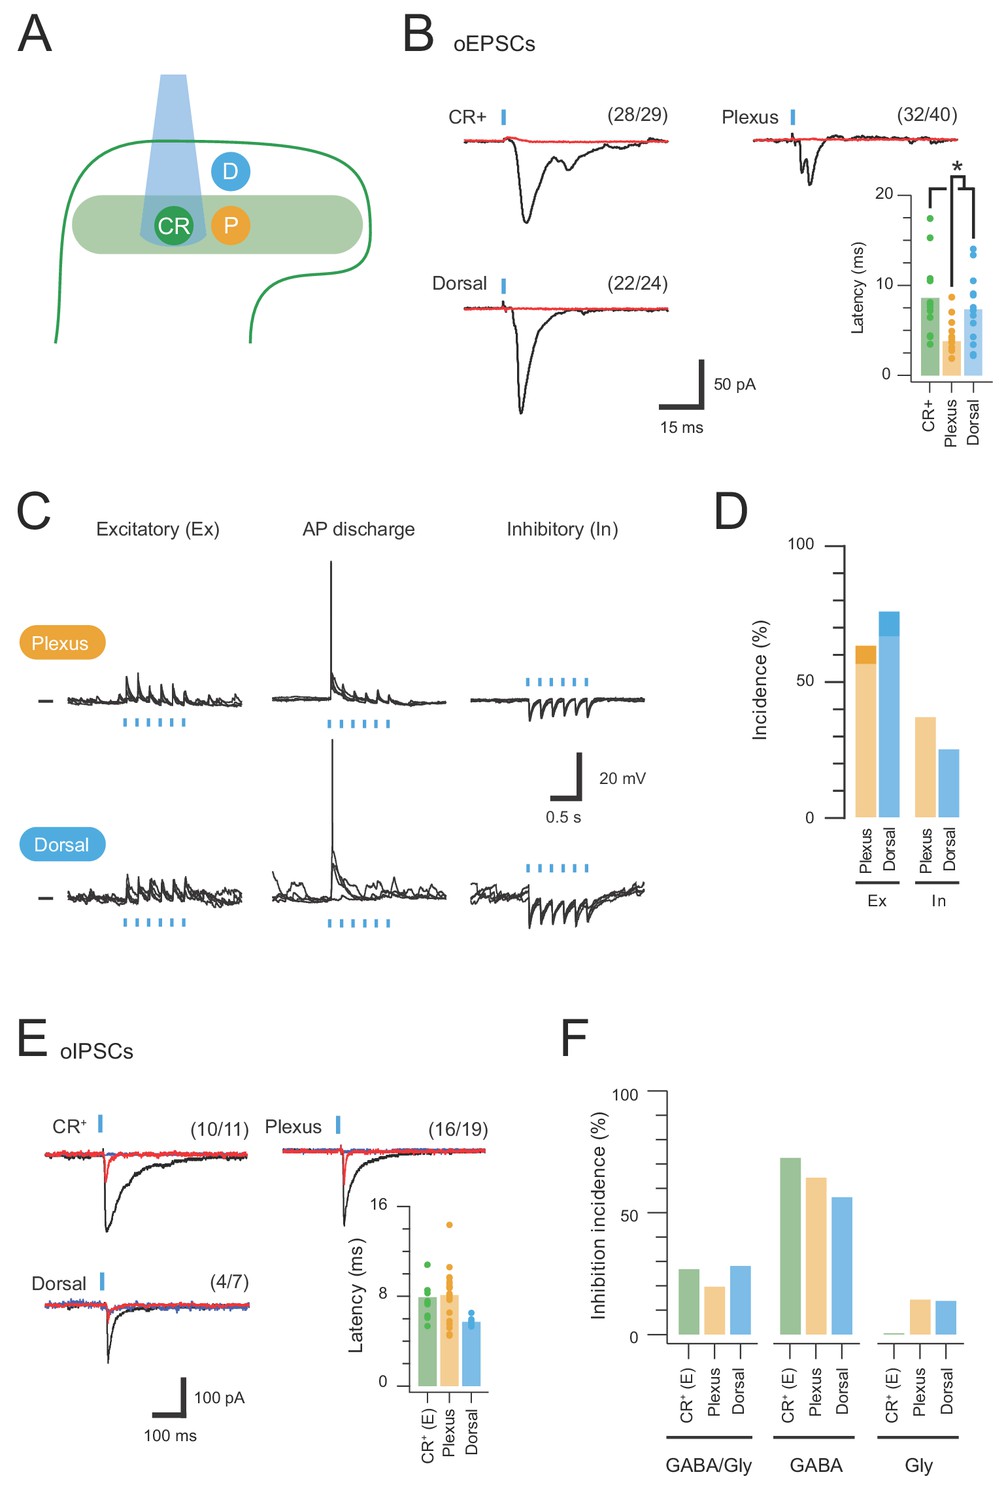
CR-ChR2 neurons provide excitatory drive throughout the DH.
(A) Schematic shows DH populations assessed for CR-ChR2-evoked excitatory input: CR-ChR2+ neuron (green), interneurons (yellow) located within the CR+ plexus (light green shading), and interneurons located dorsal to the CR+ plexus (blue). (B) Photostimulation (16 mW, 1 ms) evoked robust inward currents under voltage clamp in each DH population. Traces show averaged response (black) to photostimulus (blue bar), CNQX (10 μM) abolished all responses (red). Values on each trace show number of recordings that exhibited a light induced inward current. Bar graph shows group data comparing oEPCS latency, which was significantly shorter in interneurons within the CR plexus (p=0.047). (C) Representative traces show responses during photostimulation recorded from interneurons within the CR+ plexus (upper) and dorsal to this region (lower), in current clamp. In some neurons photostimulation only caused subthreshold depolarization (excitatory, left); in others depolarization evoked AP discharge (center), while in some neurons the postsynaptic response during photostimulation was inhibitory in the form of transient membrane hyperpolarisations (right). Photostimulation applied at a membrane potential of −60 mV. (D) Bar graphs show group data on the incidence of photostimulation responses. Darker shading denotes percentage of excitatory responses that cause AP discharge in each group. (E) Traces show averaged optically evoked inhibitory postsynaptic currents (oIPSCs) recorded in response to photostimulation (black trace), and following bath applied bicuculline (10 µM, red trace) and strychnine (1 µM, blue trace), left to right. Bar graph compares the latency of inhibitory responses from photostimulation onset. (F) Photostimulation-evoked inhibitory responses were classed as mixed (GABA/glycine, left), GABA-dominant (middle) or glycine dominant (right) based on bicuculline sensitivity. The incidence of each form of inhibition was similar across the populations assessed.
Figure 2—figure supplement 1
Isolation of excitatory synaptic responses in CR-ChR2+ neurons and photostimulation response latencies.
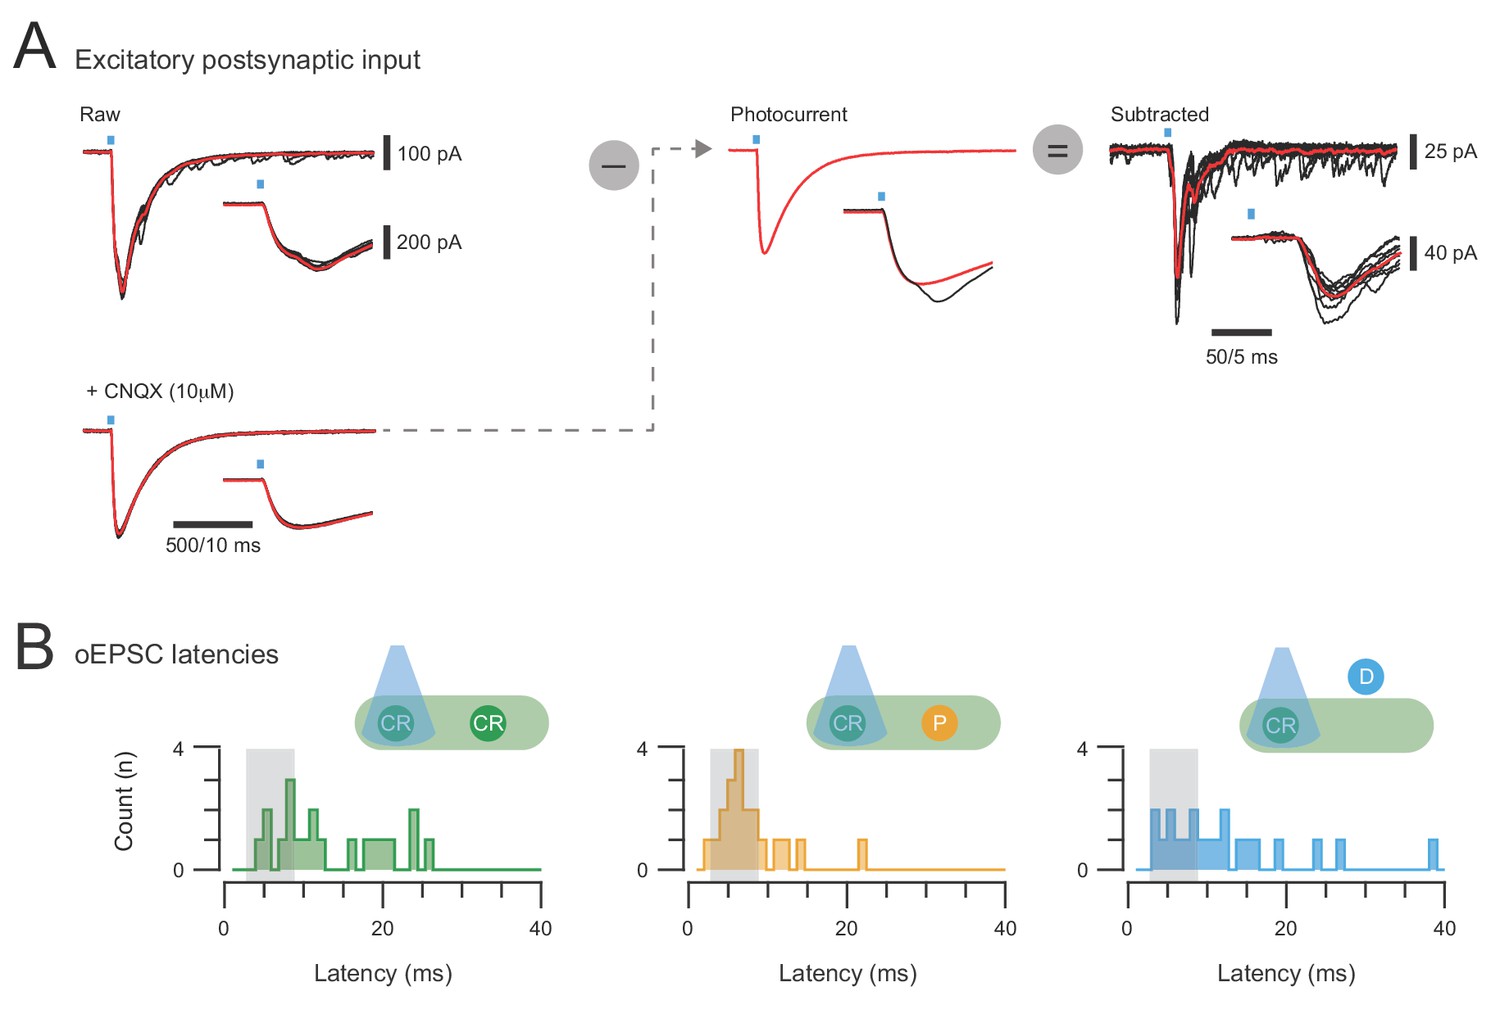
(A) overlaid traces (left) show voltage clamp recordings of excitatory responses (oEPSCs) to 10 photostimulation sweeps (average in red) under baseline conditions (upper) and after bath addition of CNQX (10 μM). Insets show expanded response onset (blue bar highlights photostimulus). Notebaseline response has two components at onset, the photocurrent and a synaptic current, but only thesynaptic component is blocked by CNQX. The averaged photocurrent is isolated, rescaled to match the amplitude in individual baseline traces (middle), and then subtracted to yield isolated synaptic responses (right) to CR-ChR2 photostimulation. (B) the latency of photostimulation oEPSC components were measured and pooled for CR-ChR2 recordings, neurons within the CR+ plexus, and neurons dorsal to this region. Peristimulus histograms plot the onset latency of all synaptic response components for each population (CR+, plexus, and dorsal). Grey box indicates the latency window for putative direct (monosynaptic) inputs. Note a proportion of responses in all populations exhibit oEPSC latencies consistent with direct and indirect excitatory input.
Figure 2—figure supplement 2
Isolation of inhibitory synaptic responses in CR-ChR2+ neurons and photostimulation response latencies.
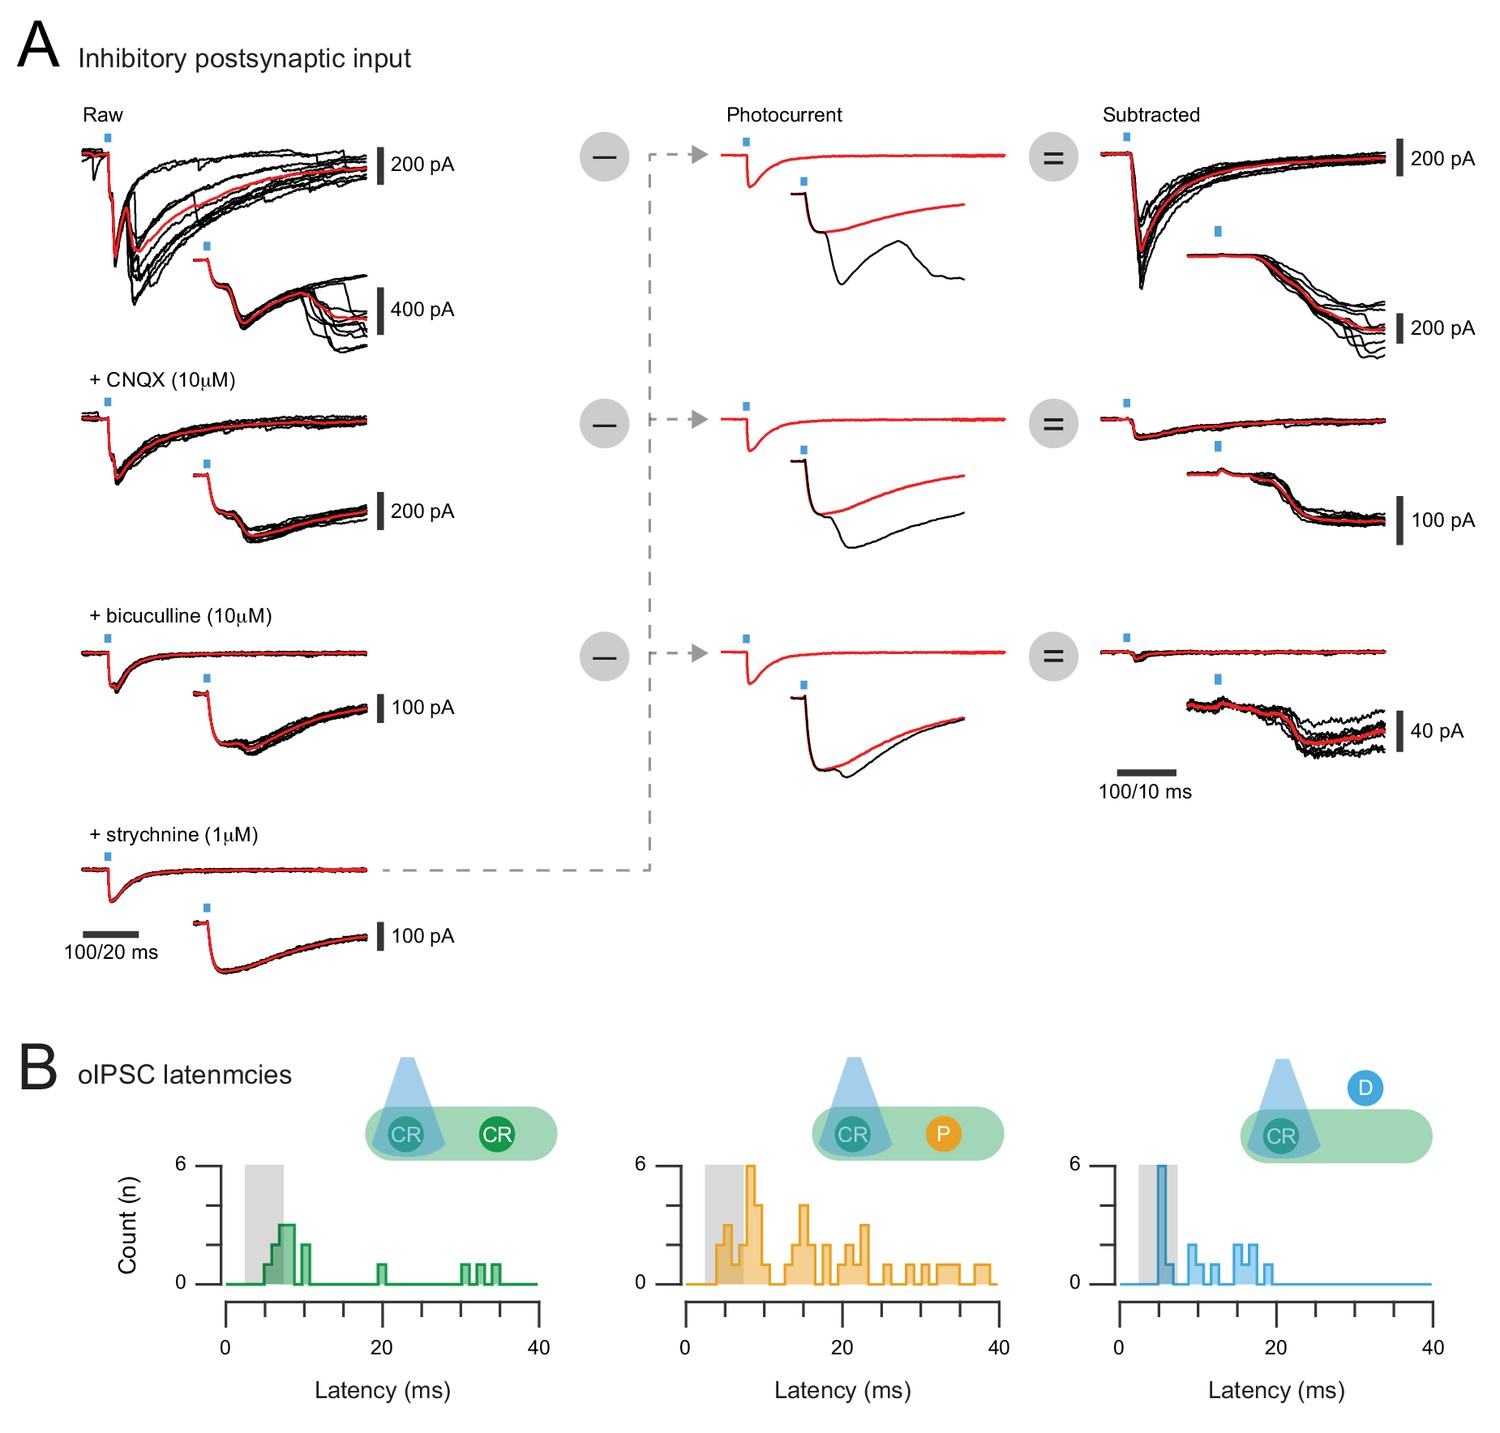
(A) overlaid traces (left) show voltage clamp recordings of inhibitory responses (oIPSCs) to 10 photostimulation sweeps (average in red) under baseline conditions (upper), and after bath addition of CNQX (10 μM), bicuculline (10 μM), and strychnine (1 μM). Note multiple components at onset including both photocurrents and a synaptic current, but CNQX, bicuculline, and strychnine are required to isolate the photocurrent. Photocurrent subtraction is then performed for each drug condition to yield the total inhibitory response with monosynaptic and polysynaptic components (upper), the monosynaptic inhibitory response (middle), and the glycinergic inhibitory response (lower) to CR-ChR2 photostimulation. (B) the latency of photostimulation oIPSC components were measured and pooled for CR-ChR2 recordings, neurons within the CR+ plexus, and neurons dorsal to this region. Peristimulus histograms plot the onset latency of all synaptic response components for each population (CR+, plexus, and dorsal). Grey box indicates the latency window for putative direct (monosynaptic) inputs. Responses from all populations exhibited oIPSC latencies consistent with direct and indirect inhibitory input.
Figure 3
Extended CR-ChR2 photostimlation enhances spontaneous excitatory activity.
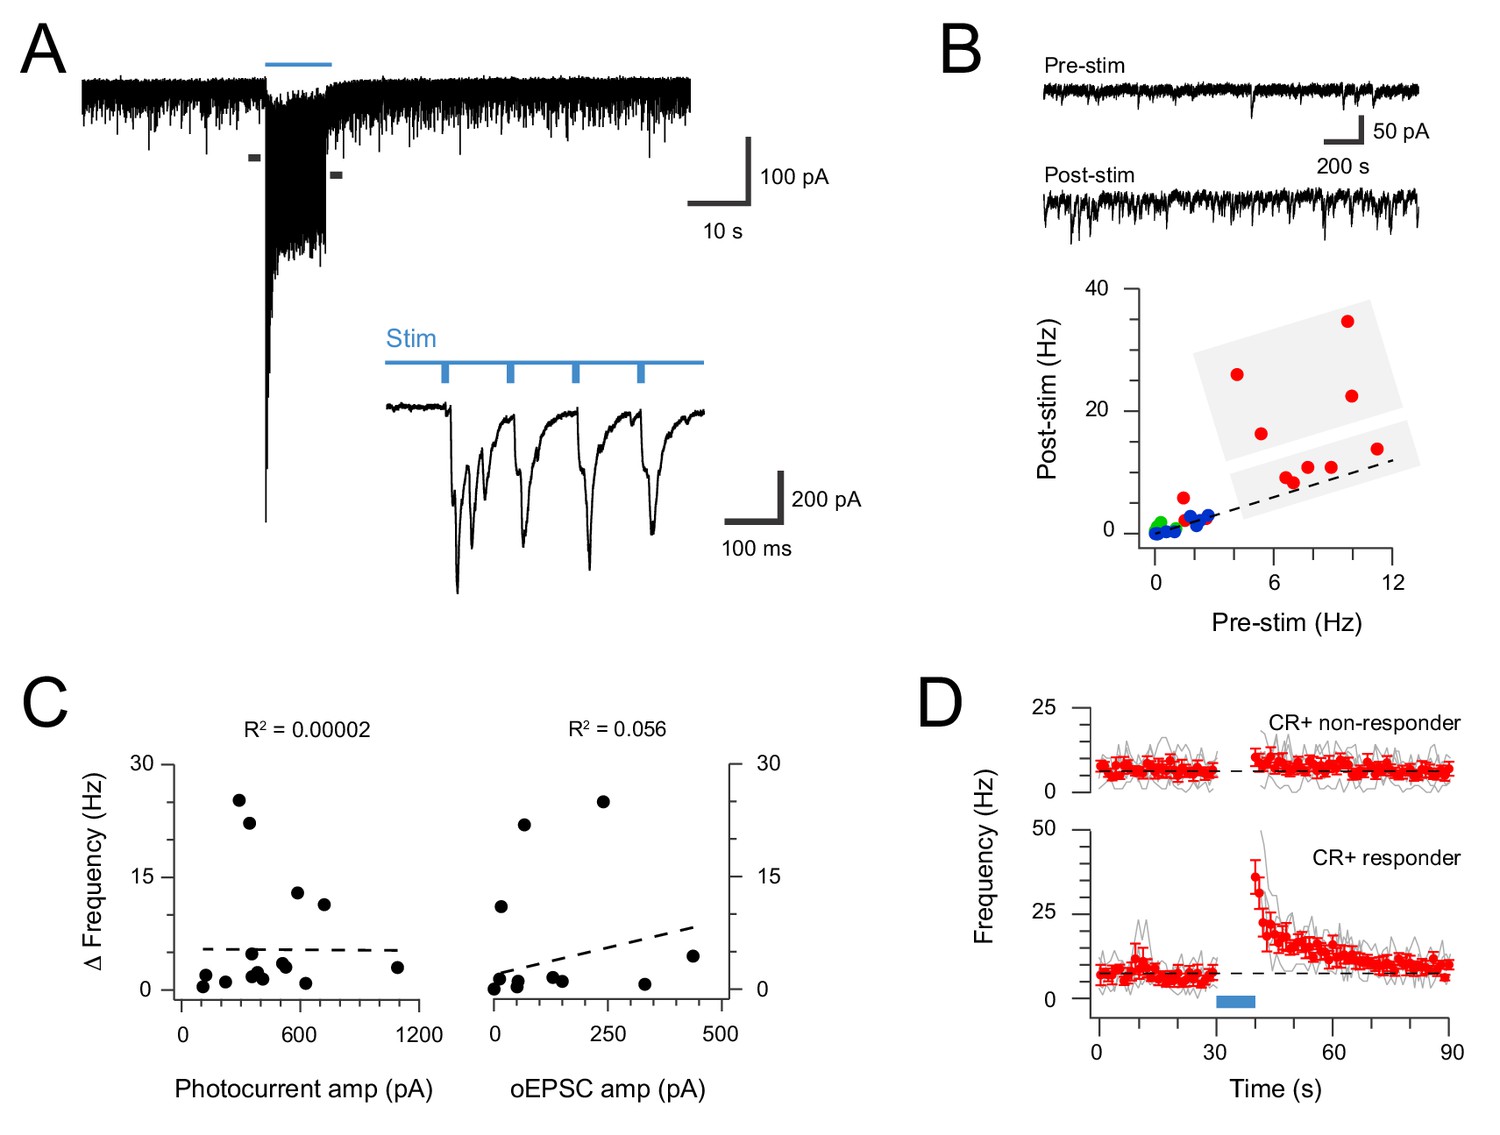
(A) spinal cord slice recordings from a CR-ChR2+ neuron showing spontaneous excitatory postsynaptic currents before, during and following full field photostimulation (blue bar, 16 mW, 10 ms pulses @ 10 Hz, 10 s). Inset shows onset of photostimulation and response on expanded time scale. Note a dramatic increase in sEPSC frequency persists following the photostimulation period. (B) Traces (upper) show 2 s pre and post photostimlation on an expanded timescale from (A). Plot (lower) shows group data comparing sEPSC frequency in the pre- and post-photostimulation (excitatory CR-ChR2 cells = red, inhibitory CR-ChR2 cells = green, unidentified DH cells = blue). Data on or near the unity line (dashed) indicates little change between pre- and post-photostimulation sEPSC frequency, however, four CR-ChR2 cells exhibited a substantial increase in post photostimulation sEPSC frequency (large grey box). (C) Plots compare pre- to post-photostimulation frequency sEPSC (Δ frequency) with photocurrent and photostimulated oEPSC amplitudes (left and right, respectively). There was no correlation between Δ frequency and either property. (D) Plots compare mean sEPSC frequency (red) across photostimulation protocol for CR-ChR2 cells deemed to exhibit a post-photostimulation increase (n = 4, post-photostimulation sEPSC frequency exceeded mean pre-photostimulation sEPSC frequency ±4 SD), and CR-ChR2 cells with a similar baseline sEPSC frequency, but no post-photostimulation change.
Figure 4
CR-ChR2 neuron photostimulation activates multiple DH neuron populations.
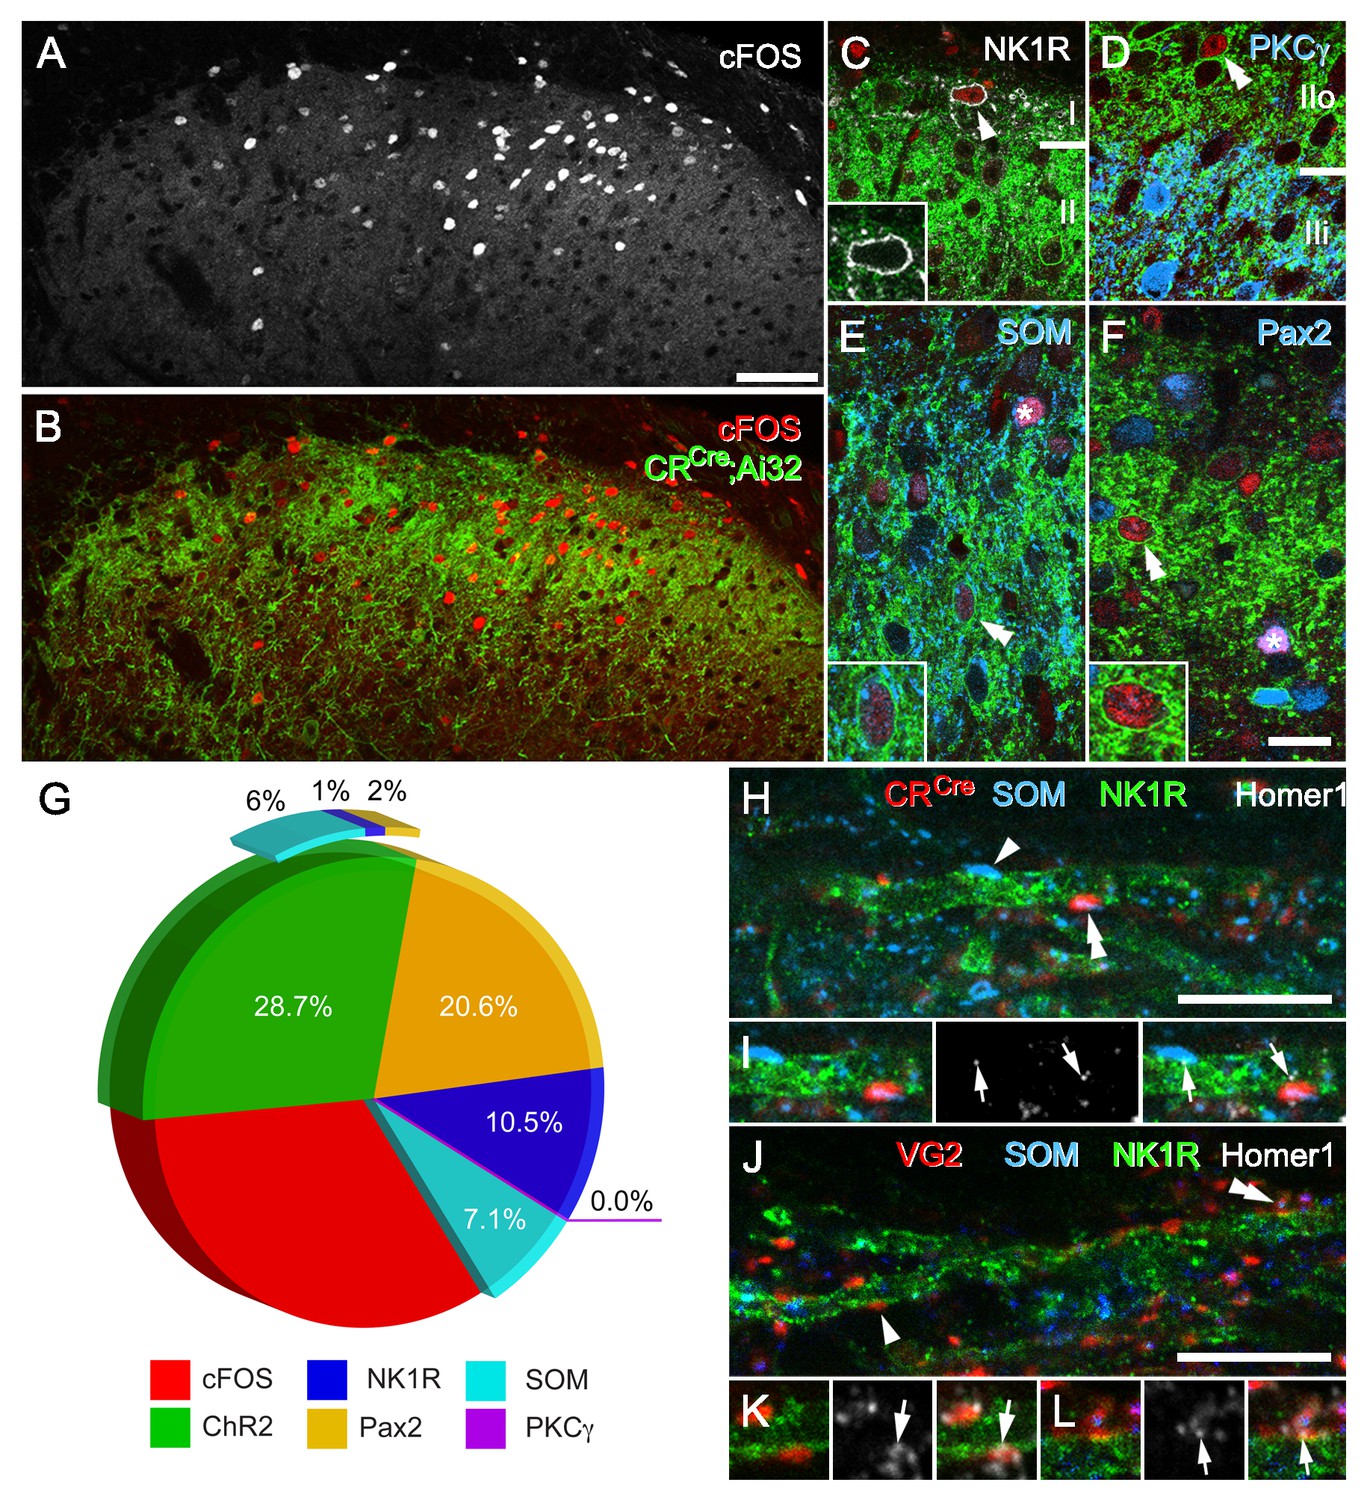
(A) Following photostimulation in a deeply anaesthetized CRCre;Ai32 mouse, robust cFos-IR profiles (white) were detected in laminae I and II primarily. (B) These cFOS-IR cells (red) were restricted to the ipsilateral DH, and largely confined to the CR-ChR2-YFP plexus (green). (C) Lamina I neurons often expressed cFOS, and these were commonly immunolabelled for NK1R (arrowhead; white). In these cells, NK1R-immunolabelling was confined to the cell membrane (inset). (D) Immunolabelling for cFos-IR (red) was often detected in cells that expressed YFP (green; double arrowhead), but not in cells that were immunolabelled for PKCγ (blue). (E) Many cFOS-labelled cells expressed both YFP and SOM (blue) and YFP (double arrowhead and inset), whereas others expressed only SOM (asterisk). (F) Photostimulation induced cFOS expression in Pax2-expressing interneurons (asterisk; blue), with some of these cells also showing immunolabelling for YFP (double arrowhead and inset). (G) Pie graph shows the proportion of photostimulation-evoked cFos expression accounted for by directly activating CR-ChR2 neurons (28.7%), and those populations recruited by CR-ChR2 activity including NK1R+ neurons (10.5%), SOM+ neurons (7.1%), and Pax2+ neurons (20.6%). The remaining fraction (33.1%) are likely to represent unidentified excitatory populations as they did not express Pax-2. (H–I) Most excitatory synaptic inputs on to NK1R-expressing dendrites (green) in lamina I (arrows) were derived from axon terminals immunolabelled for SOM (arrowhead; blue), many of which also originated from CR-expressing cells (double arrowhead; red). Excitatory synaptic inputs on to the dendrites of lamina I NK1R-expressing cells (green) were identified using immunolabelling for Homer 1 (white; arrows). (J–L) Most Homer puncta were directly apposed to axon terminals immunolabelled for VGLUT2 (arrowhead; I; red), many of which also co-expressed SOM (double arrowhead; J; blue). Scale bars (in µm): A, B = 100; C-F = 20; H and J = 10.
Figure 5
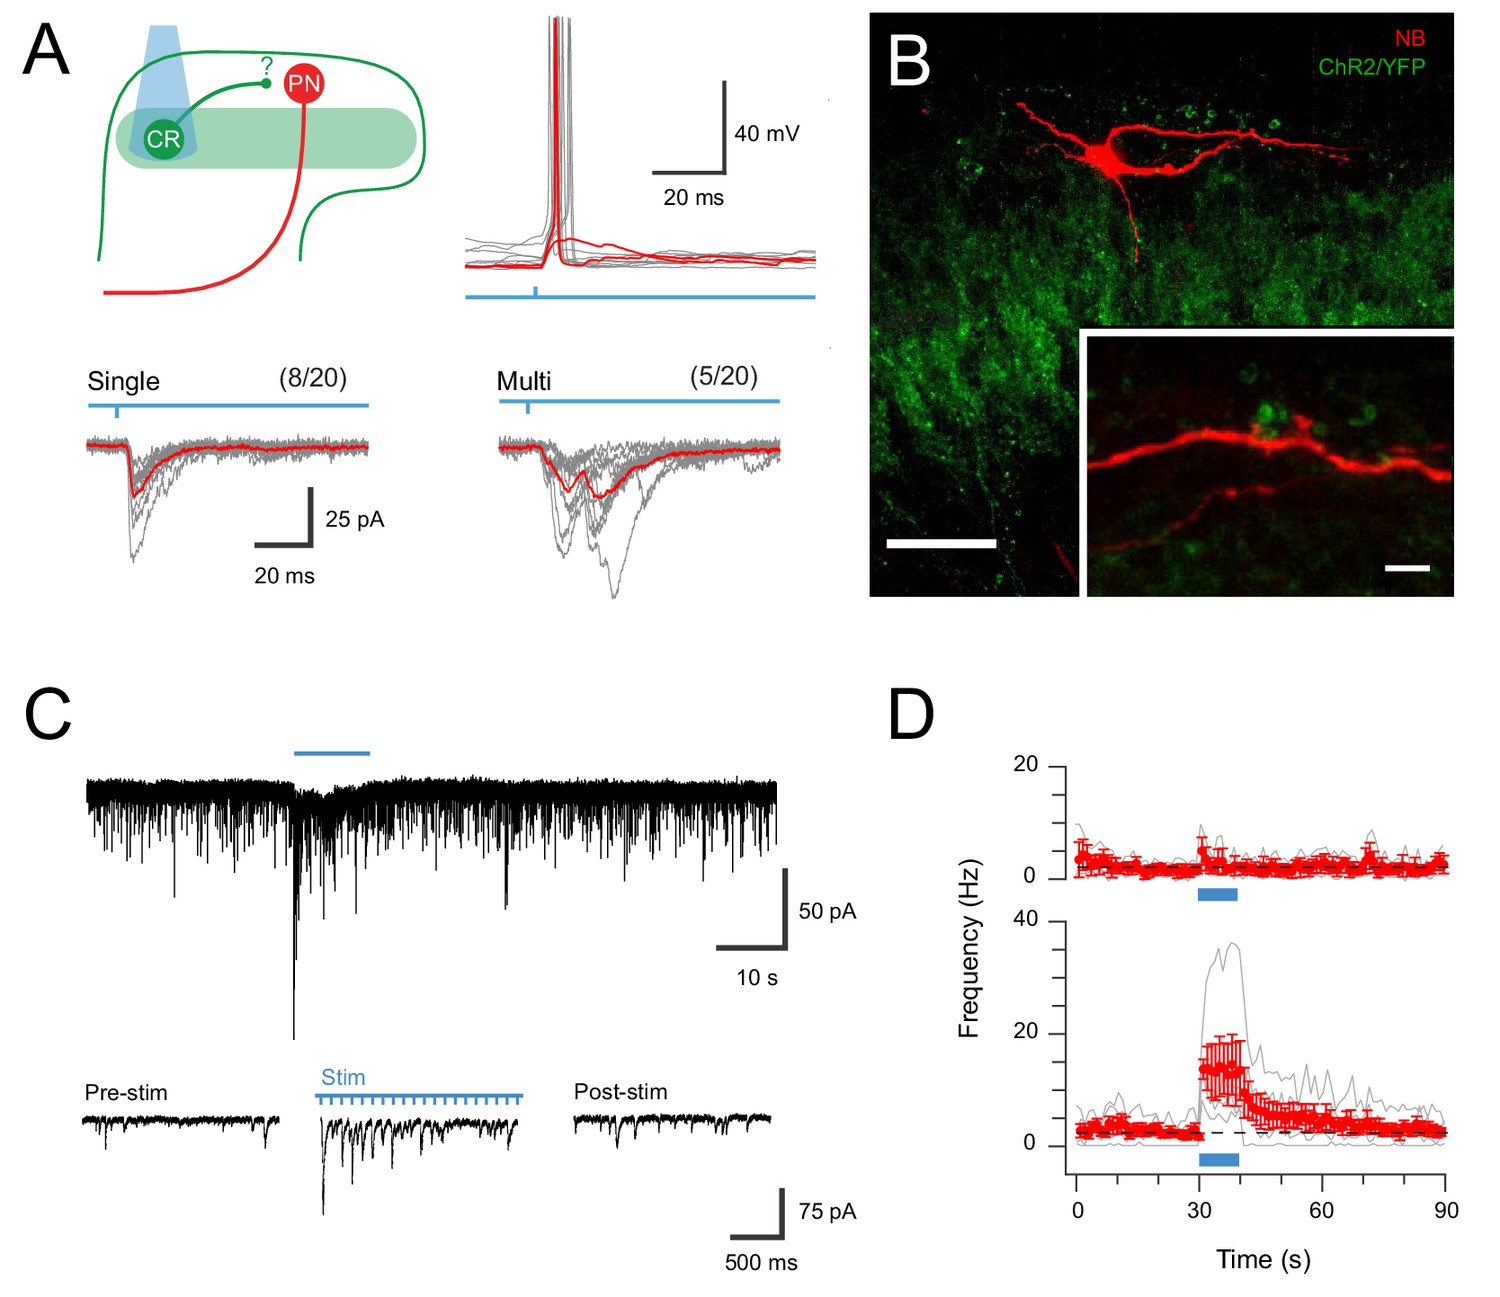
CR-ChR2 neurons provide synaptic input to LI PNs.
(A) Schematic (upper left) shows experimental setup with CR-ChR2 neuron (CR) photostimulation (PS) applied while monitoring retrograde virus labelled projection neuron (PN) activity (n = 20 cells from two animals). Lower traces show example PS evoked inward currents recorded in PNs under voltage clamp. Responses (grey) showed either single (left) or multicomponent responses (right) during PS (blue bar) with the average response overlaid (red). Values above show number of PN recordings that exhibited PS responses. Upper right traces show an example PN recording under current clamp with PS evoked input from CR neurons able to initiate AP discharge in PNs (individual subthreshold and suprathreshold responses in red). (B) Image shows neurobiotin recovered PN (red) relative to expression of YFP/ChR2 in CR neurons (green). High magnification inset shows PN dendrite in close apposition with YFP/ChR2 puncta. Scale bars (in µm): 50; inset 5. (C) Trace shows recording from a PN with EPSCs before, during and following full field PS of CR neurons (blue bar, 16 mW, 10 ms pulses @ 10 Hz, 10 s). Insets below show EPSC activity before, during and following PS on expanded time scale. Note the increase in EPSCs during and following the PS period. (D) Plots compare mean EPSC frequency (red) for PNs deemed to exhibit a significant PS increase (lower, n = 5, EPSC frequency during PS exceeded mean baseline frequency ±4 SD), and PNs with a similar baseline EPSC frequency, but no PS evoked change in activity (upper, n = 3).
Figure 6 with 1 supplement
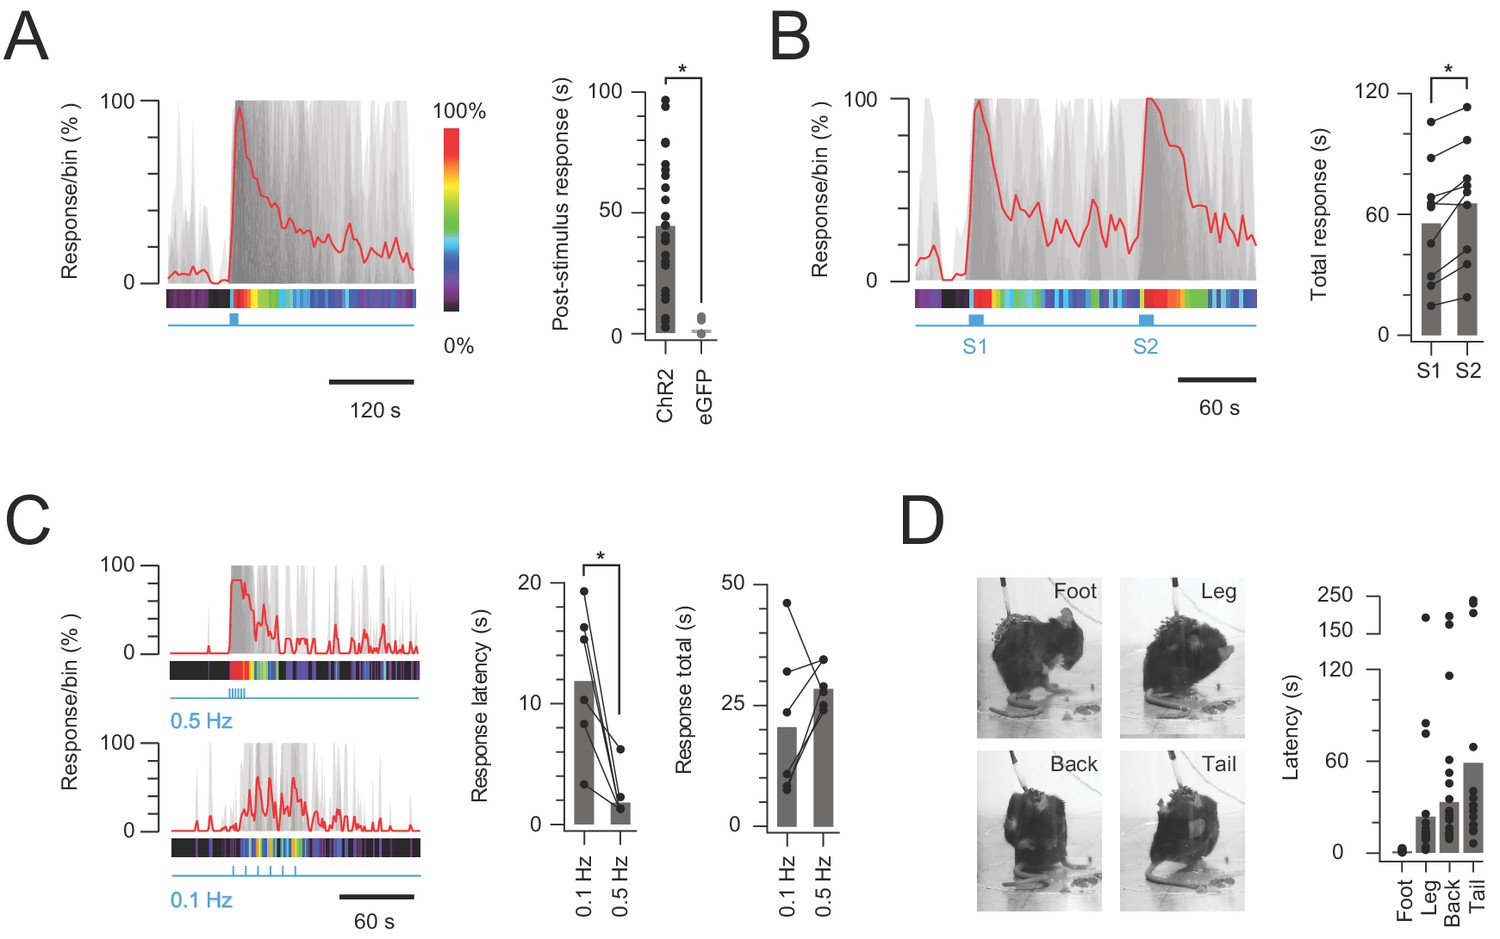
In vivo photostimulation response characteristics.
(A) Left plot shows overlaid peristimulus histograms of photostimulation responses in CR-ChR2 mice (n = 25, grey traces) with response duration binned in 5 s epochs. Mean response is shown in red and converted to a heat bar (bins color coded to percent time groomed (red = 100%, black = 0%). Right plot compares total response duration for CR-ChR2 mice and a control group of CR-eGFP mice (n = 9). Note CR-ChR2 mouse responses varied with an average of 45 s nocifensive behavior outlasting the 10 s photostimulation period. (B) Left plot shows overlaid responses from a subset of animals (n = 6) that received two successive photostimuli, separated by 120 s (10 mW, 10 Hz, 10 s, grey traces). Right plot compares total response duration to initial (S1) and repeat photostimulation (S2) highlighting an average 10 s increase in the second response (p=0.005). (C) Left plots show overlaid responses to brief subthreshold photostimulation trains (0.72 ± 0.36 mW, 10 ms pulses) delivered at two frequencies (0.1 Hz – lower, and 0.5 Hz – upper). Right plots compare latency to photostimulation responses and total response duration at the two stimulation frequencies. Repeated subthreshold photostimuli summate to evoke a response and latency is significantly reduced by increased stimulation frequency (p=0.012). (D) Photostimulation responses mapped to the body region targeted in a subset of CR-ChR2 animals (paw, leg, back or tail; n = 12). Images show examples of nocifensive responses directed to the hind paw, hindlimb, back, and tail. Plots (right) compare group data for the latency of nocifensive behavior directed to different body regions. Hind paw focused responses show the shortest latency followed by significantly longer latencies for responses targeting the hind limb, back and then tail.
Figure 6—figure supplement 1
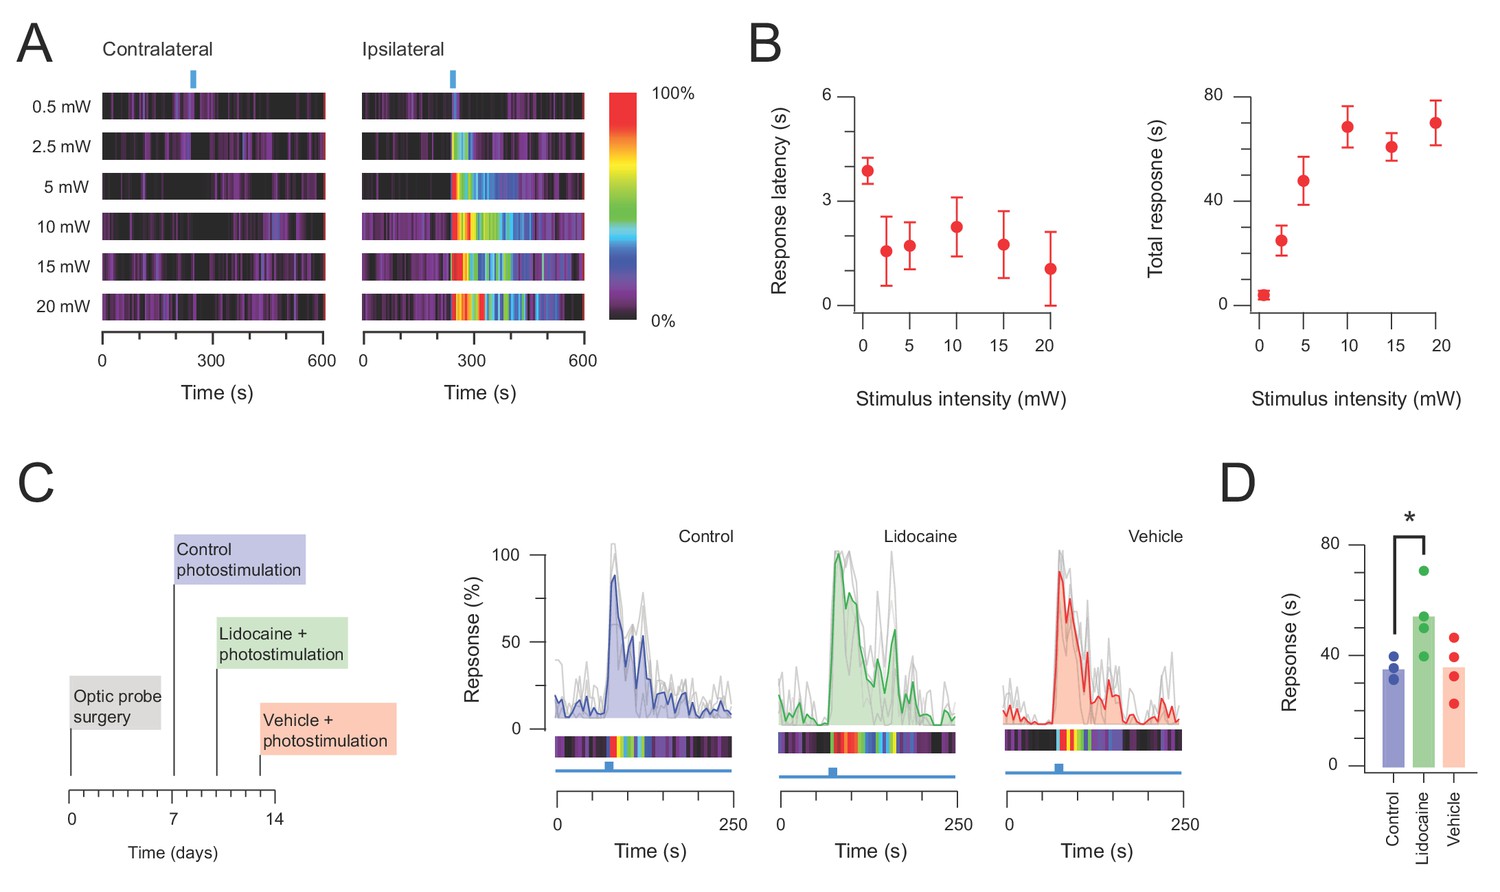
Photostimulation evokes an intensity dependent nociceptive behavioural response in CRCre;Ai32 mice.
(A) Heat bars show averaged photostimulation (blue bar denotes photostimulation period) responses targeted to the contralateral hindlimb (left) and ipsilateral (right) hindlimb as photostimulus intensity is increased (0.5–20 mW, 10 Hz, 10 s). Responses are binned in 5 s epochs with bin color coding the percent time groomed (red = 100%, black = 0%). Reponses increased with photostimulation intensity and were focused to the ipsilateral hindlimb. (B) Plots compare response latency, and total response as stimulus intensity is increased. Note, at lower stimulus intensities some animals did not exhibit responses during the photostimulation period, and total response durations increased with photostimulation intensity before stabilizing between 10–15 mW. (C) Timeline (left) shows experimental sequence for testing photosimulation responses under control conditions (blue), after local hindpaw anaesthesia (2% lidocaine, intraplantar - green), and vehicle hindpaw injection (saline - red). Plots (right) show overlaid peristimulus histograms of control (blue), lidocaine injected (green), and vehicle injected (red) photostimulation responses (n = 4). Mean response is highlighted in colour and converted to a heat bars below. (D) Plot shows group data for total response duration (bars show mean values). Photostimulation under local hindpaw anesthesia increased the behavioral response above control levels (p<0.05).
Figure 7
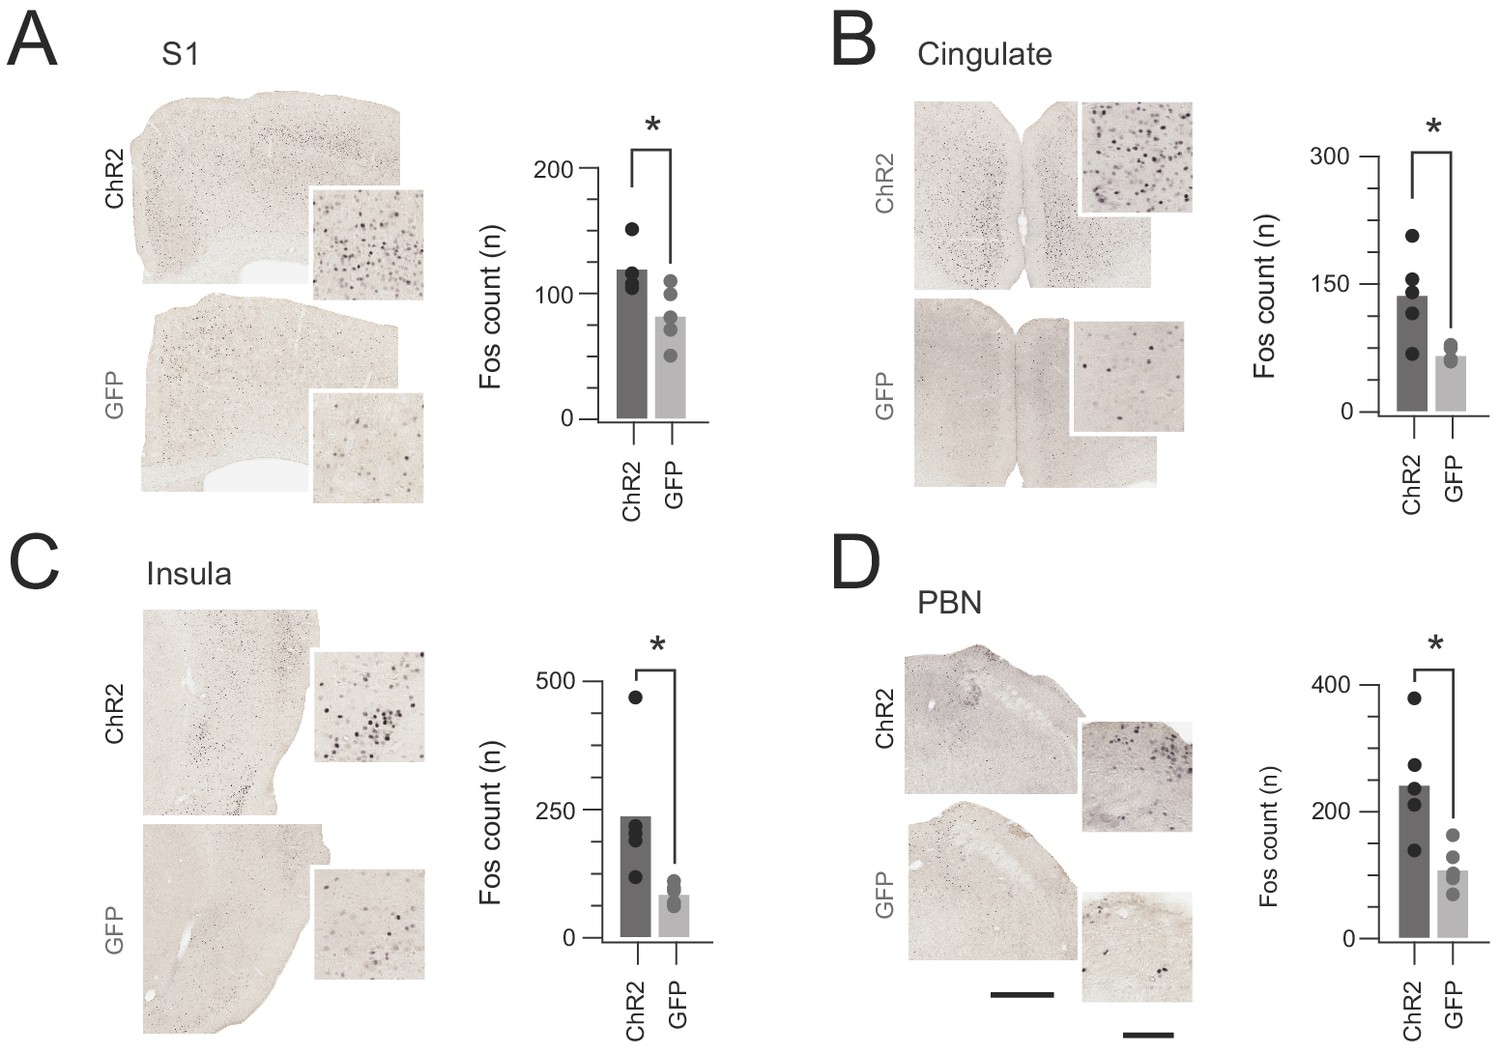
In vivo CR-ChR2 photostimulation activates nociceptive brain regions.
(A-D) Images show representative brain sections from CRcre;Ai32 (upper) and CR-GFP animals (lower) immunlabelled for Fos protein following in vivo spinal photostimulation (10 mW at 10 Hz, 10 min), insets show Fos labelled profiles at higher magnification. Bar graphs (right) of group data compare total number of Fos+ neurons counted in corresponding brain regions. The number of Fos+ profiles was elevated in CRCre;Ai32 photostimulated mice in the somatosensory cortex (S1, p=0.043), anterior cingulate cortex (Cingulate, p=0.016), Insula cortex (Insula, p=0.0346), and parabrachial nucleus (PBN, p=0.023). Scale bars = 500 µm, inset = 100 µm.
Figure 8 with 1 supplement
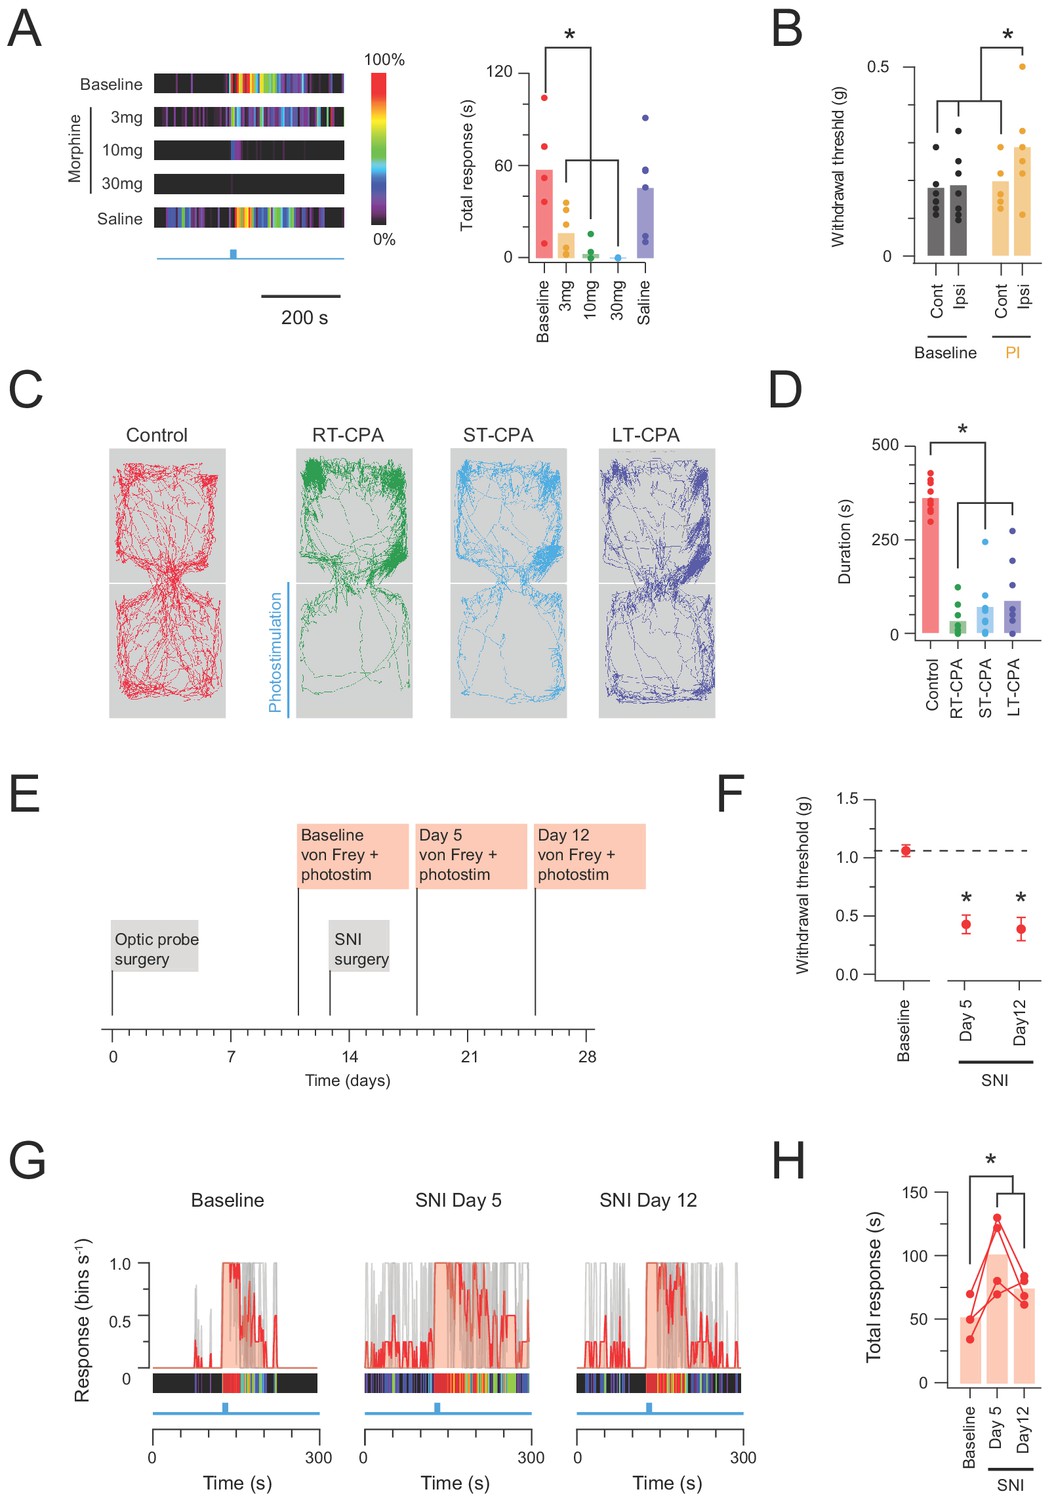
In vivo CR-ChR2 photostimulation has nociceptive qualities.
(A) Heat bars (left) show average photostimulation responses (10 mW at 10 Hz, 10 s), from a subset of animals (n = 6) assessed under baseline conditions, after, three morphine doses (3, 10, and 30 mg/kg i.p.), and control saline injection. Bar graphs (right) compares group data for total nocifensive response duration under each condition. Morphine produced a dose dependent block of the nocifensive response compared to baseline (3 mg/kg, p=0.024; 10 mg/kg, p=0.002; 30 mg/kg, p=0.001). (B) Group plots compare mean withdrawal threshold (von Frey) for hind paws ipsilateral and contralateral to spinal fiber optic probe placement. Left bars show mean withdrawal threshold under baseline conditions and right bars show mean withdrawal threshold assessed with NpHR3-mediated photoinhibition of CR+ neurons in the ipsilateral spinal cord. Spinal photoinhbition selectively increased withdrawal threshold for the ipsilateral hindpaw, consistent with CR+ neuron inhibition decreasing mechanical sensitivity (cont = contralateral, ipsi = ipsilateral). (C) Four maps (left) show mouse activity traces during the conditioned place aversion (CPA) testing under: control conditions (no photostimulation - red trace); real time CPA training (RT-CPA – green trace) where one arena is assigned for photostimulation (10 mW, 10 Hz, 10 s in every minute) on entry; short-term CPA (ST-CPA), assessed 1 hr following the RT-CPA session with no photostimulation (blue trace); and long-term CPA (LT-CPA), assessed 24 hr after the RT-CPA session again with no photostiulation (purple trace). (D) Bar graph (right) compares time spent in the photostimulation arena during CPA testing. Spinal photostimulation of CR-ChR2 neurons established a robust real-time conditioned place aversion by the fourth RT-CPA session (green) significantly reducing time in the photostimulation arena (p<0.0001). These reductions persisted during ST-CPA (p=0.0001) and LT-CPA (p=0.0001). (E) Timeline shows experimental sequence for testing CR-ChR2 photosimulation responses before and after spared nerve injury (SNI) surgery. (F) Plot shows 50% withdrawal thresholds for CRCre;Ai32 mice at baseline and following SNI surgery. All animals developed mechanical hypersensitivity. (G) plots show overlaid peristimulus histograms of photostimulation responses in CRCre;Ai32 mice (n = 4, grey traces) at baseline, and 5 and 12 days following SNI surgery. Mean response is shown in red and converted to a heat bar (bins color coded to percent time groomed (red = 100%, black = 0%). (H) Plot shows individual photostimulation behavioral response durations at baseline, and 5 and 12 days following SNI surgery (bar show mean). Responses were significantly longer post-SNI.
Figure 8—figure supplement 1
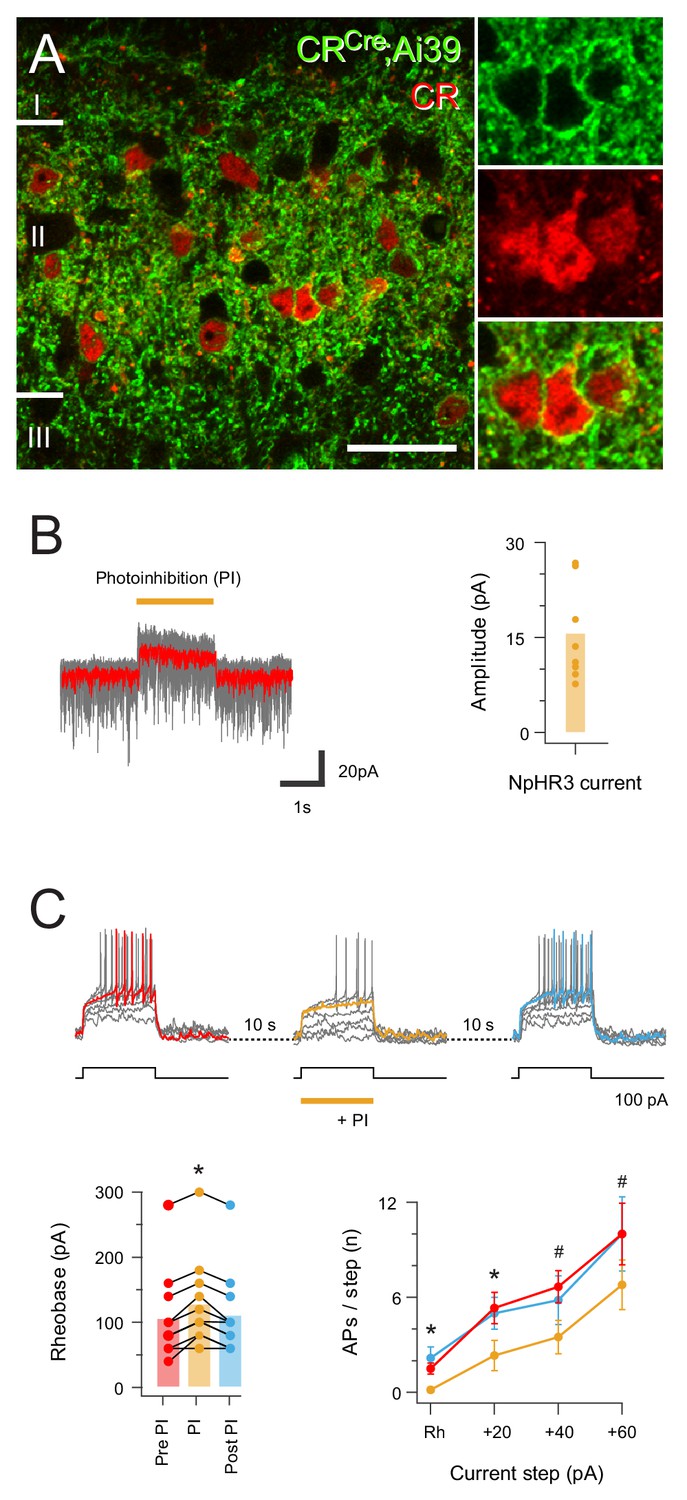
Halorhodopsin-mediated photoinhibition of CR+ neurons in CRCre;Ai32 mice.
(A) Image panels (left) compare NpHR3YFP-IR (green) and CR-IR profiles (red) in a single optical section. There is a high incidence of colocalisation of CR-IR in NpHR3YFP-IR neurons in laminae I and II (82.2%,±1.27), and of YFP expression in CR-IR neurons (94.1%,±4.27), Scale bar = 20 μm. (B) Traces (right) are overlaid recordings from a CR+ neuron during NpHR3-mediated photoinhibition (orange bar). The average response (red trace) highlight a stimulus-locked outward current resulting from NpHR3 activation. Plot (right) shows group data for NpHR3 current amplitude during photoinhibition. (C) Overlaid traces show CR+ neuron recording during three successive series of depolarizing current injection (20 pA increments, 800 ms duration) to activate AP discharge, separated by 10 s intervals. Sustained NpHR3-mediated photoinhibition was applied for the second current injection series. Photoinhibition suppressed current-evoked AP discharge, highlighted in group data plots comparing rheobase current (lower left) and current step versus AP number (lower right) during photostimulation with these properties pre- and post-photostimulation.
Videos
Video 1
Behavioural response to in vivo photostimulation of the dorsal horn calretinin network.
Video 2
In vivo photostimulation of the dorsal horn calretinin network causes a real time conditioned place aversion.
Tables
Table 1
Photostimulation response characteristics.
Values are mean ± SEM. * denotes p<0.05 between cell types (CR vs. P vs. D vs. PN), or oIPSC type (M vs. G).
| Neuron type | Input | n | Latency (ms) | Amplitude (pA) | Rise time (ms) | Half-width (ms) | Charge (pA.ms) |
|---|---|---|---|---|---|---|---|
| CR-ChR2 (CR) | oEPSC | 12 | 8.6 ± 1.2 | 87.59 ± 20.04 | 2.67 ± 0.41 | 4.90 ± 0.62 | 0.66 ± 0.20 |
| Plexus (P) | oEPSC | 11 | 4.8 ± 0.6 * CR, D, PN | 51.42 ± 19.88 | 2.89 ± 0.63 | 5.40 ± 1.60 | 0.52 ± 0.17 |
| Dorsal (D) | oEPSC | 13 | 7.3 ± 1.1 | 126.72 ± 52.03 | 3.22 ± 0.64 | 6.61 ± 1.16 | 1.93 ± 0.98 |
| PN (PN) | oEPSC | 13 | 7.9 ± 1.4 | 70.68 ± 131.40 | 5.54 ± 1.44 * CR, P, D | 10.82 ± 1.60 * CR, P, D | 1.35 ± 0.55 |
| CR-ChR2 (CR) | Mixed-oIPSC (M) | 10 | 7.91 ± 0.53 | 146.43 ± 70.33 | 14.82 ± 3.90 | 74.39 ± 26.28 | 29.25 ± 23.87 |
| Gly-oIPSC (G) | 10 | 52.66 ± 12.75 | 4.36 ± 1.17 * M | 16.72 ± 3.42 * M | 9.77 ± 7.26 | ||
| Plexus (P) | Mixed-oIPSC (M) | 16 | 8.32 ± 0.61 | 237.16 ± 70.72 | 7.74 ± 0.60 | 71.70 ± 10.00 | 27.29 ± 9.30 |
| Gly-oIPSC (G) | 16 | 104.28 ± 40.55 * M | 6.27 ± 1.33 | 40.56 ± 19.30 * M | 8.17 ± 4.13 * M | ||
| Dorsal (D) | Mixed-oIPSC (M) | 4 | 5.72 ± 0.53 | 224.87 ± 76.67 | 5.99 ± 1.67 | 19.75 ± 2.93 | 17.95 ± 10.66 |
| Gly-oIPSC (G) | 4 | 81.34 ± 50.52 * M | 2.645 ± 0.35 * M | 15.87 ± 5.58 | 5.18 ± 3.46 * M |
Key resources table
| Reagent type (species) or resource | Designation | Source or reference | Identifiers | Additional information |
|---|---|---|---|---|
| Antibody | Goat anti-calretinin | SWANT, Bellinoza, Switzerland | Cat# ABS571, RRID: AB_10000342 | IF(1:500) |
| Antibody | Chicken anti-GFP (polyclonal antibody) | Abcam, UK | Cat# ab15051, RRID: AB_300798 | IF(1:1000) |
| Antibody | Rabbit anti-GFP (polyclonal antibody) | Frontier Institute Co. Ltd, Japan | Cat# GFP-Rb-Af2020; RRID: AB_2571573 | IF(1:5000) |
| Antibody | Goat anti-Homer1 (polyclonal antibody) | Frontier Institute Co. Ltd, Japan | Cat# Homer1-Go,RRID:AB_2631104 | IF(1:1000) |
| Antibody | Rat anti-mCherry (monoclonal antibody) | Thermo Fisher Scientific | Cat# M11217, RRID:AB_2536611 | IF(1:1000) |
| Antibody | Rabbit anti-NK1R | Sigma-Aldrich | Cat# S8305, RRID:AB_261562 | IF(1:2000) |
| Antibody | Rabbit anti-Pax2 (polyclonal antibody) | Thermo Fisher Scientific | Cat# 71–6000, RRID:AB_2533990 | IF(1:1000) |
| Antibody | Rabbit anti-PKCγ (polyclonal antibody) | Santa Cruz Biotechnology | Cat# sc-211, RRID:AB_632234 | IF(1:1000) |
| Antibody | Guinea Pig anti-somatostatin | Dr Philippe Ciofi | Philippe Ciofi, INSERM U1215. Bordeaux, France. | IF(1:1000) |
| Antibody | Mouse anti-VGLUT2 (monoclonal antibody) | Millipore, Chemicon International, UK | Cat# MAB5504, RRID:AB_2187552 | IF(1:500) |
| Antibody | Rat anti-substance P | Oxford Biotech, UK | Cat No: OBT0643S | IF(1:200) |
| Antibody | Rabbit anti-CGRP | Sigma-Aldrich | Cat# C8198, RRID:AB_259091 | IF(1:10000) |
| Antibody | Mouse anti-NF200 (monoclonal antibody) | Sigma-Aldrich | Cat# N0142, RRID:AB_477257 | IF(1:500) |
| Antibody | Guinea Pig anti-VGLUT1 (polyclonal antibody) | Millipore (Chemicon) | Cat# AB5905, RRID:AB_2301751 | IF(1:5000) |
| Antibody | Guinea Pig anti-VGLUT2 (polyclonal antibody) | Millipore (Chemicon) | Cat# AB2251-I, RRID:AB_2665454 | IF(1:5000) |
| Antibody | Rabbit anti-VGlut2 (polyclonal antibody) | Synaptic Systems | Cat# 135 402, RRID:AB_2187539 | IF(1:5000) |
| Antibody | Guinea Pig anti-VGLUT3 (polyclonal antibody) | Frontier Institute Co. Ltd, Japan | Cat# VGluT3-GP-Af920, RRID:AB_2571856 | |
| Antibody | Chicken anti-prostatic acid phosphatase (polyclonal antibody) | Aves Labs. Inc, OR, USA | Cat# PAP, RRID:AB_2313557 | IF(1:1000) |
| Genetic reagent (virus) | AAV9-CB7-Cl ~ mCherry | addgene, USA | Cat#105544-AAV9 | |
| Genetic reagent (M. musculus) | Calb2-IRES-cre: B6(Cg)-Calb2tm1(cre)Zjh/J | The Jackson Laboratories, USA | Cat# JAX:010774, RRID:IMSR_JAX:010774 | |
| Genetic reagent (M. musculus) | Ai32:B6;129S-Gt(ROSA)26Sortm32(CAG-COP4*H134R/EYFP)Hze/J | The Jackson Laboratories, USA | Cat# JAX:012569, RRID:IMSR_JAX:012569 | |
| Genetic reagent (M. musculus) | Ai34: B6;129S -Gt(ROSA)26Sortm34.1(CAG-Syp/tdTomato)Hze/J | The Jackson Laboratories, USA | JAX:012570RRID:IMSR_JAX:012570 | |
| Genetic reagent (M. musculus) | Ai39:B6;129S-Gt(ROSA)26Sortm39 (CAG-hop/EYFP)Hze/J | The Jackson Laboratories, USA | JAX:014539, RRID:IMSR_JAX:014539 | |
| Genetic reagent (M. musculus) | CReGFP | Prof Hannah Monyer, Heidelberg University, Germany | ||
| Genetic reagent (M. musculus) | Advillin eGFP | GENSAT, MMRRC | Cat# 034769-UCD, RRID:MMRRC_034769-UCD | |
| Software, algorithm | Neurolucida for Confocal Software | MBF Bioscience, VT, USA | https://www.mbfbioscience.com/neurolucida | |
| Software, algorithm | Neurolucida Explorer | MBF Bioscience, VT, USA | https://www.mbfbioscience.com/neurolucidaexplorer | |
| Software, algorithm | AxoGraph X | Dr. John Clements | https://axograph.com/ | |
| Software, algorithm | Zen Black | Carl Zeiss, Germany | https://www.zeiss.com/microscopy/int/products/microscope-software/zen.html | |
| Software, algorithm | JWatcher | Daniel T. Blumstein et al., University of California Los Angeles and Macquarie University, Sydney | http://www.jwatcher.ucla.edu |
Additional files
Download links
A two-part list of links to download the article, or parts of the article, in various formats.
Downloads (link to download the article as PDF)
Open citations (links to open the citations from this article in various online reference manager services)
Cite this article (links to download the citations from this article in formats compatible with various reference manager tools)
Calretinin positive neurons form an excitatory amplifier network in the spinal cord dorsal horn
eLife 8:e49190.
https://doi.org/10.7554/eLife.49190


