Quantifying antibiotic impact on within-patient dynamics of extended-spectrum beta-lactamase resistance
- University of Oxford, United Kingdom
- National Institute for Public Health and theEnvironment, Netherlands
- University of Antwerp, Belgium
- Tel-Aviv University, Israel
- University of Tuebingen, Germany
- Infectious Diseases, University of Verona, Italy
- Clinical Centre of Serbia, Serbia
- Matei Balş National Institute for Infectious Diseases, Romania
Figures
Figure 1 with 1 supplement
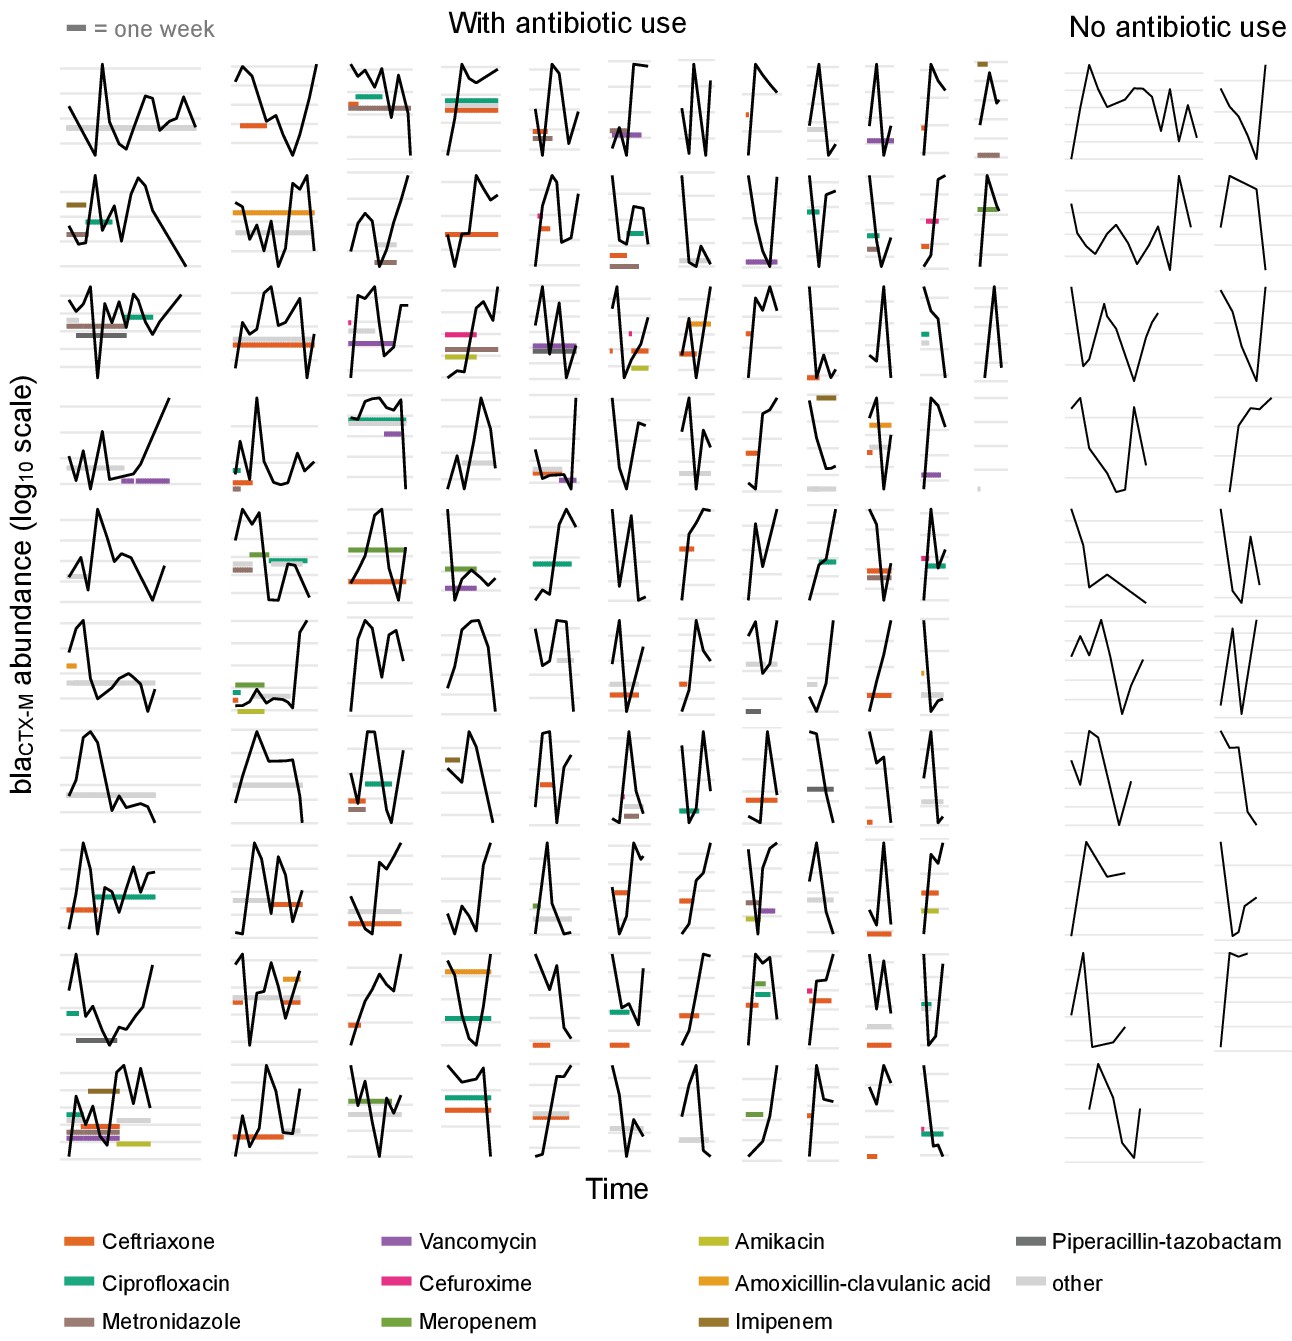
Time series plots demonstrating the diverse range of dynamical patterns of blaCTX-M resistance gene abundance across the 132 patients with two or more samples.
The x-axis scale is identical across panels, the length of one week is given for scale in the top-left corner. Timelines are ordered by length. The y-axis scale differs between panels, with the space between vertical grey lines representing a 10-fold change in the absolute blaCTX-M gene abundance (measured in copy numbers). The left-hand side shows patients who received antibiotic treatment (n = 113), and the two right-hand side columns are patients without antibiotic treatment (n = 19). For clarity, we show only the twelve most frequently used antibiotics in distinct colours and other antibiotics in light grey.
Figure 1—figure supplement 1
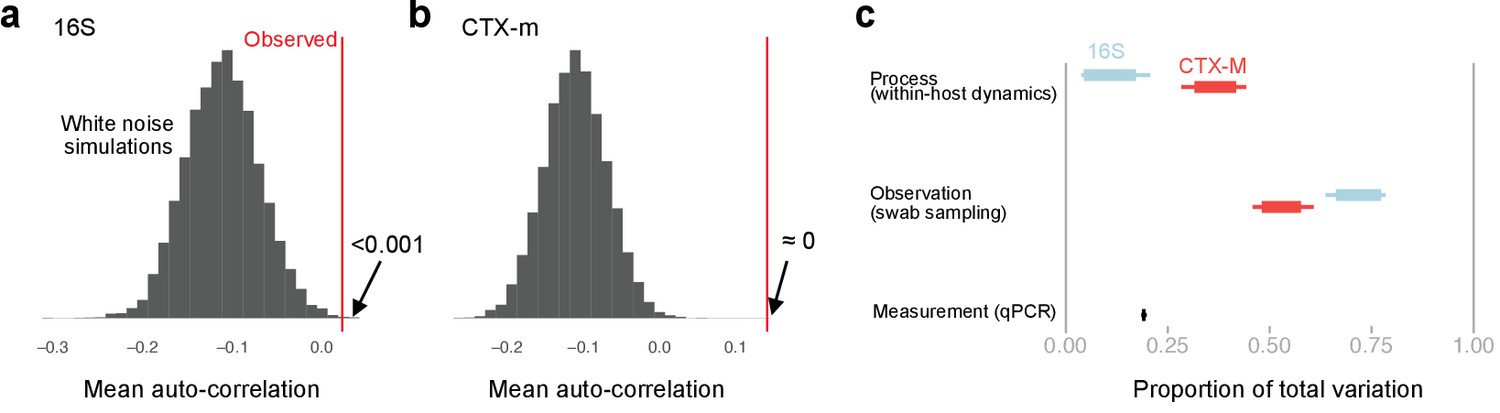
Exploration of autocorrelation and different sources of data variability.
Autocorrelation and sources of variability in qPCR time series data. First-order autocorrelation averaged across all patients with more than five time points for 16S (a) and blaCTX-M (b) abundance data (red vertical line). This is compared to a histogram of the mean autocorrelation from 10,000 replicates of simulated serially uncorrelated ‘white noise’ time series, simulated using the same number of observations per patient as in the real data and the same per patient mean and variance as in the observed blaCTX-M and 16S rRNA data. The shift toward negative autocorrelation in the simulations is an artefact due to short time series, and, thus, it is the position of the observed value relative to the simulated distribution that is of interest. Both blaCTX-M and 16S data show a clear autocorrelation signal, though autocorrelation is substantially stronger for the blaCTX-M data. Panel (c) shows Bayesian estimates of the sources of variability in the measurements, given as proportion of total variability. Thick bars show the 80% credible intervals, thinner bars show the 95% credible intervals.
Figure 2 with 1 supplement
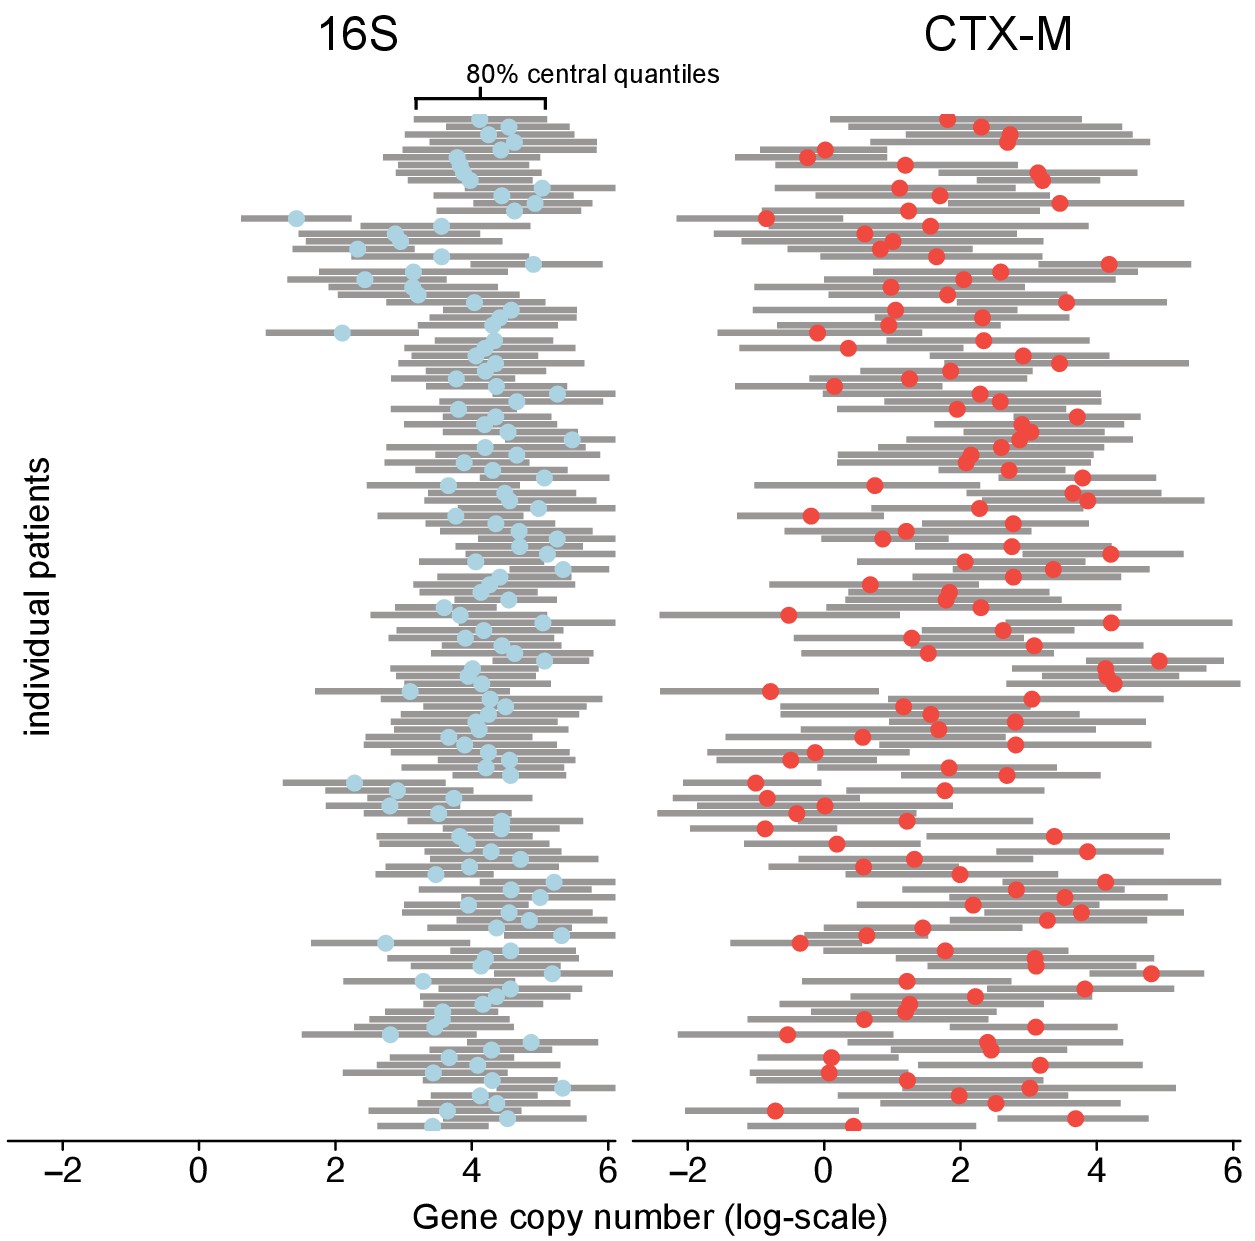
Variability of 16S abundance and blaCTX-M abundance within and between patient time series using a Bayesian hierarchical model.
In this model, abundance is distributed around individual patient intercepts, which are distributed around a common population intercept. The plot shows individual patient intercepts given as mean posterior estimates (coloured dots) together with posterior predictions for sequence abundance for each patient (grey bars show 80% central quantiles).
Figure 2—figure supplement 1
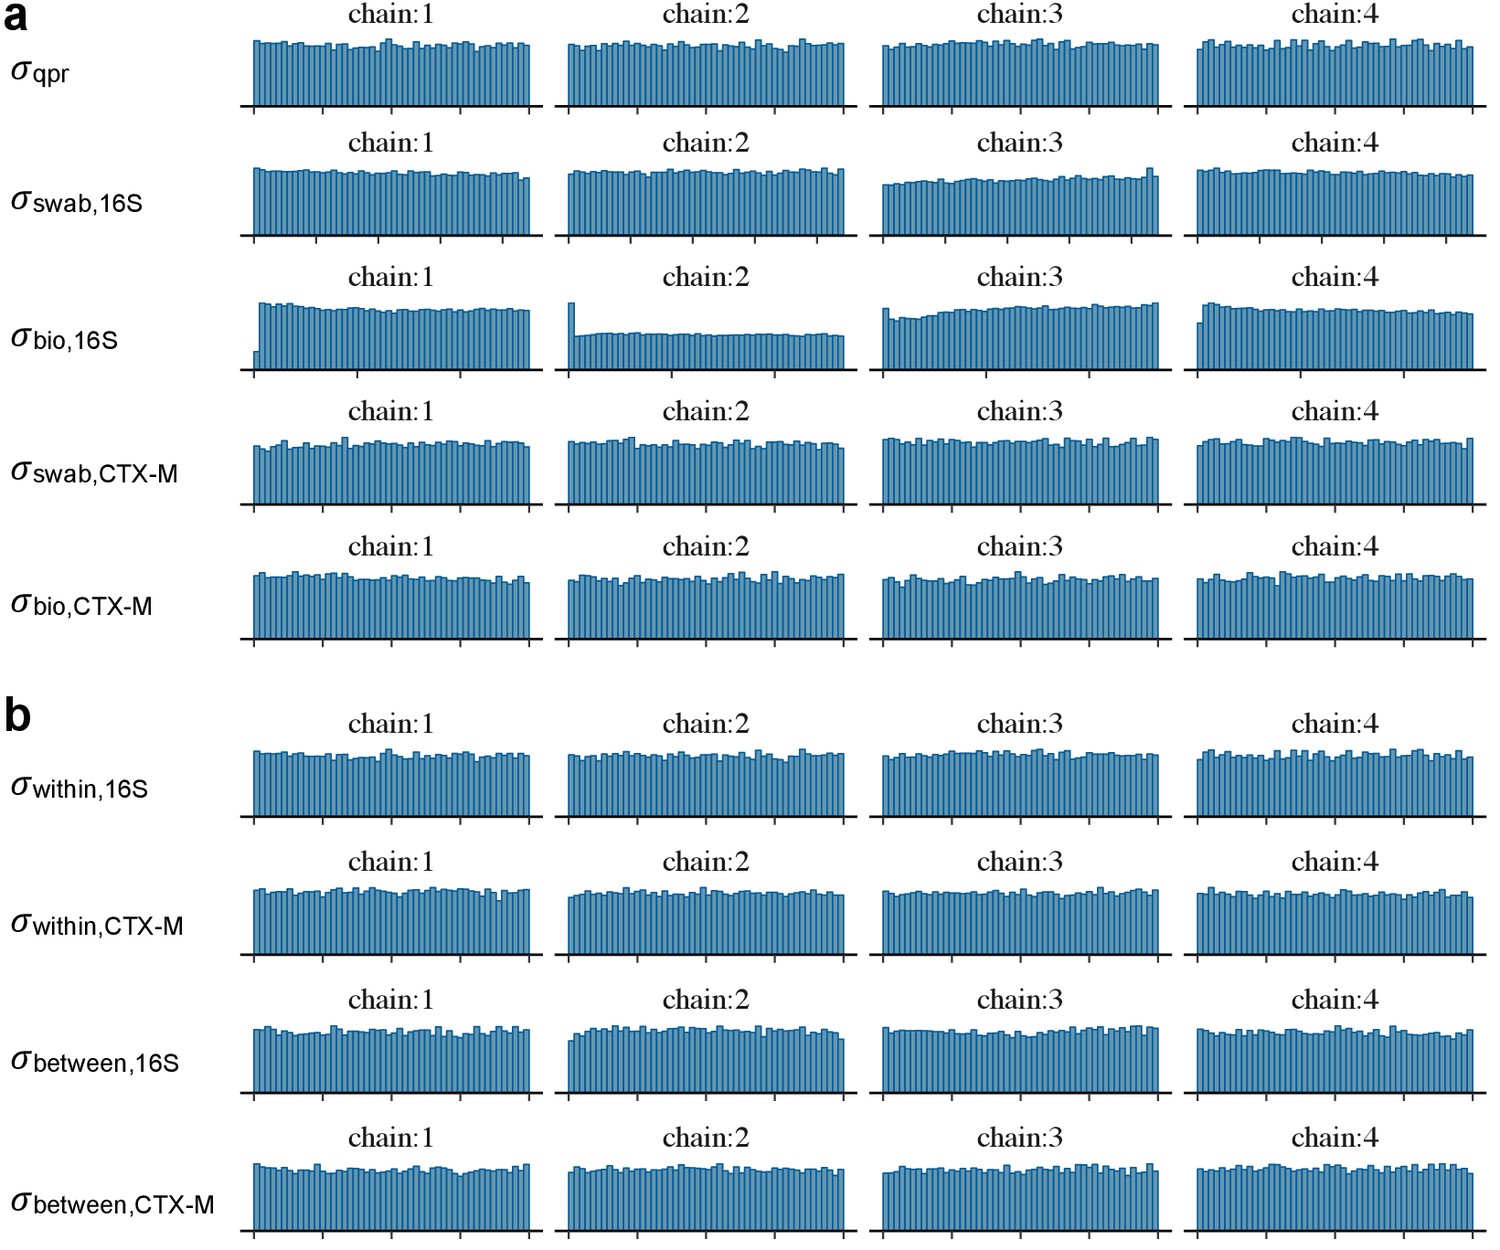
Diagnostic plots of MCMC samples.
Diagnostic visualisation of posterior samples of the standard deviation parameters in the Bayesian models given in Equation 1 (a) and in Equation 2 (b) using rank plots.
Figure 3
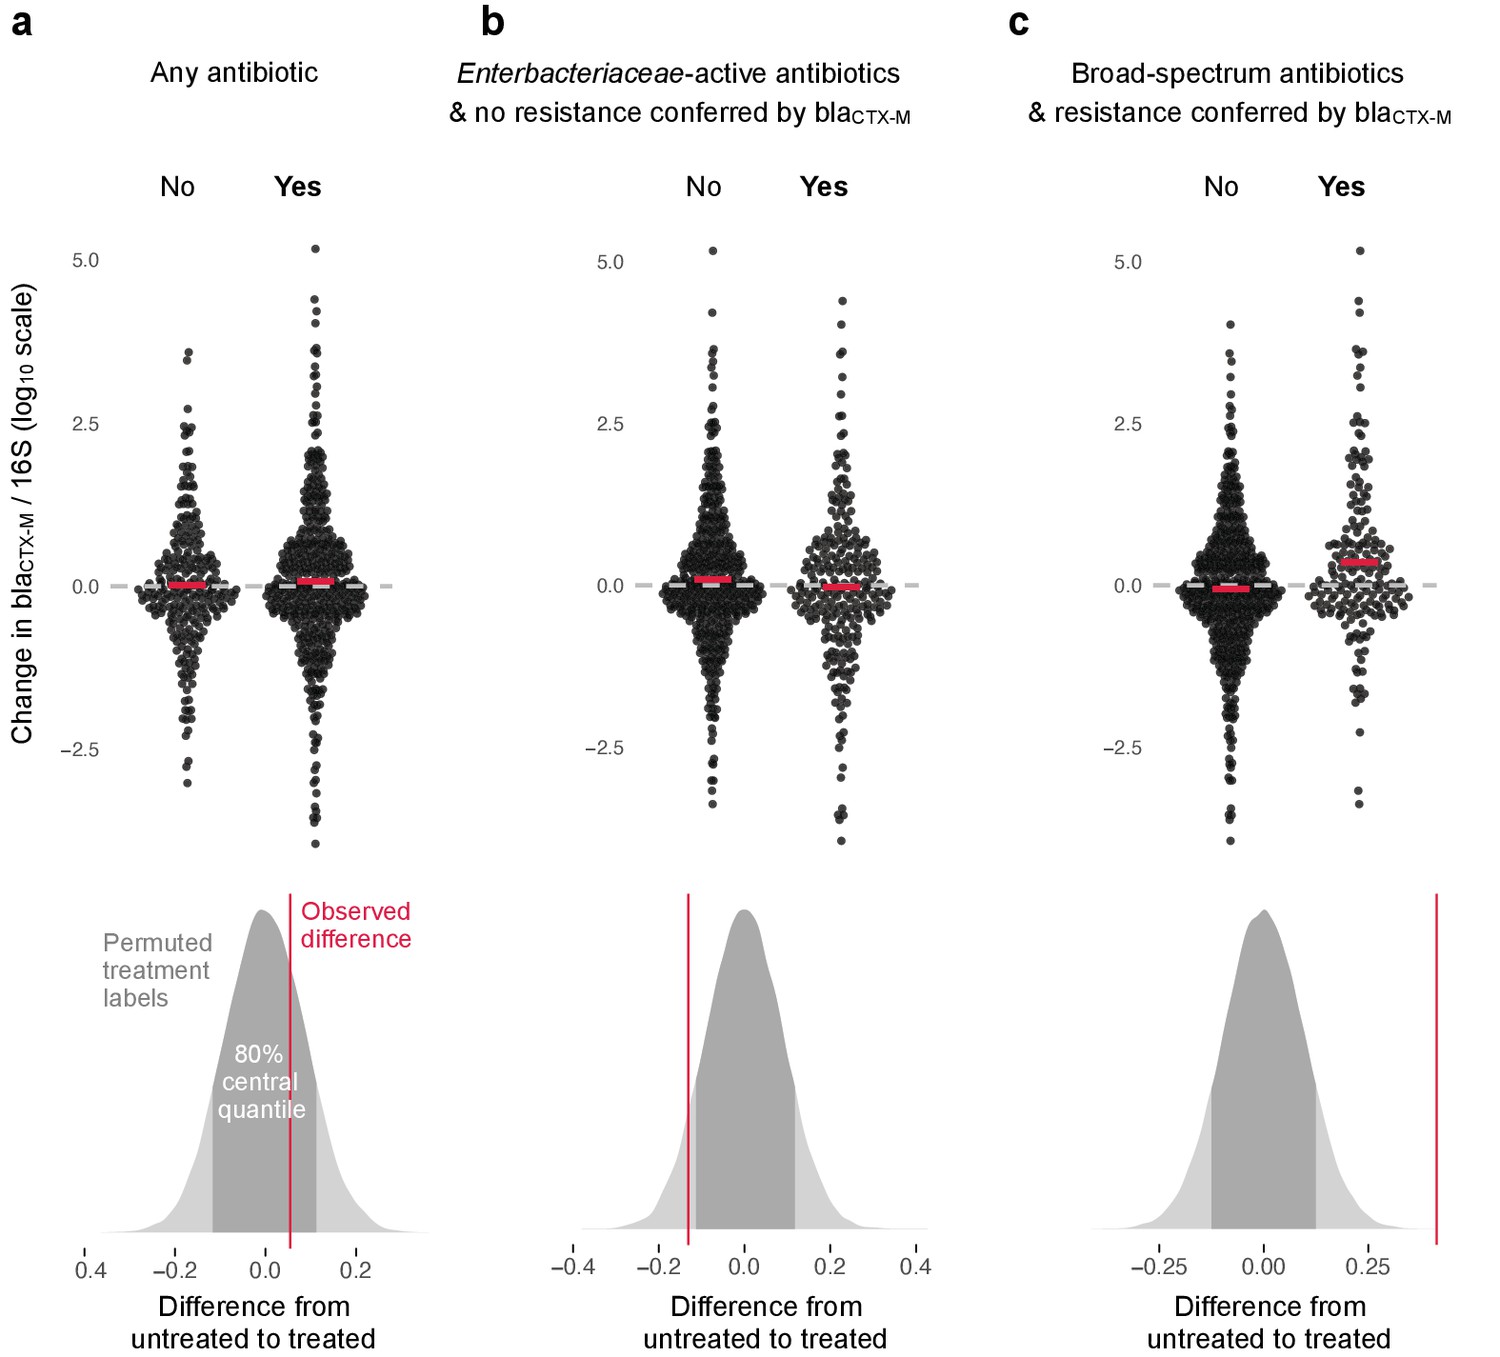
Association of antibiotic use with change in relative resistance (abundance of blaCTX-M divided by abundance of 16S rRNA).
The upper panels show the change in relative resistance between all neighbouring timepoints (black dots), dashed horizontal lines in grey indicate the region of no change. Pairs of violin scatter plots (with the mean values shown as red bars) contrast different treatment that occurred between those timepoints. ‘Yes’ indicates treatment with specified antibiotics and ‘No’ means treatment with other antibiotics or no treatment. The lower three panels show the distribution of mean differences of the change in relative resistance between treatment groups generated through treatment-label permutation (areas in darker grey show 80% central quantiles). The distributions are overlaid with the observed difference (red vertical line). Panel (a) compares treatment with any antibiotic versus no antibiotic (number of intervals without treatment/number of intervals with treatment are 251(N)/449(Y)). Panel (b) compares treatment with antibiotics with activity against Enterobacteriaceae and to which blaCTX-M does not confer resistance (colistin, meropenem, ertapenem, imipenem, amoxicillin-clavulanic acid, ampicillin-sulbactam, piperacillin-tazobactam, gentamicin, amikacin, ciprofloxacin, ofloxacin, levofloxacin, tigecycline, doxicycline) with all other treatment, including no treatment (445(N)/255(Y)). Finally, in panel (c) we consider antibiotics with broad-spectrum activity but to which blaCTX-M does confer resistance (cefepime, ceftazidime, ceftriaxone, cefotaxime, cefuroxime, amoxicillin, ampicillin) (513(N)/187(Y)).
Figure 4 with 3 supplements

Estimated effects of different antibiotics on within-host dynamics from a multivariable model.
The bars show estimated daily effects of individual antibiotics on the absolute blaCTX-M abundance (red) and 16S rRNA abundance (light blue) indicating the 80% and 95% highest posterior density intervals (thick and thin horizontal bars, respectively). The model also gives the antibiotic effect on the blaCTX-M/16S relative resistance shown as arrows on the right-hand side. Arrows are in grey for antibiotics with mean effect estimates between −10% and +10%, otherwise they are coloured red (positive selection) and green (negative selection). Route of antibiotic administration (intravenous, iv; oral, or) is indicated in parenthesis.
Figure 4—figure supplement 1
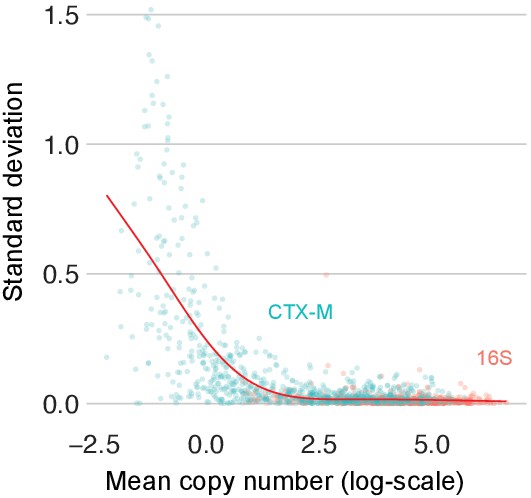
Variability of replicate qPCR runs across the qPCR scale.
Variability in replicate qPCR runs. The standard deviation of repeat qPCR machine runs versus their mean for 16S (red) and blaCTX-M (turquoise) after logarithmic transformation. The red line represents a smooth spline fit to the data with five degrees of freedom.
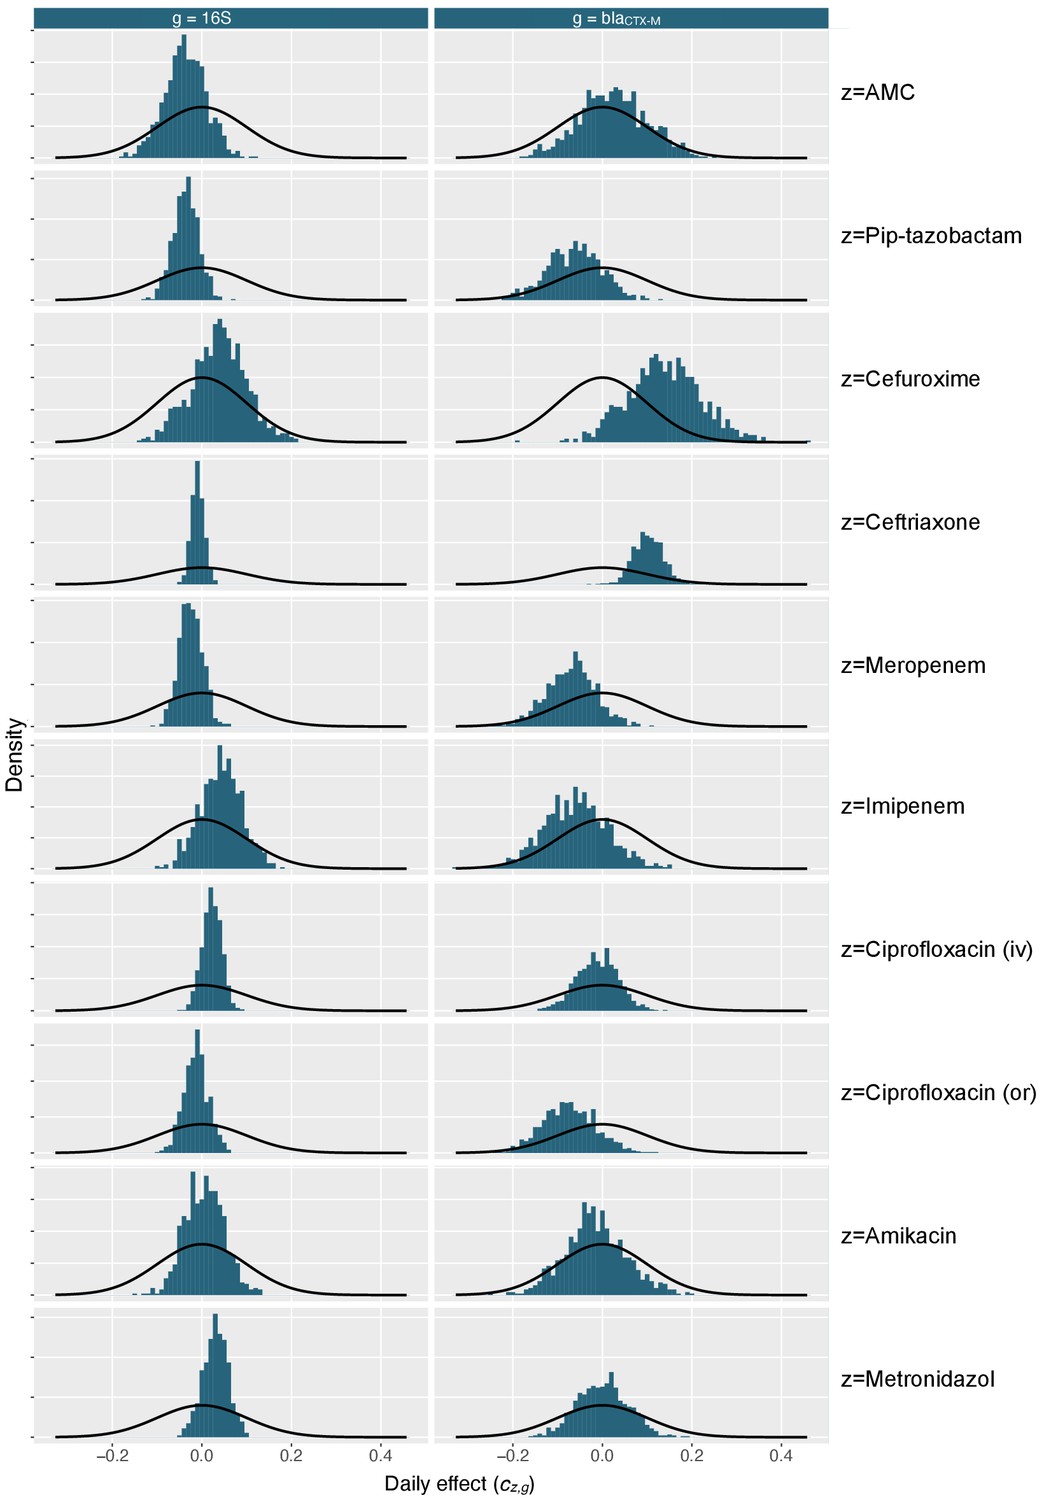
Figure 4—figure supplement 2
Marginal posterior distributions for antibiotic effect parameters.
Marginal distribution of antibiotic effect parameters (blue histograms) shows together with density distribution of the prior (black curves). AMC stands for amoxicillin-clavulanic acid, iv for intravenous, and or for oral route.
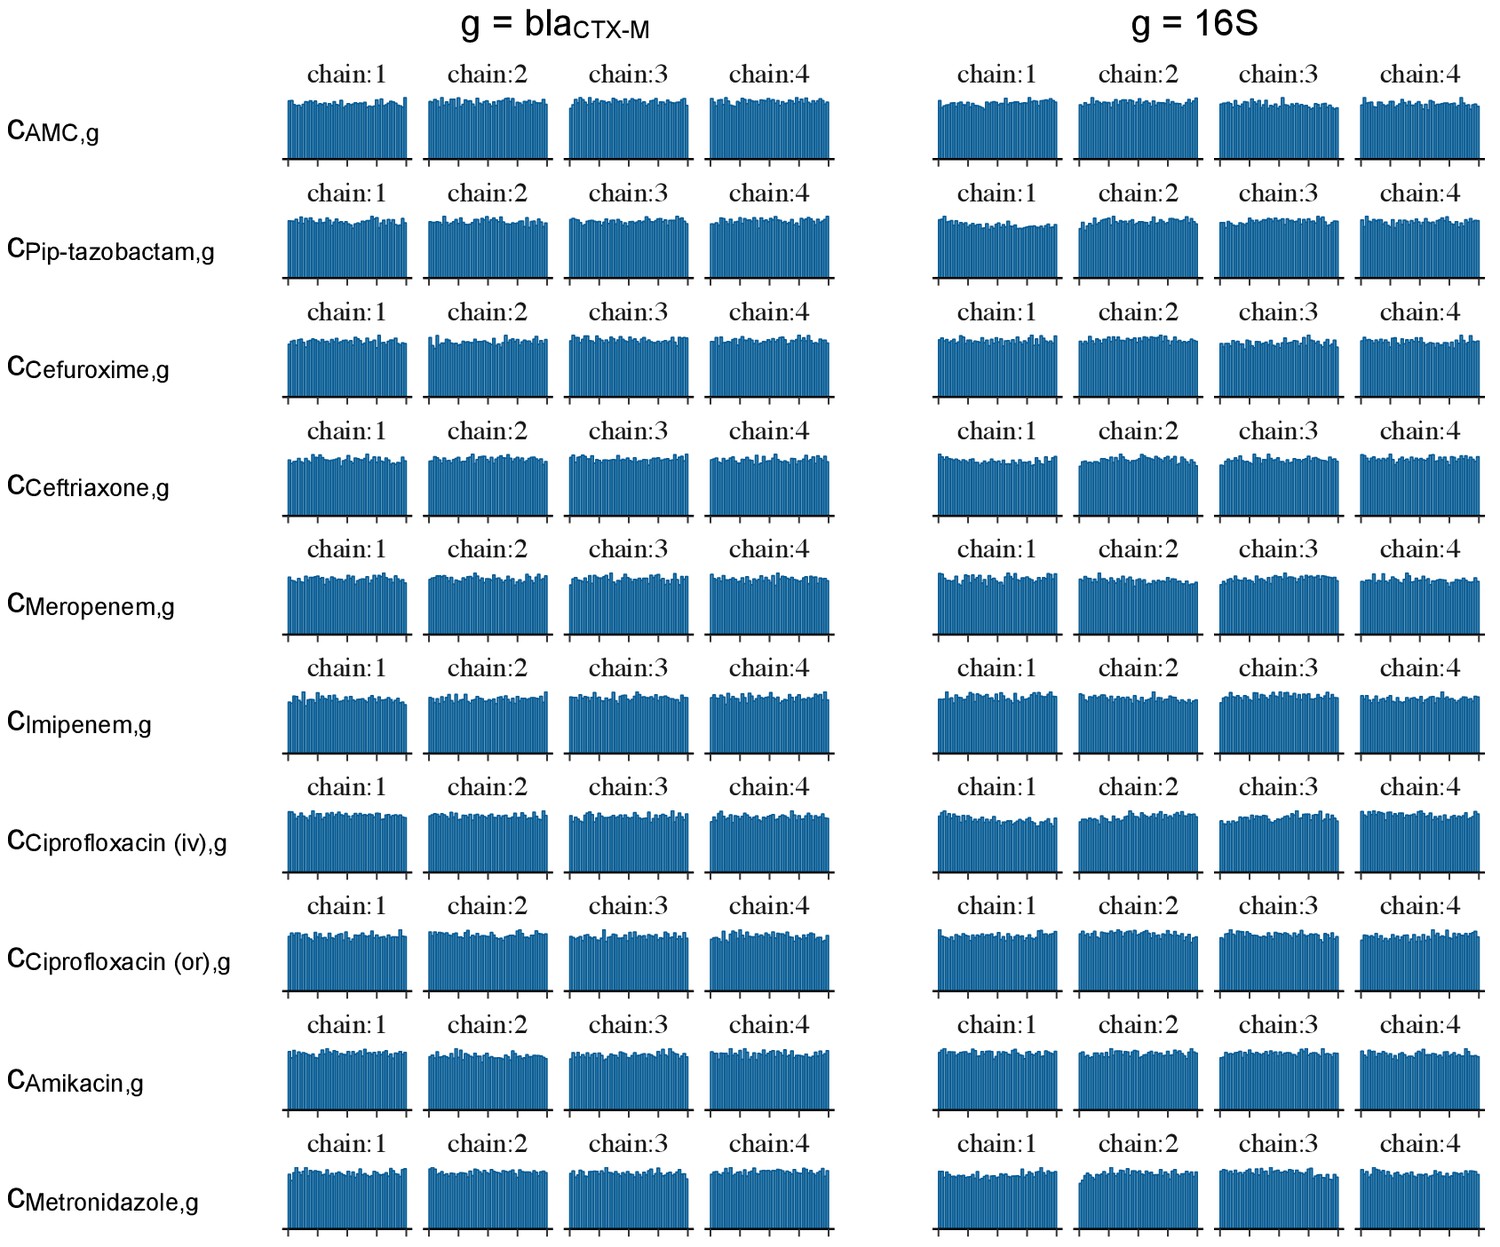
Figure 4—figure supplement 3
Diagnostic plots of MCMC samples.
Diagnostic rank plots of posterior samples of the effect parameters of the Bayesian model given in model definition 4. AMC stands for amoxicillin-clavulanic acid, iv for intravenous, and or for oral route.
Figure 5
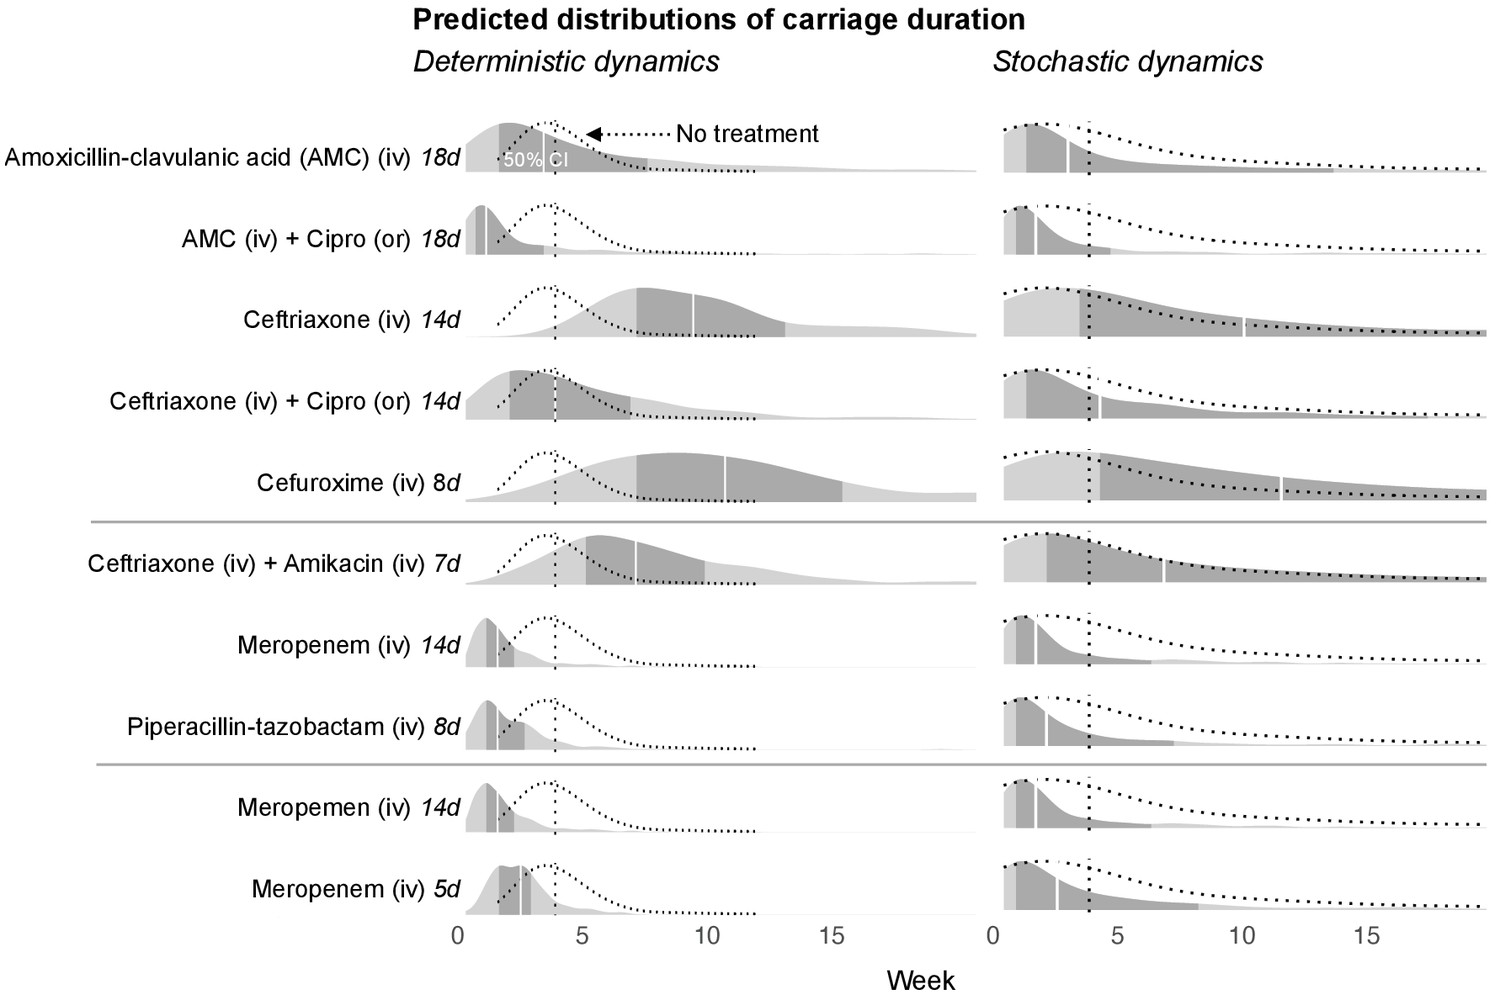
Simulated predictions of blaCTX-M carriage duration under different antibiotic treatments.
The distributions on the left-hand side shows model predictions with parameter uncertainty, but assuming deterministic dynamics. The right-hand side shows the predictions with parameter uncertainty as well as Markov process uncertainty. The darker grey areas shows the 50% credible intervals and the white lines show the median predictions. Each density distribution is overlaid with the density line of the no treatment case (dotted line) and its median prediction (dotted vertical line). In the first five rows, we compare predictions for treatment with amoxicillin-clavulanic acid (18 days) and ceftriaxone (14 days), and each in combination treatment with ciprofloxacin. In the next three rows, we compare treatment with ceftriaxone plus amikacin (7 days), meropenem (14 days), and piperacillin-tazobactam (8 days). In the final two rows, we compare a 14 day course of meropenem with a shortened course (5 days). AMC stands for amoxicillin-clavulanic acid.
Tables
Table 1
Summary of the study.
| Number of participating hospitals | 3 (Serbia, Italy, Romania) |
|---|---|
| Study duration | 2 years (Jan 2011 - Dec 2012) |
| Inclusion criteria | Inpatients of medical and surgical wards, adults, non-pregnant, ESBL producting Enterobacteriaceae carriers (at admission) |
| Number of patients followed up | 133 (including one with a single swab taken) |
| Intervals between rectal swabs | two to three days |
| qPCR targets | blaCTX-M (ESBL resistance gene), 16S rRNA (total bacterial load) |
| Number of different antibiotics used | 35 |
-
This study (registration number NCT01208519) was conducted by the SATURN consortium, supported by the European Commission under the 7th Framework Program.
Table 2
Overview of antibiotic treatments showing the ten most used antibiotics in this patient cohort.
Intravenous (iv), oral (or), and intramuscular (im) route administration is given in percent of treatment days.
| Antibiotic | Number of treated patients (total n=133) | Route |
|---|---|---|
| Ceftriaxone | 64 | ( 98% iv , 2% im ) |
| Ciprofloxacin | 34 | ( 67% iv , 33% or ) |
| Metronidazole | 20 | ( 50% iv , 50% or ) |
| Cefuroxime | 13 | ( 100% iv , 0% or ) |
| Vancomycin | 13 | ( 86% iv , 14% or ) |
| Meropenem | 10 | ( 100% iv , 0% or ) |
| Amikacin | 9 | ( 100% iv , 0% or ) |
| Amoxicillin-clavulanic acid | 9 | ( 57% iv , 43% or ) |
| Piperacillin-tazobactam | 7 | ( 100% iv , 0% or ) |
| Imipenem | 5 | ( 100% iv , 0% or ) |
Additional files
-
Transparent reporting form
- https://cdn.elifesciences.org/articles/49206/elife-49206-transrepform-v1.pdf
-
Reporting standard 1
STROBE guidelines.
- https://cdn.elifesciences.org/articles/49206/elife-49206-repstand1-v1.pdf
-
Reporting standard 2
STROBE AMS guidelines.
- https://cdn.elifesciences.org/articles/49206/elife-49206-repstand2-v1.pdf
-
Reporting standard 3
MICRO guidelines.
- https://cdn.elifesciences.org/articles/49206/elife-49206-repstand3-v1.pdf
Download links
A two-part list of links to download the article, or parts of the article, in various formats.
Downloads (link to download the article as PDF)
Open citations (links to open the citations from this article in various online reference manager services)
Cite this article (links to download the citations from this article in formats compatible with various reference manager tools)
Quantifying antibiotic impact on within-patient dynamics of extended-spectrum beta-lactamase resistance
eLife 9:e49206.
https://doi.org/10.7554/eLife.49206


