Evolution of C4 photosynthesis predicted by constraint-based modelling
- Leibniz Institute of Plant Genetics and Crop Plant Research (IPK), Germany
- Computational Biology, Faculty of Biology, Bielefeld University, Universitätsstraße, Germany
Figures
Figure 1 with 2 supplements
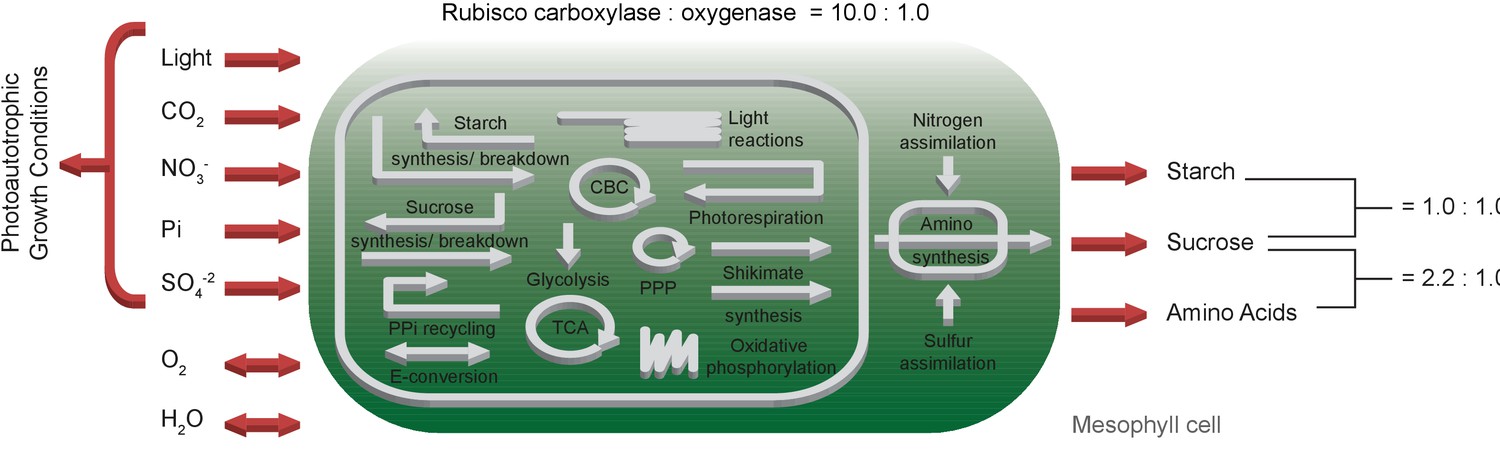
Schematic representation of the primary subsystems in the one-cell model and the used input/output constraints; adapted from Arnold and Nikoloski (2014).
-
Figure 1—source data 1
SBML code of the one-cell model.
- https://cdn.elifesciences.org/articles/49305/elife-49305-fig1-data1-v3.sbml
-
Figure 1—source data 2
Complete flux solution of the one-cell model.
- https://cdn.elifesciences.org/articles/49305/elife-49305-fig1-data2-v3.csv
-
Figure 1—source code 1
Jupyter notebook - Predicted fluxes of C3 metabolism.
- https://cdn.elifesciences.org/articles/49305/elife-49305-fig1-code1-v3.ipynb
-
Figure 1—source code 2
Jupyter notebook- Effect of the CO2 uptake rate on C3 metabolism.
- https://cdn.elifesciences.org/articles/49305/elife-49305-fig1-code2-v3.ipynb
-
Figure 1—source code 3
Jupyter notebook - Effect of the PPFD on C3 metabolism.
- https://cdn.elifesciences.org/articles/49305/elife-49305-fig1-code3-v3.ipynb
Figure 1—figure supplement 1
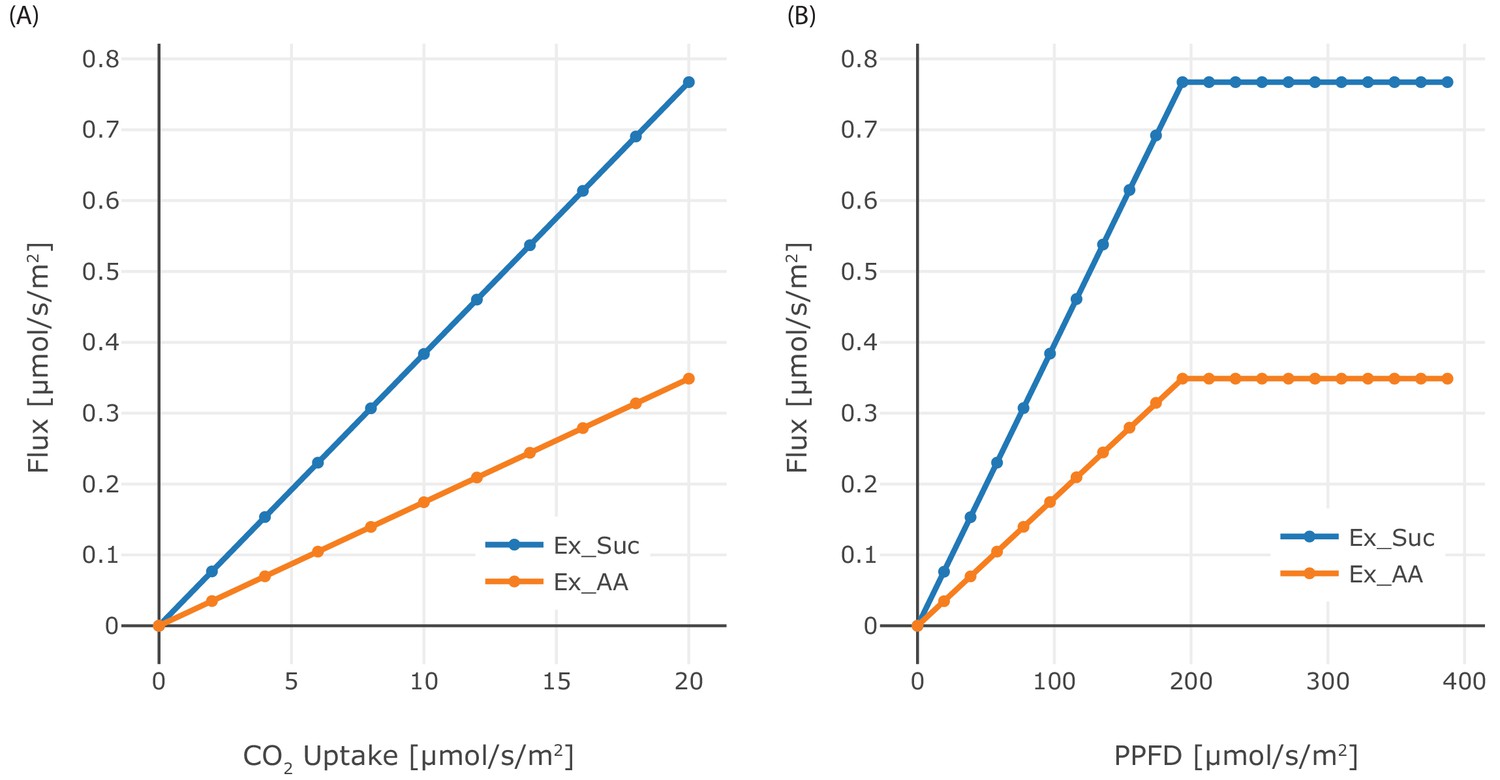
Effect of CO2 and PPFD variation.
(A) Dependence of the phloem output on CO2 input flux in the range 0 μmol/(m2s)–20 μmol/(m2s), (B) Dependence of phloem output on the PPFD in the range 0 μmol/(m2s)–400 μmol/(m2s). Sucrose and starch are produced in the same amounts, each of them consists of 12 C-atoms.
Figure 1—figure supplement 2
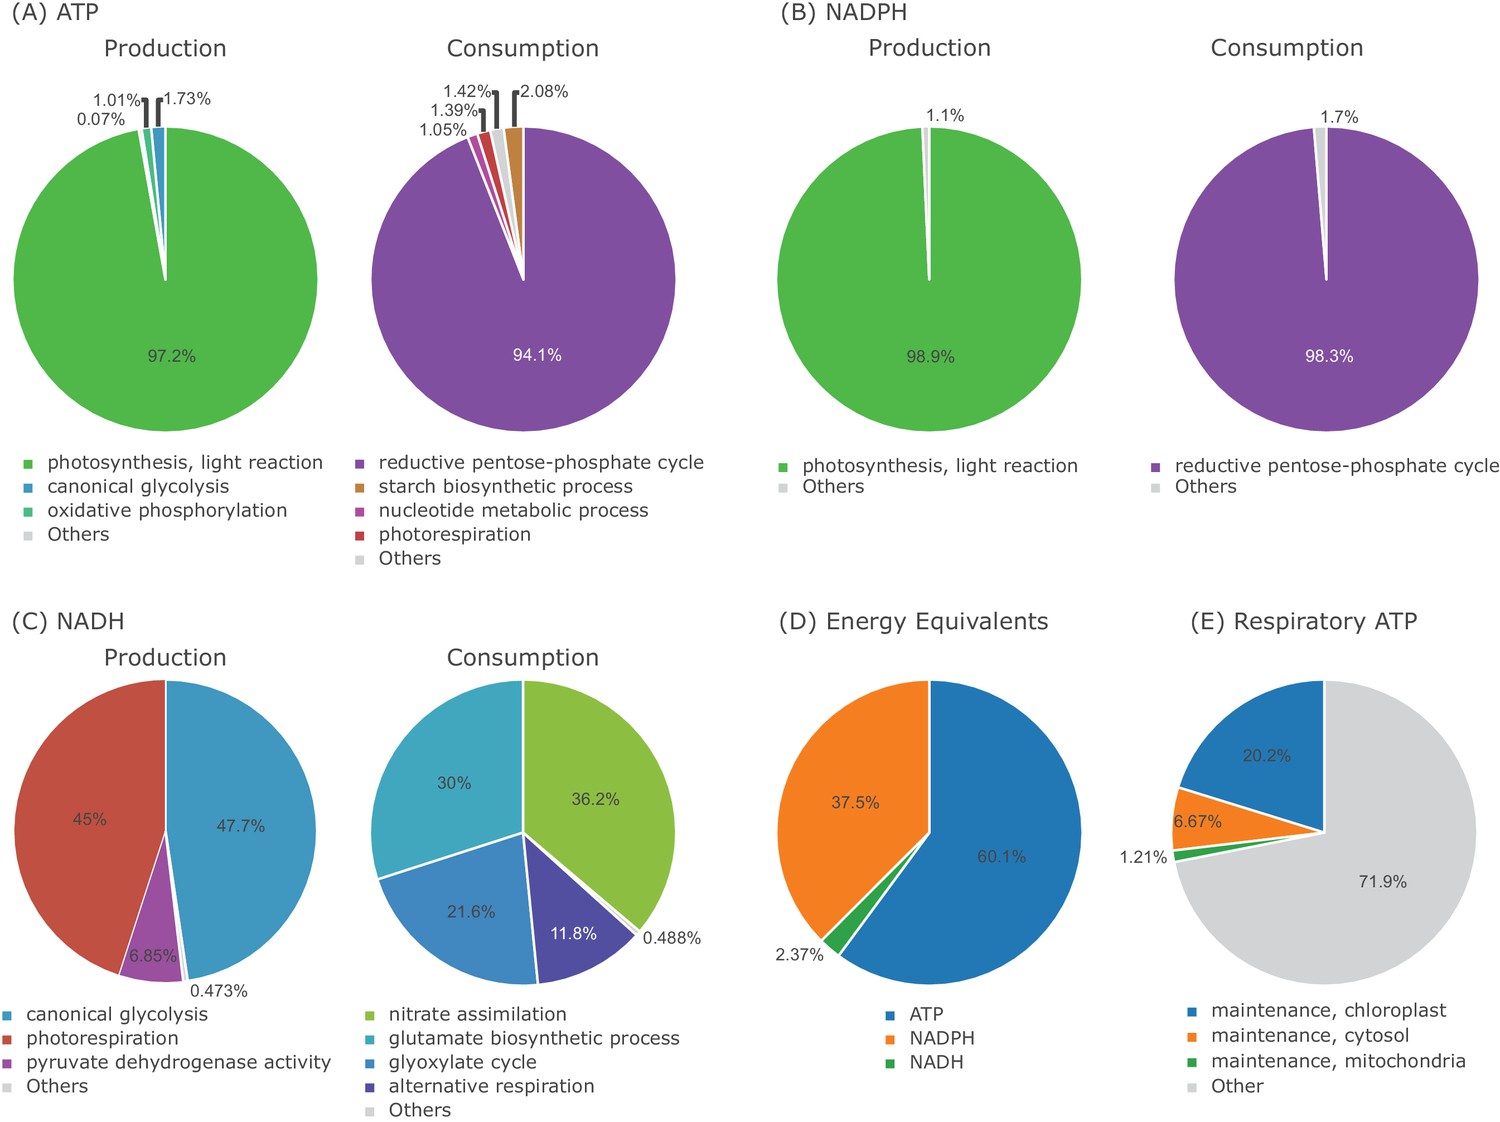
Energy Flux Distribution in the one-cell Model.
(A) ATP production and consumption, (B) NADPH production and consumption, (C) NADH production and consumption, (D) proportion of ATP, NADPH, NADH used as energy equivalent, (E) proportion of respiratory ATP used for maintenance.
Figure 2
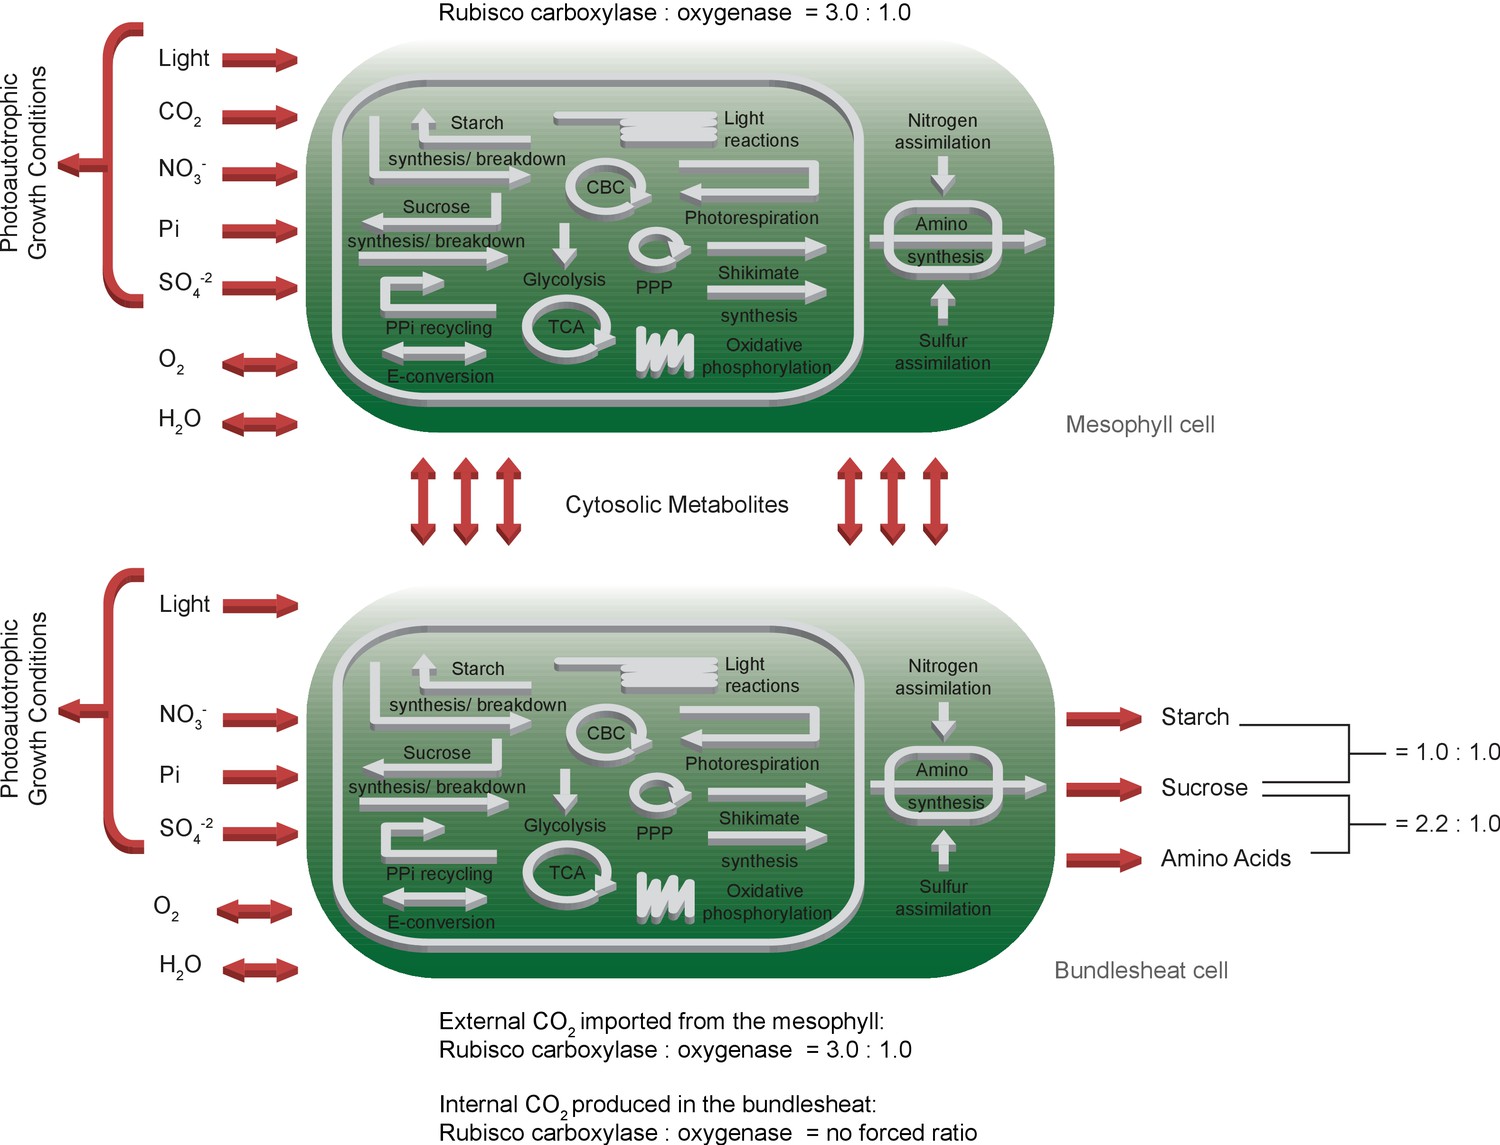
Schematic representation of the primary subsystems in the two-cell model and the used input/output constraints; adapted from Arnold and Nikoloski (2014).
Figure 3 with 1 supplement
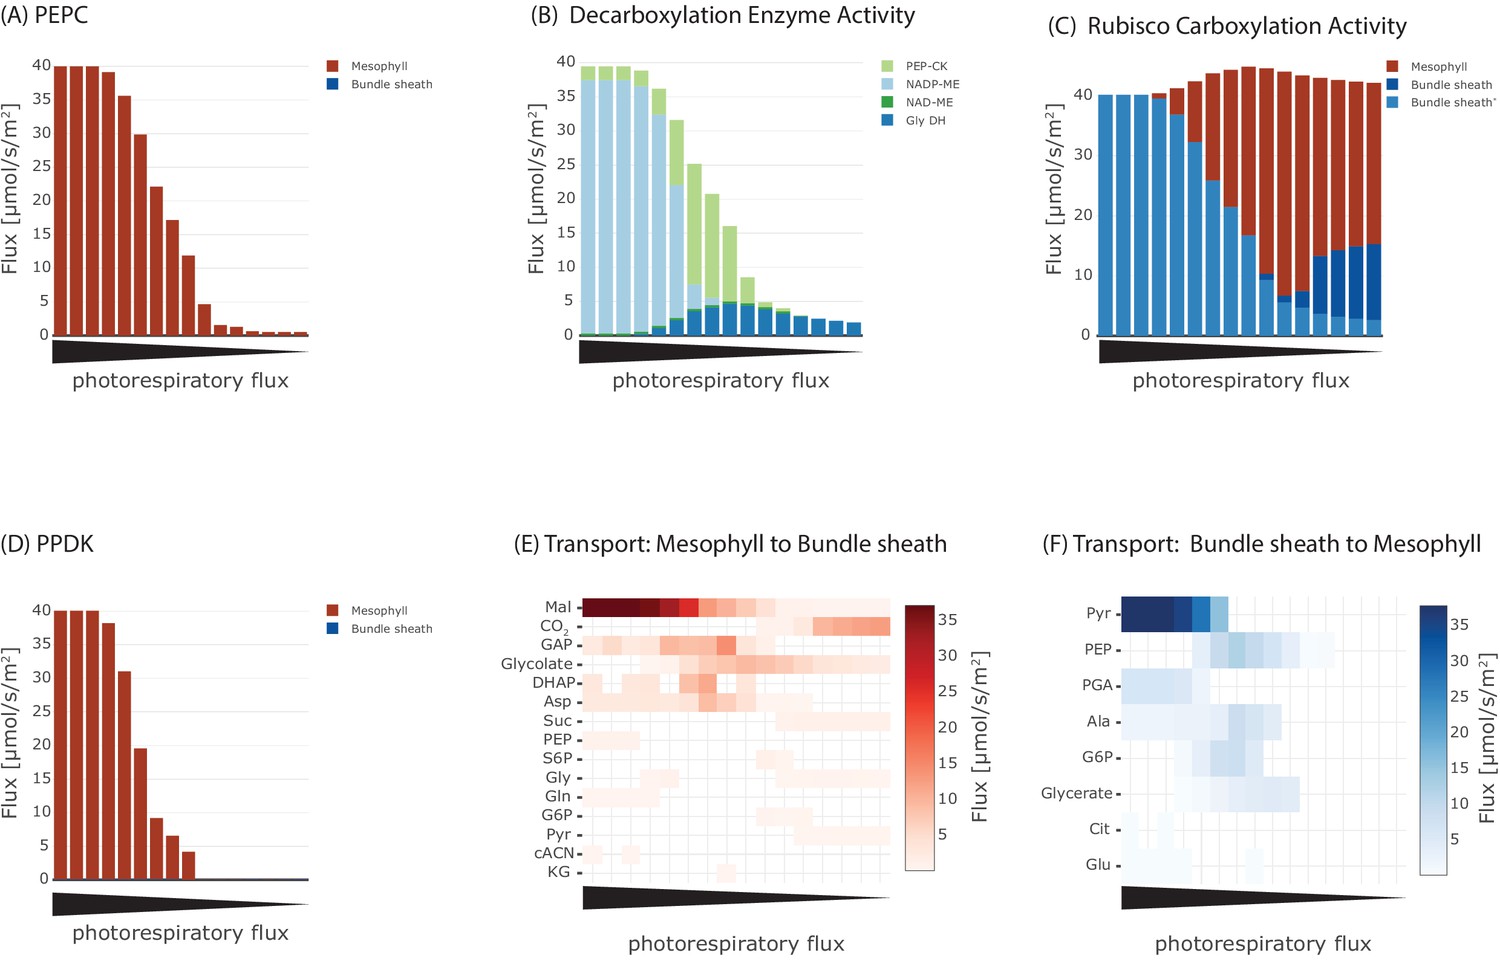
Effect of oxygenation : carboxylation ratio on the major steps in C4 cycle, including (A) activity of phosphoenolpyruvate carboxylase (PEPC), (B) metabolite transport to the bundle sheath, (C) activity of Rubisco, (D) activity of the decarboxylation enzymes, (E) metabolite transport to the mesophyll, and (F) activity of pyruvate phosphate dikinase (PPDK).
-
Figure 3—source code 1
Jupyter notebook - Analysing the effect of oxygenation : carboxylation ratio on the emergence of the C4 cycle.
- https://cdn.elifesciences.org/articles/49305/elife-49305-fig3-code1-v3.ipynb
Figure 3—figure supplement 1
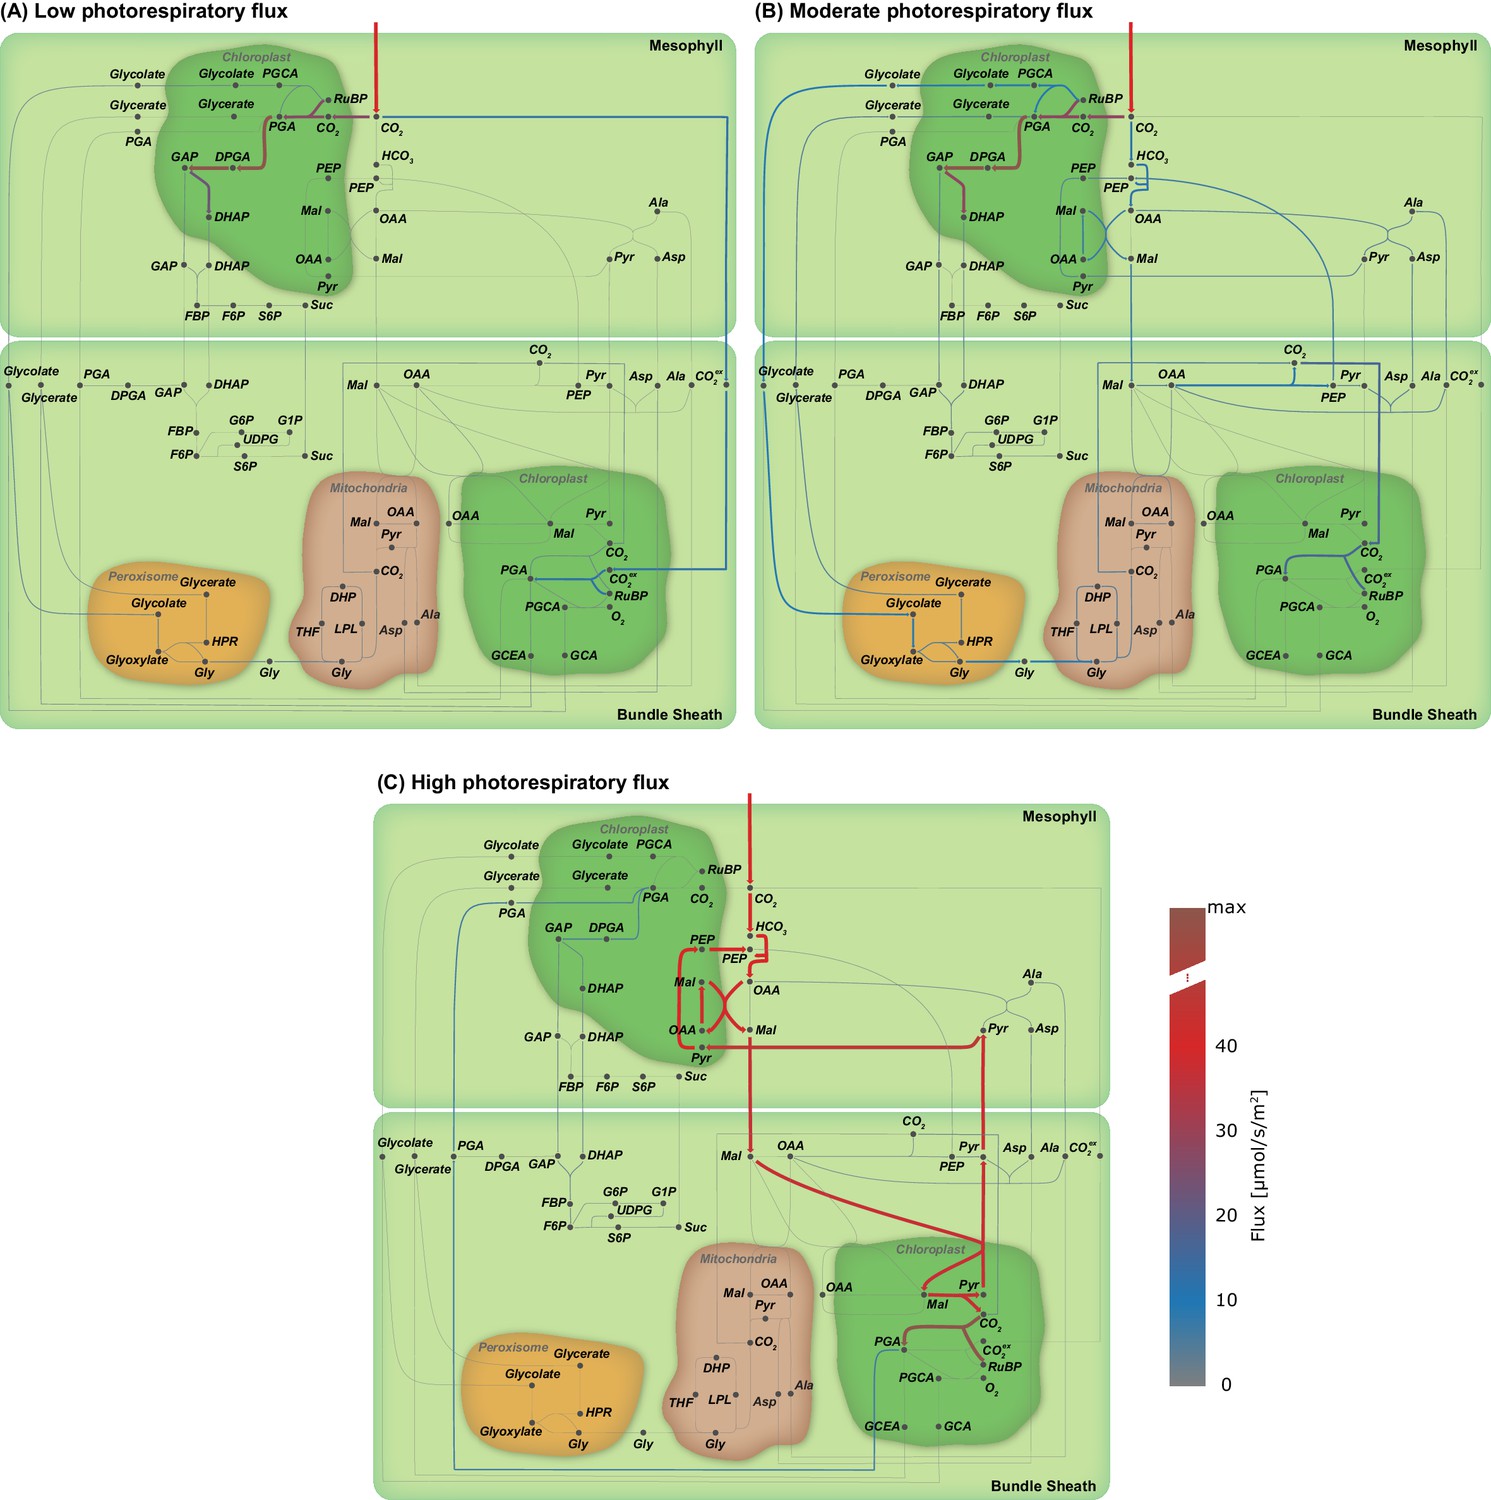
Flux maps illustrating the effect of the oxygenation : carboxylation ratio of Rubisco on the C3-C4 trajectory.
Flux maps illustrating the effect of the proportion of photorespiratory flux through Rubisco. (A) Low photorespiratory flux; (B) Moderate photorespiratory flux; and (C) High photorespiratory flux. (Arc width and colour are set relative to flux values in , grey arcs - no flux).
Figure 4
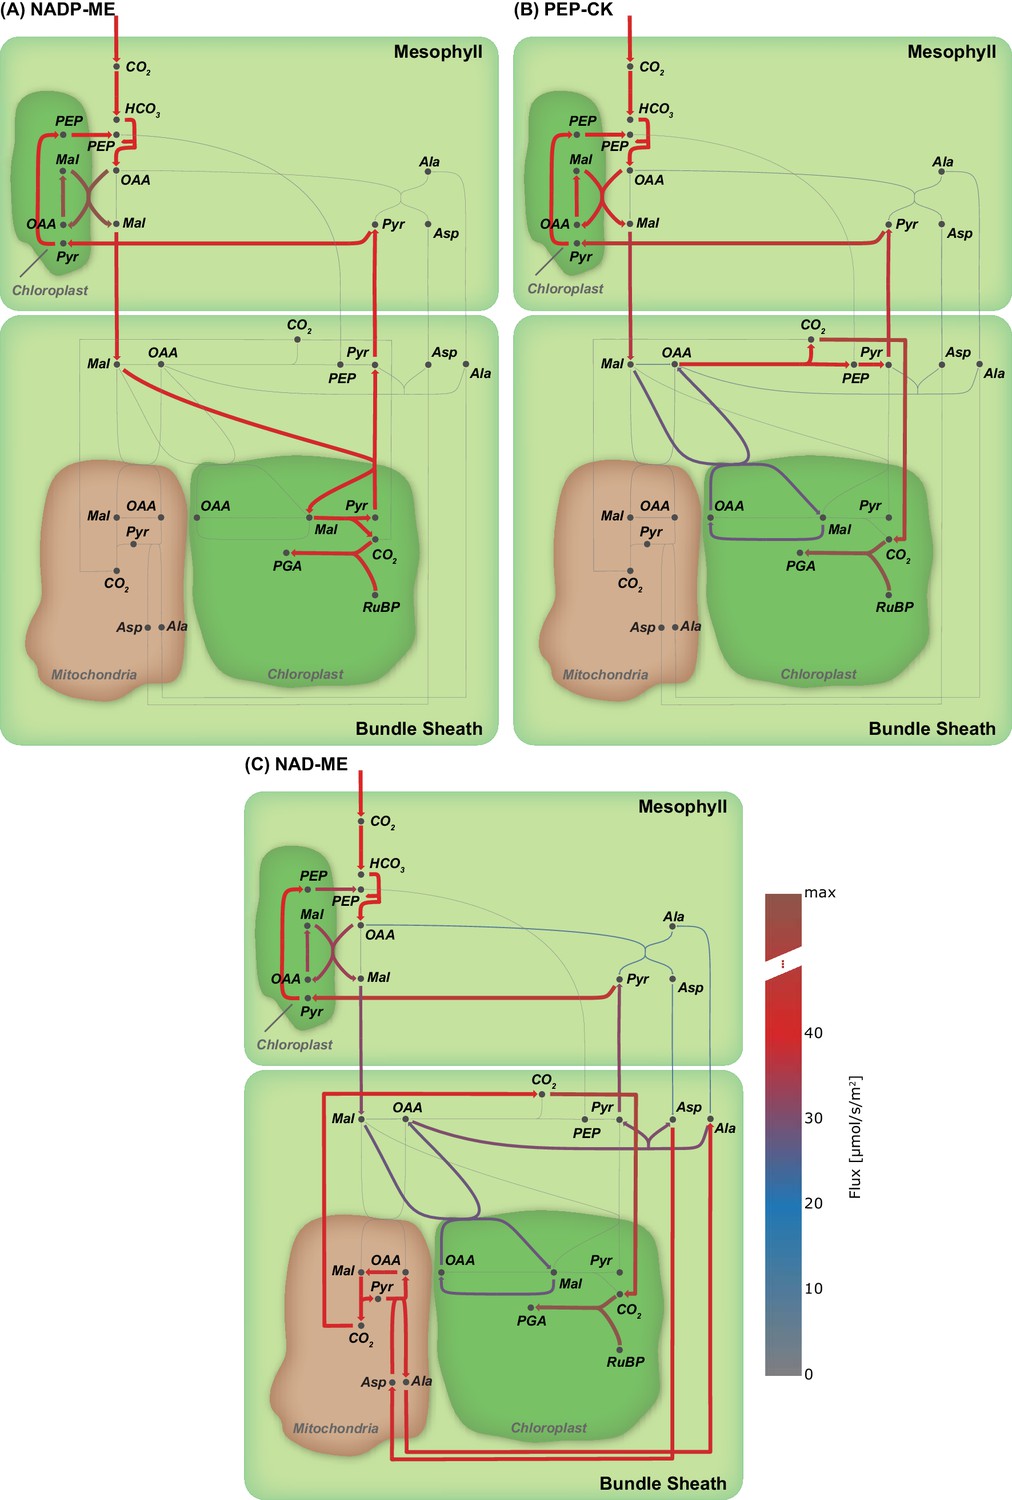
Flux maps illustrating the effect of the C4 mode.
(A) NADP-ME, (B) PEP-CK, (C) NAD-ME. (Arc width and colour are set relative to flux values in , grey arcs - no flux).
-
Figure 4—source code 1
Jupyter notebook - Effect of C4 mode on the emergence of the C4 cycle.
- https://cdn.elifesciences.org/articles/49305/elife-49305-fig4-code1-v3.ipynb
Figure 5

Flux variability analysis of metabolite exchange with 1.5% deviation of the total flux minimum.
The upper bar defines the maximum exchange flux, while the lower bar defines the minimum exchange flux, points indicate the value of the original flux solution under minimal metabolic effort constraint. Positive flux values correspond to the transport direction from mesophyll to bundle sheath, negative values to the transport direction from bundle sheath to mesophyll, see also Figure 4—source code 1.
Figure 6 with 1 supplement

Effect of light on the C4 mode.
(A) CO2 uptake rate in dependence of the total PPFD, (B) Heat-maps illustrating the activity of the decarboxylation enzymes PEP-CK, NADP-ME, and NAD-ME relative to the CO2 uptake rate in dependence of the total PPFD and the photon distribution among mesophyll and bundle sheath.
-
Figure 6—source code 1
Jupyter notebook - Effect of light on the C4 mode.
- https://cdn.elifesciences.org/articles/49305/elife-49305-fig6-code1-v3.ipynb
-
Figure 6—source code 2
Jupyter notebook - Effect of NO3- limitation on the C4 mode.
- https://cdn.elifesciences.org/articles/49305/elife-49305-fig6-code2-v3.ipynb
-
Figure 6—source code 3
Jupyter notebook - Effect of H2O limitation on the C4 mode.
- https://cdn.elifesciences.org/articles/49305/elife-49305-fig6-code3-v3.ipynb
-
Figure 6—source code 4
Jupyter notebook - Effect of CO2 limitation on the C4 mode.
- https://cdn.elifesciences.org/articles/49305/elife-49305-fig6-code4-v3.ipynb
-
Figure 6—source code 5
Jupyter notebook - Effect of malate : aspartate transport ratio on the C4 mode.
- https://cdn.elifesciences.org/articles/49305/elife-49305-fig6-code5-v3.ipynb
Figure 6—figure supplement 1
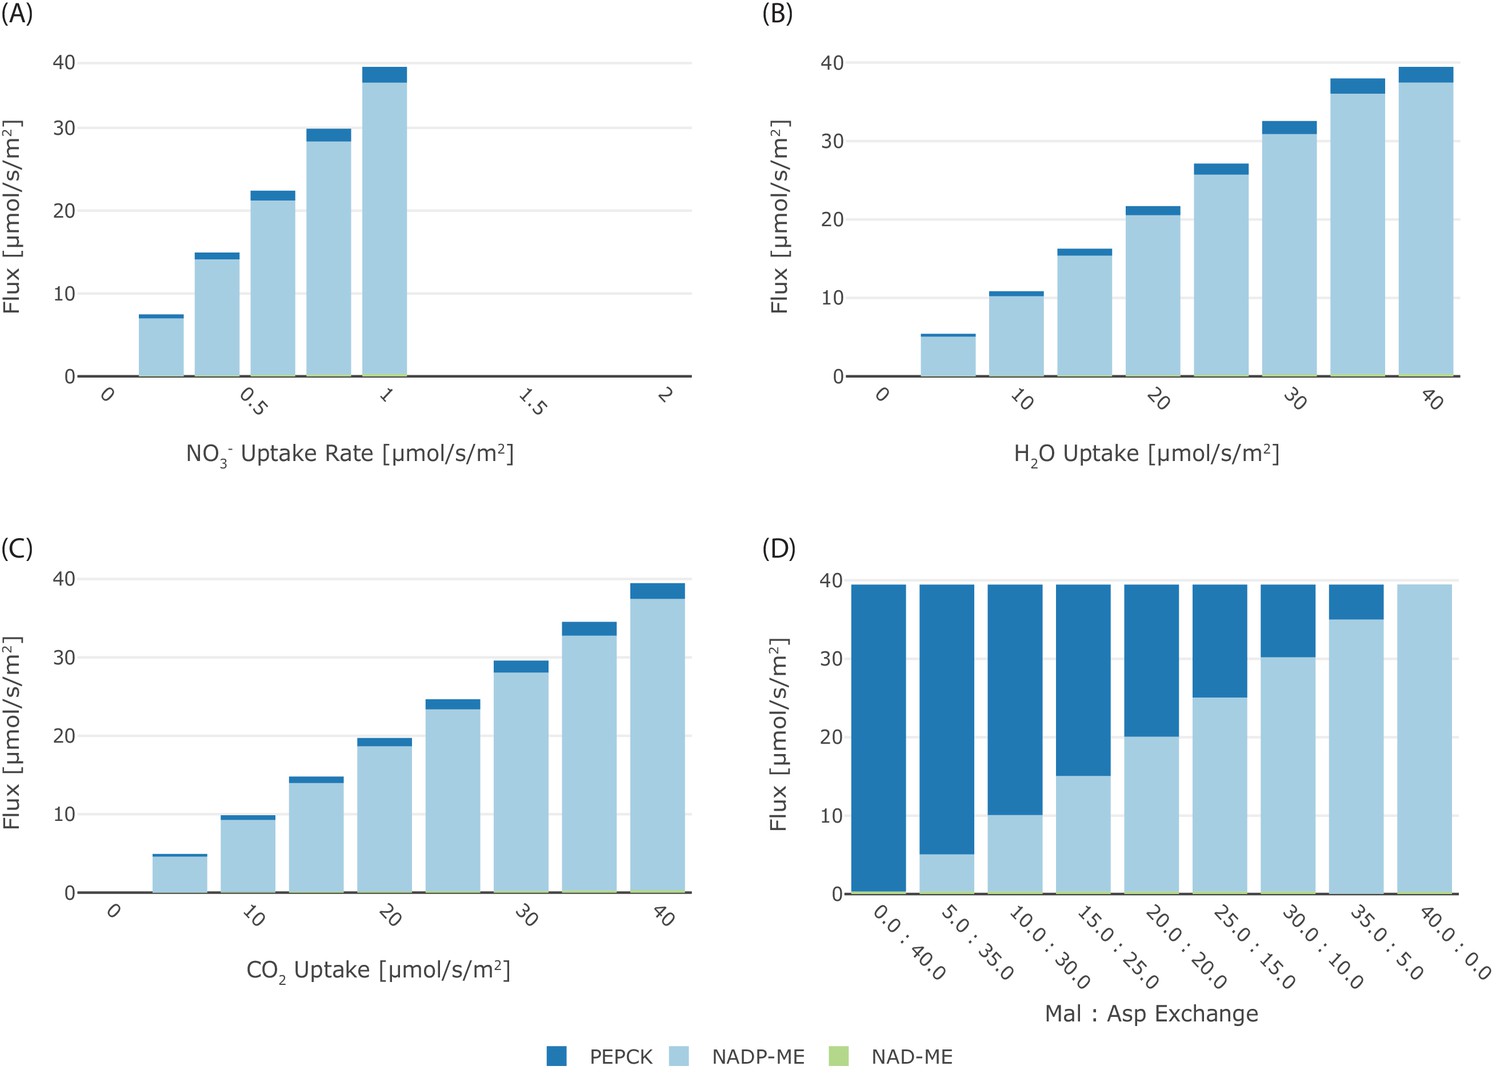
Effect of other relevant factors on the C4 mode.
Effect of (A) NO3-, (B) H2O, and (C) CO2 limitation on the flux through the different decarboxylation enzymes, with each enzymes coded in color (blue PEPCK, light blue NADP-ME, and green NAD-ME); (D) effect of malate:aspartate transport ratio on the flux through the different decarboxylation enzymes with each enzymes coded in color (blue PEPCK, light blue NADP-ME, and green NAD-ME).
Tables
Table 1
Curation of the Arabidopsis core model from Arnold and Nikoloski (2014).
| Arabidopsis core model | Observation | one-cell model | Reference |
|---|---|---|---|
| NADP-dependent malate dehydrogenases in all compartments | cycles through nitrate reductase to interconvert NAD and NADP | NAD-dependent malate dehydrogenases in all compartments, NADP-dependent malate dehydrogenase only in chloroplast | (Swarbreck et al., 2008) |
| Cyclic electron flow | absence of cyclic electron flow | added | (Shikanai, 2016) |
| Alternative oxidase | missing alternative routes for electrons to pass the electron transport chain to reduce oxygen | added alternative oxidase reactions to the chloroplast and mitochondria | (Vishwakarma et al., 2015) |
| Alanine transferase | No alanine transferase in cytosol Alanine transferase | added | (Liepman and Olsen, 2003) |
| Transport chloroplast | no maltose transporter by MEX1 | added | (Linka and Weber, 2010) |
| no glucose transporter by MEX1 and pGlcT MEX1 | added | ||
| no unidirectional transport of ATP, ADP, AMP by BT-like | added | ||
| no Mal/OAA, Mal/Pyr, and Mal/Glu exchange by DiTs | added | ||
| no folate transporter by FBT and FOLT1 | added | ||
| Transport Mitochondria | no Mal/OAA, Cit/iCit, Mal/KG exchange by DTC | added | (Linka and Weber, 2010) |
| no H+ importer by UCPs import | added | ||
| no OAA/Pi exchange by DIC1-3 | added | ||
| no ATP/Pi exchange by APCs | added | ||
| no NAD/ADP and NAD/AMP exchange by NDT2 | added | ||
| no ThPP/ATP exchange by TPCs | added | ||
| no Asp/Glu by AGCs | added | ||
| no uncoupled Ala exchange | added | ||
| Transport peroxisome | missing NAD/NADH, NAD/ADP, NAD/AMP exchange by PXN | added | (Linka and Weber, 2010) |
| no ATP/ADP and ATP/AMP exchange by PNCs | added | ||
| H+ sinks/sources | H+ sinks/source reaction for the cytosol and futile transport cycles introduced by H+ -coupled transport reactions | H+ sinks/source reaction added for each compartment | |
| ATPase stoichiometry | False H+/ATP ratios for the plastidal and mitochondrial ATP synthase | H+/ATP ratio set to 3 : 1 (chloroplast) and 4:1 (mitochondria) | (Petersen et al., 2012; Turina et al., 2016) |
| Alanine/aspartate transferase | no direct conversion of alanine and aspartate | added to cytosol, chloroplast and mitochondria | (Schultz and Coruzzi, 1995; Duff et al., 2012) |
Table 2
Input/output fluxes of one-cell model in comparison to physiological observations.
| Molecular Species | Flux [µmol/(m2/s)] | Physiological Range [µmol/(m2/s)] | Reference |
|---|---|---|---|
| (i) Inputs | |||
| Photons | 193.7 | 100 - 400 | Bailey et al. (2001) |
| CO2 | 20 | 20 | Lacher (2003) |
| NO3- | 0.5 | 0.11 - 0.18 | Kiba et al. (2012) |
| H2O | 18.2 | - | |
| (ii) Outputs | |||
| O2 | 20.9 | 16.5 | Sun et al. (1999) |
| Amino Acids | 0.3 | - | |
| Sucrose/Starch | 0.8 | - |
-
Note: CO2 has one carbon per molecule while Sucrose has 12. Starch is configured to have the same number of carbons compared to sucrose while amino acids on average have 5.5 carbons.
Table 3
Flux boundary constraints of Im-/export reactions
| Input (Reaction ID) | Flux [μmol/(m2s)] | |
|---|---|---|
| Lower bound | Upper bound | |
| Photons (Im_hnu) | 0 | inf |
| C02 (Im_CO2) | 0 | 20 |
| NO3- (Im_NO3) | 0 | inf |
| NH4+ (Im_NH4) | 0 | 0 |
| SO42- (Im_SO4) | 0 | inf |
| H2S (Im_H2S) | 0 | inf |
| Pi | 0 | inf |
| H2O (Im_H2O) | -inf | inf |
| O2 (Im_O2) | -inf | inf |
| Amino Acids (Ex_AA) | 0 | inf |
| Surcose (Ex_Suc) | 0 | inf |
| Starch (Ex_starch) | 0 | inf |
| Other export reactions | 0 | 0 |
-
-inf/inf is approximated by −106 / 106
Table 4
Maintenance costs by compartment
| Compartment | Flux [μmol/(m2s)] |
|---|---|
| cytosol | 0.0427 |
| chloroplast | 0.1527 |
| mitochondria | 0.0091 |
| peroxisome | 0.0076 |
Additional files
Download links
A two-part list of links to download the article, or parts of the article, in various formats.
Downloads (link to download the article as PDF)
Open citations (links to open the citations from this article in various online reference manager services)
Cite this article (links to download the citations from this article in formats compatible with various reference manager tools)
Evolution of C4 photosynthesis predicted by constraint-based modelling
eLife 8:e49305.
https://doi.org/10.7554/eLife.49305


