Kinetics of cytokine receptor trafficking determine signaling and functional selectivity
- University of Dundee, United Kingdom
- Purdue University, United States
- University of Osnabrück, Germany
- Otto-von-Guericke-University Magdeburg, Germany
- INSERM UMR-S-11721, Centre de Recherche Jean-Pierre Aubert (JPARC), Institut pour la Recherche sur le Cancer de Lille (IRCL), Université de Lille, France
Figures
Figure 1 with 1 supplement
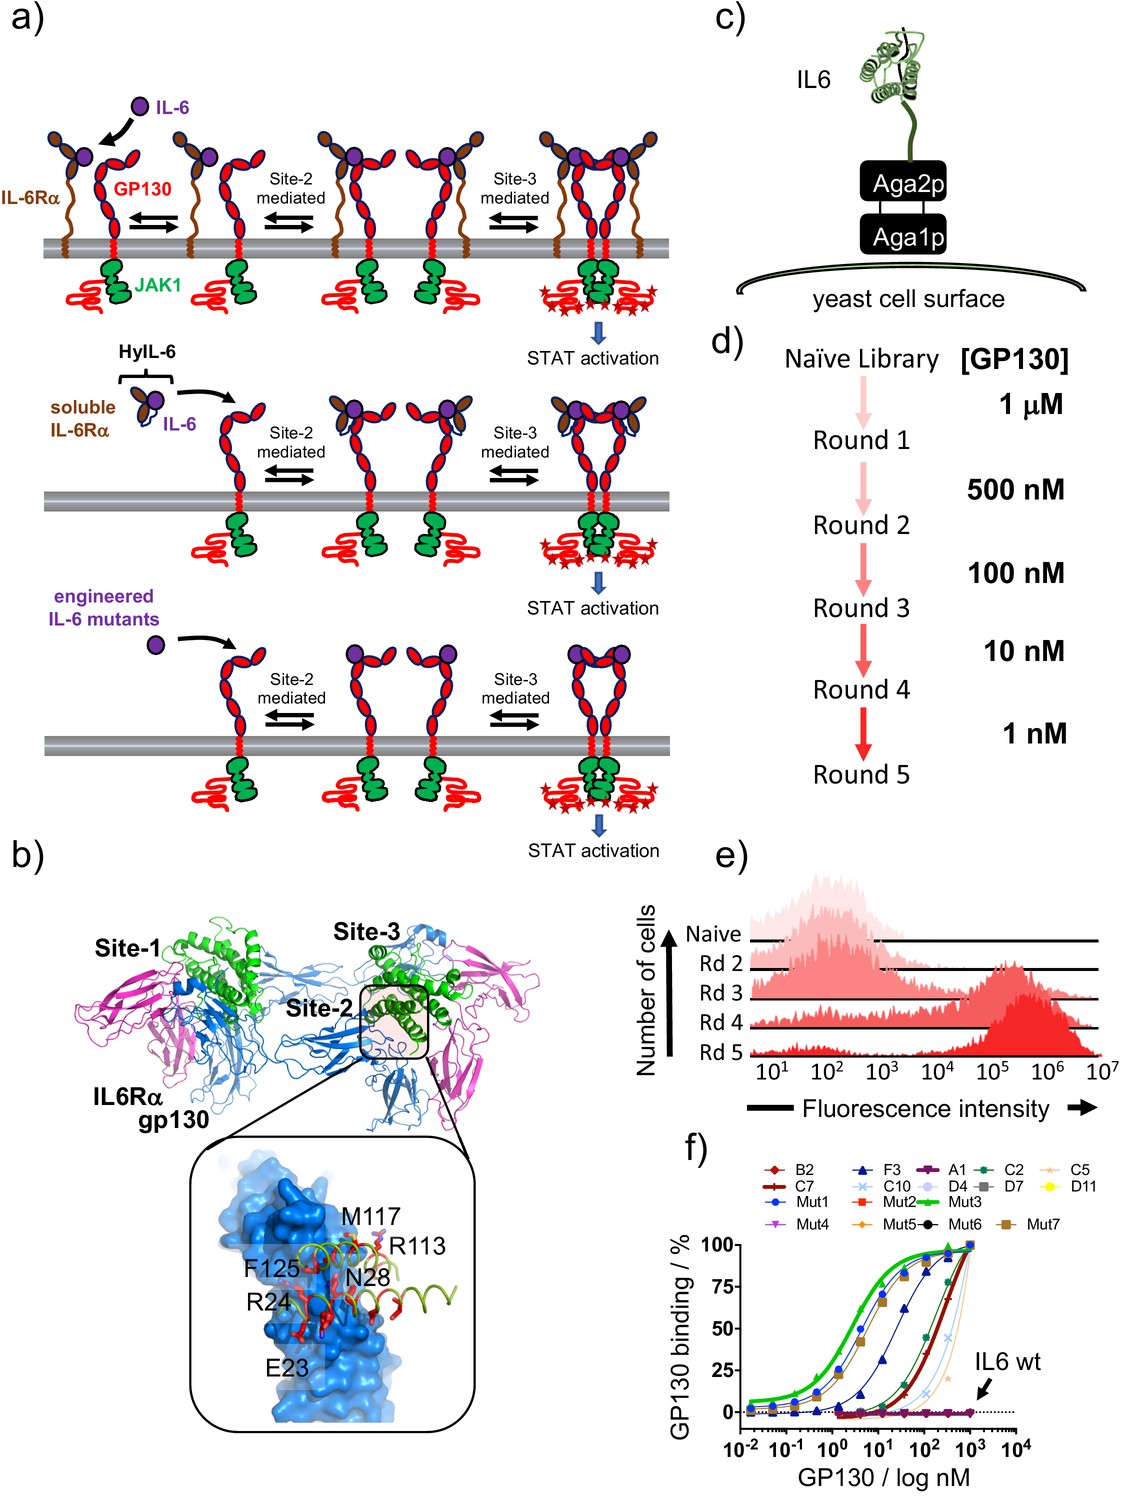
Isolation of IL-6 variants binding gp130 with different affinities.
(a) Schematic representation of IL-6 receptor assembly kinetics elicited by IL-6 wildtype (top panel), HyIL-6 (middle panel) and IL-6 mutants molecules (bottom panel). (b) Crystal structure of IL-6, in green, bound to gp130 and IL-6Rα ectodomains, in blue and pink respectively. Inlet highlights the IL-6/gp130 site-2 binding interface. Amino acids included in the library design are colored in red. (c) Schematic representation of IL-6 display in the yeast surface via aga2p-aga1p interaction. (d) Work-flow of IL-6 library selection process. Five rounds of selection were undertaken, starting with 1 μM of gp130 ectodomain and finishing with 1 nM. (e) Representative gp130 staining of the selected IL-6 library. The five rounds of selections were incubated with 1 μM of biotinylated gp130 for 1 hr followed by 15 min incubation with SA-alexa647. Early rounds exhibit weak binding to gp130, but as the library converged into few high affinity clones, the gp130 staining improve significantly. (f) Dose/Response gp130 binding curves performed in single yeast colonies, each encoding a different IL-6 variant. Gp130 concentration started at 1 μM, and eight different concentrations in a 1/3 dilution series were tested.
Figure 1—figure supplement 1
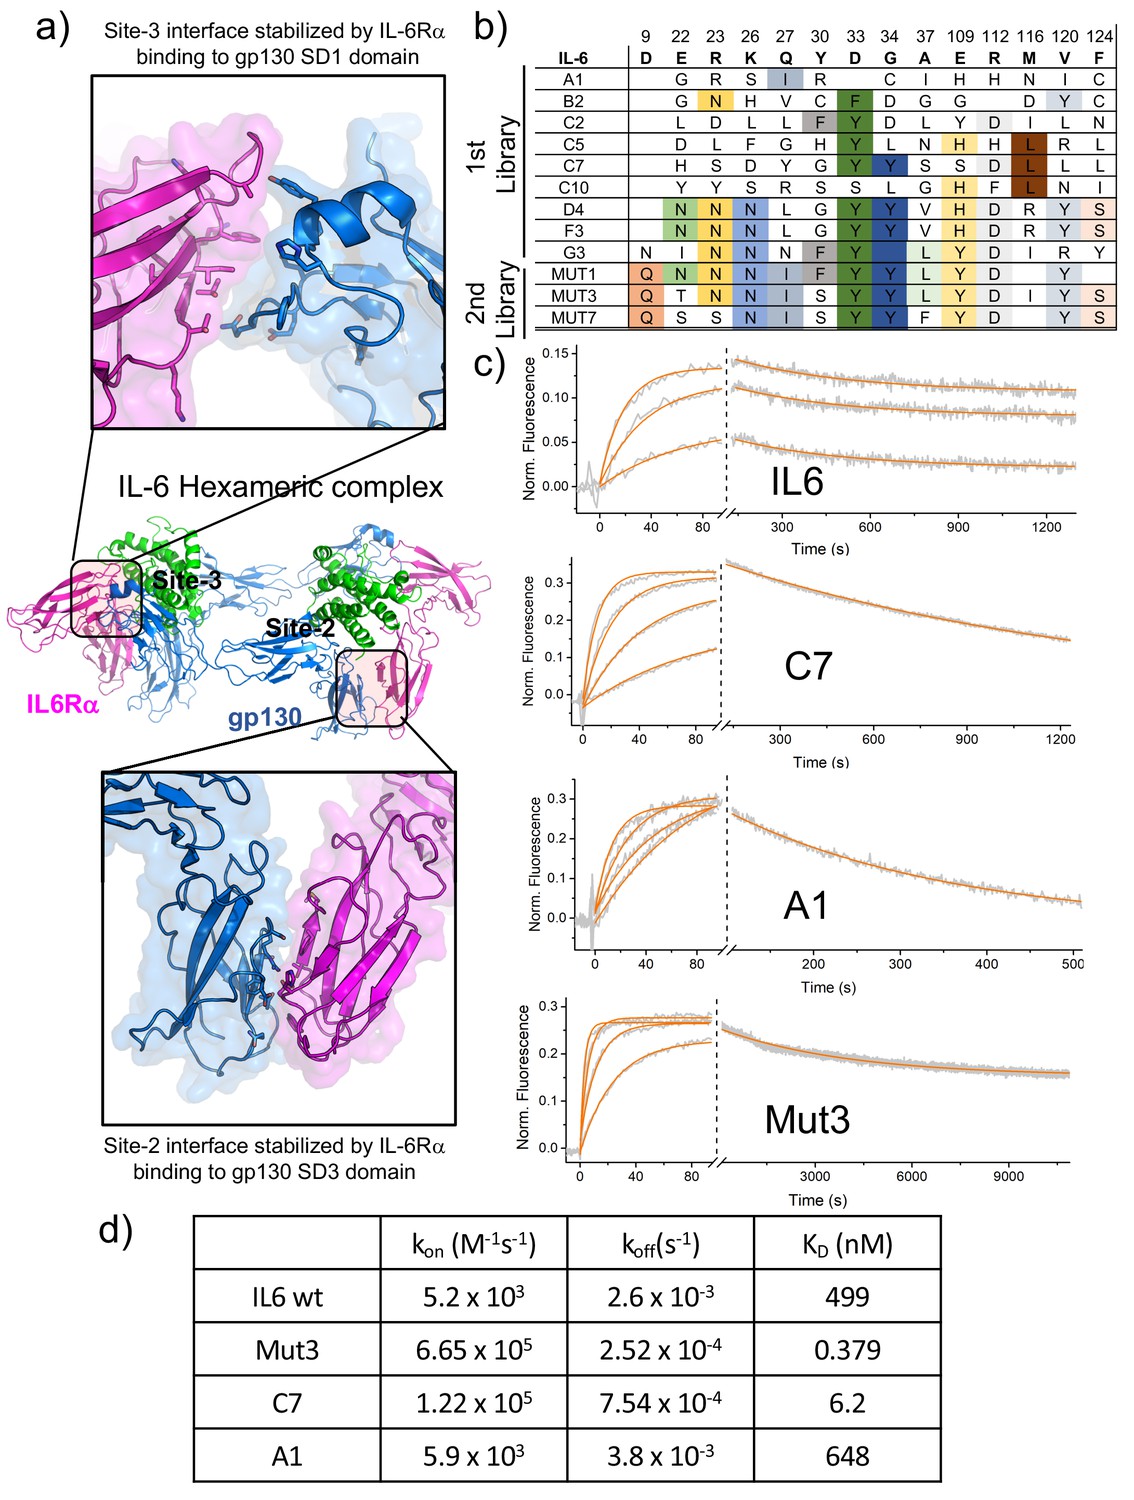
Biophysical characterization of IL-6 variants.
(a) Blow out of the site-2 (bottom panel) and site-3 (top panel) binding interface of the IL-6 hexameric complex. IL-6Rα and gp130 exhibits extensive contacts across both interfaces. (b) Amino acid sequences corresponding to isolated IL-6 variants. Variants from early rounds are displayed on the top of the table and exhibit a wider range of mutations. As the library converges, fewer unique sequences are found, with all of them exhibiting similar mutations as at the bottom of the table. (c) Switchsense binding sensograms for the different IL-6 ligands. Gp130 was loaded onto the chip and different concentrations of the indicated IL-6 ligands were injected. The binding constant values were estimated by fitting a pseudo first-order kinetic model. (d) Table illustrating Kon, Koff and KD binding constants obtained from surface plasmon resonance studies for IL-6 wt and Mut3, C7 and A1 IL-6 variants.
Figure 2 with 1 supplement
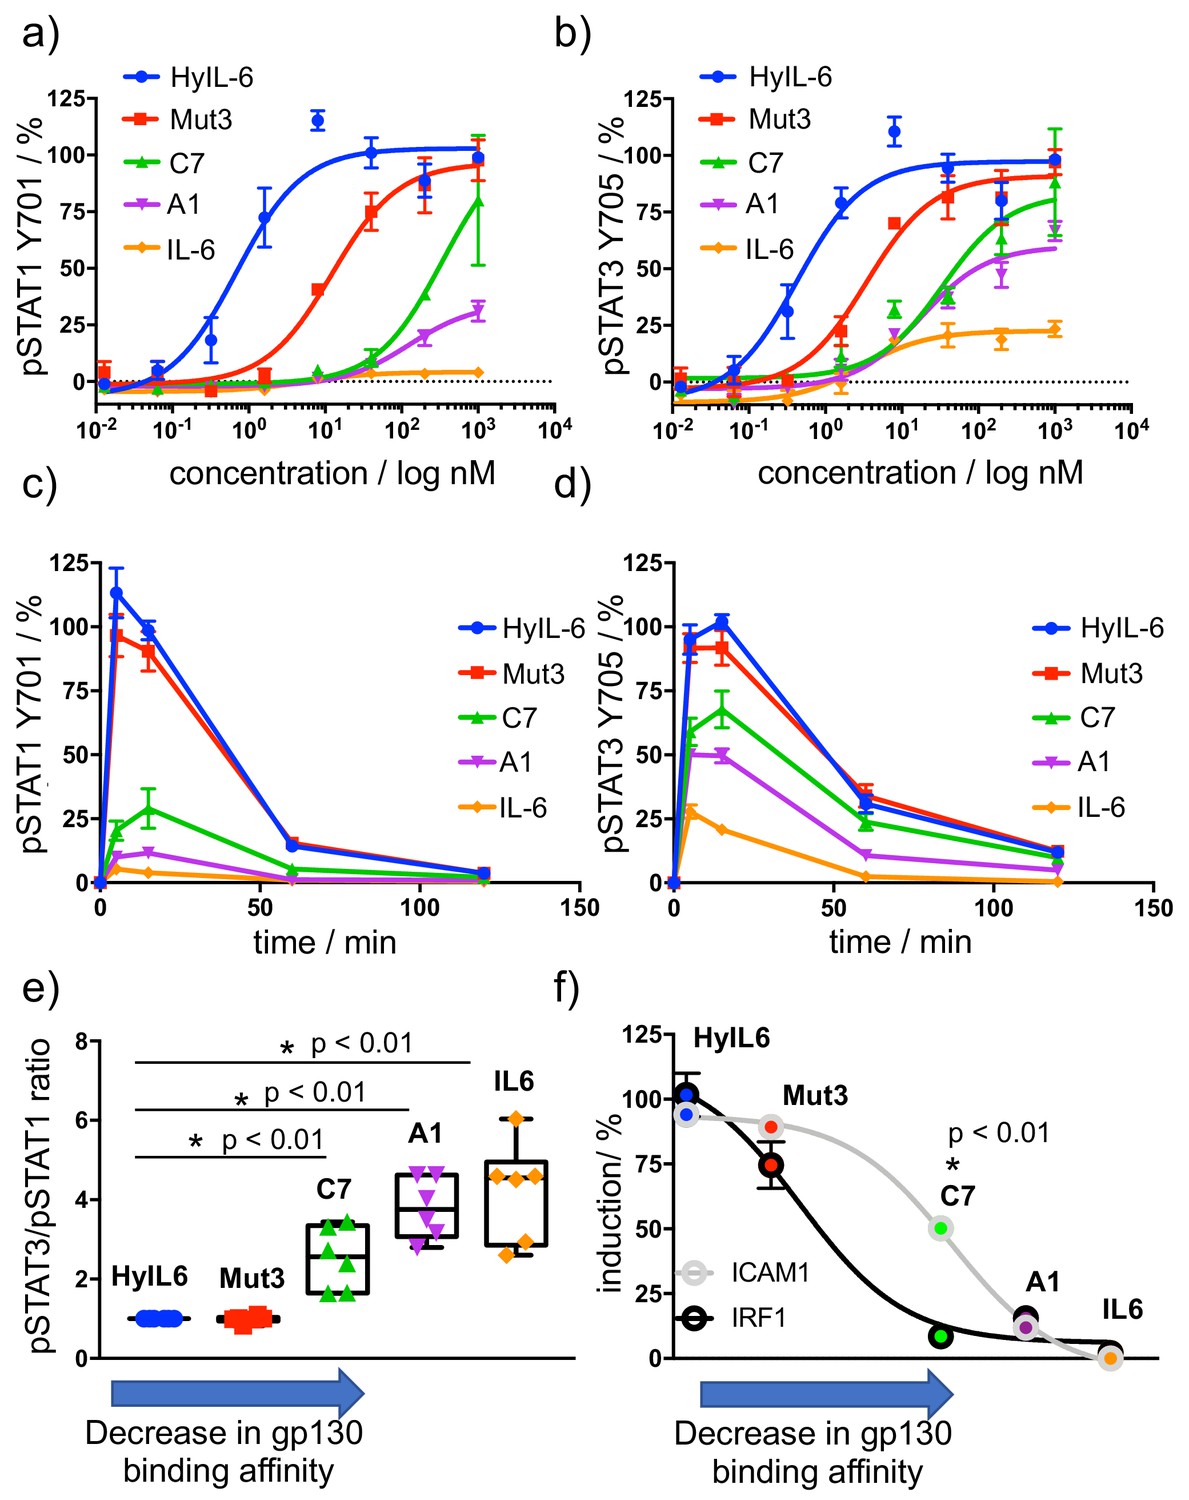
Determination of signaling signatures activated by IL-6 variants.
(a–b) HeLa cells were stimulated with the indicated doses of IL-6 ligands for 15 min and levels of STAT1 (a) and STAT3 (b) were analyzed by phospho-flow cytometry. Sigmoidal curves were fitted with GraphPath Prism software. Data are mean + /- SEM from three independent replicates, each performed in duplicate. (c–d) HeLa cells were stimulated with 100 nM of IL-6 ligands for the indicated times and the levels of STAT1 (c) and STAT3 (d) were analyzed by phospho-Flow cytometry. Data are mean + /- SEM from three independent replicates, each performed in duplicate. (e) Differential STAT activation by engineered IL-6 ligands. pSTAT3/pSTAT1 ratios are plotted for all the IL-6 ligands. An arrow indicating the binding affinity trends of each ligand was placed in the X axis of the plot. Low gp130 affinity ligands exhibit a more pronounced STAT3/STAT1 ratio than high affinity ligands. Data are mean + /- SEM from three independent replicates, each performed in duplicate. (f) Comparison of STAT1- (IRF1) and STAT3- dependent (ICAM1) gene induction by engineered IL-6 ligands. HeLa cells were stimulated with saturating concentrations (100 nM) of the different IL-6 ligands for either 2 hr (IRF1) or 24 hr (ICAM1) and the levels of IRF1 and ICAM1 induction were measured via flow cytometry. Data are mean + /- SEM from three independent replicates, each performed in duplicate. An arrow indicating the binding affinity trends of each ligand was placed in the X axis of the plot.
Figure 2—figure supplement 1
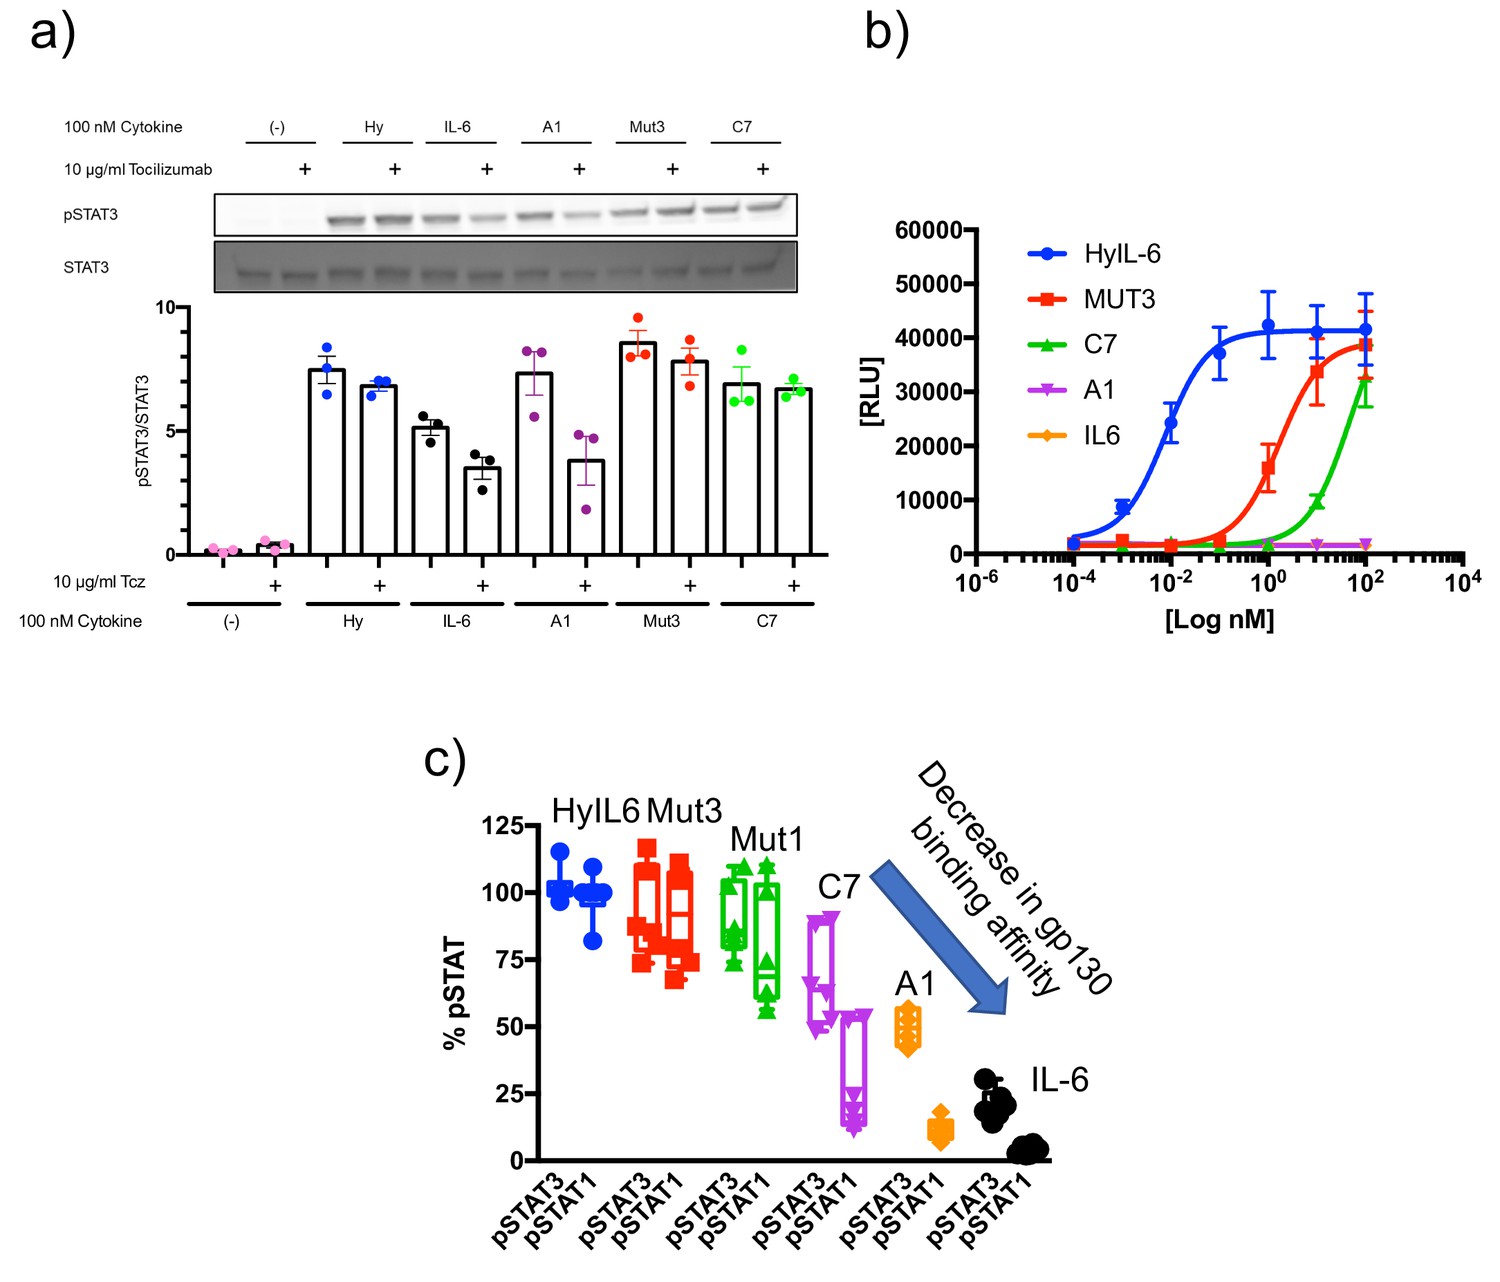
IL-6Rα dependency of the IL-6 variants.
(a) HepG2 cells were pretreated with 10 µg/ml Tocilizumab (Tcz) as indicated for 30 min and then stimulated with 100 nM of the different IL-6 variants for 15 min. Phosphorylation of STAT3 was detected by Western Blot. One representative Western Blot and the quantification of three experiments is shown. (b) Ba/F3-gp130 cells were cultured in the presence of different concentrations of the IL-6 variants for 48 hr. Cell viability was assessed and is shown as relative light units (RLU). One representative experiment out of three with similar outcome is shown. (c) STAT1 and STAT3 activation levels induced by the indicated ligands in HeLa cells after 15 min stimulation measured by Phospho-Flow cytometry.
Figure 3 with 2 supplements
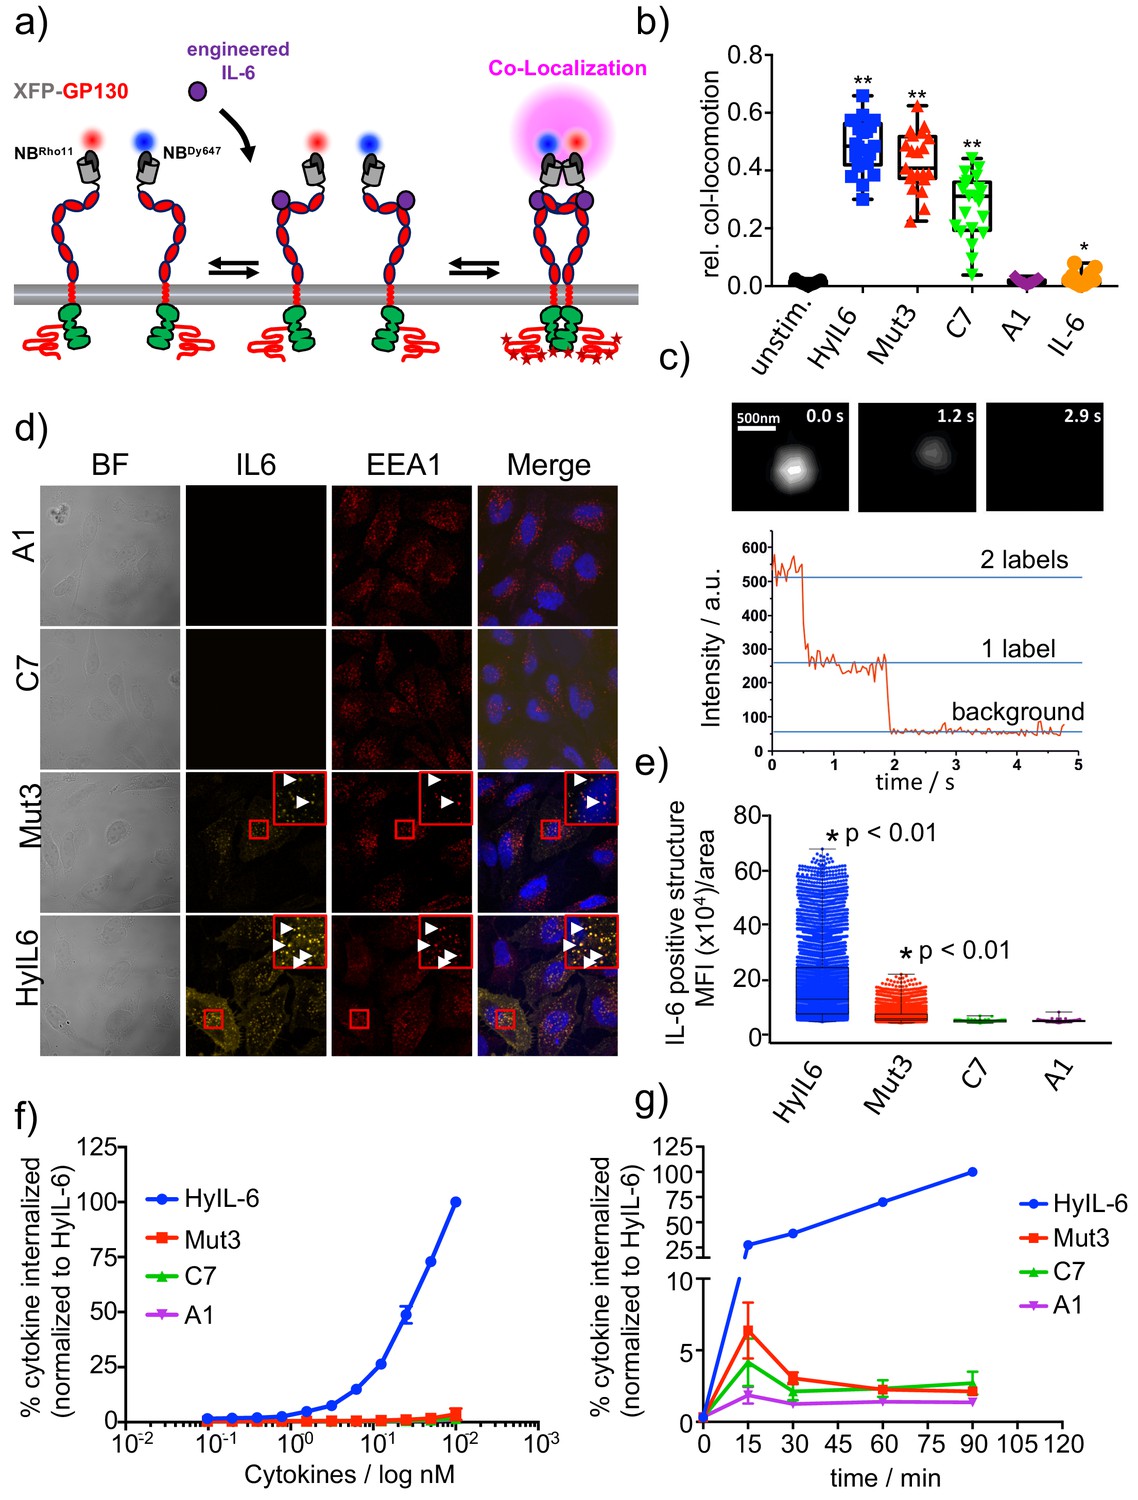
gp130 cell surface dimerization induced by the different IL-6 variants.
(a) Quantification of gp130 homodimerization in the plasma membrane by dual-color single-molecule co-localization/co-tracking. mXFP-gp130 was expressed in RPE1 gp130KO cells and labeled via anti-GFP nanobodies conjugated with RHO11 and DY647, respectively. (b) Relative amount of co-trajectories for unstimulated gp130 and after stimulation with HyIL-6 and IL-6 mutants (Mut3, C7, A1 and IL-6 wt). (c) Single-color dual-step bleaching of a HyIL-6 induced gp130 dimer. (d) Uptake of DY547-conjugated HyIL-6 and IL-6 mutants. HeLa cells, overexpressing gp130 were stimulated for 45 min with 40 nM of each cytokine. Ligand uptake into endosomal structures was co-localized with EEA1. Nuclei were stained with DAPI (blue), shown in the merged image. Co-localization of ligands with EEA1 endosomes are highlighted in the zoomed area. (e) Quantification of Ligand binding/uptake. Mean fluorescence intensity of DY547-conjugated IL-6 variants colocalizing with EEA1 positive structures quantified using the Volocity 3D Image Analysis software (PerkinElmer). (f–g) Quantification of ligand uptake by flow-cytometry. (f) HeLa cells transfected with meGFP-GP130 were incubated with various doses of DY647-conjugated IL-6 variants for 15 min. (g) Kinetics of ligand uptake were measured after incubation with 100 nM of each DY647-conjugated IL-6. For both experimental series, cell surface bound ligands were removed by trypsination prior to flow cytometry. Data was in all cases normalized to HyIL-6 signal intensity.
Figure 3—figure supplement 1
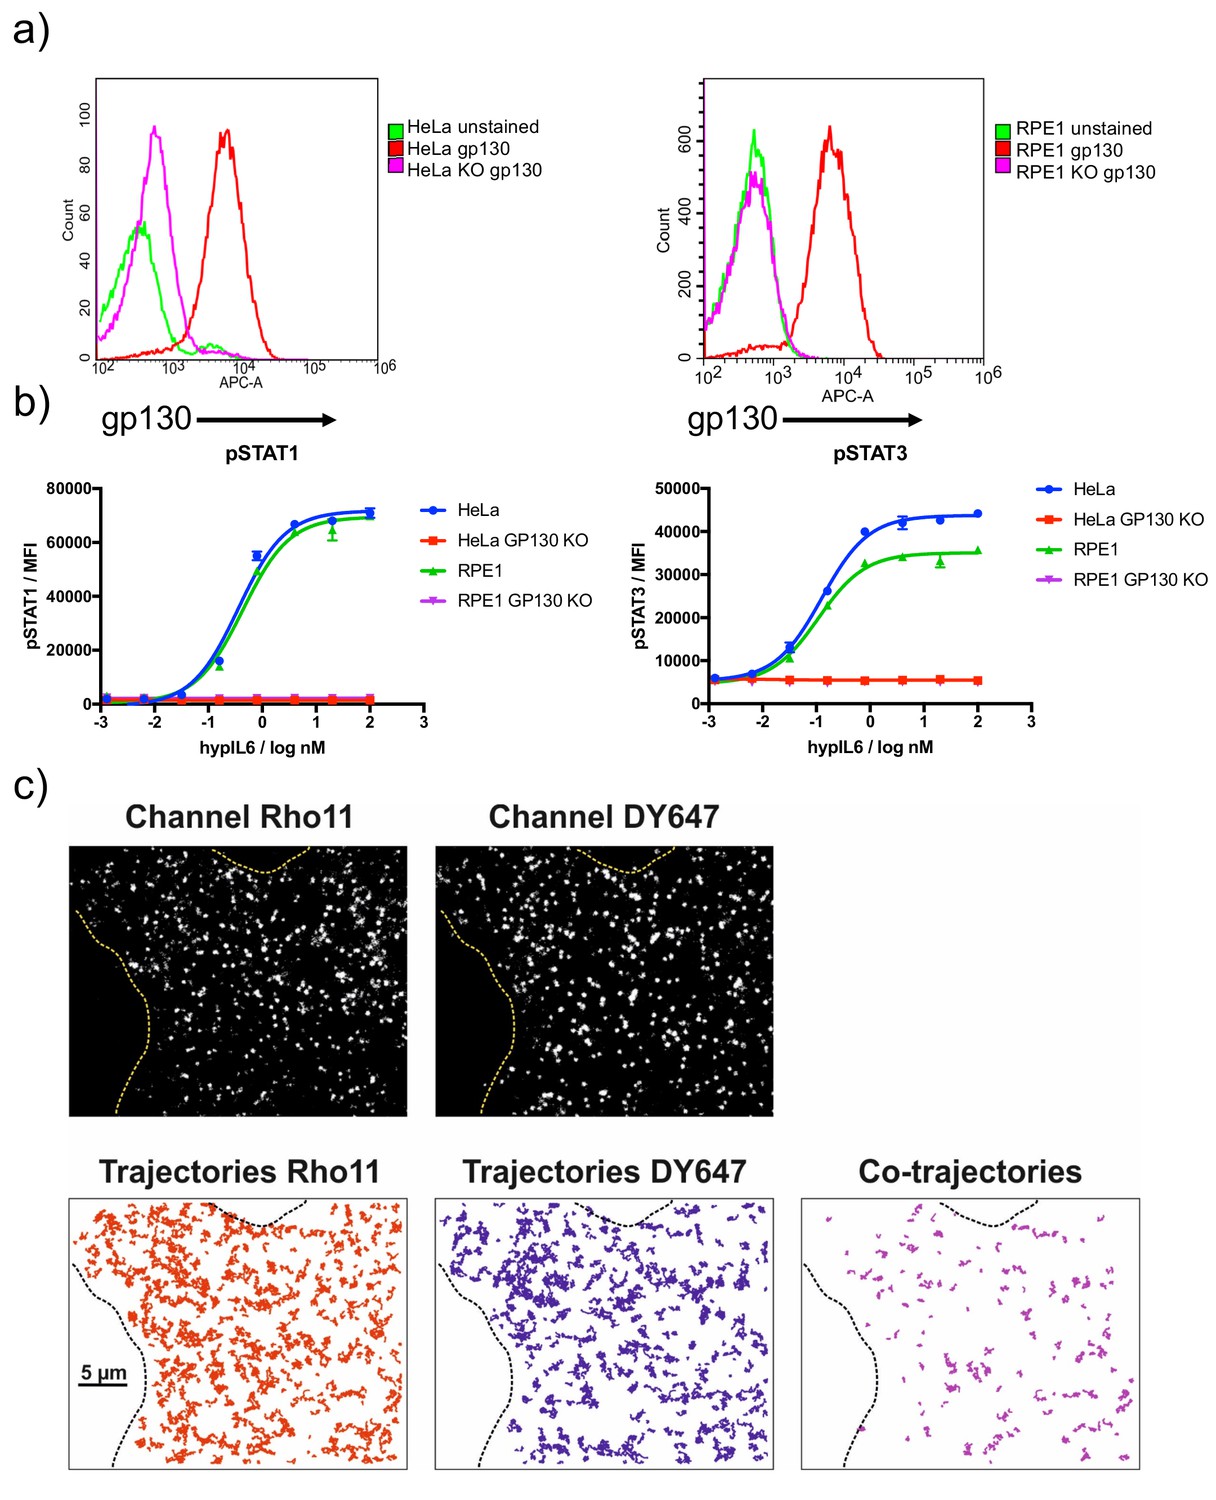
Dimerization of gp130 induced by IL-6 variants.
(a) Characterization of gp130KO HeLa and RPE1 by dose-response experiments with HyIL-6. (b) RPE1 gp130ko cell transfected with XFP-GP130 and cell surface labeled by antiGFP-NBDY647 and antiGFP-NBRHO11. Imaging raw data as well as trajectories (RHO11 and DY647 and co-trajectories) are shown for a representative cell after stimulation with 20 nM HyIL-6. Cell boundaries are outlined by dashed lines.
Figure 3—figure supplement 2
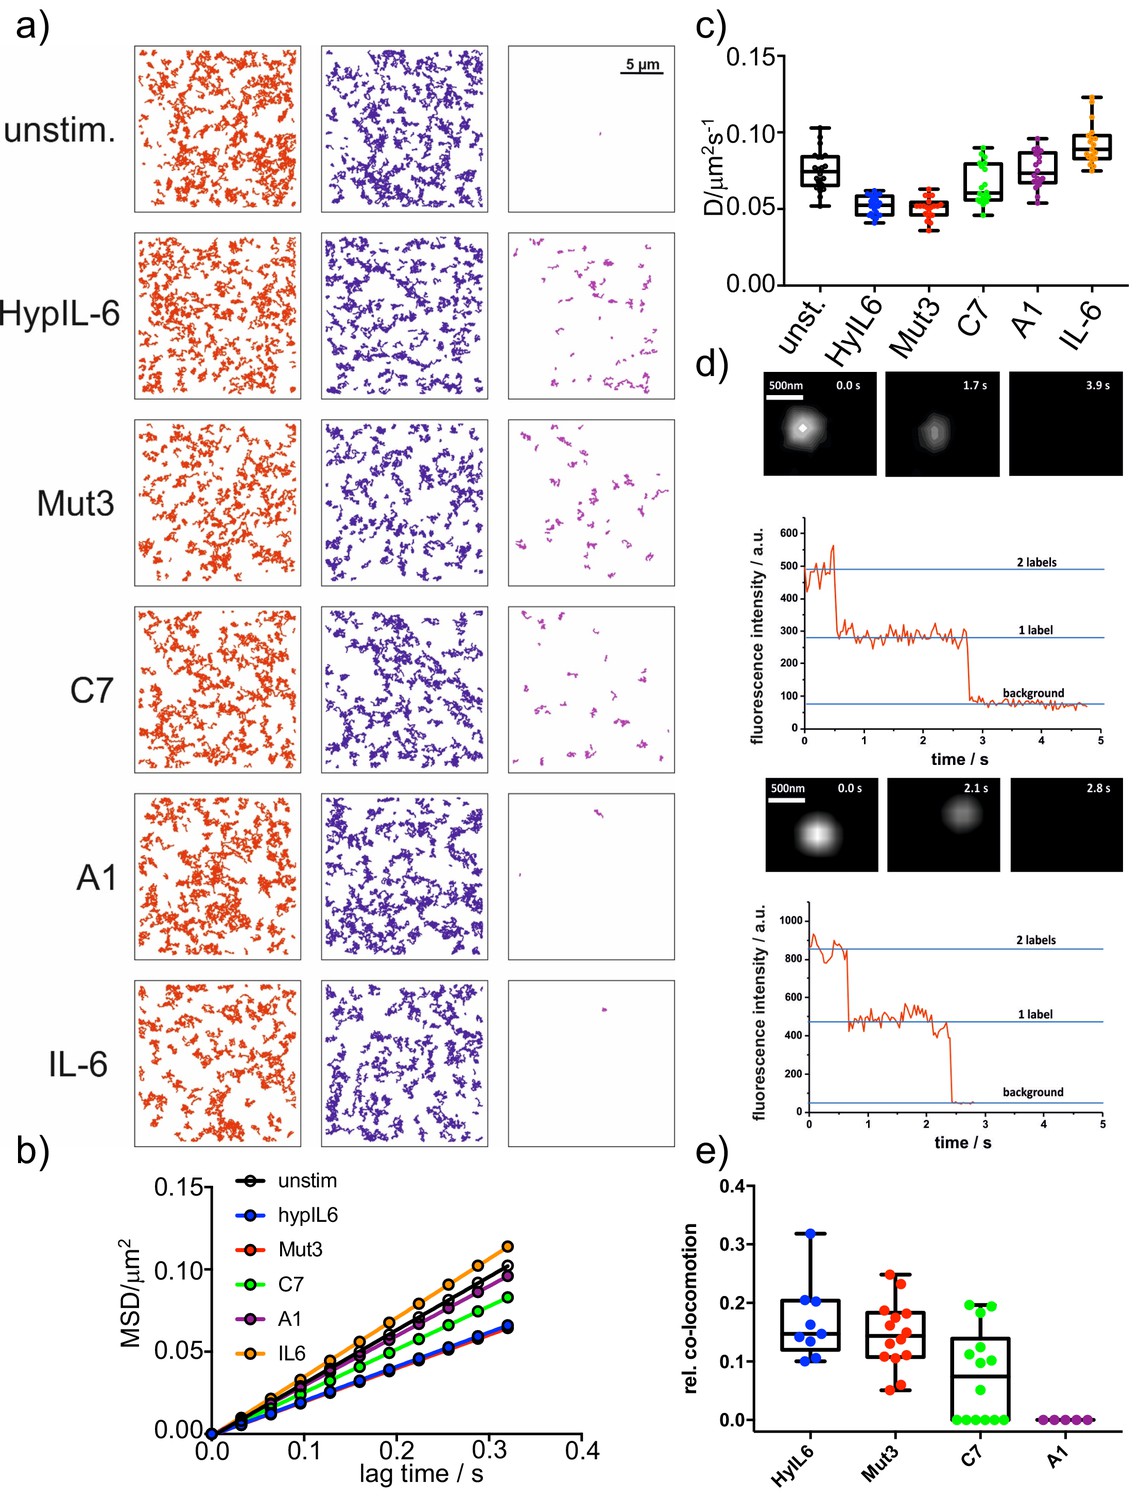
Characterization of gp130 induced complexes.
(a) Trajectories (RHO11 and DY647 and co-trajectories) of representative cells, stimulated with the indicated IL-6 mutants. (b) Mean-square-displacement batch analysis (2–10 steps,>20 cells each) of unstimulated gp130 or after stimulation with 20 nM HyIL-6 or each 1 µM of IL-6 mutants. (c) Distribution of diffusion coefficients measured for the indicated conditions in b. (d) Representative examples of single-colour dual-step bleaching observed for Mut3 and C7 induced gp130 homodimers. (e) Quantification of endogenous gp130 dimers in HeLa after stimulation with DY547 and DY647 conjugated IL-6 variants (10 nM each).
Figure 4 with 1 supplement
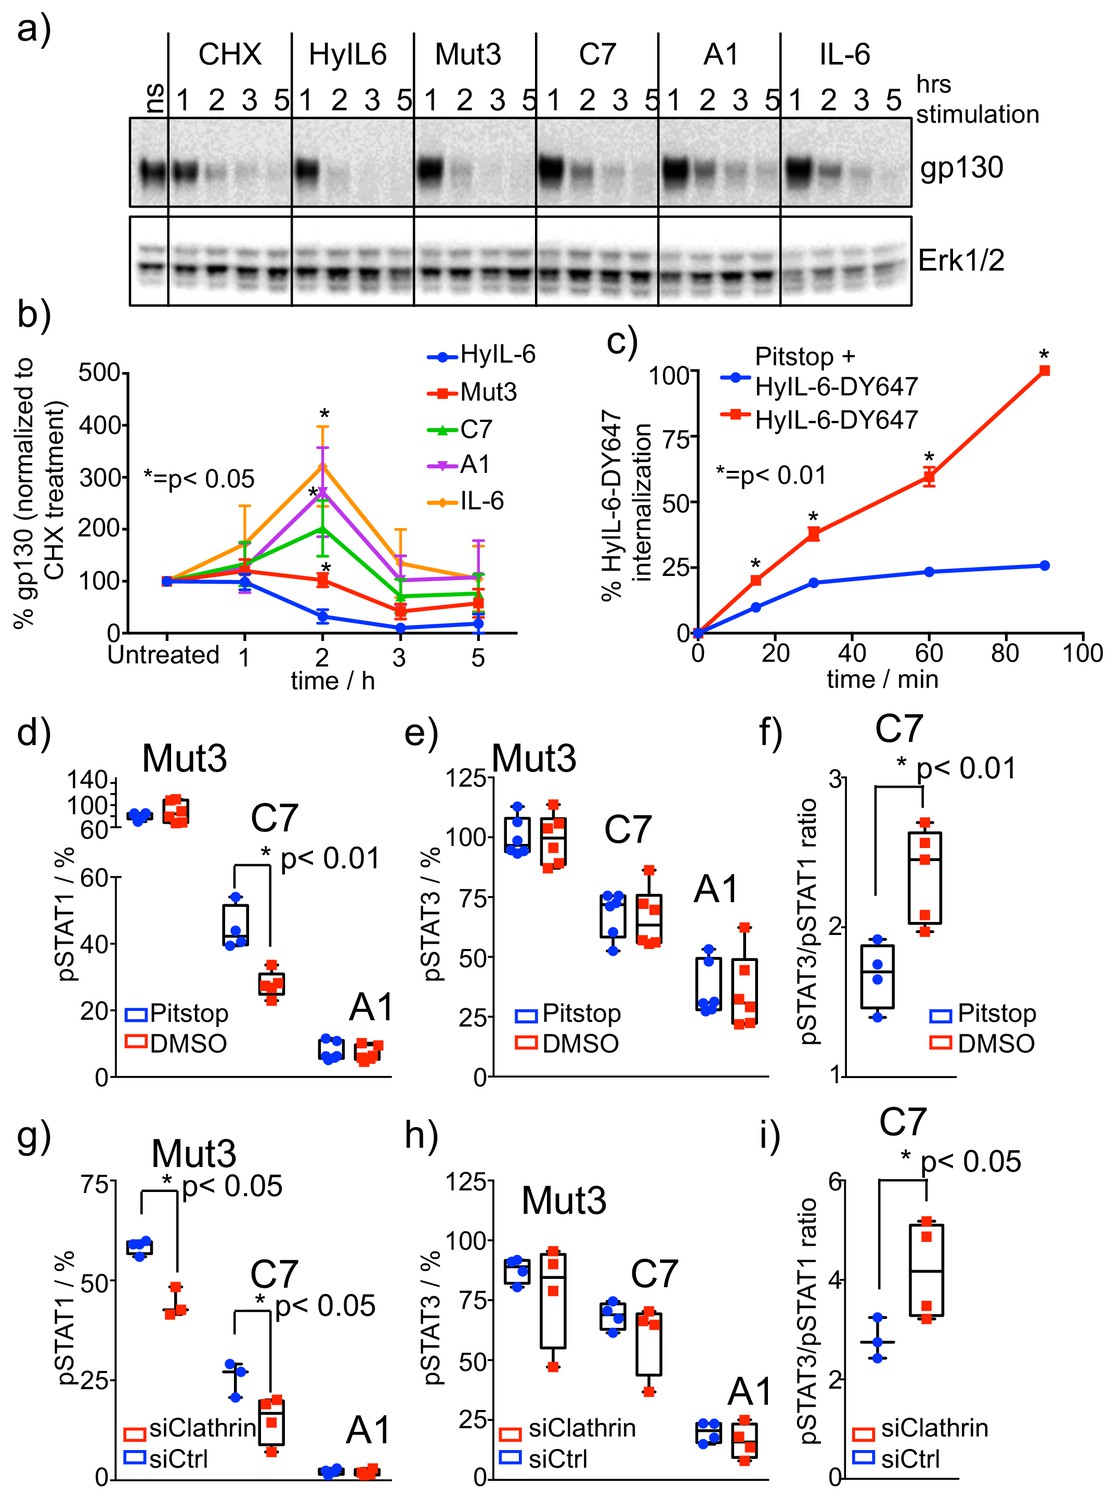
Role of receptor internalization in STAT activation by IL-6 variants.
(a–b) HeLa cells were stimulated with saturating concentrations of the different IL-6 ligands for the indicated times in the presence of CHX to block new protein synthesis. Levels of gp130 were measured by western blotting using a gp130 specific antibody and quantified via ImageJ software. Values were normalized to the gp130 degradation levels induced by CHX alone. Data are mean + /- SEM of four independent experiments. (c) HeLa cells preincubated for 30 min with Pitstop or DMSO were incubated with fluorescently labeled HyIL-6 for the indicated times. HyIL-6 internalization was monitored by flow cytometry. Data are mean + /- SEM of three independent experiments. (d–f) HeLa cells preincubated for 30 min with Pitstop or DMSO were stimulated with saturating concentrations (100 nM) of the indicated IL-6 ligands for 15 min and levels of STAT1 (d) and STAT3 (e) activation were measured by phospho-Flow cytometry. Data are mean + /- SEM from three independent replicates, each performed in duplicate. The pSTAT3/pSTAT1 ratio calculated from these studies is plotted in (f). (g–i) HeLa cells were transfected with either control siRNA or clathrin specific siRNA. After 48 hours cells were stimulated with saturating concentrations (100 nM) of the indicated IL-6 ligands for 15 min and the levels of STAT1 (g) and STAT3 (h) activation were measured by phospho-Flow cytometry. Data are mean + /- SEM from two independent replicates, each performed in duplicate. The pSTAT3/pSTAT1 ratio calculated from these studies is plotted in (i).
Figure 4—figure supplement 1
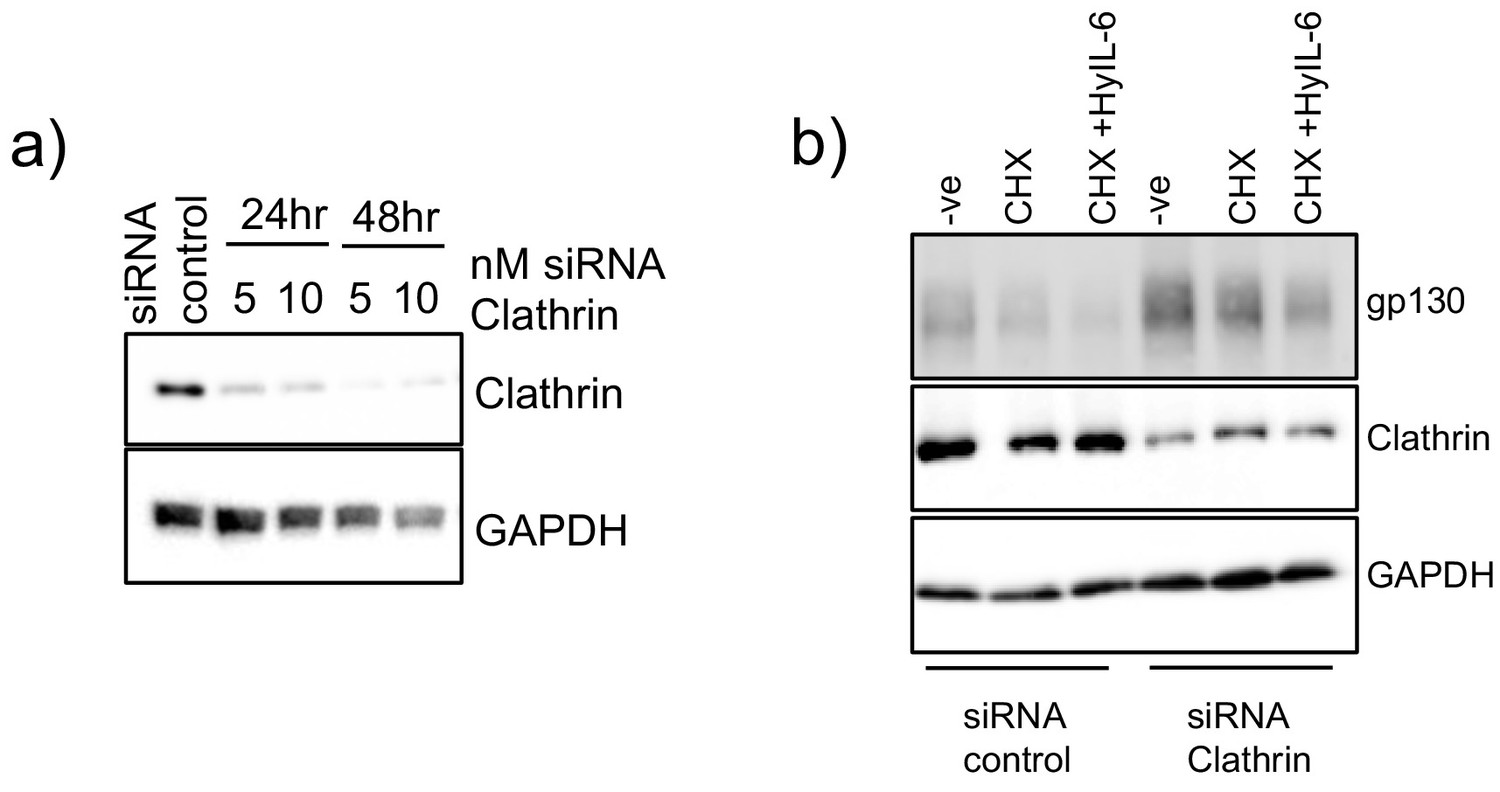
Clathrin silencing in HeLa cells.
(a) HeLa cells were transfected with different concentrations of siRNA targeting clathrin for 24 or 48 hr. Levels of clathrin were measured by western blot using clathrin specific antibodies. GAPDH was used as loading control. (b) HeLa cells were transfected with 10 nM control siRNA or clathrin specific siRNA. 48 hr later they were stimulated with saturating concentrations of HyIL-6 in the presence of cycloheximide for three hours. Gp130 and clathrin levels were measured by western blot. GAPDH was used as loading control.
Figure 5 with 1 supplement
Correlation between number of P-Tyr in gp130 ICD and STATs activation.
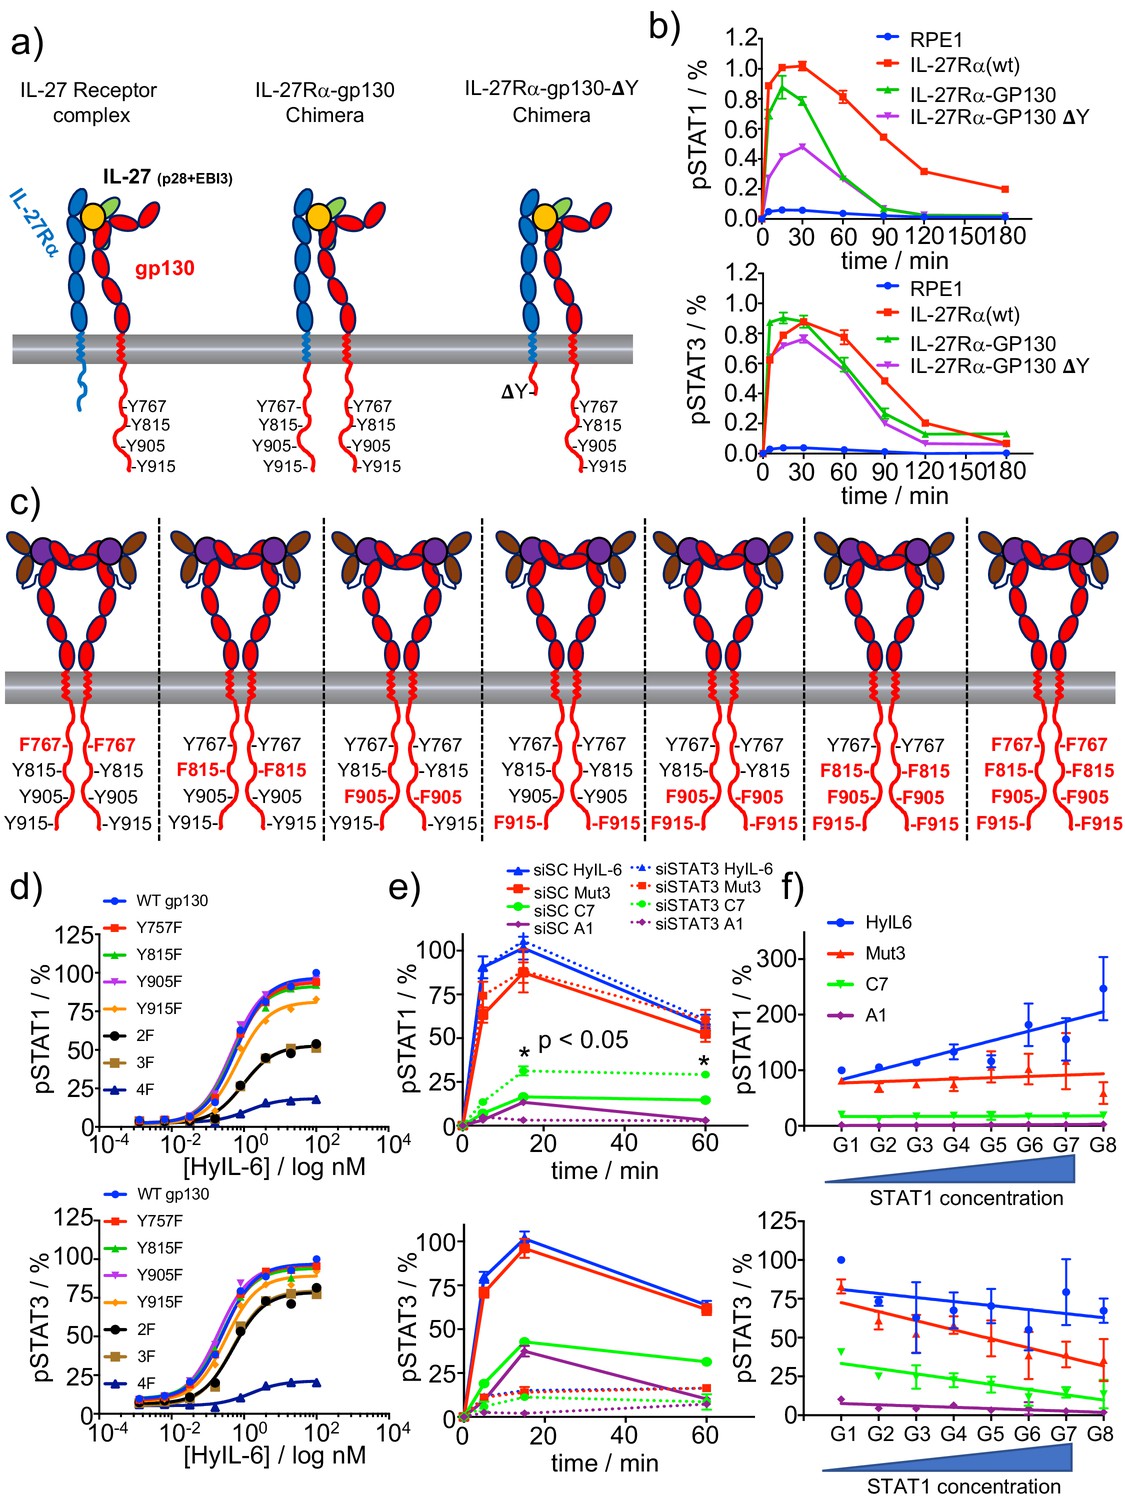
(a) Schematic representation of the different chimera receptors designed for this study. IL-27Rα intracellular domain was swapped for that of gp130 or a truncated version of the latter lacking all Tyr residues after the box1/2 region. This results in a receptor chimera complex able to engaged 8 P-Tyr and another one able to engage only 4 P-Tyr. RPE1 clones stably expressing the different receptor chimera constructs were generated. (b) Stable RPE1 clones were stimulated with saturating concentrations of IL-27 for the indicated times and the levels of STAT1 (left panel) and STAT3 (right panel) activation were measured by Phospho-Flow cytometry. Data are mean + /- SEM from three independent replicates, each performed in duplicate. (c) Schematic representation of seven different gp130 mutants, where the identity of the Tyr on gp130 ICD mutated to Phe is highlighted in red. (d) gp130 KO HeLa cells were transiently transfected with either gp130 wt or each of the gp130 mutants described in c and pSTAT1 (top panel) and pSTAT3 (bottom panel) levels upon stimulation with the indicated doses of HyIL-6 were monitored by flow cytometry. Data are mean + /- SEM from two independent experiments, each in duplicate. (e) Hela cells were transfected with either control siRNA or siRNA targeting STAT3. After 48 hr transfected cells were stimulated with saturating concentrations of the different IL-6 ligands for the indicated times and the levels of STAT1 (top panel) or STAT3 (bottom panel) activation were measured by Phospho-Flow cytometry. Data are mean + /- SEM from three independent replicates, each performed in duplicate. (f) HeLa cells were transiently transfected with STAT1-GFP and the levels of pSTAT1 and pSTAT3 upon stimulation with a saturated dose of HyIL-6 (20 nM) for 15 min were monitored by flow cytometry. G1-G8 represents gates on the flow cytometer denoting increasing STAT1-GFP expression levels. Data are mean + /- SEM from two independent replicates, each performed in duplicate.
Figure 5—figure supplement 1
Functional characterization of RPE1 stable clones.
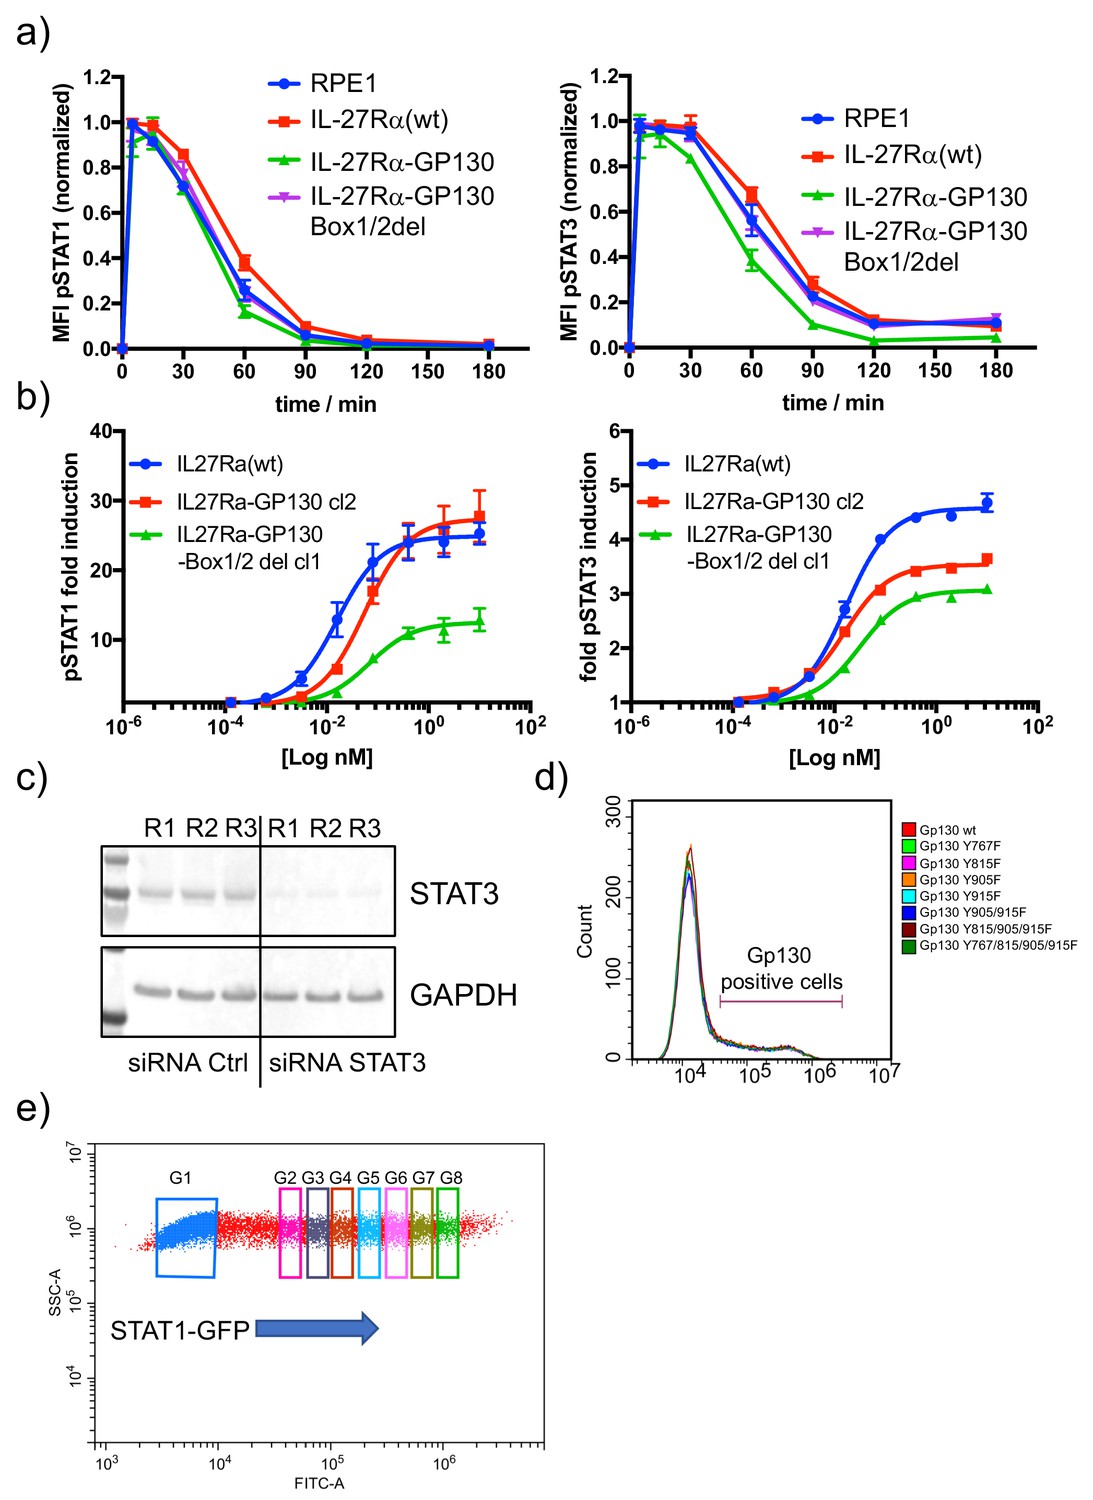
(a) The different RPE1 stable clones were stimulated with saturating concentrations of HyIL-6 for the indicated times and the levels of STAT1 (left panel) or STAT3 (right panel) activation were measured by phospho-Flow cytometry. Data are mean + /- SEM from three independent replicates, each perform in duplicate. (b) The different RPE1 stable clones were stimulated with the indicated doses of IL-27 for 15 min and the levels of STAT1 (left panel) and STAT3 (right panel) activation were measured by Phospho-Flow cytometry. Data are mean + /- SEM from three independent replicates, each perform in duplicate. (c) HeLa cells were transfected with control siRNA or STAT3 specific siRNA and 48 hr later levels of STAT3 were measured by western blot. GAPDH was used as loading control. (d) FACS dot plot illustrating STAT1-GFP overexpression in HeLa cells. Gate (G) one to G8 represent different STAT1 expression levels.
Figure 6 with 1 supplement
Transcriptional program elicited by the different IL-6 variants.
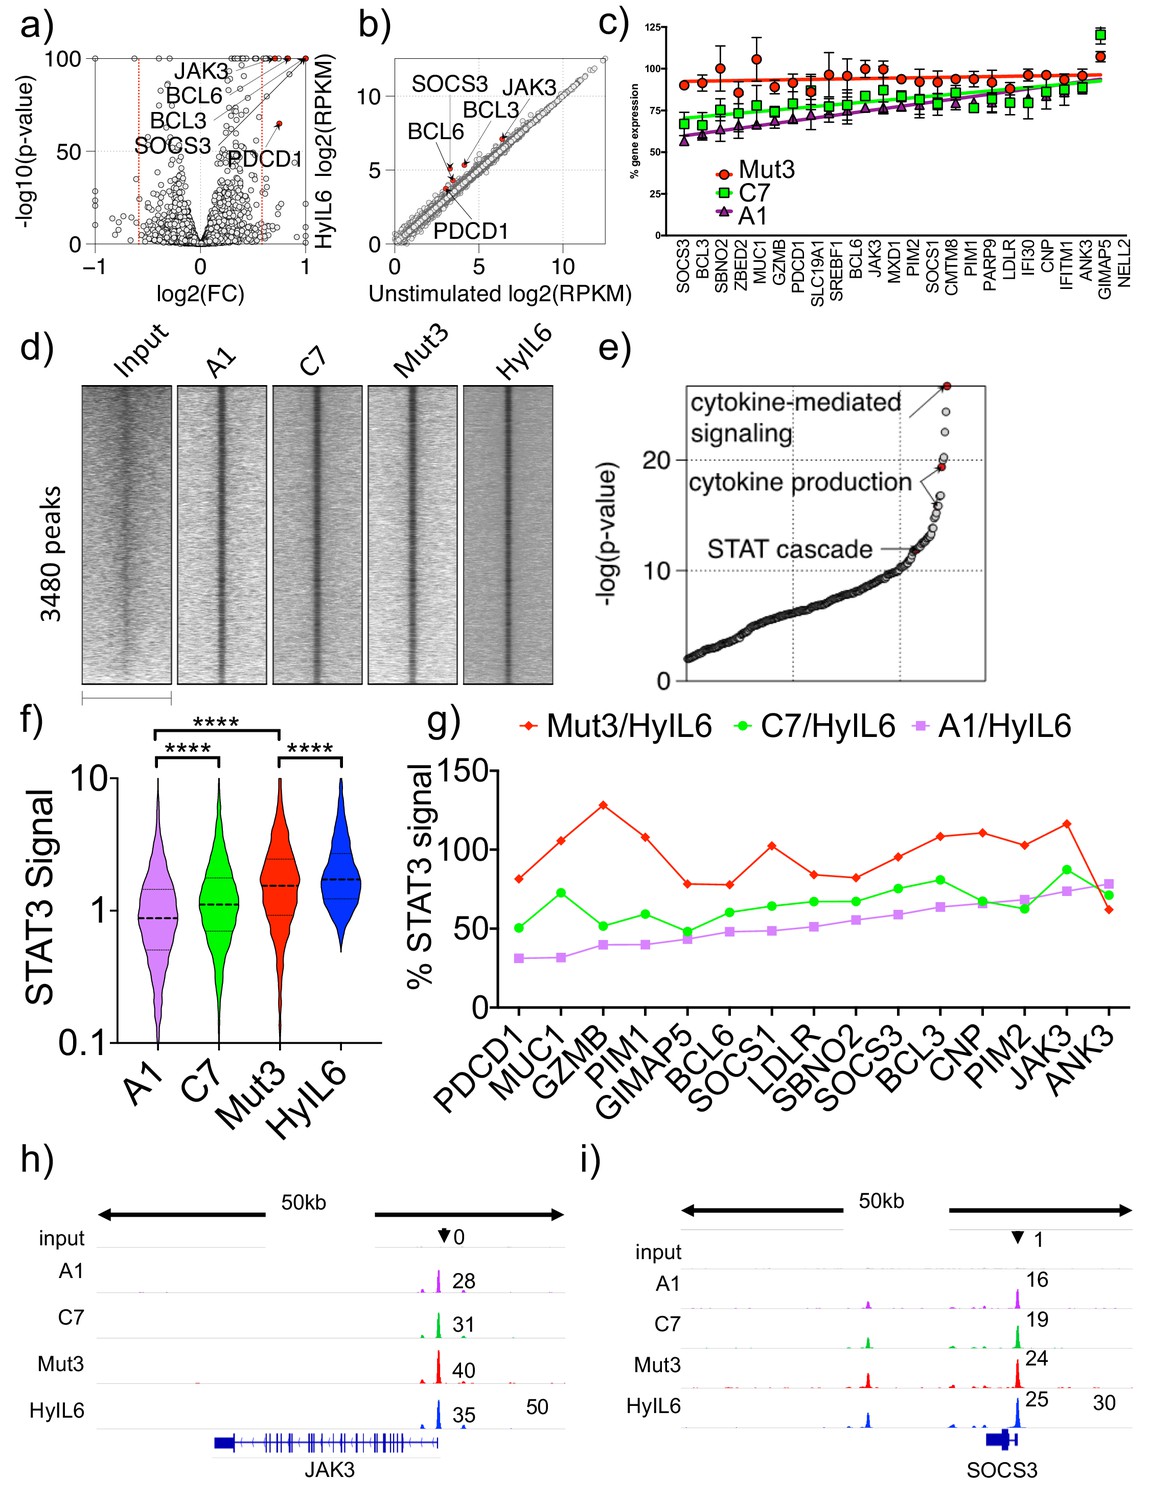
(a) volcano plot showing significant genes differently expressed in Th1 cells after 6 hr stimulation with HyIL6. The red dash lines demark fold change = 1.5. (b) scatter plot showing mean gene expression values (n = 3) before (X-axis) and after HyIL6 stimulation (Y-axis). Top five differently expressed genes are highlighted. (c) plot showing the normalized gene expression relative to HyIL6 stimulation for each indicated stimulation. 23 differently expressed genes after HyIL6 stimulation are shown. The regression lines are highlighted. The data in a–c) are from three independent donors. (d) heatmap showing signal intensity of STAT3 bound regions (5 kb centred at peak summit) for indicated stimulations. Peaks are identified by comparing HyIL-6 stimulation and input. (e) shown are GO biological pathways ranked by p-value that are enriched in genes with adjacent STAT3 binding. (f) violin plot showing the signal intensity of all peaks (200 bp regions centred at peak summit) after each stimulation. P values are determined by two-tailed Wilcoxon tes (****p<0.0001). (g) shown are relative signal intensity of STAT3 peaks near select genes. Select are 15 differently expressed genes with adjacent STAT3 binding sites. (h–i) STAT3 binding at JAK3 (h) and SOCS3 (i) gene loci.
Figure 6—figure supplement 1
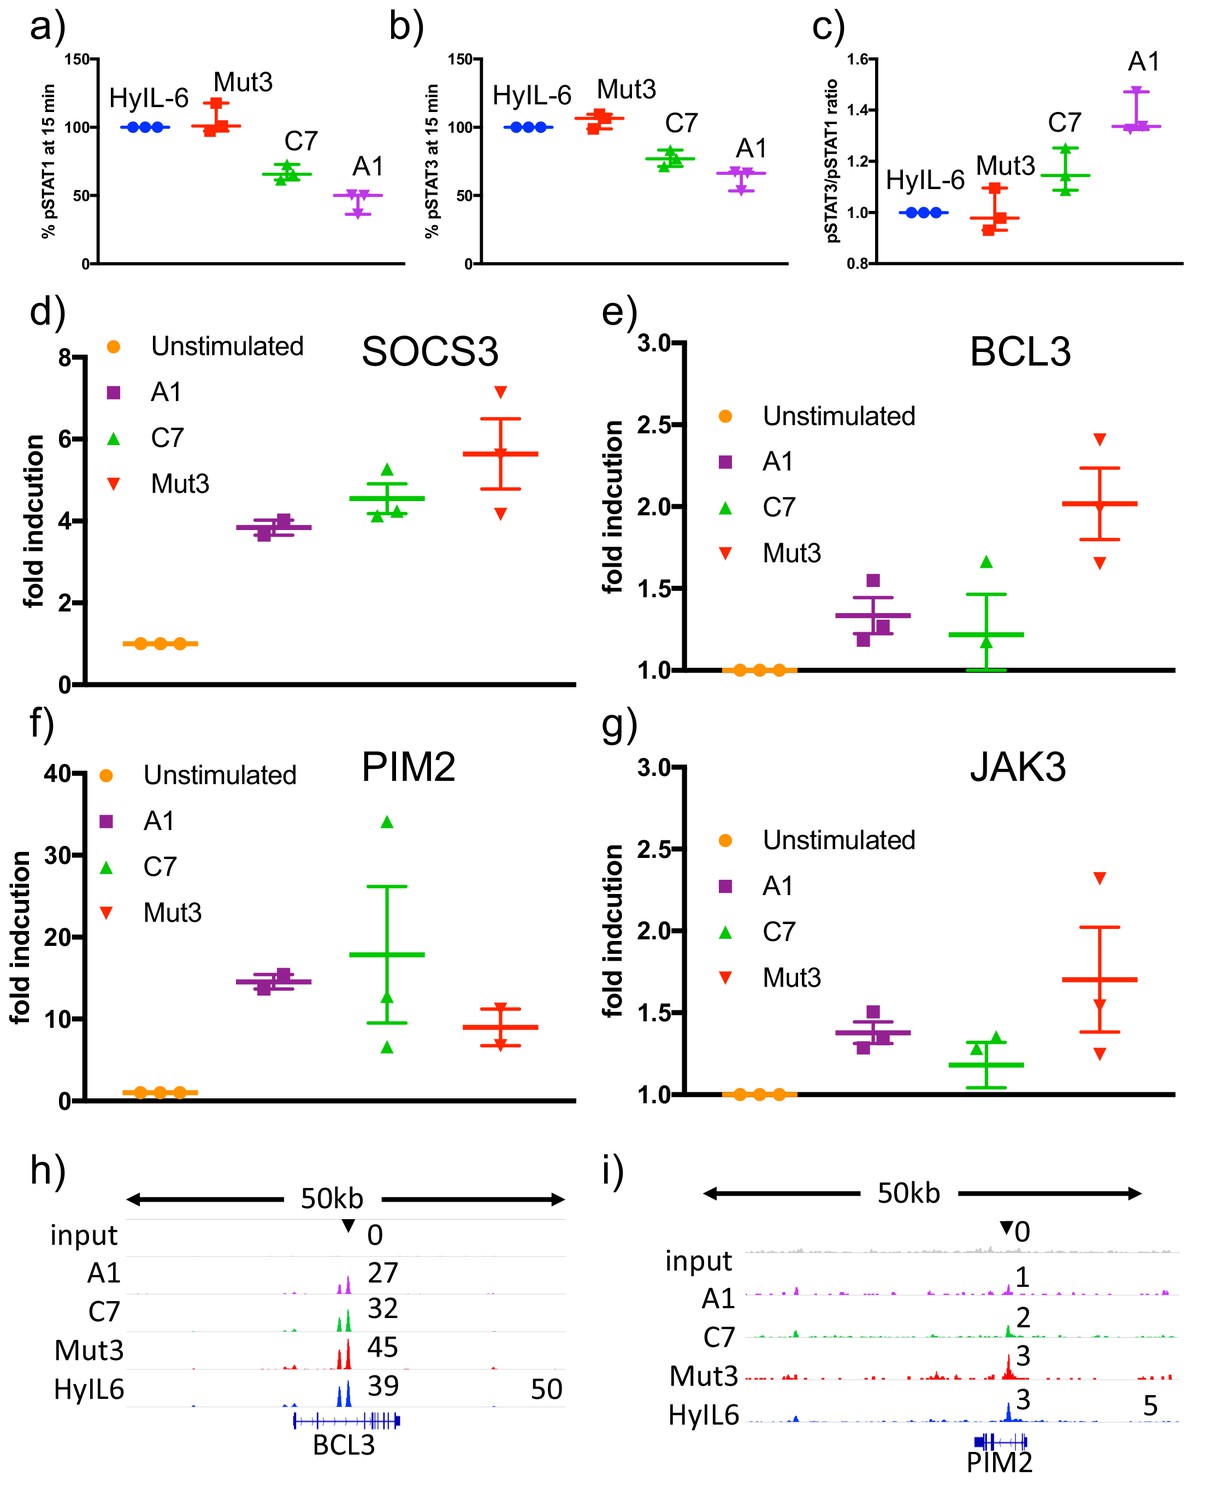
Transcriptional characterization of IL-6 variants.
(a–c) Human CD4 T cells were isolated from buffy coats and differentiated into Th1 cells for five days. 24 hr before stimulation, cells were starved of cytokines. Starved-Th1 cells were stimulated with saturating doses of the indicated IL-6 ligads for 15 min and the levels of STAT1 (a) and STAT3 (b) activation were measured by Phospho-Flow cytometry. The pSTAT3/pSTAT1 ratio resulting from these studies is plotted in panel (c). Data are mean + /- SEM from three independent donors. (d–g) Th1 cells generated as in (a–c) were stimulated with saturating concentrations of the indicated IL-6 ligands for six hours. RNA was extracted at that point and converted to cDNA to perform qPCRs studies. The levels of the indicated STAT3-induced genes were quantified. (h–i) STAT3 binding to BCL3 (h) and PIM2 (i) promoters in response to stimulation with the different IL-6 variants in Th1 cells.
Figure 7 with 1 supplement

Immuno-modulatory activities trigger by the different IL-6 variants.
(a) Human CD4 T cells were isolated from whole PBMCs and treated with Treg polarizing conditions in the presence of saturating concentrations of the different IL-6 variants for five days. Percentage of Treg cells were calculated by counting number of events in the CD4+CD25+FoxP3+ population obtained by flow cytometry. The control condition was defined as 100% response and the other conditions normalized accordingly. Data are mean + /- SEM from five independent replicates. (b) Human CD4 T cells were isolated from whole PBMCs and treated with Th17 polarizing conditions in the presence of saturating concentrations of the different IL-6 variants for fourteen days. Percentage of Th17 cells were calculated by counting number of events in the CD4+IL-17A+ population obtained by flow cytometry. The control condition was defined as 100% response and the other conditions normalized accordingly. Data are mean + /- SEM from five independent replicates. (c) Human CD4 T cells were isolated from whole PBMCs and treated with Th1 polarizing conditions in the presence of saturating concentrations of the different IL-6 variants for five days. Percentage of Th1 cells were calculated by counting number of events in the CD4+IFNγ+ population obtained by flow cytometry. The control condition was defined as 100% response and the other conditions normalized accordingly. Data are mean + /- SEM from four independent replicates. (d) Triangular representation of data from (a–c). As the affinity for gp130 decreases (C7 and A1 variants) the different IL-6 activities are differentially affected with Th17 differentiation being the most robust activity to changes in affinity and Treg inhibition being the most sensitive activity.
Figure 7—figure supplement 1
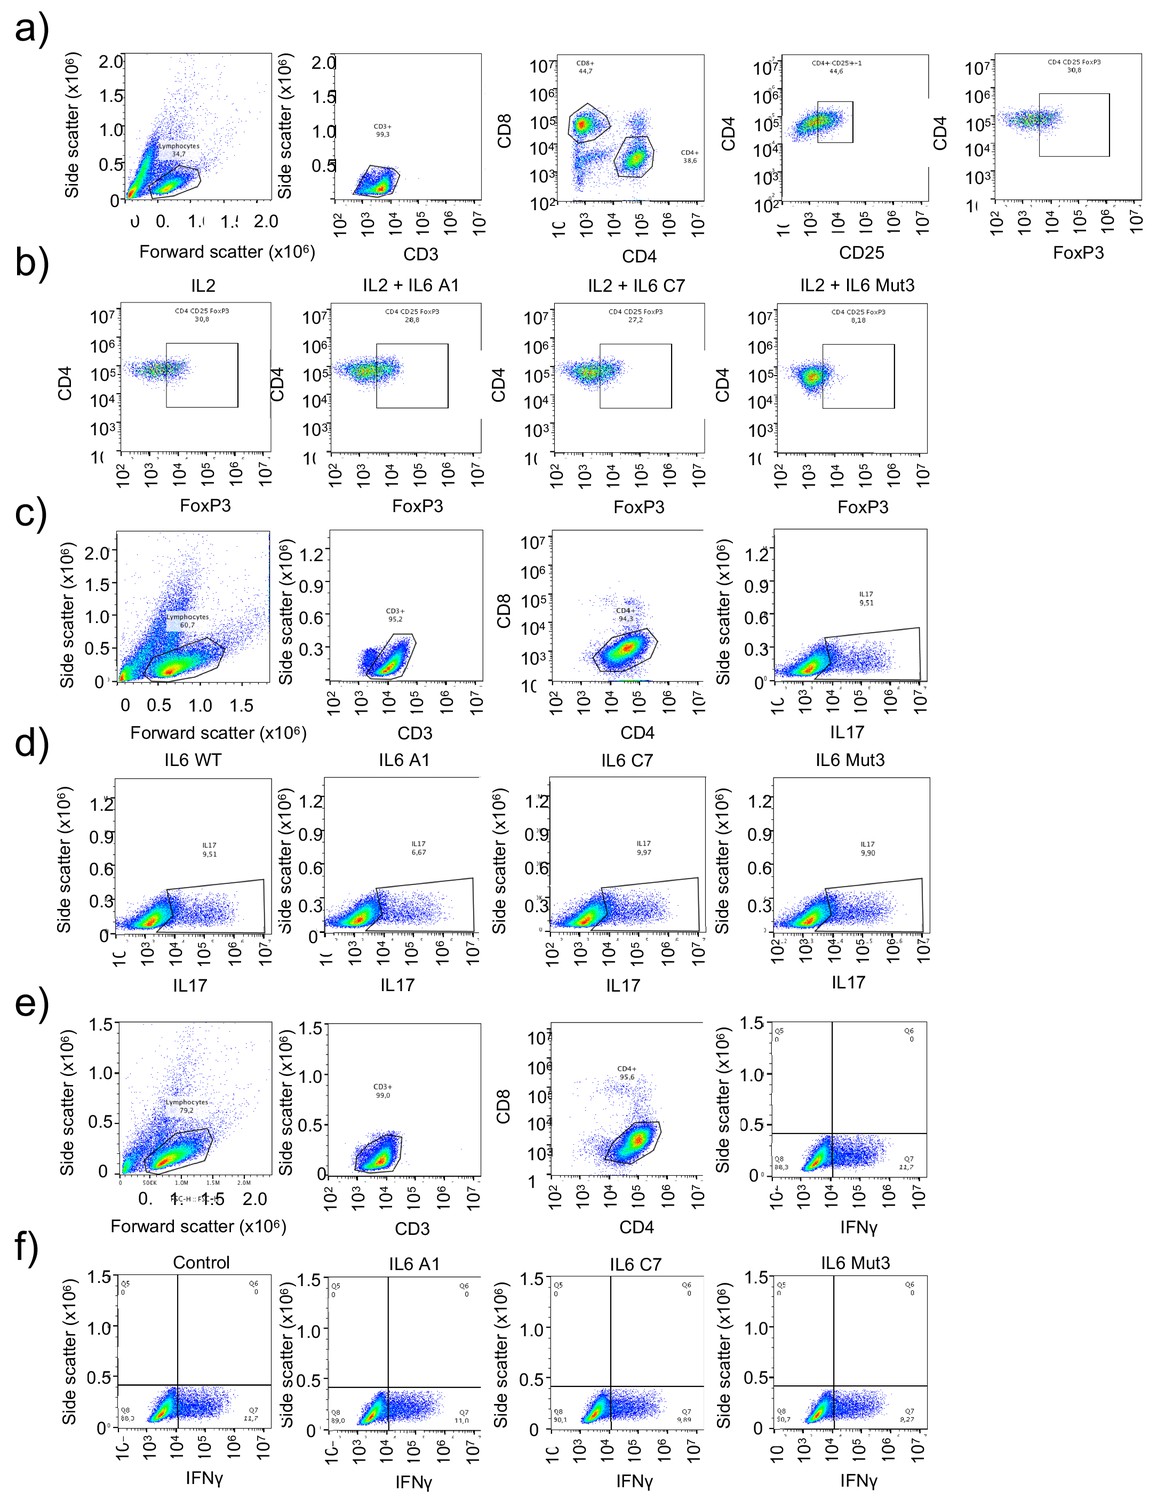
Immuno-modulatory properties of the IL-6 variants.
(a–b) Representative FACS plots and population strategy to define Treg cell numbers in response to IL-6 variants. (c–d) Representative FACS plots and population strategy to define Th17 cell numbers in response to IL-6 variants. (e–f) Representative FACS plots and population strategy to define Th1 cell numbers in response to IL-6 variants.
Additional files
-
Supplementary file 1
Number of STAT3 binding sites.
- https://cdn.elifesciences.org/articles/49314/elife-49314-supp1-v2.pdf
-
Transparent reporting form
- https://cdn.elifesciences.org/articles/49314/elife-49314-transrepform-v2.docx
Download links
A two-part list of links to download the article, or parts of the article, in various formats.
Downloads (link to download the article as PDF)
Open citations (links to open the citations from this article in various online reference manager services)
Cite this article (links to download the citations from this article in formats compatible with various reference manager tools)
Kinetics of cytokine receptor trafficking determine signaling and functional selectivity
eLife 8:e49314.
https://doi.org/10.7554/eLife.49314


