Visualizing endogenous opioid receptors in living neurons using ligand-directed chemistry
- Oregon Health & Science University, United States
- School of Medicine, Creighton University, United States
- Intramural Research Program, NIDA and NIAAA, United States
Figures
Figure 1 with 1 supplement

The chemistry of fluorescent naltrexamine-acylimidazole (NAI).
(A) A schematic showing the steps in fluorescent dye attachment to the opioid receptor via ligand-directed acylimidazole chemistry. The ligand (gray) represents naltrexamine and an appropriate length of linker. The red circle represents a fluorescent dye. Left panel shows naltrexamine guides the molecule to the receptor, and interacts (middle panel) with the binding pocket. The carbonyl of acylimidazole can therefore react with a nucleophilic side-chain of an amino acid that is Lys, Ser, Tyr and Thr (Fujishima et al., 2012). Once the transfer reaction occurs the dye remains attached to the receptor while naltrexamine moiety is free to dissociate. (right panel) (B) The synthesis scheme of the naltrexamine-acylimidazole alkyne (NAI-AK) precursor. The linker arm of alkyne is introduced for conjugation with dye via click chemistry. (C) Illustration of the click reaction to yield NAI-A594.
Figure 1—figure supplement 1
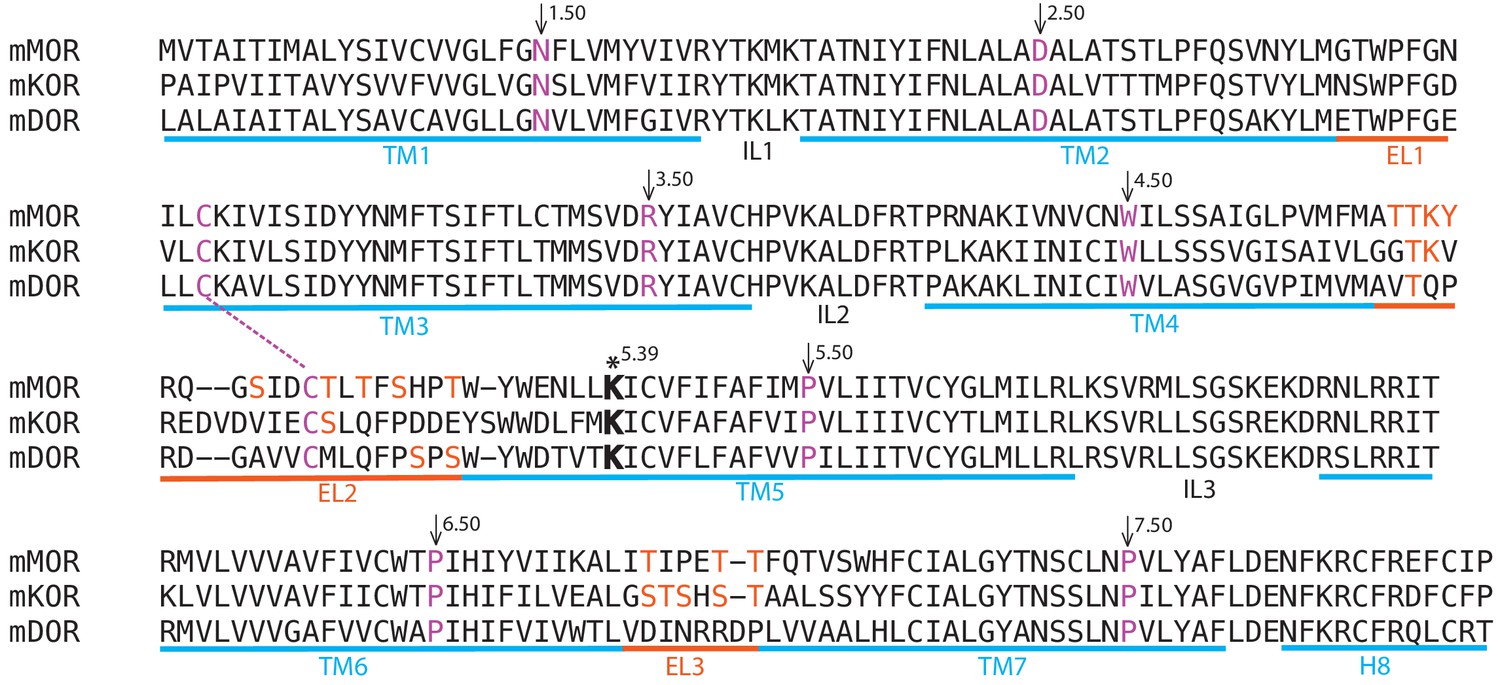
Hypothetical sites for NAI modification.
Amino acids are shown in one letter code. The orange letters are possible modification sites on extracelluar loop 2 and 3. K(5.39, bold in black) is the modification site of β-funaltrexamine.
Figure 2 with 2 supplements
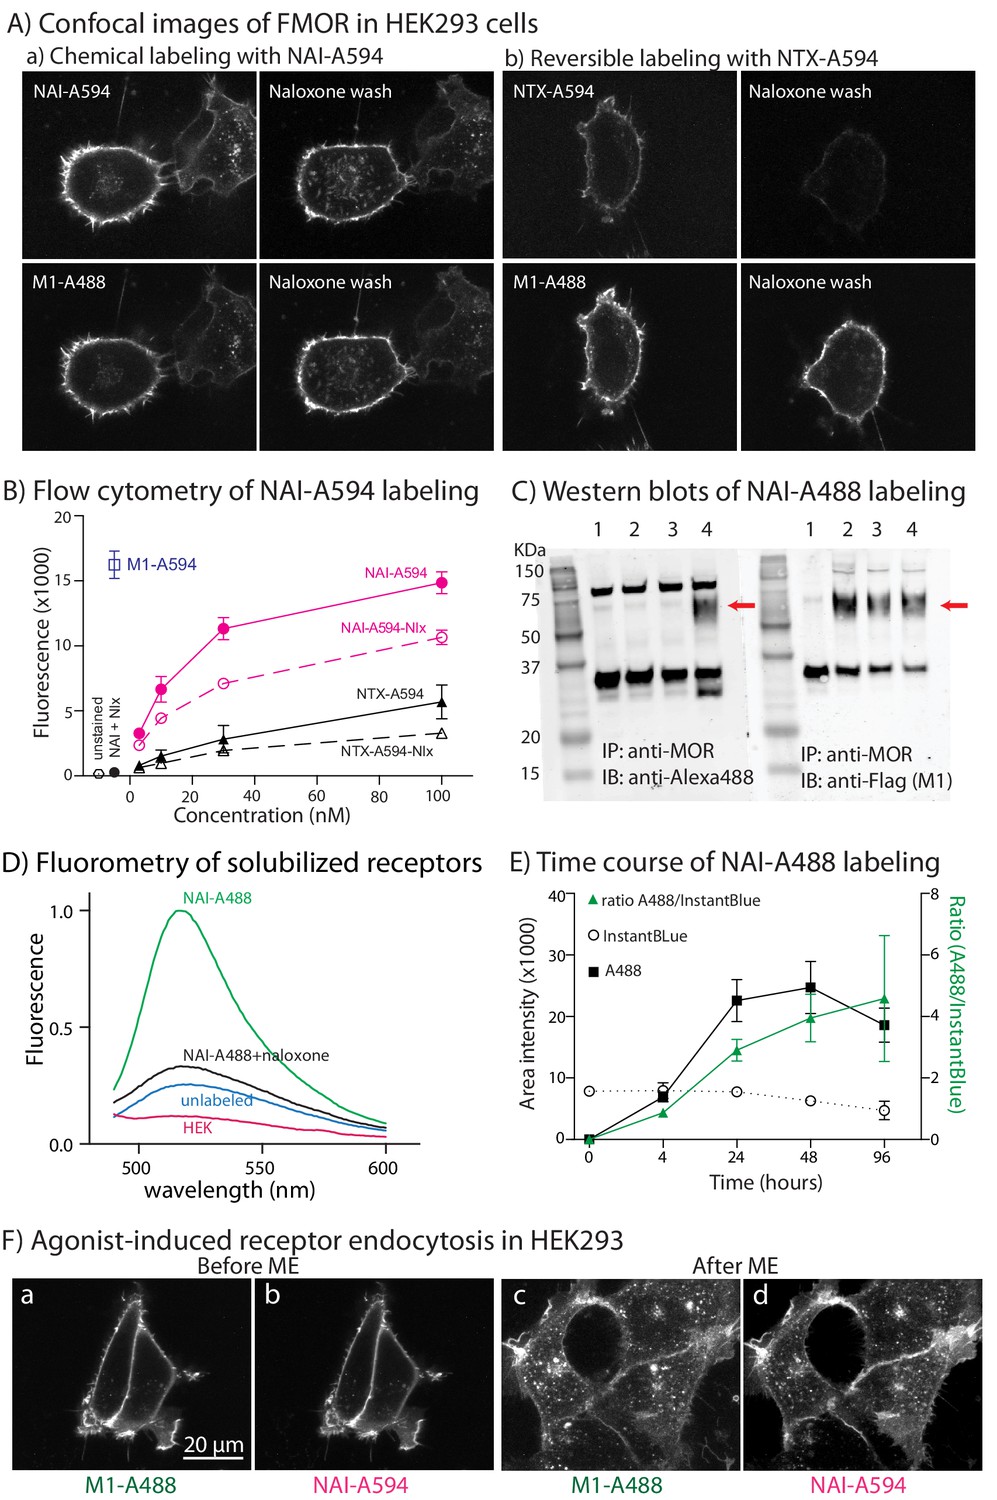
Naltrexamine-acylimidazole modified with fluorescencent dyes (NAI-A594 or NAI-A488) labels FMORs in HEK293 cells.
(A) Micrographs showing fluorescent labeling of cell using NAI-A594 and M1-A488. Images in (a) demonstrate that following labeling of receptors with NAI-A594, the treatment with naloxone (1 µM, 10 min, n = 3) did not reduce the fluorescence along the plasma membrane. Images in (b) show the fluorescence of A594 from the reversible ligand NTX-A594 labeling was weaker and abolished following treatment with naloxone (1 µM, 10 min, n = 3). In both (a) and (b), the fluorescence of antibody labeling using M1-A488 wasere not changed after the treatment of naloxone. (B) Flow cytometry shows an increase in fluorescence with increasing concentrations of NAI-A594 and NTX-A594. The red line shows the signal after wash with a buffer [2 × 2 mL DMEM (no phenol red) plus 5% FBS, room temperature]. The red dashed-line shows fluorescent signal after wash with naloxone (10 µM, 2 × 2 mL, room temperature, n = 3). The black lines (both solid and dashed, n = 3) represent cells treated with NTX-A594 and washed as described for NAI-A594 treated cells. When cells were co-incubated with naloxone (10 µM), there was negligible NTX-A594 fluorescence (black dot). The fluorescence of antibody labeling M1-A594 was also quantified as shown with a blue square. (C) Immunoprecipitation-western blot analyses show the labeling of FMOR with NAI-A488 (100 nM, 1 hr, 37°C, 5% CO2). The solubilized receptors from these cells were immunoprecipitated with rabbit anti-MOR and then immunoblotted with primary rabbit anti-Alexa488 and secondary goat-anti rabbit Alexa-680 (lanes 1–4, left panels) or primary M1 anti-FLAG and secondary goat-anti mouse Alexa-680 (lanes 1–4, right panels). lane 1: HEK293 cells that lack FMOR, lane 2: unlabeled FMOR cells, lane 3: FMOR cells labeled with NAI-A488 in the presence of 10 µM naloxone, and lane 4: NAI-A488 labeled FMOR cells. The experiments were repeated twice. (D) The fluorescent spectra of solubilized receptors in (C) were measured between wavelengths of 450–600 nm. Only the receptors that were incubated with NAI-A488 alone showed significant fluorescence. The fluorescence was blocked by 10 µM naloxone, was at a low level from unlabeled FMOR cells and was not observed in HEK cells without FMOR. (E) The labeling of purified FMOR by NAI-A488 increased with time. FMOR was purified and incubated in NAI-A488 at room temperature for the indicated time. Band intensities were measured using image J. The error bars represented standard deviation of two independent experiments. (F) Micrographs of cells co-labeled with NAI-A594 and M1-A488. Images show the plasma membrane staining of M1-A488 (a) and NAI-A594 (b) and the appearances of fluorescent puncta in M1-A488 (c) and NAI-A594 (d) labeled cells after application of 10 µM ME for 10 min.
Figure 2—figure supplement 1
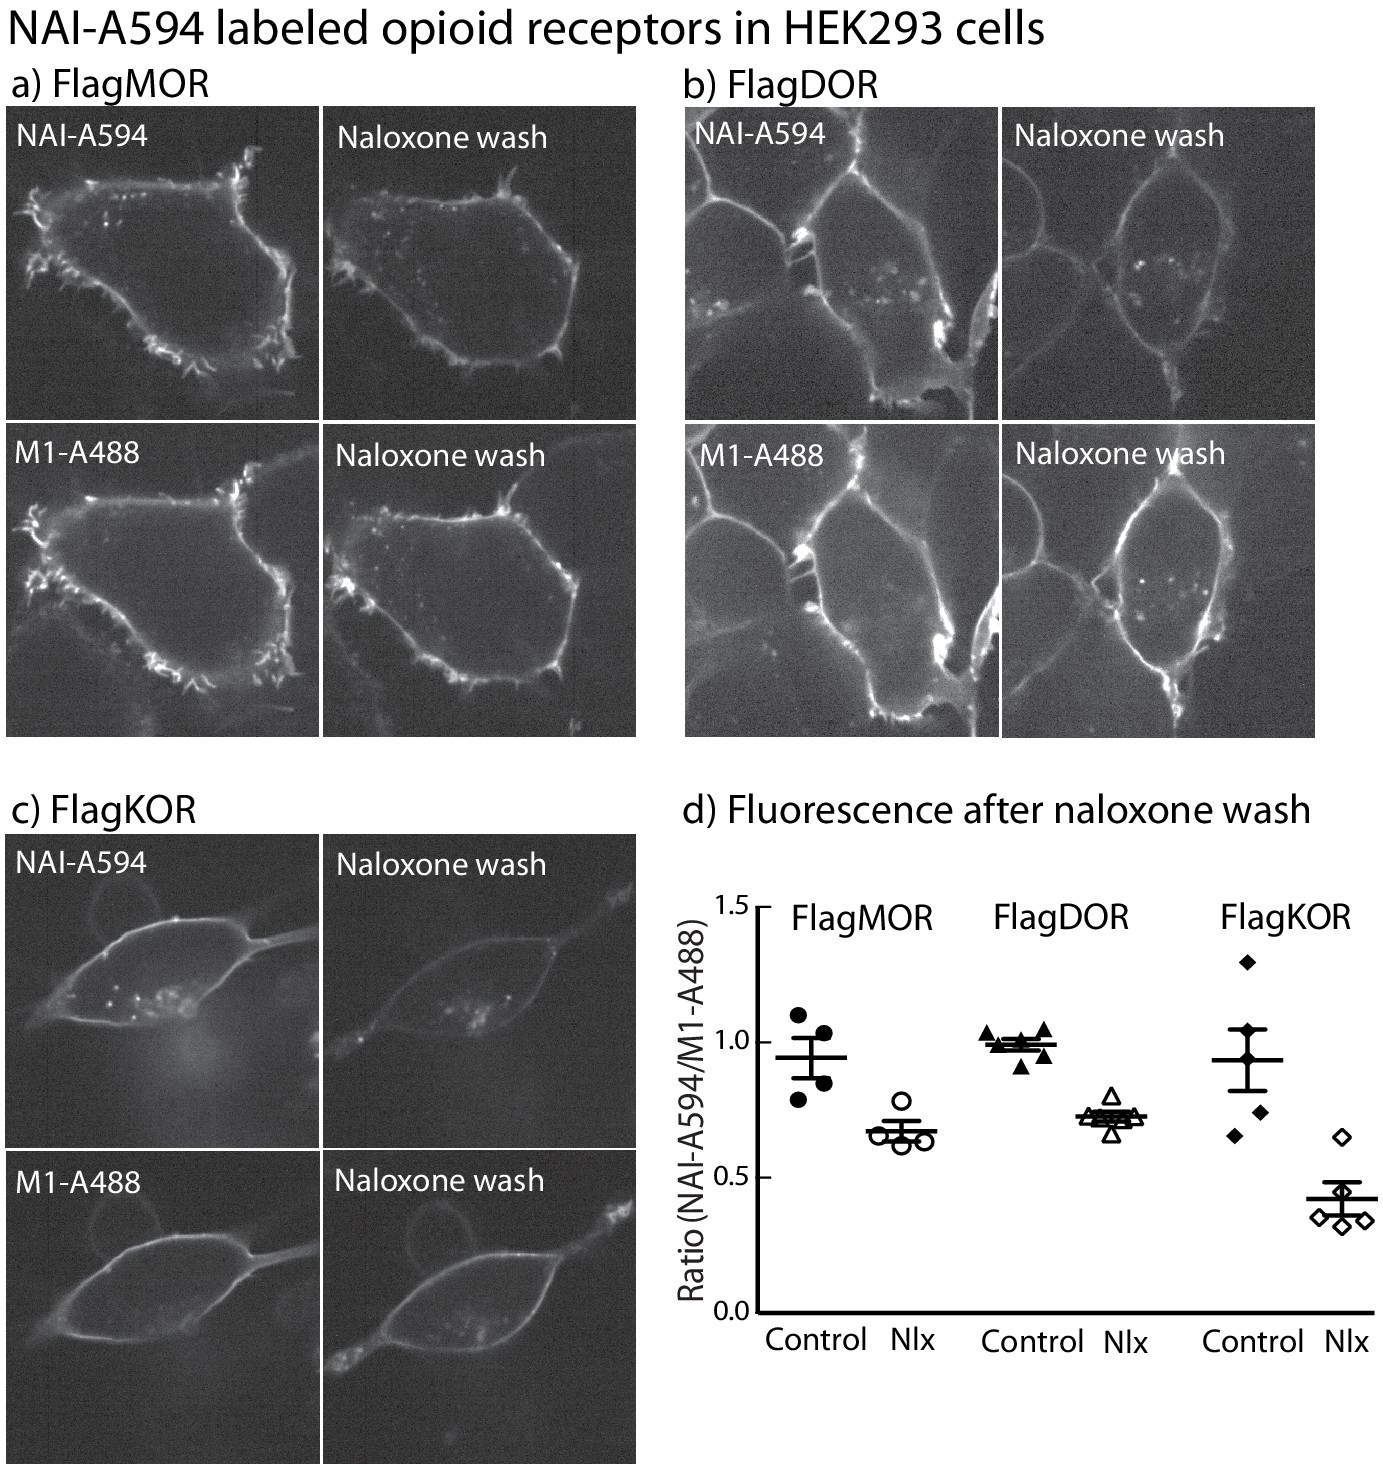
NAI-A594 labels FMORs, FDORs and FKORs in HEK293 cells.
Micrographs showing fluorescent labeling of cell using NAI-A594 and M1-A488. Images in (a and b) demonstrate that following labeling of FMORs and FDORs with NAI-A594, the treatment with naloxone (1 µM, 10 min, n = 3–5) did not reduce the fluorescence along the plasma membrane. Images in (c) show the labeling of FKORs with NAI-A594 that was nearly absent following with naloxone treatment (n = 3). In all cases, the fluorescence of antibody labeling using M1-A488 was not changed after the treatment of naloxone. The results were analyzed and graphed in (d) showing the fluorescence ratio of NAI-A594 and M1-A488 measured at the plasma membrane. The error bar represented standard deviation.
Figure 2—figure supplement 2
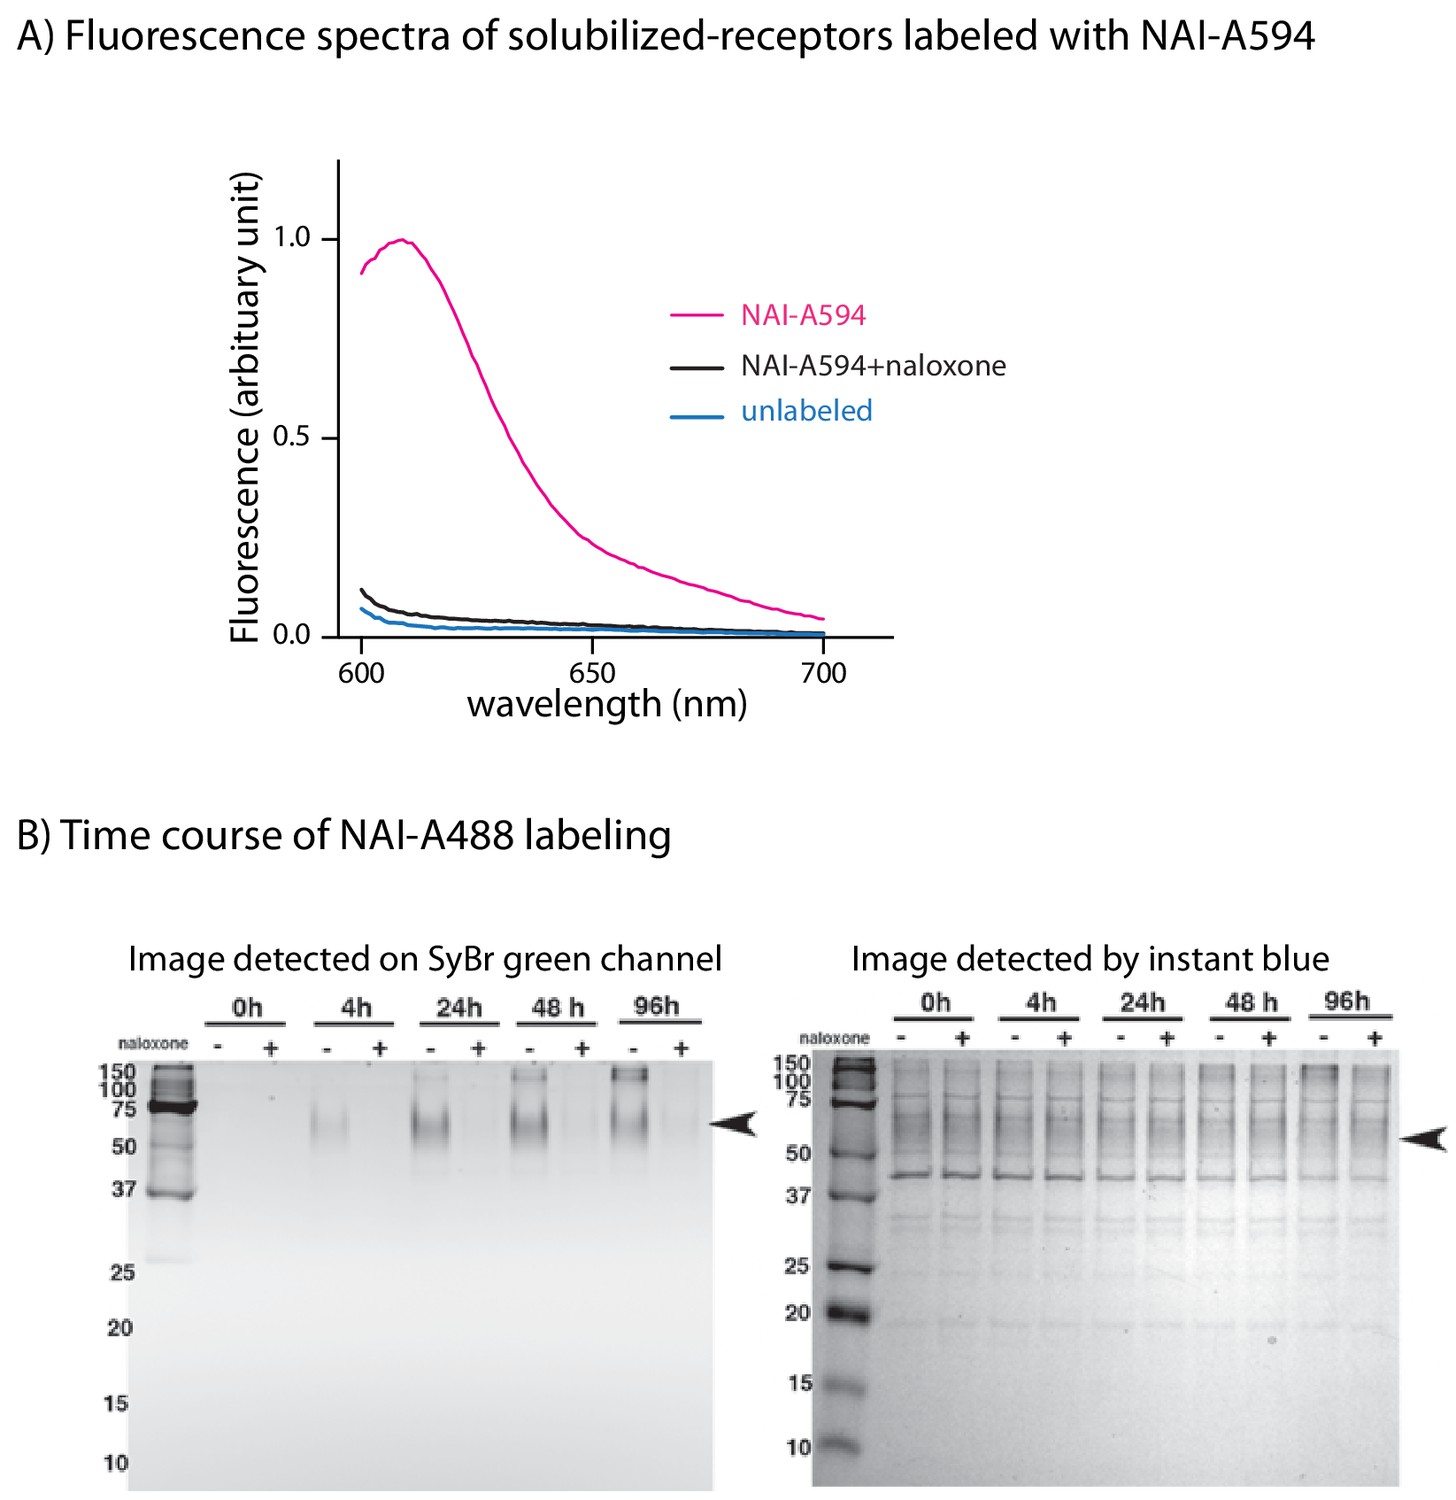
Labeling of MOR with NAI-594 and NAI-488.
(A) Fluorescent spectra of solubilized cell lysates labeled with NAI-A594. (B) Electrophoretic gels showed the time course labeling of purified FMOR with NAI-A488. The left gel was detected on SYBR green channel for A488 signal and the right gel was stained with InstantBlue and imaged using visible light.
Figure 3 with 2 supplements
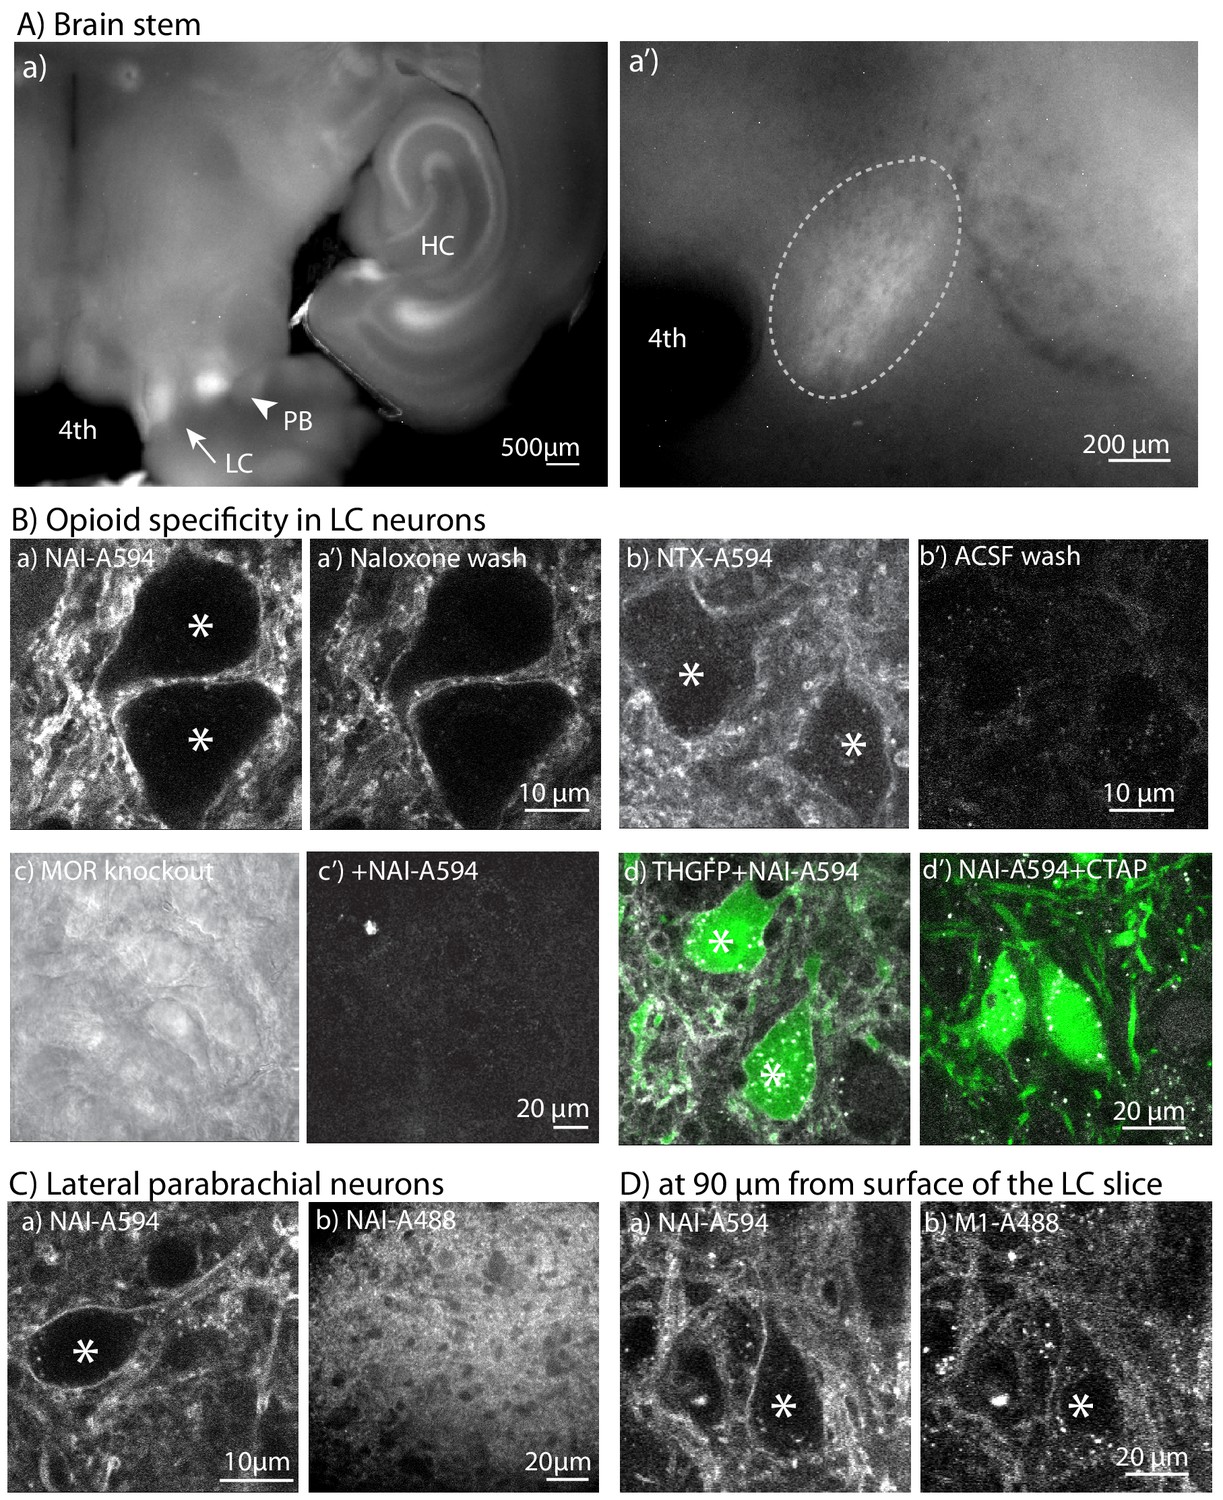
NAI-A594 labeled endogenous MORs on LC neurons.
(A) Top panels show a low-magnification fluorescence image after incubating LC slices from wild type rats in NAI-A594 (100 nM in ACSF, 1 hr, 30°C). (a) the LC, parabrachial nucleus (PB) and parts of the hippocampus (HC) are labeled. a’, a zoom-in image of the LC. (a’) the zoom-in picture shows A594 fluorescence of LC neurons (elliptical dash-line). (B) The 2-photon images of LC neurons stained with NAI-A594 or NTX-A594. The plasma membrane staining of LC neurons labeled with NAI-A594 was observed (a). The fluorescent signal on these neurons was reduced but remained on the cells after superfusion of naloxone (10 µM, 10 min, a’). When neurons were labeled with NTX-A594 (100 nM), there was a dim fluorescence on the plasma membrane (b) and the fluorescent signal was eliminated by a 10 min superfusion of ACSF (b’). Labeling of LC neurons with NAI-A594 was not observed in slices from a MOR knockout rat (c, bright field view and c’, fluorescence following incubation with NAI-A594). The labeling of NAI-A594 was blocked with MOR antagonist CTAP as shown by slices containing the LC from TH-GFP mice that were incubated with NAI-A-594 alone (d) and in combination with CTAP (1 µM, d’). (C) Images of the parabrachial nucleus incubated with NAI-A594 using a 2-photon microscope (a) and the PB neurons labeled with NAI-A88 using a spinning disc confocal microscope (b). (D) Images of the same slice containing the LC co-incubated in NAI-A594 (100 nM) and M1-A488 (10 µg/ml, 1 hr at 30°C). (a) shows the NAI-A594 labeling of neurons and processes at 90 µm below the surface. (b) shows the same z-optical section for M1-A488 labeling. *=Labeled neurons.
Figure 3—figure supplement 1
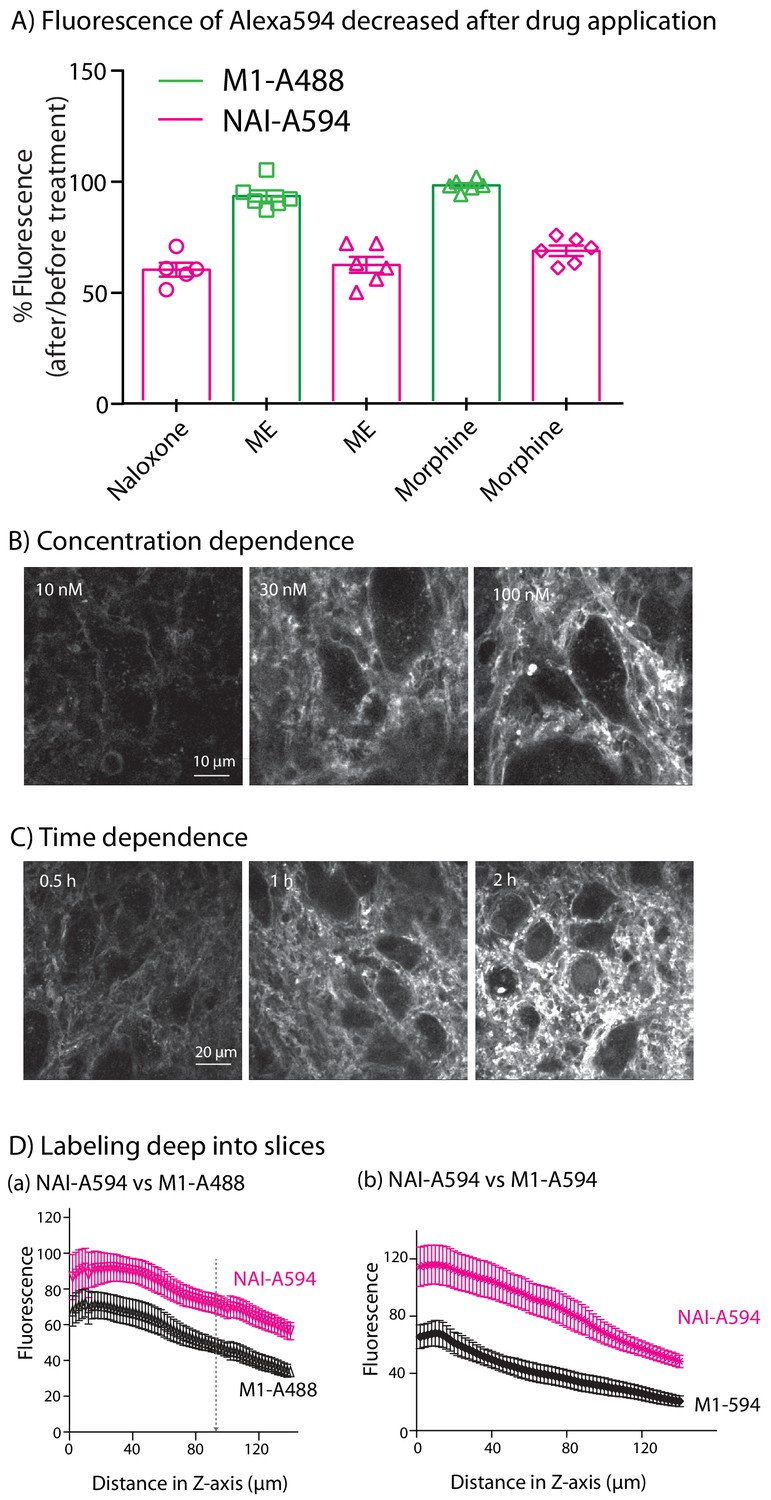
Fluorescence in brain slices.
(A) The normalized fluorescence measured with NAI-A594 decreased by about 30% following treatment with opioid ligands. M1-A488 labeling was not affected. (B) The concentration dependence of labeling. Images show increased fluorescence with increasing concentrations. (C) The time dependence of labeling. Increasing the time of incubation increased the intensity of labeling. (D) Comparison of labeling with NAI-A594 and the M1-antibody (both M1-A488 and M1-A594). Each experiment was done with 3–7 slices and 3–4 rats.
Figure 3—figure supplement 2

NAI-A594 labeled LC neurons from THGFP mice.
GFP positive cells were noradrenergic neurons containing MOR. These cells showed staining of A594 along the plasma membrane. There were many processes that fluoresced in the NAI-A594 channel. When the slices were incubated in NAI-A594 plus CTAP (1 μM), no fluorescence along plasma membrane and processes was observed in the NAI-A594 channel and autofluorescence puncta became more evident. The autofluorescence was also found in GFP negative cells.
Figure 4 with 1 supplement
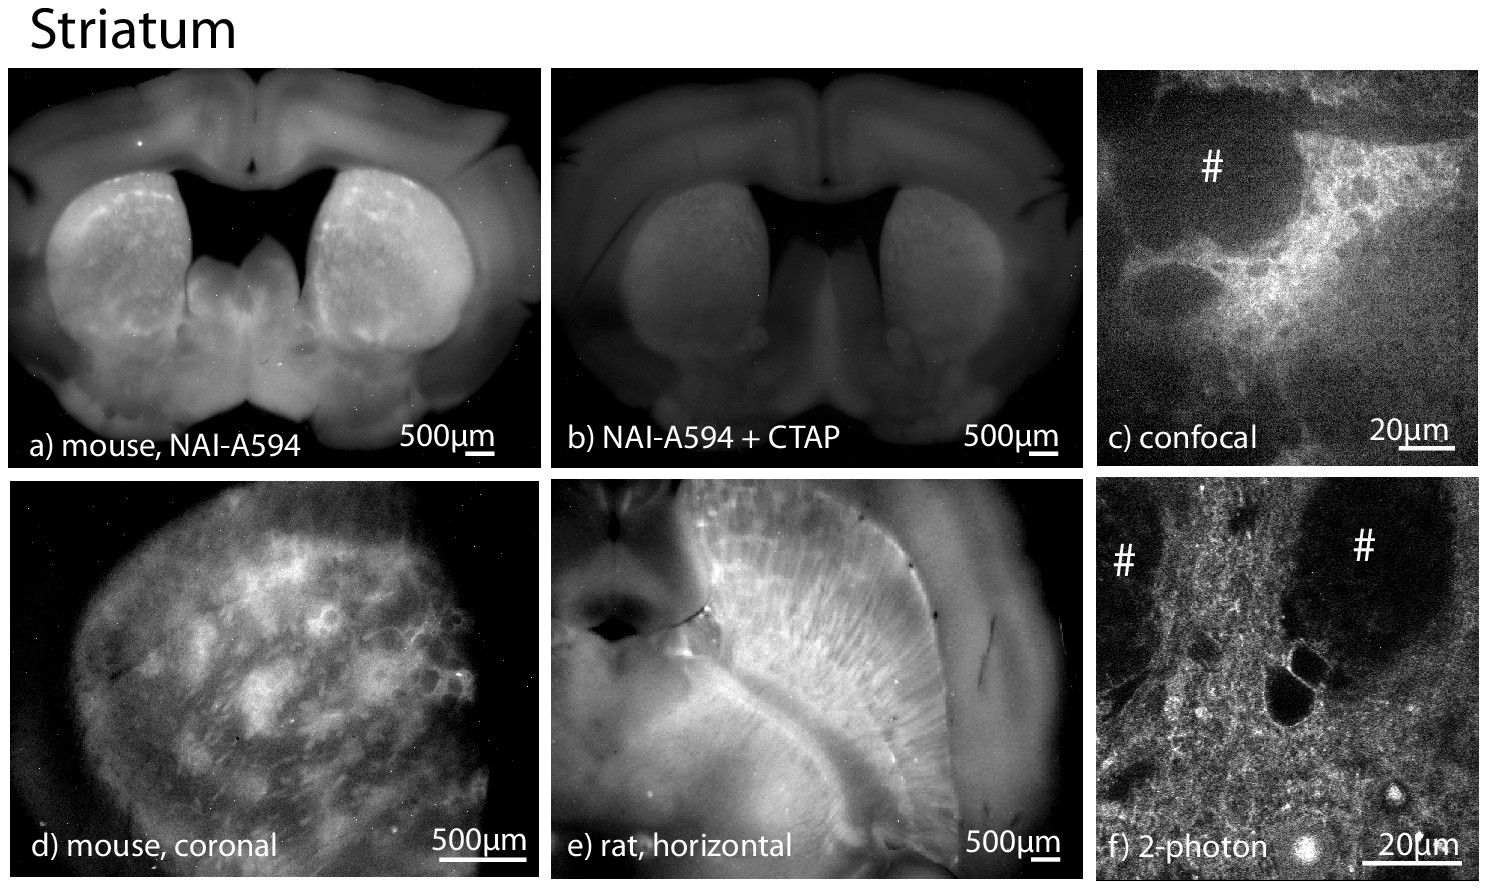
NAI-A594 labeled MOR selectively in patches of the striatum in brain slices from wild type animals.
All images were prepared in coronal sectioning except as specified. (a) NAI-A594 labeled the receptors specifically in the patches of striatum slices from mice. (b) The fluorescence was blocked in slices that were treated with CTAP (1 µM). (c) A low magnification image taken with a spinning disc confocal microscope showing the fluorescence in a patch of the striatum (20x objective) from a wild type rat. (d) A low magnification image of the fluorescence patches in slice from a wild type mouse. (e) A low magnification image of the fluorescence patches taken from a horizontal slice of striatum taken from a wild type rat. (f) An image taken with a 2-photon microscope of the cells within a fluorescence patch induced by NAI-A594. # is the area of fiber tracts.
Figure 4—figure supplement 1
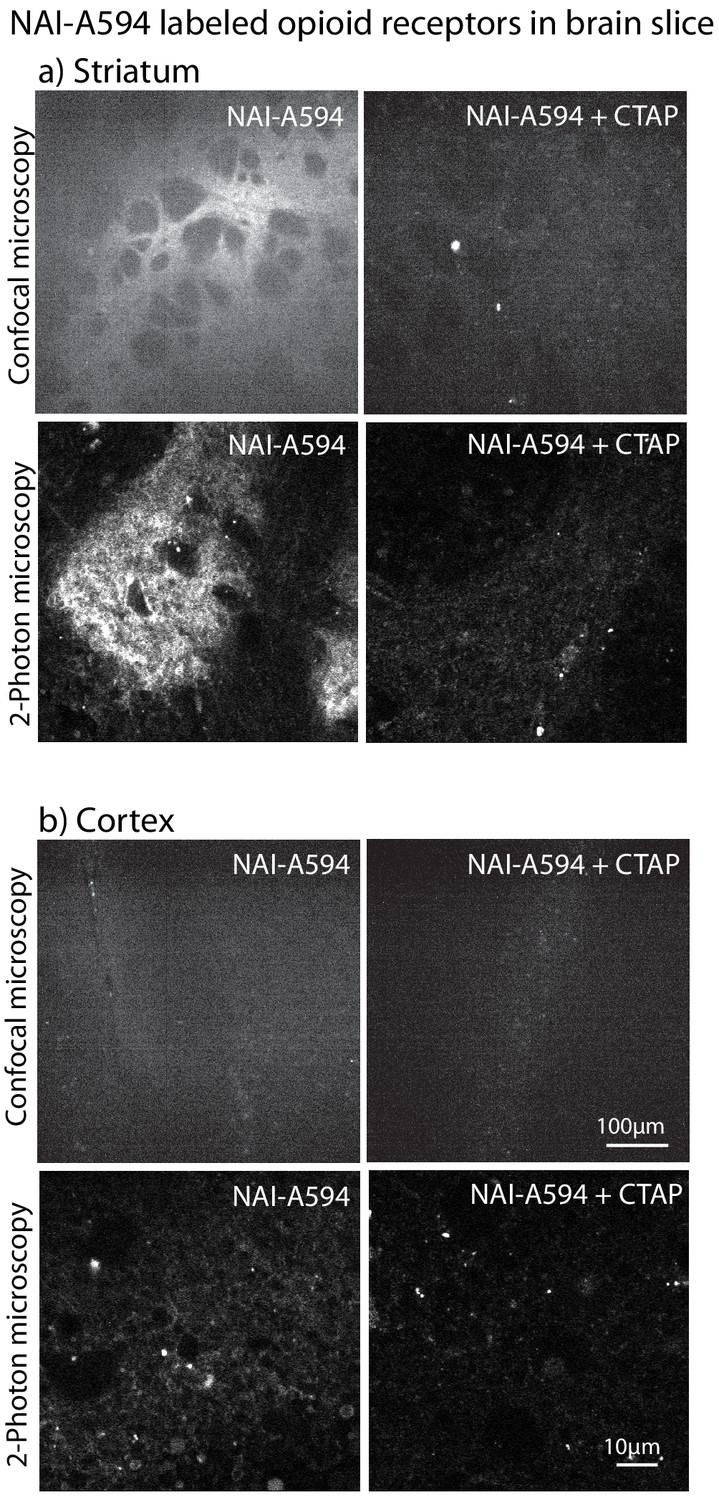
Fluorescent micrographs in striatum and cingulate cortex showed that NAI-A594 primarily labeled endogenous MORs.
(a) The striatal patches were strongly labeled when images were taken with a spinning disc confocal microscope and a 2-photon microscope. These fluorescent signals were absent when CTAP (1 μM) was included in the labeling solution. (b) The staining of NAI-A594 in the area of cingulate cortex was very weak and only observed when images were taken by a 2-photon microscope. No fluorescence was detected in CTAP treated slices. The excitation power and gain were maintained the same for all of these experiments.
Figure 5
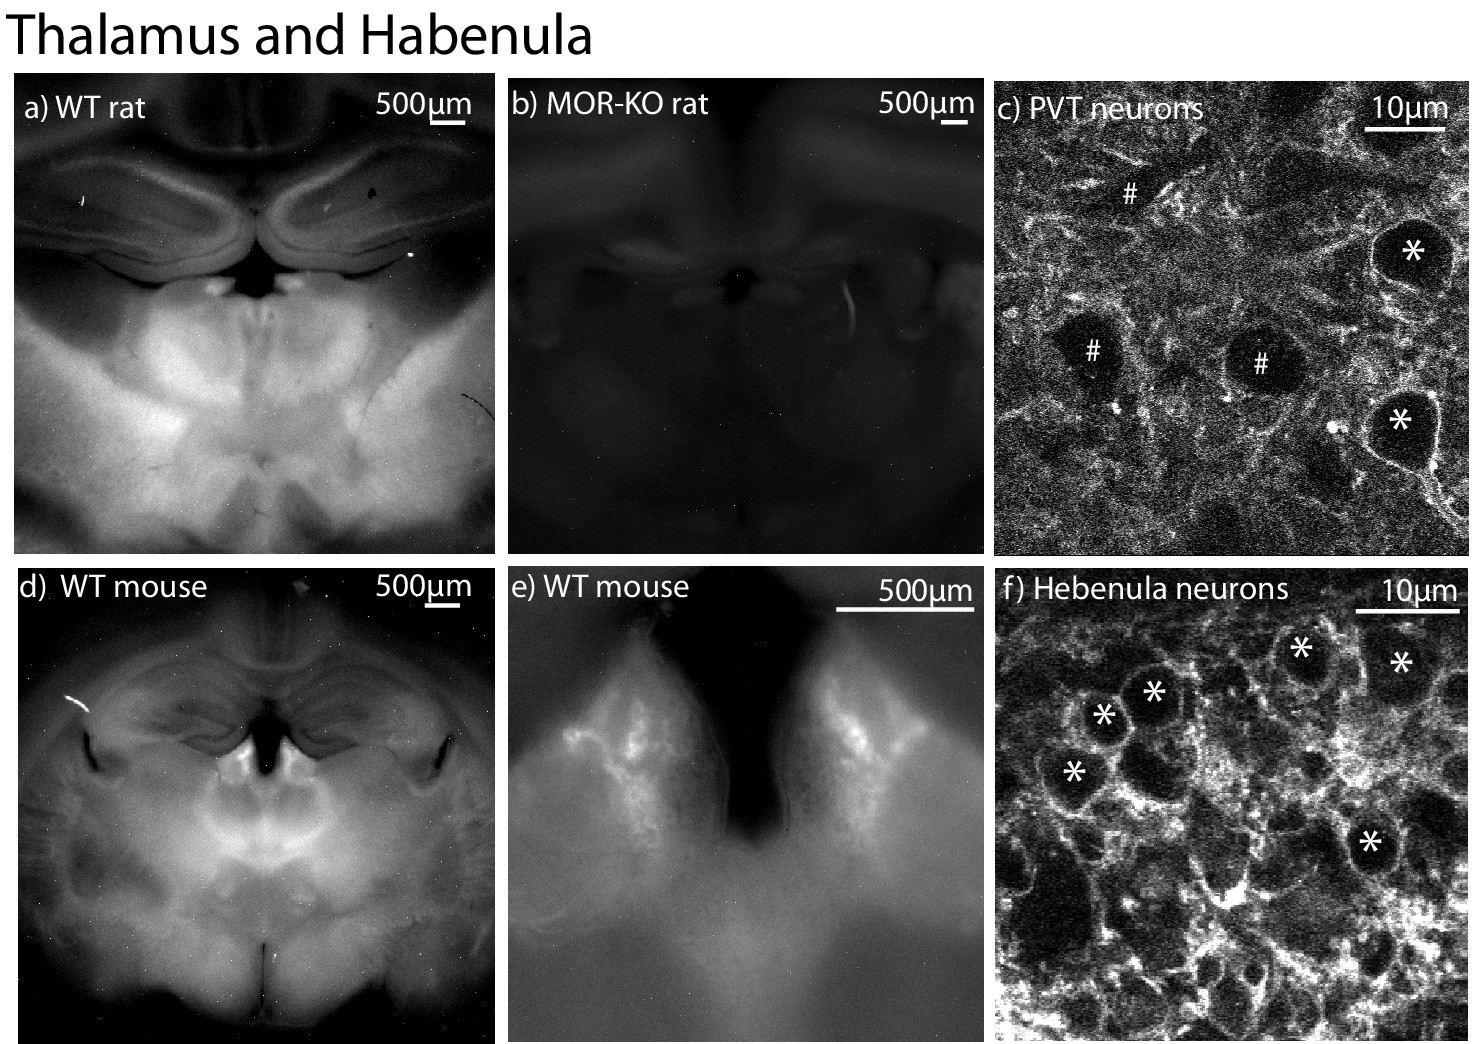
Localization of NAI-A594 induced labeling in the thalamus and habenula.
(a) A low magnification image of a coronal brain slice taken from a wild type rat following incubation with 100 nM NAI-A594 for 1 hr. The habenula and mediodorsal (MD) thalamus show strong fluorescence, (b) another slice containing the habenula and MD thalamus taken from a MOR knockout rat, shows no fluorescence. (c) An image taken with a 2-photon microscope in the area of the paraventricular thalamus (PVT) showing two cells that were labeled and three cells that were not labeled with NAI-A594. (d–f) a sequence of images beginning with low magnification images in the area of the habenula (d,e) and ending with a 2-photon image of stained cells in the habenula. *=Labeled and #=non labeled neurons.
Figure 6
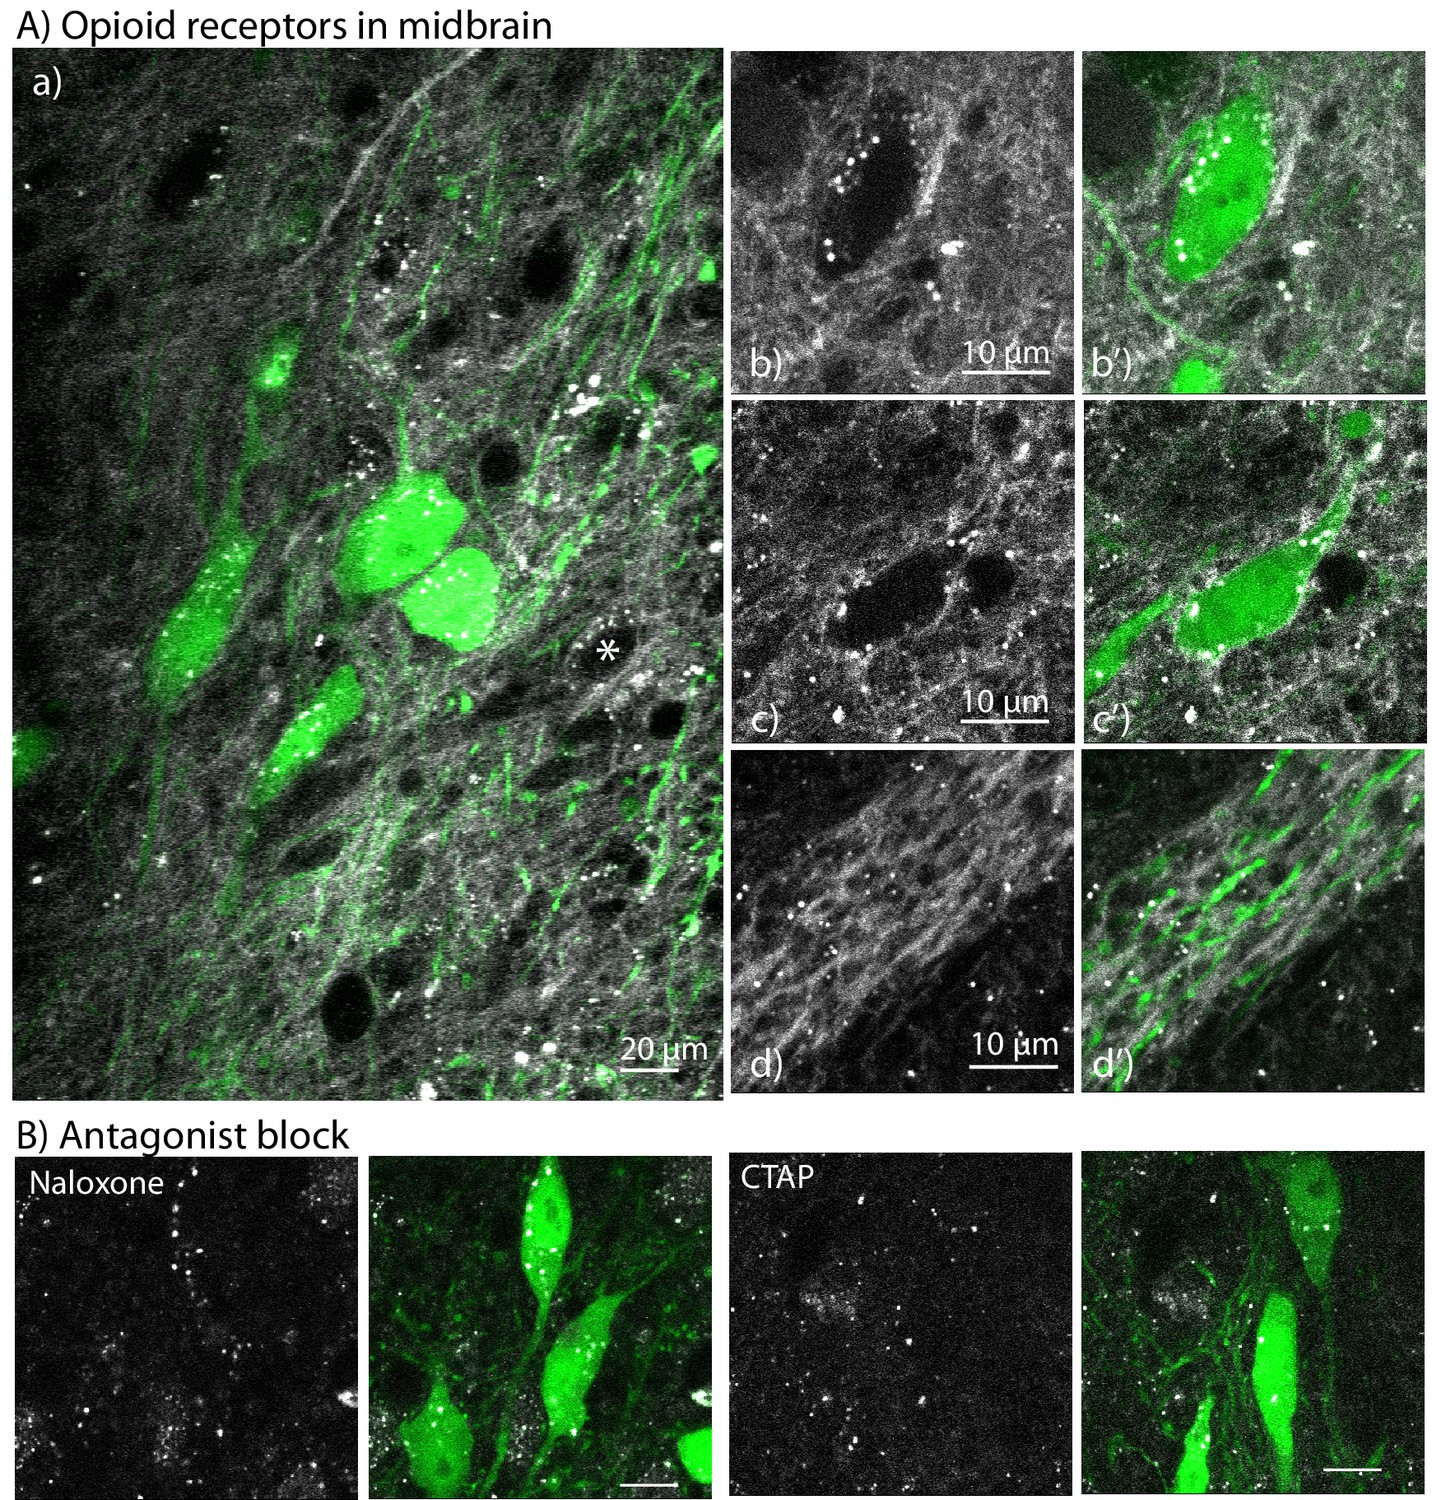
The labeling of NAI-A594 in the midbrain of brain slices from TH-GFP mouse.
(A) Labeling with NAI-A594 identified a small population of MOR neurons (a) comparison of the staining induced by NAI-A594 and the GFP fluorescence in TH positive neurons; (b, b’) shows one TH-GFP positive (green) neuron without A594 fluorescence along the plasma membrane; (c,c’) shows NAI-A594 induced fluorescence on plasma membrane of a GFP positive neuron.In both images, NAI-A594 induced fluorescence was strong in fibers; (d, d’) shows the labeling of NAI-A594 on some dendrites that do not originate from green neurons. (B) Incubation of slices with naloxone (10 µM) or CTAP (1 µM) completely blocked the NAI-A594 induced staining. *=An A594-labeled neuron that was TH negative.
Figure 7 with 1 supplement
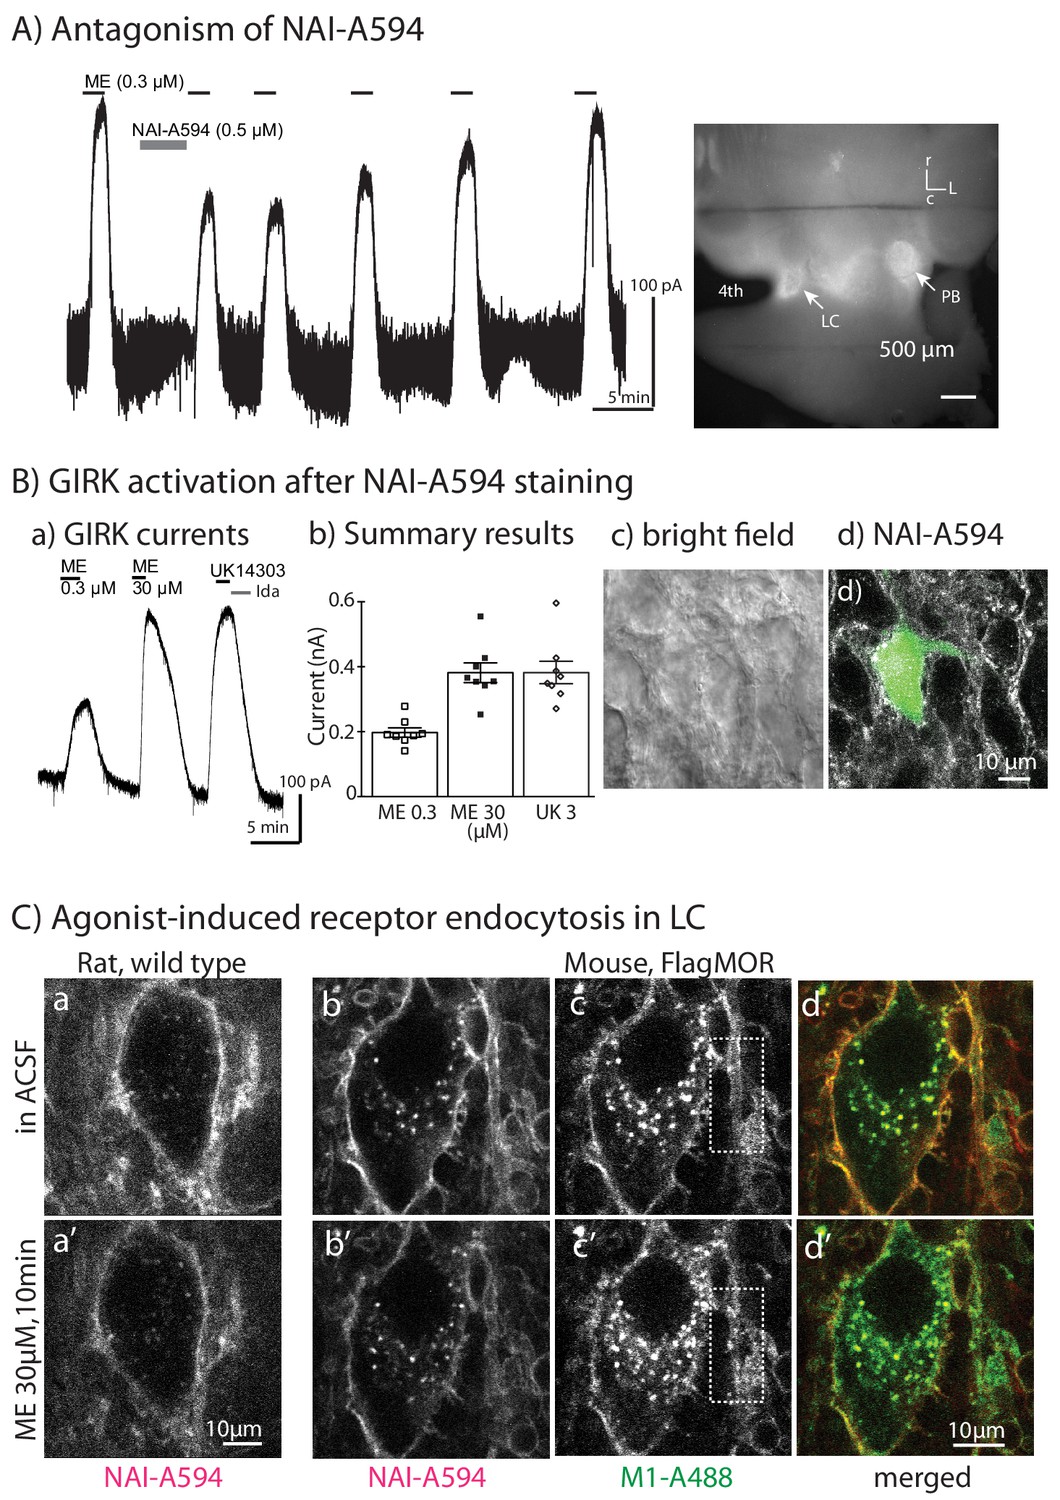
Labeled MORs are functional.
Whole-cell recordings were used to measure GIRK activation induced by ME. (A) Application of NAI-A594 (500 nM) by circulating for 5 min caused a decrease of ME-activated GIRK current. The reduction was reversible after washing out of NAI-A594. The image on the right shows fluorescent staining of the same slice following the recording. The strong fluorescence in the areas of LC and parabrachial nucleus (PB) was observed. (B–a) The tracing shows GIRK activation of a LC neuron from the slice that was incubated in NAI-A594 (30 nM, 1 hr), (B–b). Summarized results show amplitude of the currents induced by the EC50 concentration of ME (300 nM) and the saturating concentration of ME (30 μM) or UK14303 (3 μM). (B–c,d) The micrographs demonstrate the bright field image (c) and the corresponding fluorescent image of a recording neuron labeled with NAI-A594 that was filled with A488 (d). (C) 2-Photon images of LC neurons from a wild type rat labeled with NAI-A594 show fluorescence along the plasma membrane before (a) and after 30 µM ME for 10 min (a’). The 2-photon images of LC neurons from an FMOR transgenic mouse labeled with M1-A488 and NAI-A594 show fluorescence staining before (b,c,d) and after 30 μM ME for 10 min (b’,c’,d’). The dyes were simultaneously excited at 790 nm and autofluorescence was notably observed in the cell somata. White boxes illustrated the fluorescent staining of dendrite with M1-A488 before (c) and after ME application (c’).
Figure 7—figure supplement 1
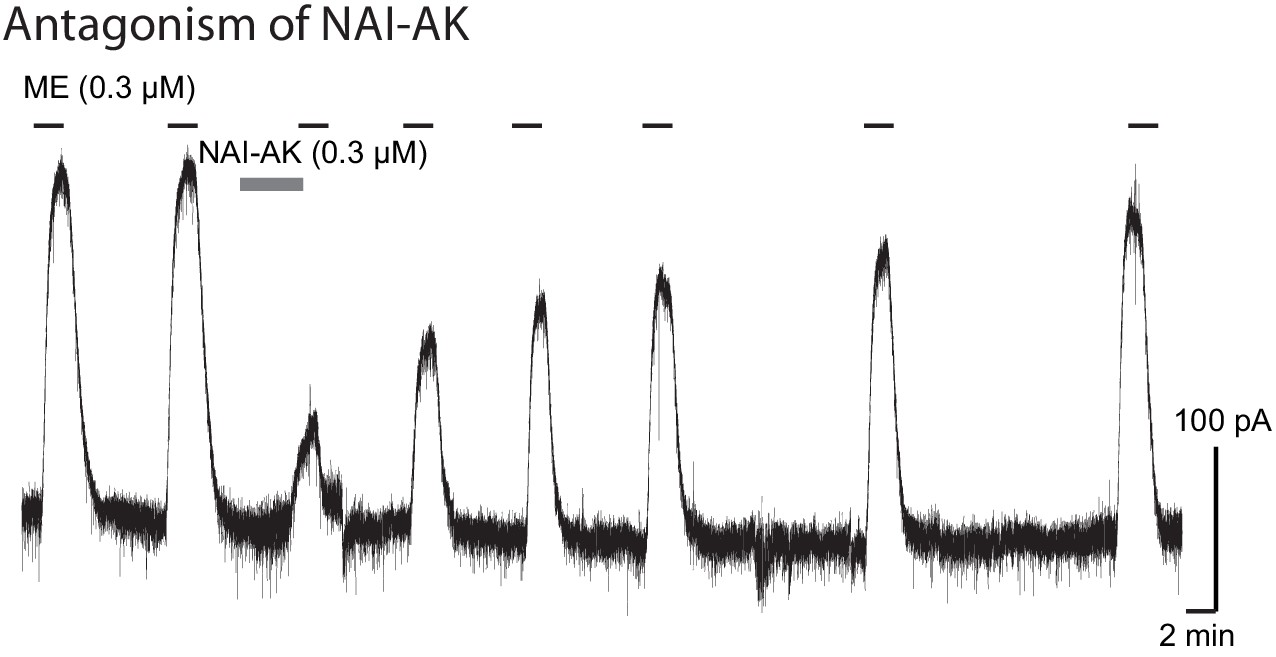
Tracing from whole cell recording showing the activation of GIRK by ME (300 nM) was blocked by application of NAI-AK (300 nM).
The GIRK currents returned to normal after the washout of NAI-AK.
Chemical structure 1
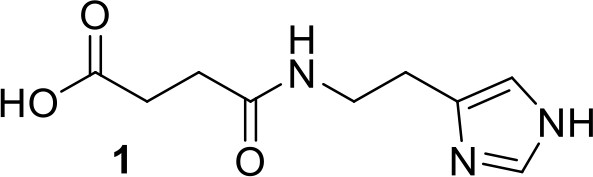
Synthesis of compound 1: 3-{[2-(1H-imidazol-4-yl)ethyl]carbamoyl}propanoic acid.
https://doi.org/10.7554/eLife.49319.021
Chemical structure 2
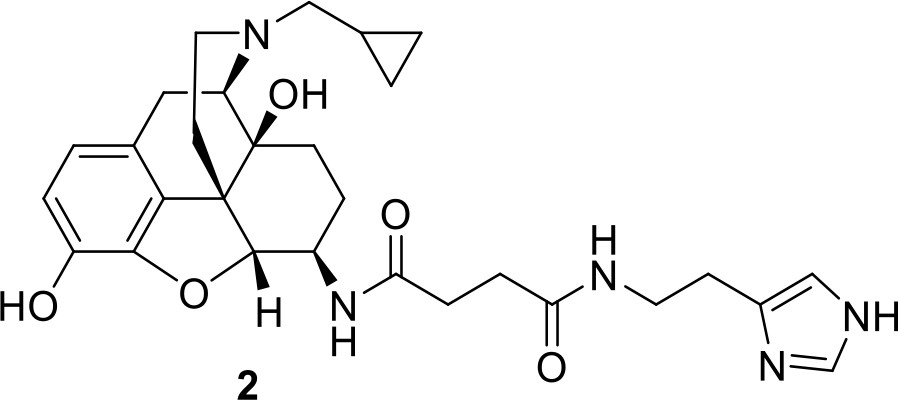
Synthesis of compound 2: N-[(1S,5R,13R,14R,17S)−4-(cyclopropylmethyl)−10,17-dihydroxy-12-0xa-4-azapentacyclo[9.6.1.01,13.05,17.07,18]octadeca-7,9,11(18)-trien-14-yl]-N’-[2-(1H-imidazol-4-yl)ethylbutanediamide.
https://doi.org/10.7554/eLife.49319.022
Chemical structure 3
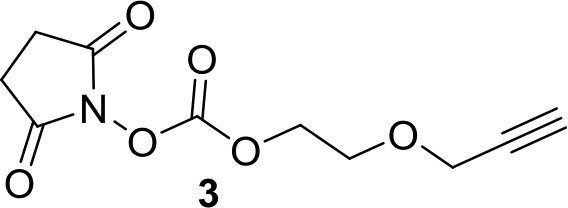
Synthesis of compound 3: 2,5-dioxopyrrolidin-1-yl 2-(pro-2-yn-1-yloxy)ethyl carbonate.
https://doi.org/10.7554/eLife.49319.023
Chemical structure 4
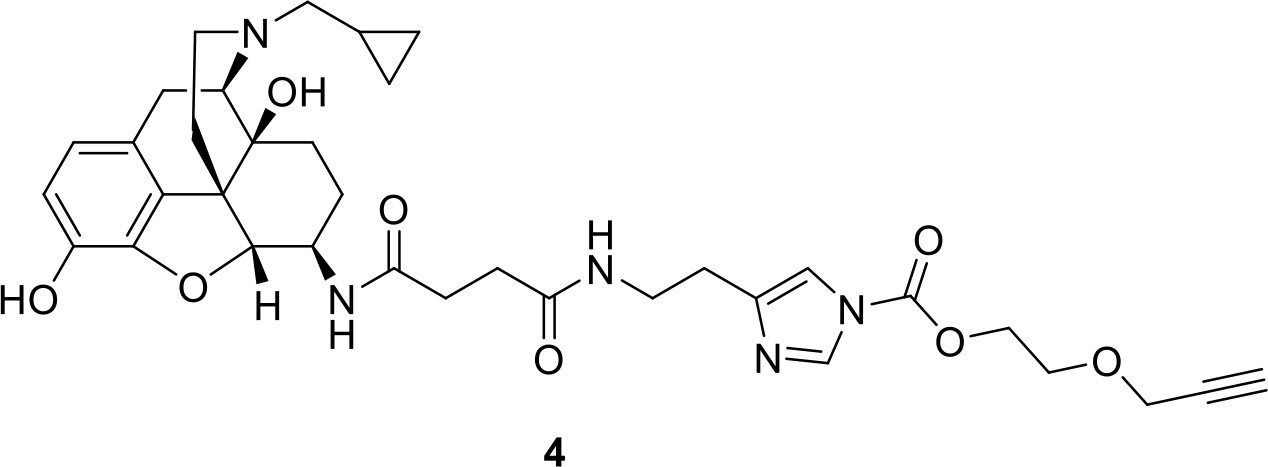
Synthesis of compound 4: 2-(prop-2-yn-1-yloxy)ethyl 4-[2-(3-{[1 s,5R,13R,14R)−4-(cyclopropylmethyl)−10,17-dihydroxy-12-oxa-4-azapentacyclo[9.6.1.01,13.05,17.07,18]octadeca-7,9,11(18)-trien-14-yl]carbamoyl}propanamido)ethyl]−1H-imidazol-1-carboxylate.
https://doi.org/10.7554/eLife.49319.024Videos
Video 1
The image of LC neurons from FMOR mouse labeled with NAI-A594 (30 nM, 1 hr).
The movie shows z-sectioning of 2 µm thickness from near surface into 140 µm depth of the brain slice.
Video 2
The image of LC neurons from FMOR mouse labeled with M1-A488 (10 µg/ml, 1 hr).
https://doi.org/10.7554/eLife.49319.012
Video 3
The image of LC neurons from a wild type rat labeled with NAI-A594 (30 nM, 1 hr).
The movie shows z-sectioning of 2 µm thickness from near surface into 140 µm depth of the brain slice. The movie was imaged with laser excitation at 810 nm.
Video 4
The image of LC neurons from a wild type rat labeled with M1-A594 (10 µg/ml, 1 hr).
The movie was made using the same condition as Video 3.
Tables
Table 1
Competitive binding assays in CHO cells expressing MOR, DOR or KOR receptors.
Data were reported as Ki in nM from two independent experiments performed in triplicate.
| MOR [3H]DAMGO | DOR [3H]DPDPE | KOR [3H]diprenorphine | |
|---|---|---|---|
| Naltrexamine | 0.26 ± 0.02a | 117.06 ± 8.94a | 5.15 ± 0.26a |
| NAI-A594 | 60.36, 53.03 | 81.03, 64.93 | 210.8, 208.2 |
| DAMGO | 0.393, 0.691 | ||
| DPDPE | 0.747, 0.685 | ||
| DynA(1-13)NH2 | 0.973, 0.756 |
-
DAMGO, DPDPE and DynA(1-13)NH2 were tested as positive controls under the same conditions. Each data point was done in triplicate samples. a Reference: Li et al. (2009).
Key resources table
| Reagent type (species) or resource | Designation | Source or reference | Identifiers | Additional information |
|---|---|---|---|---|
| Strain (mouse, C57BL/6J) | wildtype | Jackson Laboratories | Stock # 000664 RRID: IMSR_JAX:000664 | |
| Strain (rat, Sprague Dawley) | wildtype | Charles River Laboratories | Stock # 001 RRID: RGD_734476 | |
| Genetic reagent (mouse) | C57BL/6J (THGFP) | Sawamoto et al., 2001 | N/A | Dr. Kazuto Kobayashi, Fukushima Medical University |
| Genetic reagent (mouse) | C57BL/6J (FLAGMOR) | Arttamangkul et al., 2008 | N/A | Dr. John T. Williams, OHSU |
| Genetic reagent (mouse) | C57BL/6J (MOR knockout) | Schuller et al., 1999 | Oprm1-exon-1 knockout mice | Dr. John E. Pintar, RWJMS |
| Genetic reagent (rat) | Sprague Dawley (MOR knockout) | Horizon Discovery | Oprm1-exon-2 knockout rat | |
| Antibody | Anti-Flag-M1 (mouse monoclonal) | Sigma | Cat# F-3040; RRID: AB_439712 | Conjugation with Alexa488 or Alexa594 and used at 3 or 10 μg/ml |
| Antibody | Anti-MOR (UMB3-rabbit monoclonal) | ABCAM | Cat# ab134054 | 1:100 |
| Antibody | Anti-Alexa Fluor 488 (rabbit polyclonal) | Thermo Fisher | Cat# A-11094; RRID: AB_221544 | 1:500 |
| Antibody | Anti-Flag M1 agarose affinity gel | Sigma | Cat# A4596 | 50 μl/ml |
| Chemical compound, drug | β-naltrexamine | NIDA | N/A | Dr. Kenner Rice, NIDA |
| Chemical compound, drug | [Met5]enkephalin | Sigma | Cat# M6638 | |
| Chemical compound, drug | Morphine | NADA | N/A | |
| Chemical compound, drug | CTAP | Sigma | Cat# C6352 | |
| Chemical compound, drug | Naloxone HCl | Hello Bio | Cat# HB2451 | |
| Chemical compound, drug | AFdye 594 azide | Click Chemistry Tools | Cat# 1295–1 | |
| Chemical compound, drug | AFdye 488 azide | Click Chemistry Tools | Cat# 1275–1 | |
| Chemical compound, drug | NAI-A594 | This manuscript | N/A | Dr. John T. Williams, OHSU |
| Chemical compound, drug | NAI-A488 | This manuscript | N/A | Dr. John T. Williams, OHSU |
| Software | ScanImage | Vidrio Technologies, LLC | ScanImage, RRID: SCR_014307 | |
| Software | Prism | GraphPad | 6.0d for Mac OS X | |
| Software | ImageJ | www.imagej.nih.gov | 1.44o |
Additional files
-
Transparent reporting form
- https://doi.org/10.7554/eLife.49319.025
Download links
A two-part list of links to download the article, or parts of the article, in various formats.
Downloads (link to download the article as PDF)
Open citations (links to open the citations from this article in various online reference manager services)
Cite this article (links to download the citations from this article in formats compatible with various reference manager tools)
Visualizing endogenous opioid receptors in living neurons using ligand-directed chemistry
eLife 8:e49319.
https://doi.org/10.7554/eLife.49319


