Kinetochores attached to microtubule-ends are stabilised by Astrin bound PP1 to ensure proper chromosome segregation
- Queen Mary University of London, United Kingdom
- University of Cambridge, United Kingdom
Figures
Figure 1 with 2 supplements
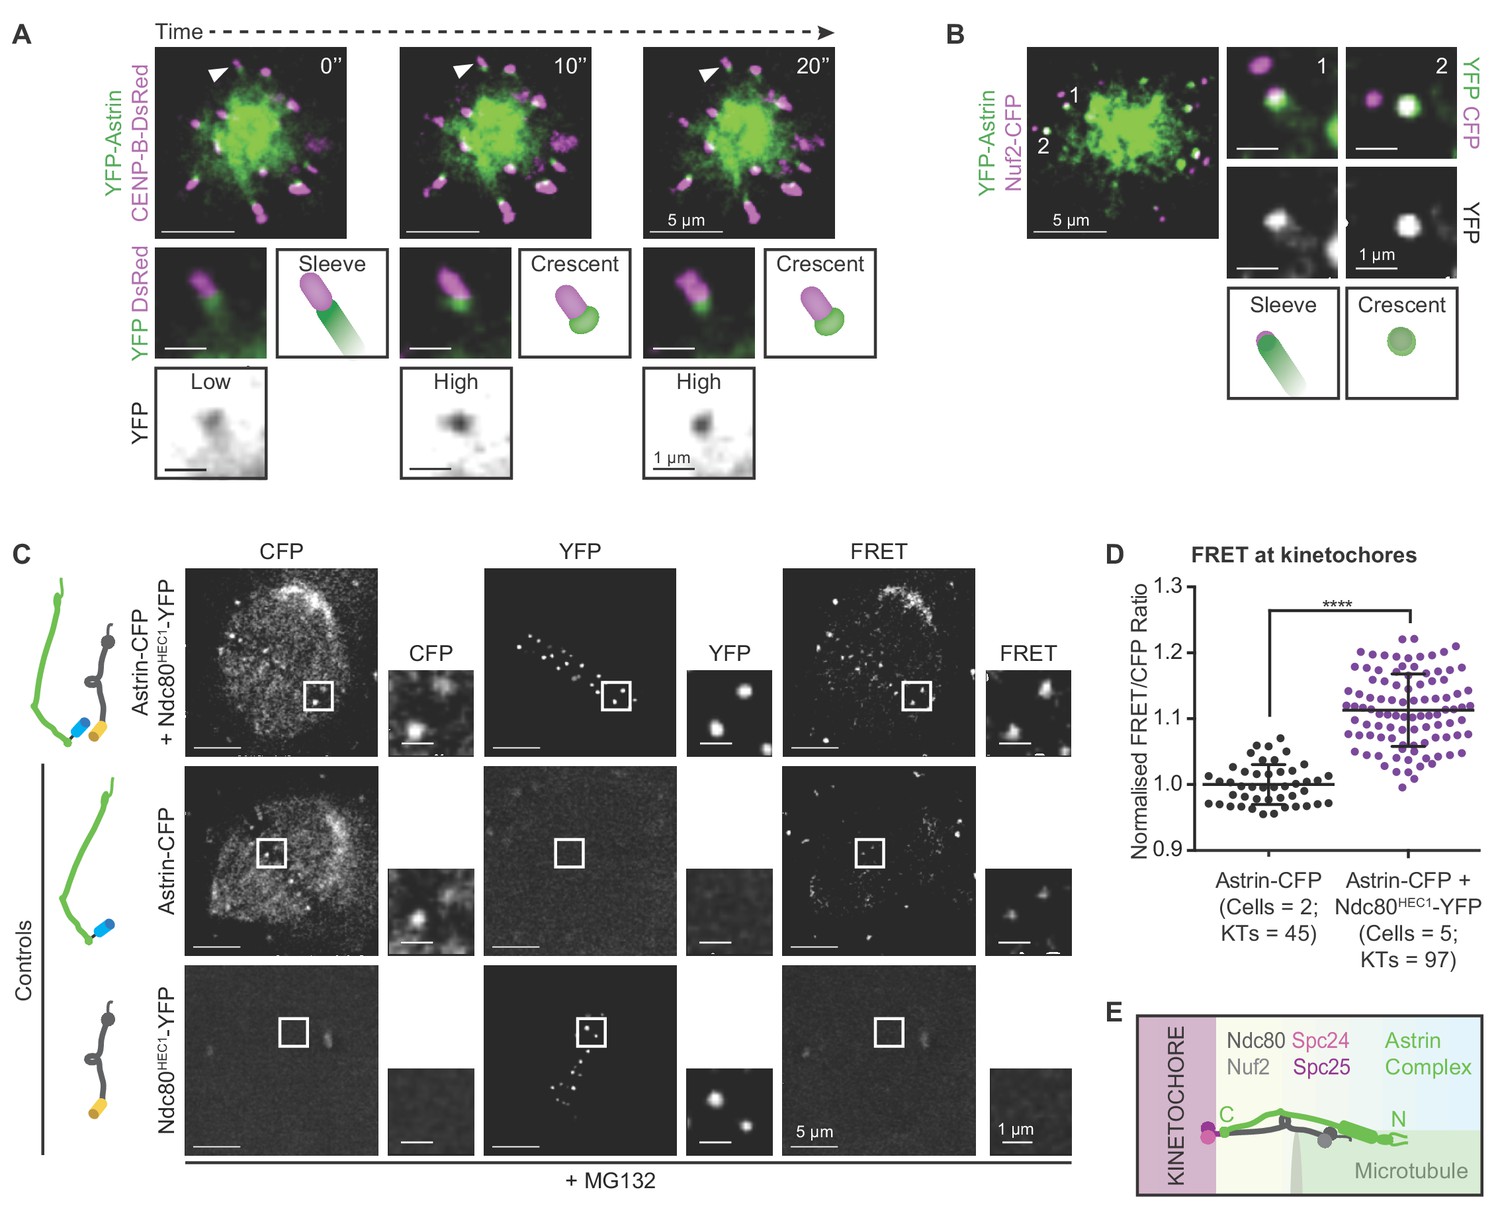
Before biorientation, Astrin is recruited to kinetochores proximal to Ndc80.
(A) Time-lapse images of monopolar spindles in STLC treated HeLa FRT/TO cells co-expressing YFP-Astrin and CENP-B-DsRed show transition of Astrin from sleeve-like to crescent-like kinetochore structure. Each frame is an average-intensity projection of 3 z-planes, 300 nm apart. White arrowhead in main image marks kinetochore magnified in cropped-insets. ‘Sleeve’ refers to low Astrin signal intensities at kinetochore that extend into the microtubule-end and ‘Crescent’ refers to relatively high Astrin signal intensities retained exclusively at kinetochore. YFP inset shows inverted image intensities to highlight Astrin-low to Astrin-high transition. (B) Representative live-cell image (average-intensity projections of 4 z-planes 200 nm apart) of monopolar spindles show Astrin -sleeves and -crescents in STLC treated HeLa FRT/TO cells coexpressing YFP-Astrin and Nuf2-CFP. Numbers mark kinetochores magnified in cropped-insets. (C) Representative live-images of bipolar spindles show FRET emission (excitationCFP/emissionYFP) in MG132 treated HeLa cells expressing either Astrin-CFP or Ndc80HEC1-YFP singly or both Astrin-CFP and Ndc80HEC1-YFP as indicated (cartoons on left). (D) Graph shows FRET/CFP intensity ratios of kinetochores imaged as in (C). Each dot represents intensity ratios from one kinetochore. Black bars and whiskers mark average value and standard deviation, respectively, across two experimental repeats. ‘*' indicates statistically significant difference. Scale as indicated. (E) Cartoon shows the orientation of kinetochore-microtubule bridges: the C-term of Astrin resides proximal to the C-term of Ndc80.
Figure 1—figure supplement 1
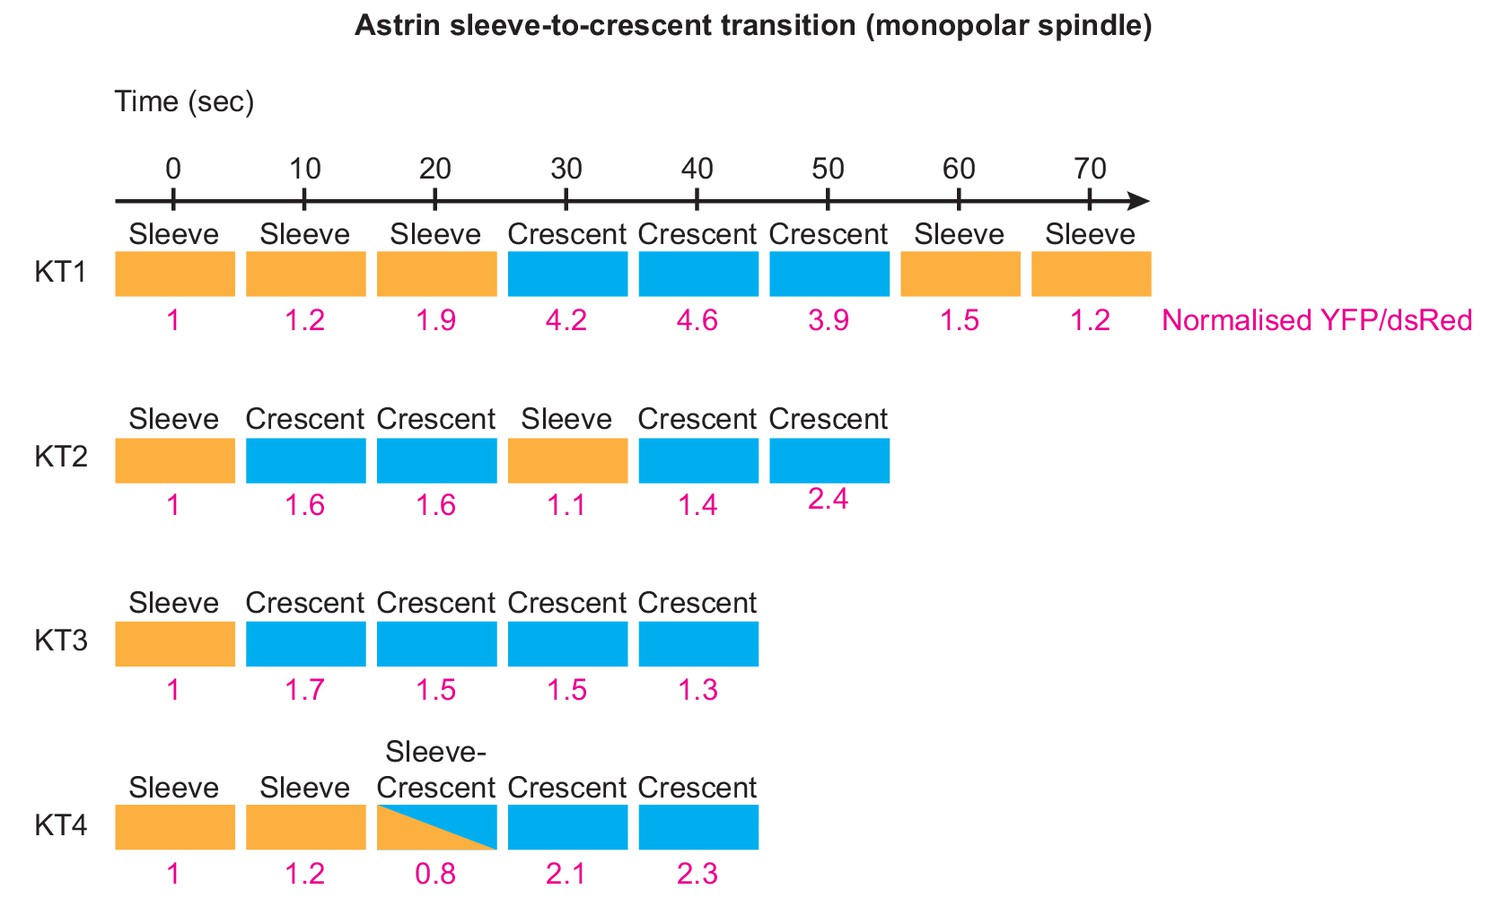
Transition of Astrin sleeve into a crescent shape at the kinetochore is associated with changes in Astrin intensities.
Temporal evolution of Astrin signal intensities and shape at four kinetochores selected at random. Intensities of YFP-Astrin were normalised against CENP-B-DsRed in cells coexpressing both markers as described in Figure 1A. Sleeves refer to Astrin signals at outer kinetochore that extend into microtubule-ends, while crescent refers to Astrin signals restricted to outer kinetochore region. Sleeve-Crescent refers to a timepoint when the shape could not be defined clearly. Measurement of changes in YFP/DsRed signals, through time, shows that sleeves are associated with relatively lower Astrin intensities compared to crescents (values in pink). Following sleeves and crescents at kinetochores of monopolar spindles show transition between the two stages.
Figure 1—figure supplement 2
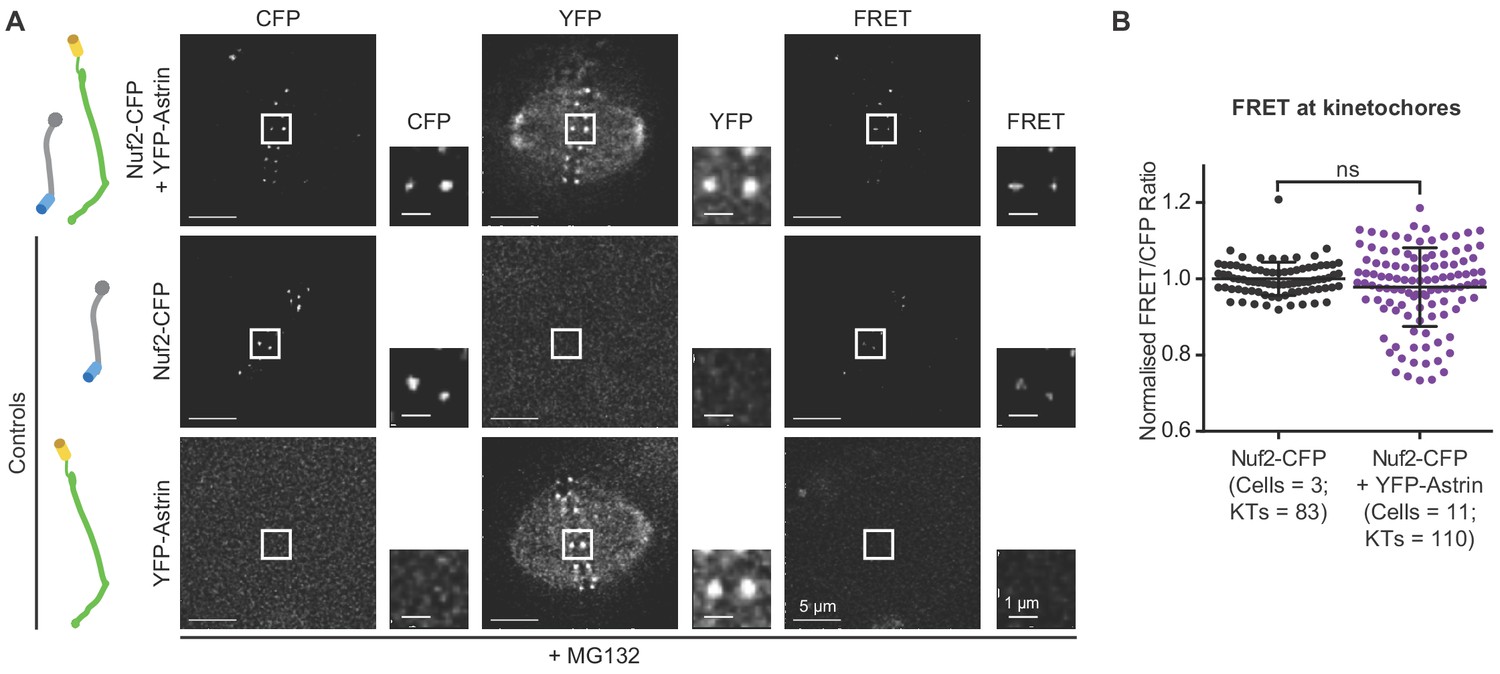
A stable pool of Astrin localises at metaphase kinetochores.
(A) Representative live-images of bipolar spindles show poor FRET emission (excitationCFP/emissionYFP) in MG132 treated HeLa cells expressing either Nuf2-CFP or YFP-Astrin singly or both Nuf2-CFP and YFP-Astrin, as indicated (cartoons on left). Cells were arrested in metaphase using MG132. (B) Graph shows FRET/CFP intensity ratios of kinetochores imaged as in (A). Each dot represents value from one kinetochore. Black bars and whiskers mark average value and standard deviation, respectively, across two experimental repeats. ‘ns’ indicates statistically insignificant differences. Scale as indicated.
Figure 2 with 1 supplement
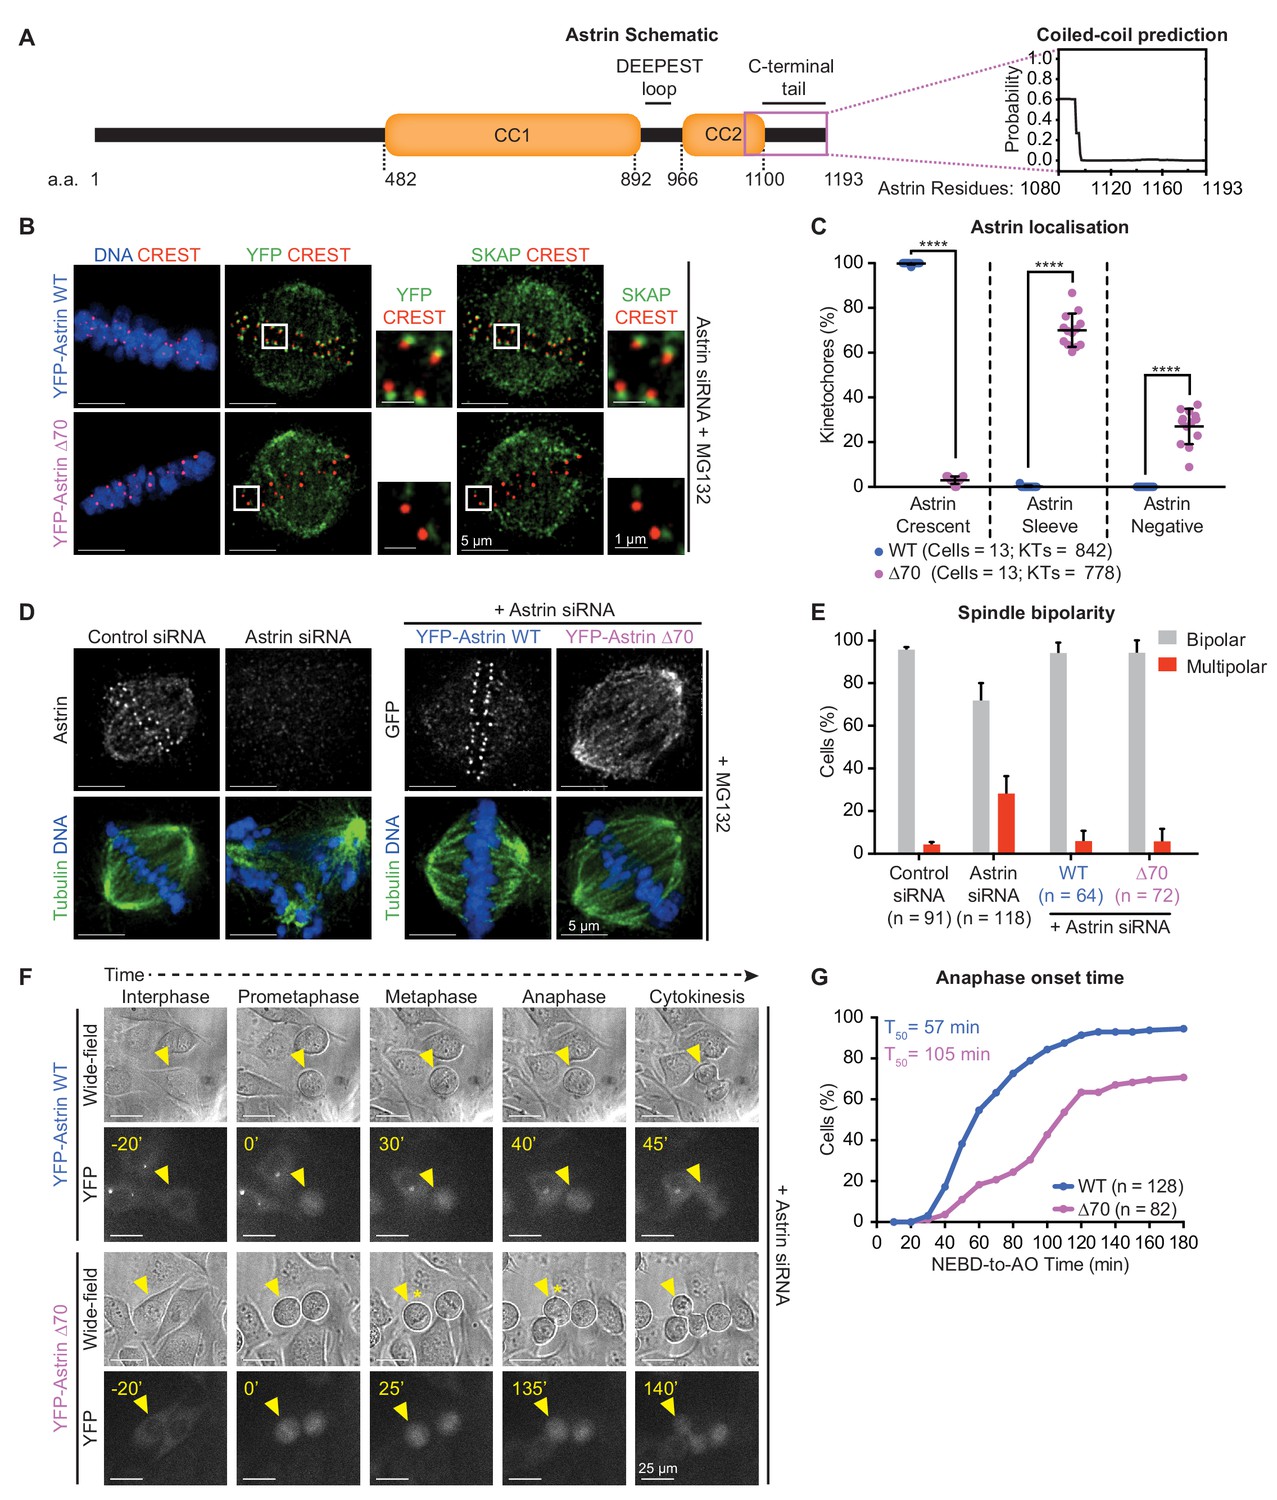
Recognition of end-on kinetochores requires Astrin’s 70 a.a c-terminal tail.
(A) Schematic of Astrin protein domains. Graph of predicted coiled-coil or unstructured region in Astrin C-terminus modelled as a dimer using Multicoil (Wolf et al., 1997) (1080–1193 a.a). (B) Representative deconvolved images show YFP-Astrin (WT or ∆70) kinetochore intensities. HeLa cells depleted of endogenous Astrin, expressing siRNA-resistant YFP-Astrin (WT or ∆70) were arrested with MG132, immunostained with antibodies against GFP and SKAP and CREST antisera and stained with DAPI for DNA. (C) Graph of percentage of Astrin sleeves or crescents at the outer-kinetochores of YFP-Astrin (WT or ∆70) expressing cells as in (B). Black bars and whiskers mark average value and standard deviation, respectively, across two experimental repeats. ‘*' indicates statistically significant differences. (D) Representative deconvolved images show the rescue of spindle bipolarity defects in cells depleted of endogenous Astrin expressing an siRNA-resistant YFP-Astrin (WT or ∆70). Astrin depletion was confirmed by comparing levels of endogenous Astrin in Control versus Astrin siRNA treated cells. Cells were immunostained with antibodies against either GFP or Astrin (indicated) and Tubulin and co-stained with DAPI for DNA. (E) Bar graph of percentage of bipolar or multipolar spindles in mitotic cells treated as in (D). Bars and whiskers mark average value and standard deviation, respectively, across at least three experimental repeats. (F) Time-lapse images of HeLa FRT/TO cells treated with Astrin siRNA and expressing either YFP-Astrin (WT or ∆70). Yellow triangle indicates the cell tracked; Yellow asterisks highlight prolonged delay between metaphase and anaphase. Cytoplasmic YFP signal was used to assess Nuclear Envelope BreakDown (NEBD), wide-field and YFP images were used to assess bipolar metaphase spindles undergoing anaphase (AO). (G) Cumulative graph of percentage of HeLa FRT/TO cells (as in F) that initiated NEBD and completed AO within time intervals indicated. ‘n’ refers to cell numbers. T50 indicates AO time consumed by at least 50% of mitotic cells. Scale as indicated.
Figure 2—figure supplement 1
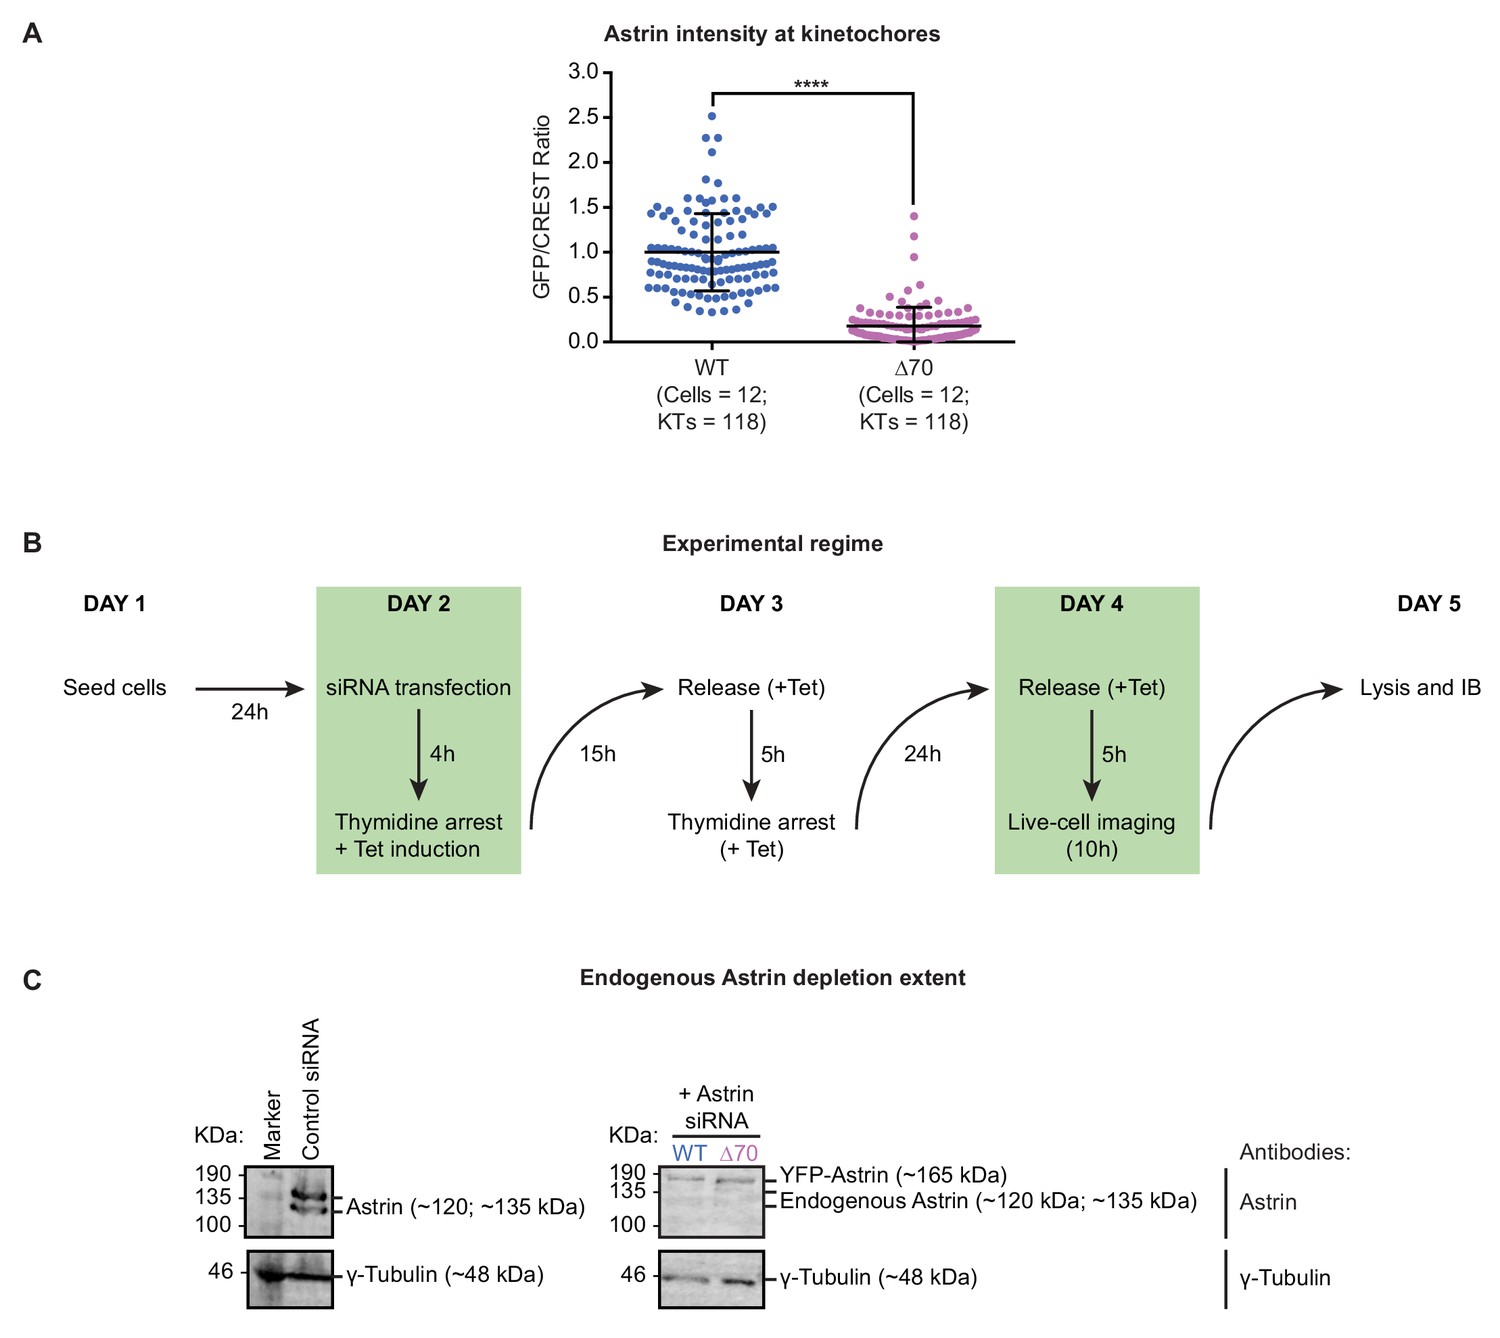
Depletion of endogenous Astrin and conditional expression of Astrin mutants.
(A) Graph shows normalised Astrin/CREST signal intensities in HeLa cells expressing YFP-Astrin WT or ∆70 mutant. HeLa cells depleted of endogenous Astrin, expressing siRNA-resistant YFP-Astrin (WT or ∆70) were arrested with MG132, immunostained with antibodies against GFP and HEC1 and CREST antisera and stained with DAPI for DNA. Each dot represents value from one kinetochore. Black bars and whiskers mark average value and standard deviation, respectively, of kinetochore intensities across cells in three independent repeats. ‘*' indicates statistically significant differences. (B) Experimental regime: HeLa FRT/TO cells expressing siRNA-resistant YFP-Astrin (WT or ∆70 mutant) were treated with Control or Astrin siRNA and induced with Tetracycline containing media for 48 hr prior to imaging overnight for 10 hr (images in Figure 2F) and collecting lysates for immunoblots to assess the extent of endogenous Astrin depletion. Cells were treated with a double thymidine block to enrich for the mitotic population of cells at the time of imaging. (C) Immunoblots show the extent of endogenous Astrin protein depletion in cells as in (B). For control siRNA condition, HeLa FRT-TO cell line was used. Immunoblots were probed using antibodies against Astrin and γ-Tubulin (loading control). Marker protein size (KDa) positions highlighted on the left.
Figure 3 with 4 supplements
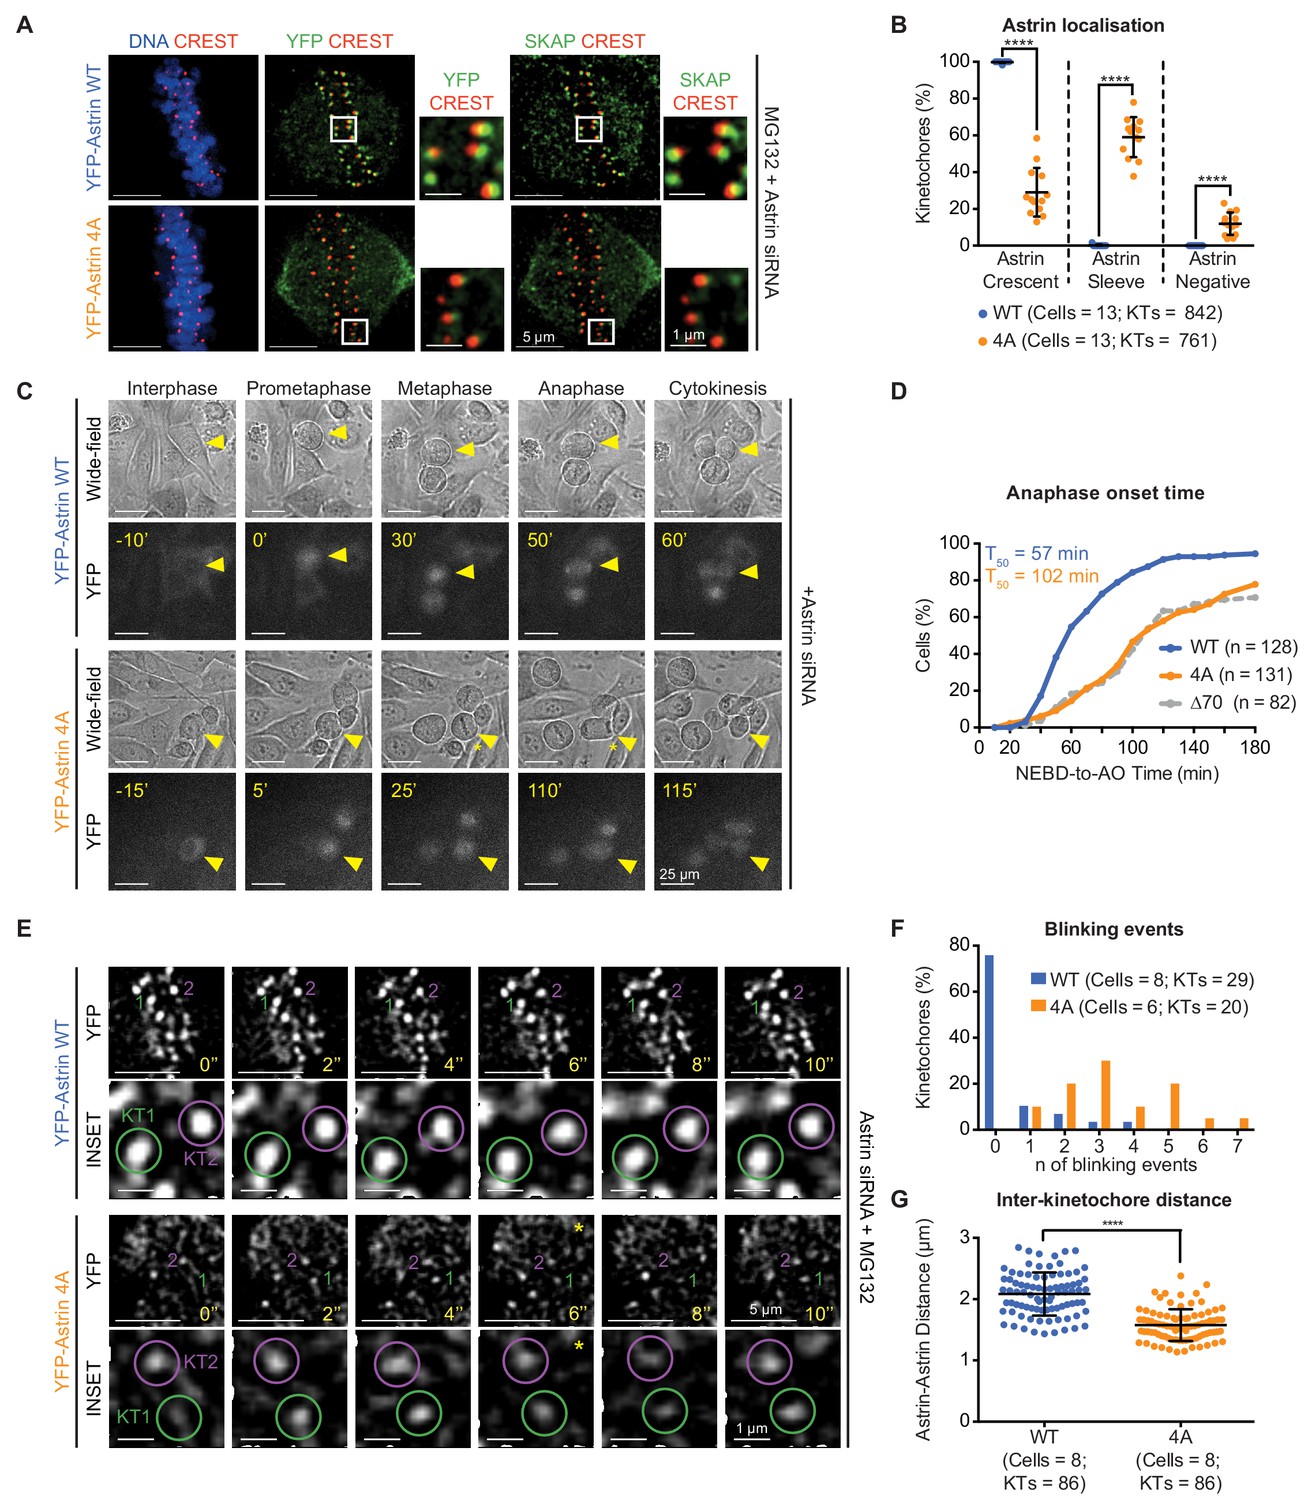
Withstanding MT-end mediated KT-pulling needs Astrin’s PP1 docking motif.
(A) Representative images show YFP-Astrin (WT or 4A) kinetochore intensities in HeLa cells depleted of endogenous Astrin and arrested using MG132. Cells were immunostained with antibodies against GFP and SKAP and CREST antisera and stained with DAPI for DNA. (B) Graph of percentage of Astrin sleeves or crescents at the outer-kinetochores of YFP-Astrin (WT or 4A), as indicated, in cells treated as in (A). Black bars and whiskers mark average value and standard deviation, respectively, from values across two experimental repeats. ‘*' indicates statistically significant differences. (C) Time-lapse images of HeLa FRT/TO cells treated with Astrin siRNA and expressing YFP-Astrin (WT or 4A), as indicated. Yellow triangle indicates the cell tracked; Yellow asterisks highlight prolonged delay between metaphase and anaphase. Cytoplasmic YFP signal was used to assess Nuclear Envelope BreakDown (NEBD), wide-field and YFP images were used to assess bipolar metaphase spindles undergoing anaphase (AO). (D) Cumulative graph of percentage of HeLa FRT/TO cells (as in C) that initiated NEBD (Nuclear Envelope Break-Down) and completed AO (Anaphase Onset) within time intervals indicated. n and T50 refer to cell numbers and AO time in 50% of cells, respectively. Astrin ∆70 and WT data are from Figure 2G. (E) Time-lapse images of HeLa FRT-TO YFP-Astrin (WT or 4A) siRNA-resistant cells, depleted of endogenous Astrin and arrested with MG132 (1 hr) before imaging. Green and magenta circles highlight Astrin-crescents. KT2 (magenta circle) in YFP-Astrin-4A expressing cell marks an Astrin-crescent gradually dimming into an Astrin-sleeve. Yellow asterisk refers to this blinking event. (F) Frequency graph of distribution of the number of blinking events (as in E) in kinetochores tracked for 60 s. KTs and n refers to the kinetochore numbers and blinking events, respectively. (G) Graph of average distance between Astrin-crescents of kinetochore pairs measured using time-lapse movies as in (E). Black bars and whiskers mark average value and standard deviation, respectively, across at least two experimental repeats. ‘*' indicates statistically significant differences. Scale as indicated.
Figure 3—figure supplement 1
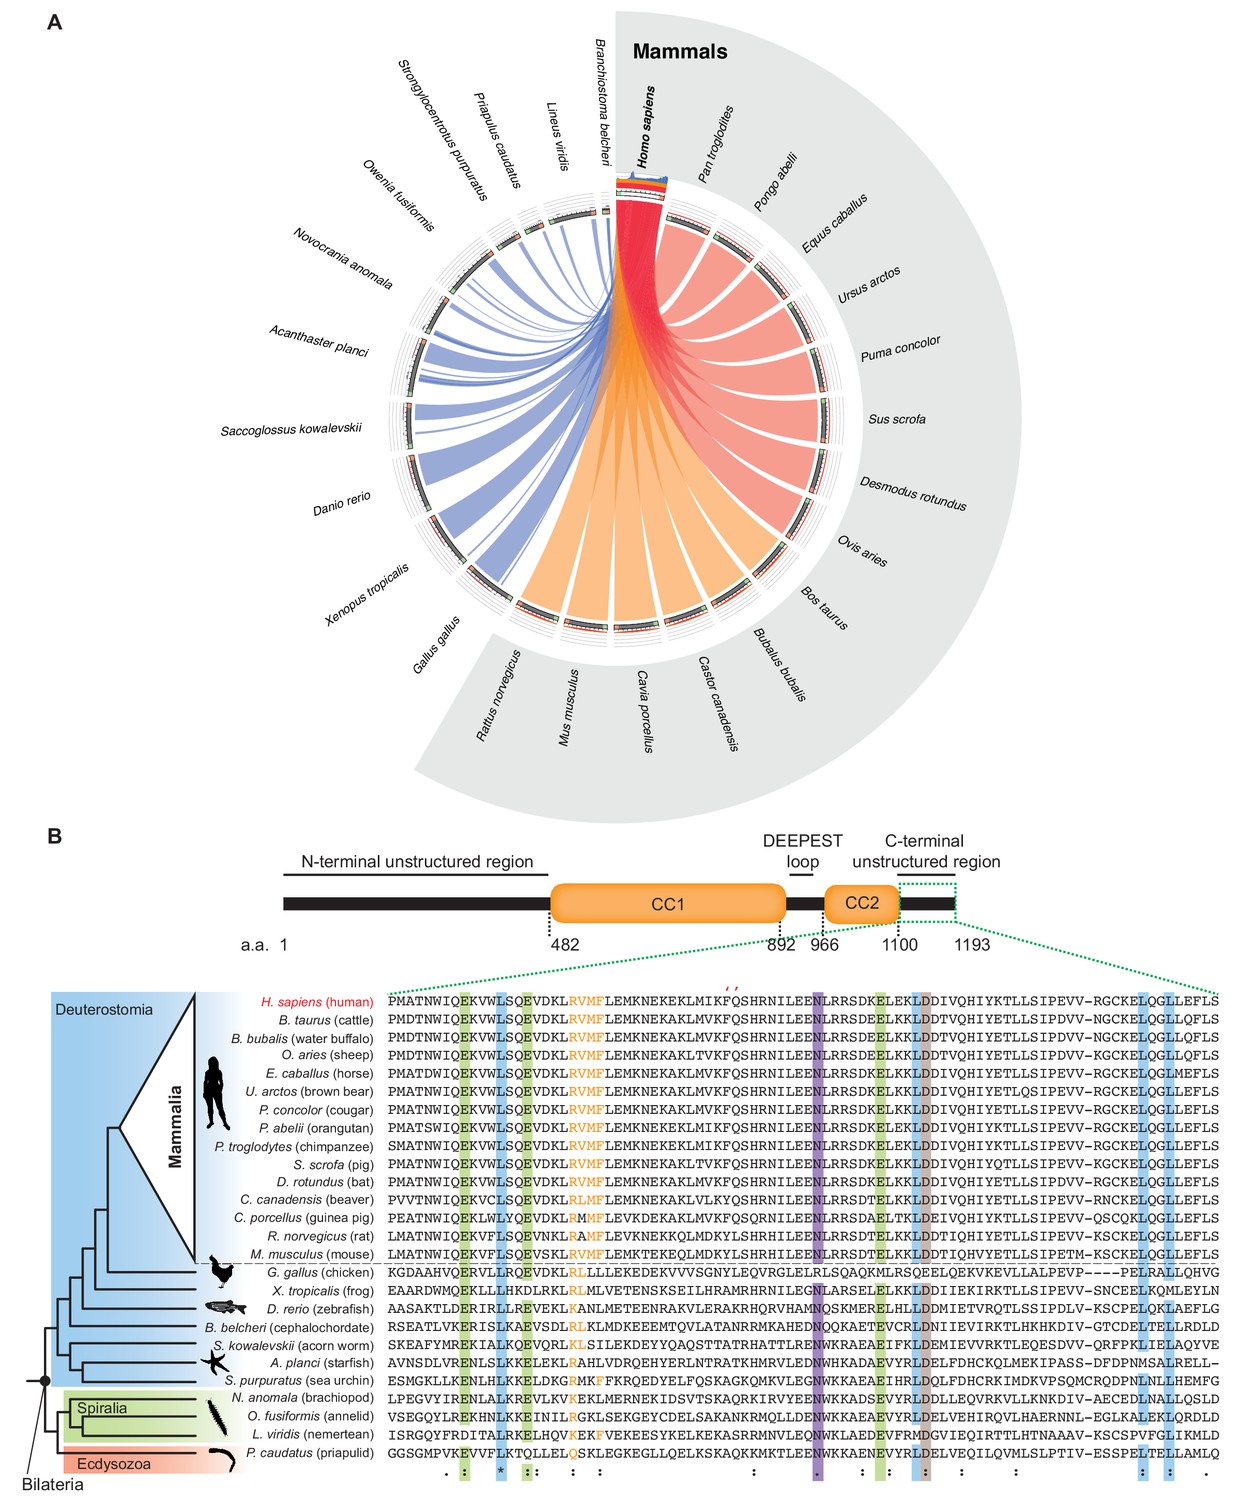
Evolutionary conservation of Astrin tail across Bilateria.
(A) C- but not N-terminus of Astrin is evolutionarily conserved across Bilateria. Schematic of sequence similarity between representative Astrin proteins in bilaterians and mammals. While mammalian orthologs show high/medium similarity against human Astrin, non-mammalian orthologs are more divergent. However, all Astrin orthologs show similarity in the C-terminus region. Ribbon colour is based on % of sequence similarity, from red (highest) to blue (lowest). Diagram was built using Circoletto (Darzentas, 2010). N and C-termini of the query sequence are highlighted in Green and Orange, respectively. (B) Schematic of key structural domains of human Astrin highlights the unstructured region analysed in the sequence alignment below. Protein sequence alignment generated using MAFFT demonstrates conservation of the tail region across bilaterian species (residues > 90% conservation are marked by coloured bands) and highlights high conservation of the putative PP1-binding motif RVxF and FQ (``) (Choy et al., 2014; Bajaj et al., 2018) pocket across mammals. Identical (*), conservative (:) and similar (.) residues are marked. Source data 1 includes all new Astrin orthologs identified using a published approach (van Hooff et al., 2017) and an extended database of animal proteomes.
Figure 3—figure supplement 2
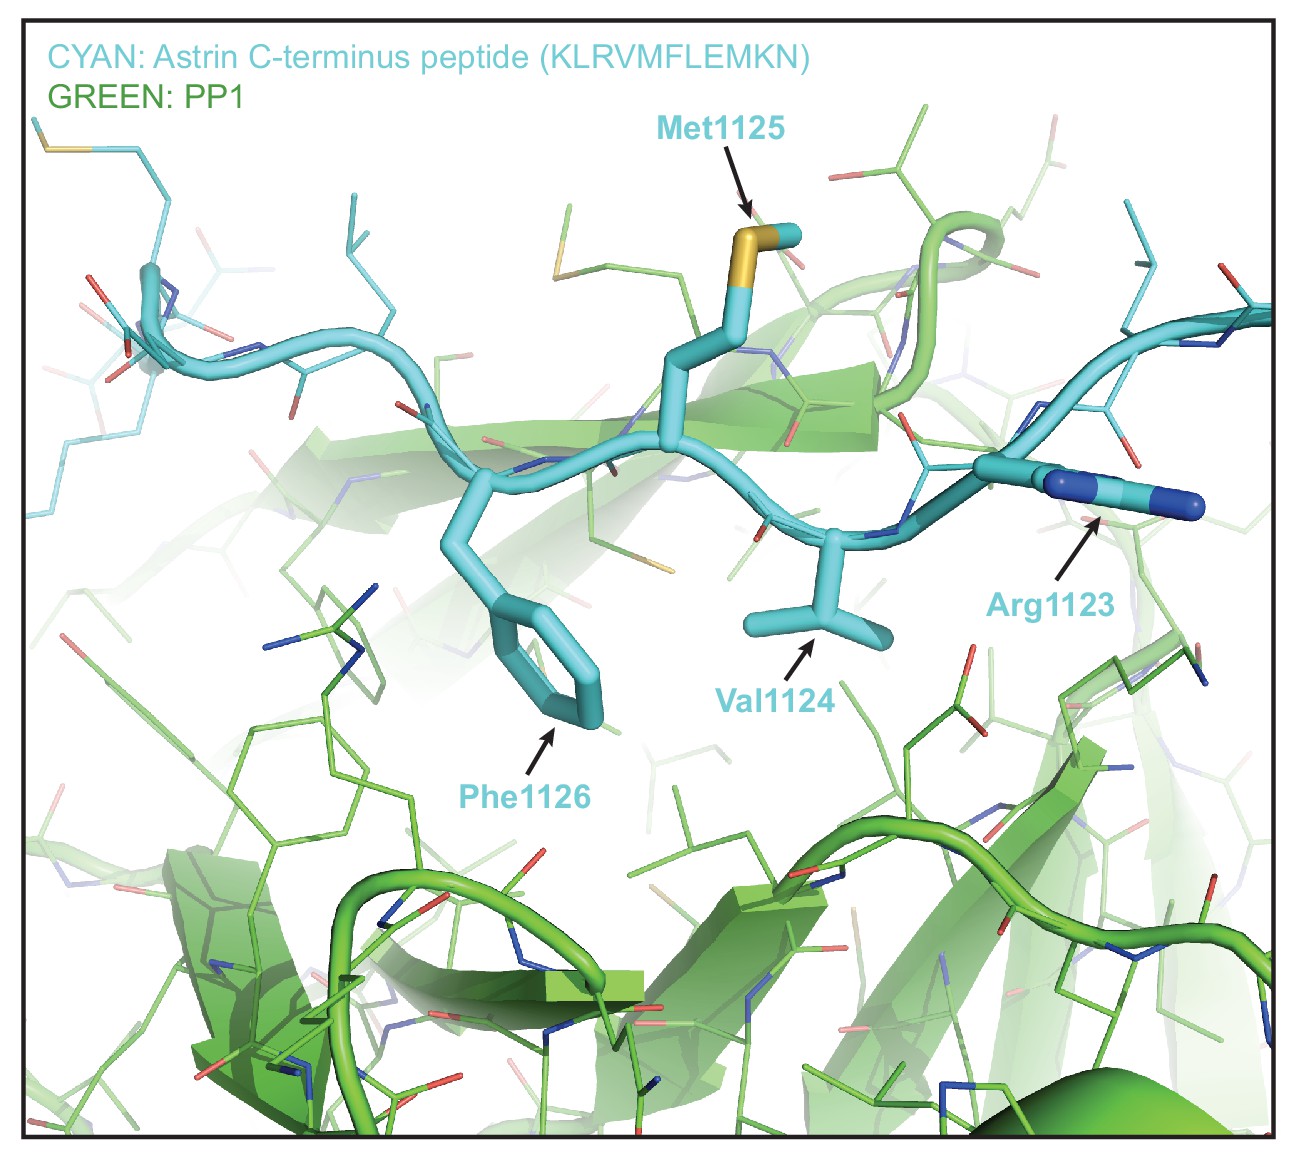
Model of Astrin peptide based on KNL1 peptide conformation bound to PP1 (PDB code 6CZO).
KNL1 peptide bound to PP1 complex was used as an input model in flexpepdock, a high-resolution peptide-protein docking software tool, and the predicted structure of the Astrin peptide bound to PP1 is presented in the figure. Astrin peptide (RVMF highlighted in bold) is in Cyan and the cartoon of PP1 is in green. Met (+3 position) in RVMF is in an accessible position potentially allowing almost any other a.a residues except for Pro. Figure produced using PYMOl.
Figure 3—figure supplement 3
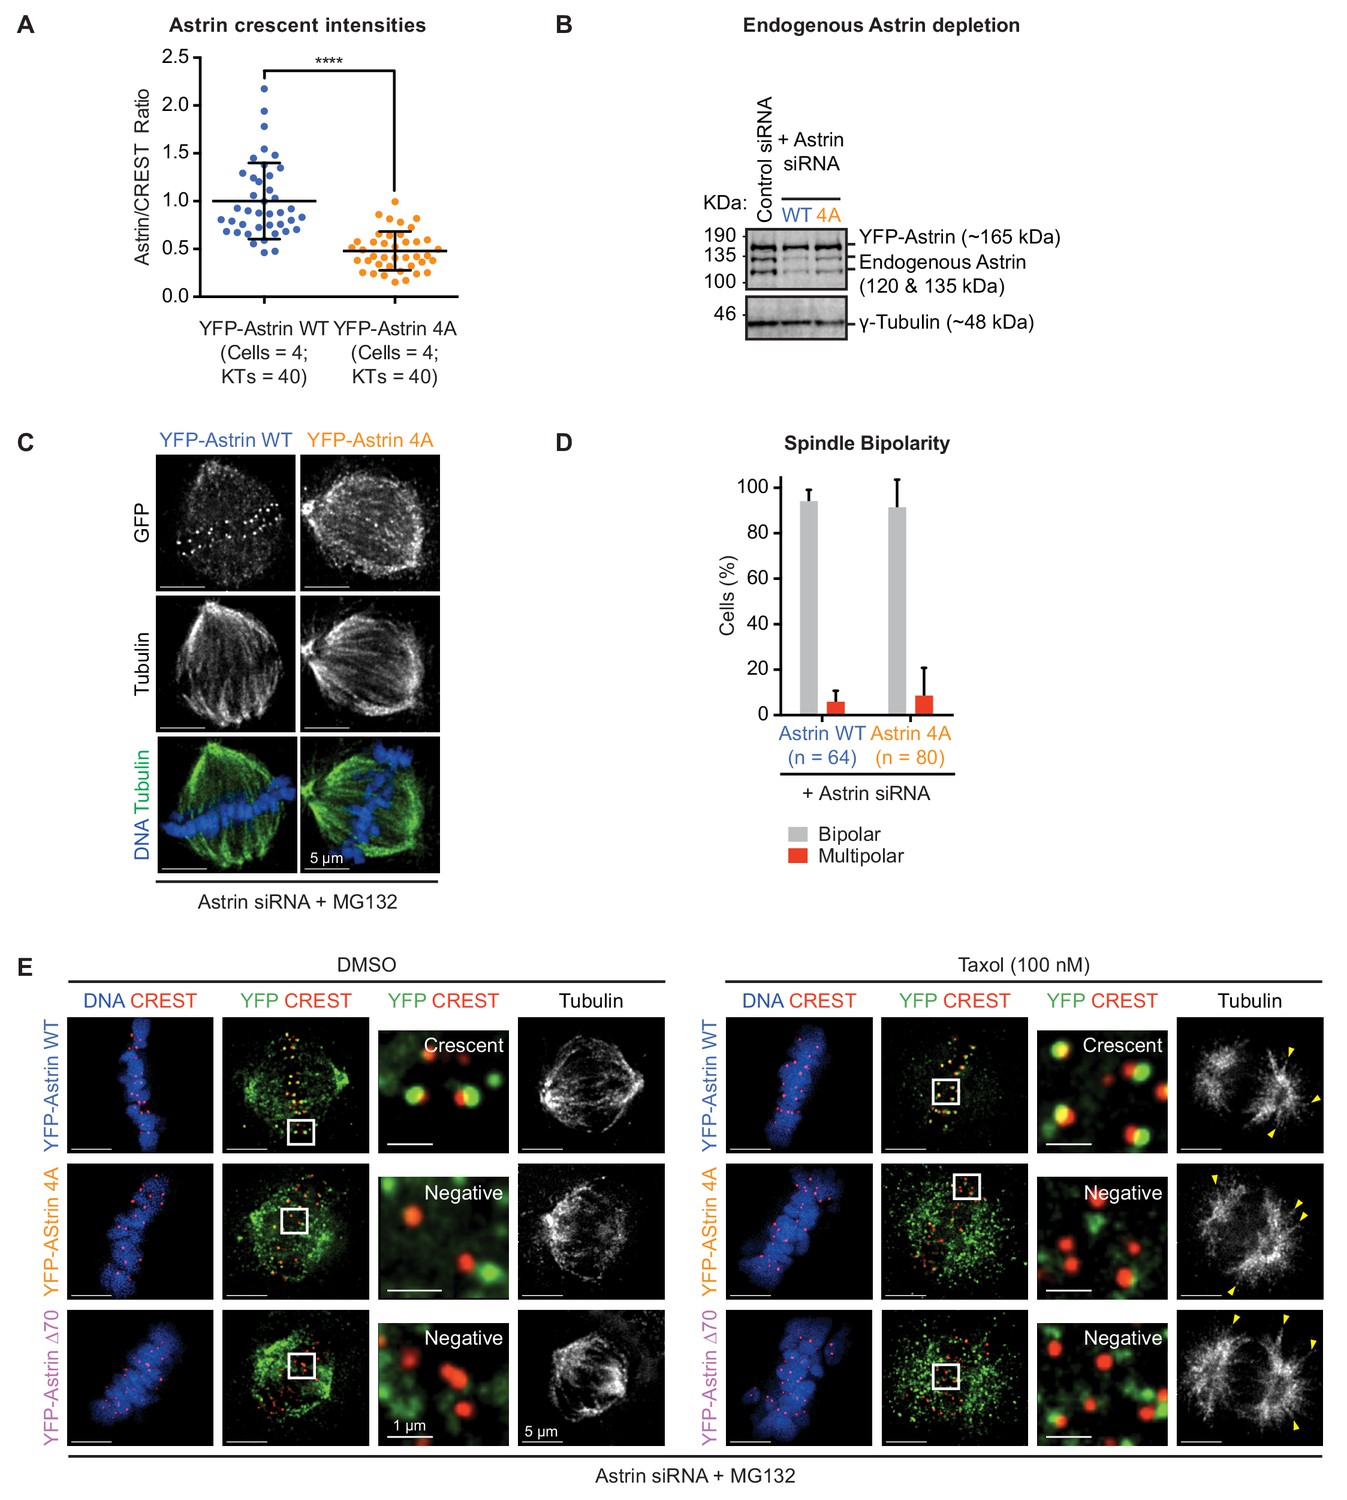
AAAA mutation in Astrin-Tail disrupts Astrin levels at kinetochores but not spindle bipolarity.
(A) Graph shows normalised Astrin/CREST signal intensities in HeLa cells expressing YFP-Astrin WT or 4A mutant treated as in Figure 3A. Each dot represents value from one kinetochore. Black bars and whiskers mark average value and standard deviation, respectively, of kinetochore intensities across cells in a single experiment. ‘*' indicates statistically significant differences. (B) Immunoblots show the extent of endogenous Astrin protein depletion in cells treated with control or Astrin siRNA (as in Figure 3C) and harvested 14 hr after starting the live-cell imaging. For control siRNA condition, HeLa FRT-TO YFP-Astrin-4A cell line was used. Immunoblots were probed using antibodies against Astrin and γ-Tubulin (loading control). (C) Representative images show the rescue of spindle bipolarity defects in Astrin siRNA treated HeLa cells transiently expressing an siRNA-resistant form of YFP-Astrin WT or 4A mutant, as indicated, following an hour of MG132 treatment. Cells were immunostained with antibodies against GFP and Tubulin and co-stained with DAPI for DNA. (D) Graph of percentage of mitotic cells treated as in (C) displaying either a bipolar or multipolar spindle. Bars and whiskers mark average value and standard deviation, respectively, across at least three experimental repeats. WT values are the same from Figure 2E. (E) Representative deconvolved images showing no changes in the kinetochore levels of YFP-Astrin (WT, 4A or ∆70 as indicated) in Astrin siRNA treated HeLa cells expressing exposed to Taxol or DMSO, as indicated. Taxol treatment was maintained for 15 min following an hour of MG132 treatment. Cells were fixed and immunostained with antibodies against YFP and CREST antisera and co-stained with DAPI for DNA. Yellow arrowheads highlight stabilised astral microtubule fibers.
Figure 3—figure supplement 4
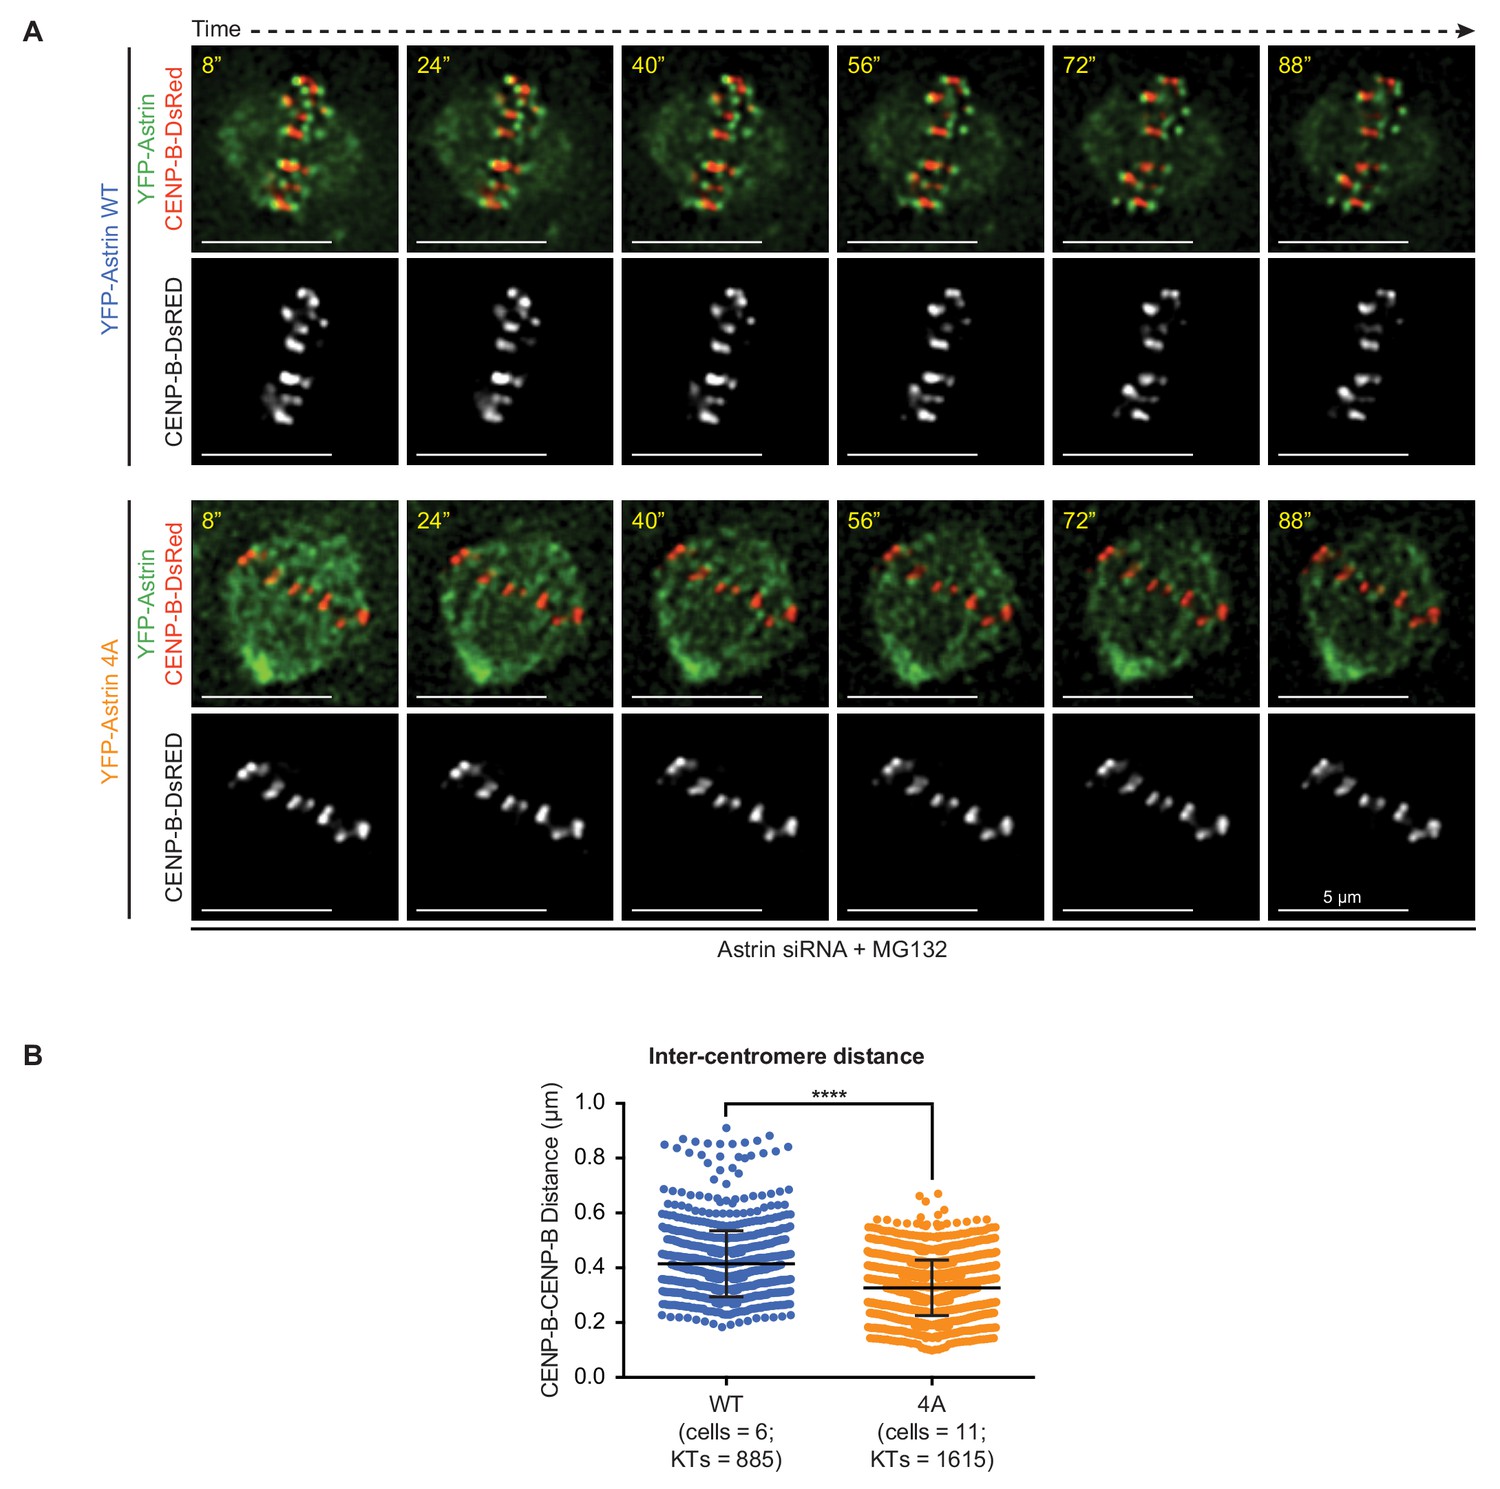
Inter-centromeric distances reduce following Astrin-4A expression.
(A) Representative time-lapse images of HeLa cells depleted of endogenous Astrin and coexpressing CENP-B-DsRED and either YFP-Astrin-WT or YFP-Astrin-4A showing dynamic changes in inter-centromeric distances through time. Images were acquired once every four seconds for two minutes. Cells were MG132 treated 1 hr prior to imaging. (B) Graph of inter-centromeric distances (in microns) measured using CENP-B-DsRED signals in cells as shown in A. Each dot represents the value from a kinetochore. Data acquired from at least three independent repeats. Number of cells and centromere pairs studied from time-lapse movies indicated. ‘*' indicates statistically significant difference.
Figure 4 with 2 supplements

Kinetochore bound Astrin dynamically interacts with PP1 phosphatase.
(A) Representative live-cell images show FRET emission (excitationCFP/emissionYFP) signals of HeLa cells expressing either YFP-PP1γ or Astrin-CFP singly or both YFP-PP1γ and Astrin-CFP and treated with MG132 for 1 hr before imaging. Cartoons of fusion proteins expressed in each condition are shown on the left. Yellow arrowhead highlights a CFP-positive and YFP-negative kinetochore not presenting FRET emission signal. Cyan arrowhead marks FRET-positive kinetochore. Magenta arrowhead highlights CFP-low and YFP-positive kinetochore presenting FRET emission signal and CFP donor depletion. (B–C) Graphs show the normalised FRET/CFP intensity ratio at kinetochores (B) and spindle microtubules (C), respectively, measured from time-lapse movies as shown in (A). Each dot represents a value from a kinetochore (KT) or a spindle (SP) area of size 0.066 µm2. Black bars and whiskers mark average value and standard deviation, respectively, from kinetochores or spindle regions across two experimental repeats. ‘*' indicates statistically significant differences. Scale as indicated. (D) Coomassie stained gel shows recombinant GST-PP1γ or GST alone, immobilised on Glutathione beads, used for pull-down assays. (E) Representative immunoblot of pull-down assays shows the interaction of GST-PP1γ, but not GST, with Astrin in lysates of mitotically synchronised HeLa cells. Cells were treated with Astrin or Control siRNA, as indicated, and exposed to STLC for 24 hr prior to lysate generation. Immunoblot was probed with antibody against Astrin (top) or gamma-Tubulin (bottom, positive control). Immunoblot is representative of two independent pulldown studies. Astrin-PP1 interaction is more prominent in Control siRNA treated cells compared to Astrin siRNA treated cells. Gamma-tubulin (positive control for PP1 interaction) can be found in both Control or Astrin siRNA treated cells. Immunoblot shows whole cell lysate (WCL) and fractions of unbound and wash supernatents from samples exposed to GST-PP1γ (green arrowheads mark Astrin). For methodology details see Figure 4—figure supplement 1A. (F) Graph of ratio of Astrin intensities in the GST-PP1 or GST pull-down lane relative to input lysate lane. Areas used for Astrin intensity measurements are shown in Figure 4—figure supplement 1B. n = 2 refers to number of independent repeats of recombinant protein purification and pulldown studies.
Figure 4—figure supplement 1

Astrin purifies with GST-PP1γ.
(A) Methodology: Control or Astrin siRNA treated cells were exposed to STLC. STLC treated HeLa cell lysates (WCL) were cleared by centrifugation (Input lysate) and incubated with either GST-PP1γ or GST immobilised on Glutathione beads. All beads were washed four times. Precipitates bound to beads (Pull-down samples) were assessed using immunoblotting. Unbound supernatant from all wash steps were stored and blotted. Only supernatents exposed to GST-PP1γ immobilised beads are shown (in B). (B) Blot includes area presented in Figure 4D. Immunoblot is representative of two independent repeats and was probed using an anti-Astrin antibody. Yellow boxes mark area used for measuring Astrin intensities. (C) Immunoblot shows the specificity of anti-Astrin antibody in recognising mitotic forms of Astrin. STLC treated and mitotically enriched lysates of cells treated with Astrin or Control siRNA were used. Lysates of unsynchronised cells were used as interphase control. In mitotic cell lysates, three forms of Astrin are clearly separated (filled green triangles): in addition to the two forms (~120 kDa and ~135 kDa) found in interphase lysates, higher molecular weight forms (>135 kDa) are present, which are all lost following Astrin siRNA treatment. Red asterisk refers to a nonspecific band found in Astrin siRNA treated and untreated mitotic and interphase lysates. PP1 phosphatase was used as a loading control.
Figure 4—figure supplement 2
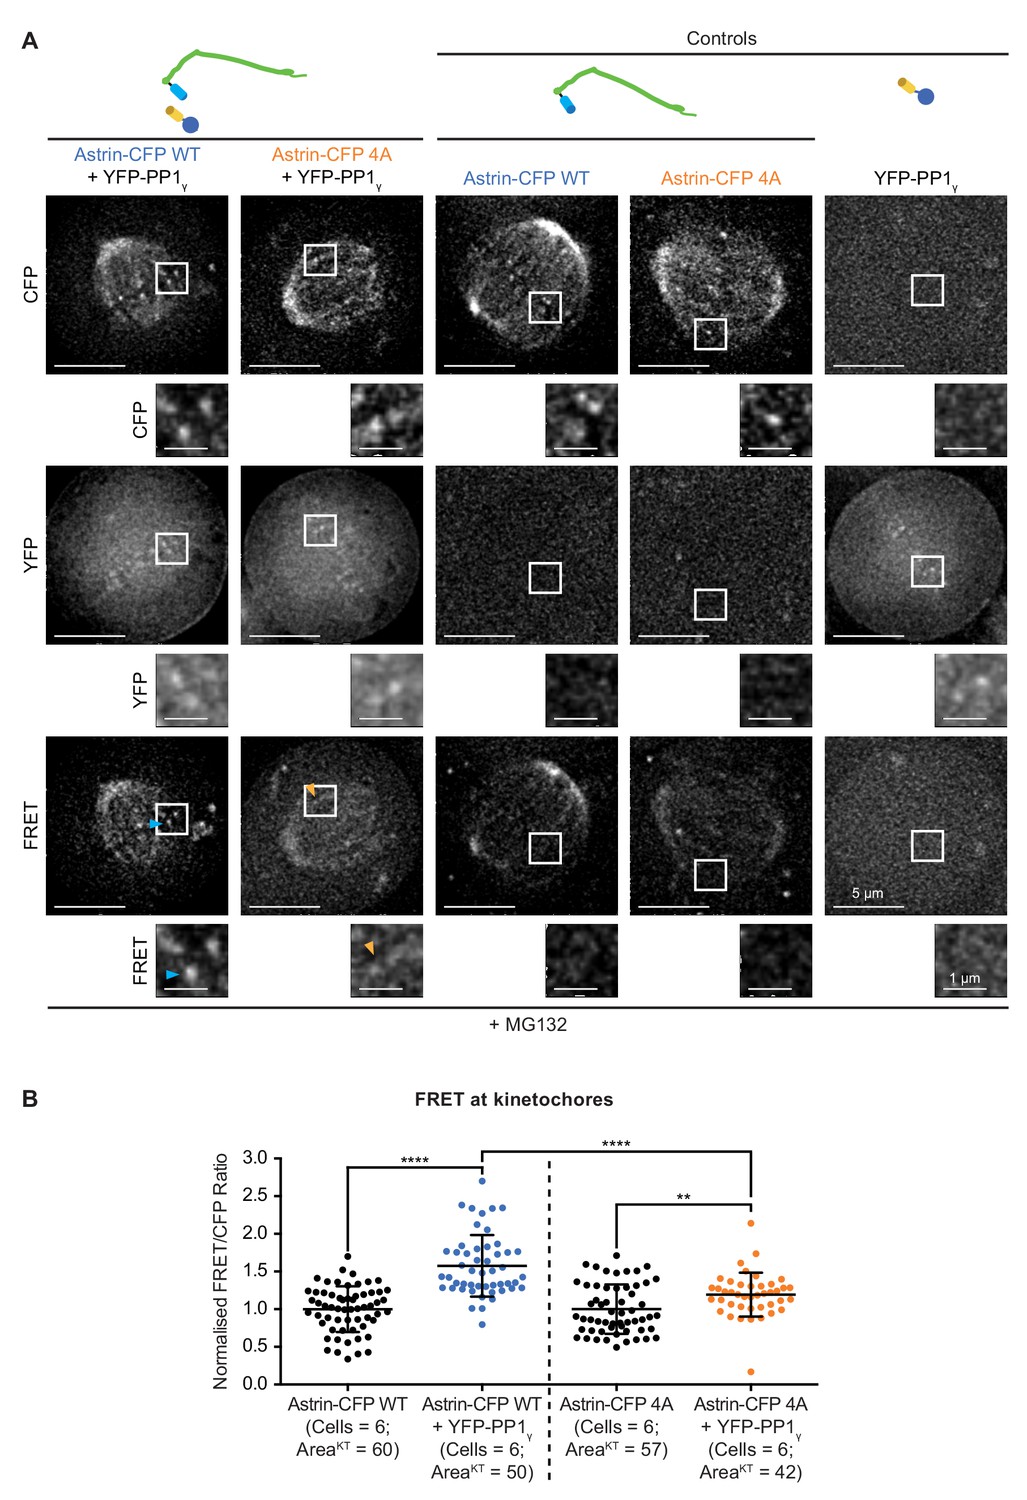
FRET signals at kinetochores reduced in cells coexpressing YFP-PP1γ and Astrin-CFP-4A compared to Astrin-CFP-WT.
(A) Representative live-cell images show FRET emission (excitationCFP/emissionYFP) signals of HeLa cells expressing either YFP-PP1γ, Astrin-CFP-WT or Astrin-CFP-4A (as indicated) singly or both YFP-PP1γ and Astrin-CFP and treated with MG132 for 1 hr before imaging. Cartoons of fusion proteins expressed in each condition are shown on the top. Arrowheads highlight kinetochore presenting high (cyan) or low (orange) FRET emission signal. (B) Graph shows the FRET/CFP intensity ratio at kinetochores measured from time-lapse movies as shown in A. Each dot represents a value from a kinetochore (KT) within a circular area corresponding to 3 × 3 pixels. Black bars and whiskers mark average value and standard deviation, respectively, from kinetochores across four experimental repeats. ‘****’ and ‘**’ indicate a statistically significant difference when p<0.0001 and p<0.01, respectively. FRET/CFP ratio in cells coexpressing Astrin-CFP (WT or 4A) and YFP-PP1γ are normalised against FRET/CFP ratio in cells singly expressing either Astrin-CFP -WT or −4A, respectively.
Figure 5 with 2 supplements

Maintenance of end-on attachments before biorientation requires Astrin’s PP1 docking motif.
(A) Representative deconvolved images show Astrin localisation and KT-MT attachment status of HeLa cells, treated with Astrin siRNA, expressing YFP-Astrin (WT, 4A or ∆70). Cells were exposed to either Monastrol or STLC for 2 hr and MG132 for 15’ prior to immunostaining with antibodies against GFP or Tubulin and CREST anti-sera and co-staining with DAPI for DNA. Cropped images highlight Astrin localisation and KT-MT attachment status (lateral versus end-on). Negative and Crescent refer to the absence and presence of Astrin-crescents, respectively. (B) Graph of percentage of lateral, end-on and detached kinetochores in monopolar spindles of YFP-Astrin (WT, 4A or ∆70) expressing cells treated as in (A). Each circle represents percentage of kinetochores from one cell. KTs refer to total number of kinetochores assessed. Black bar marks average values from at least three independent experiments. ‘*' and ‘ns’ indicate statistically significant and insignificant differences, respectively. (C) Graph of percentage of kinetochores presenting sleeve-like or crescent-like Astrin signals in monopolar spindles of cells expressing YFP-Astrin (WT, 4A or ∆70 mutant) treated as in (A). Each dot represents a value from one cell. Black bar marks average values from at least three independent experiments. (D) Representative deconvolved images show MAD2 levels at kinetochores of HeLa cells depleted of endogenous Astrin and transiently expressing YFP-Astrin (WT, 4A or ∆70). Cells arrested in metaphase using MG132 for 1 hr were immunostained with antibodies against GFP or MAD2 and CREST antiserum and co-stained with DAPI for DNA. Cropped images highlight MAD2 or YFP-Astrin levels at kinetochores identified using CREST antisera. Yellow arrowheads in uncropped images highlight representative kinetochores staining positive for MAD2. (E) Bar graph of MAD2-positive kinetochores in metaphase cells expressing YFP-Astrin (WT, 4A or ∆70) treated as in (D). Number (n) of cells indicated. Values were obtained from three independent repeats. Scale as indicated.
Figure 5—figure supplement 1

Checkpoint signalling and chromosome congression efficiency in Astrin:PP1 docking mutant expressing cells.
(A) Representative images show ZW10 levels at kinetochores in HeLa cells depleted of endogenous Astrin and transiently expressing YFP-Astrin (WT, 4A or ∆70 mutant). Cells were arrested in metaphase with MG132 for 1 hr before fixation and were immunostained with antibodies against GFP, ZW10, CREST antiserum and stained with DAPI for DNA. Cropped images highlight ZW10 or YFP-Astrin levels at kinetochores identified using CREST antisera (a centromere marker). Scale as indicated. (B) Cartoon of experimental methodology to test chromosome congression efficiency in HeLa cells by first inducing monopolar spindles using STLC (Eg5 inhibitor) and then releasing them into MG132 (a proteasome inhibitor) for measuring chromosome congression efficiency in bipolar spindles 30, 45 or 60 min after release from STLC treatment. Cells were fixed at different timepoints and processed for immunostaining using anti-tubulin antibody and CREST antisera (a centromere marker) and co-stained with DAPI for DNA. (C) Bar graphs show percentage of cells with fully aligned or congressed chromosomes (normal metaphase), 1–5 unaligned chromosomes (mild congression defect), more than six unaligned chromosomes (severe congression defect) or no obvious alignment despite release from monopolar spindles.
Figure 5—figure supplement 2
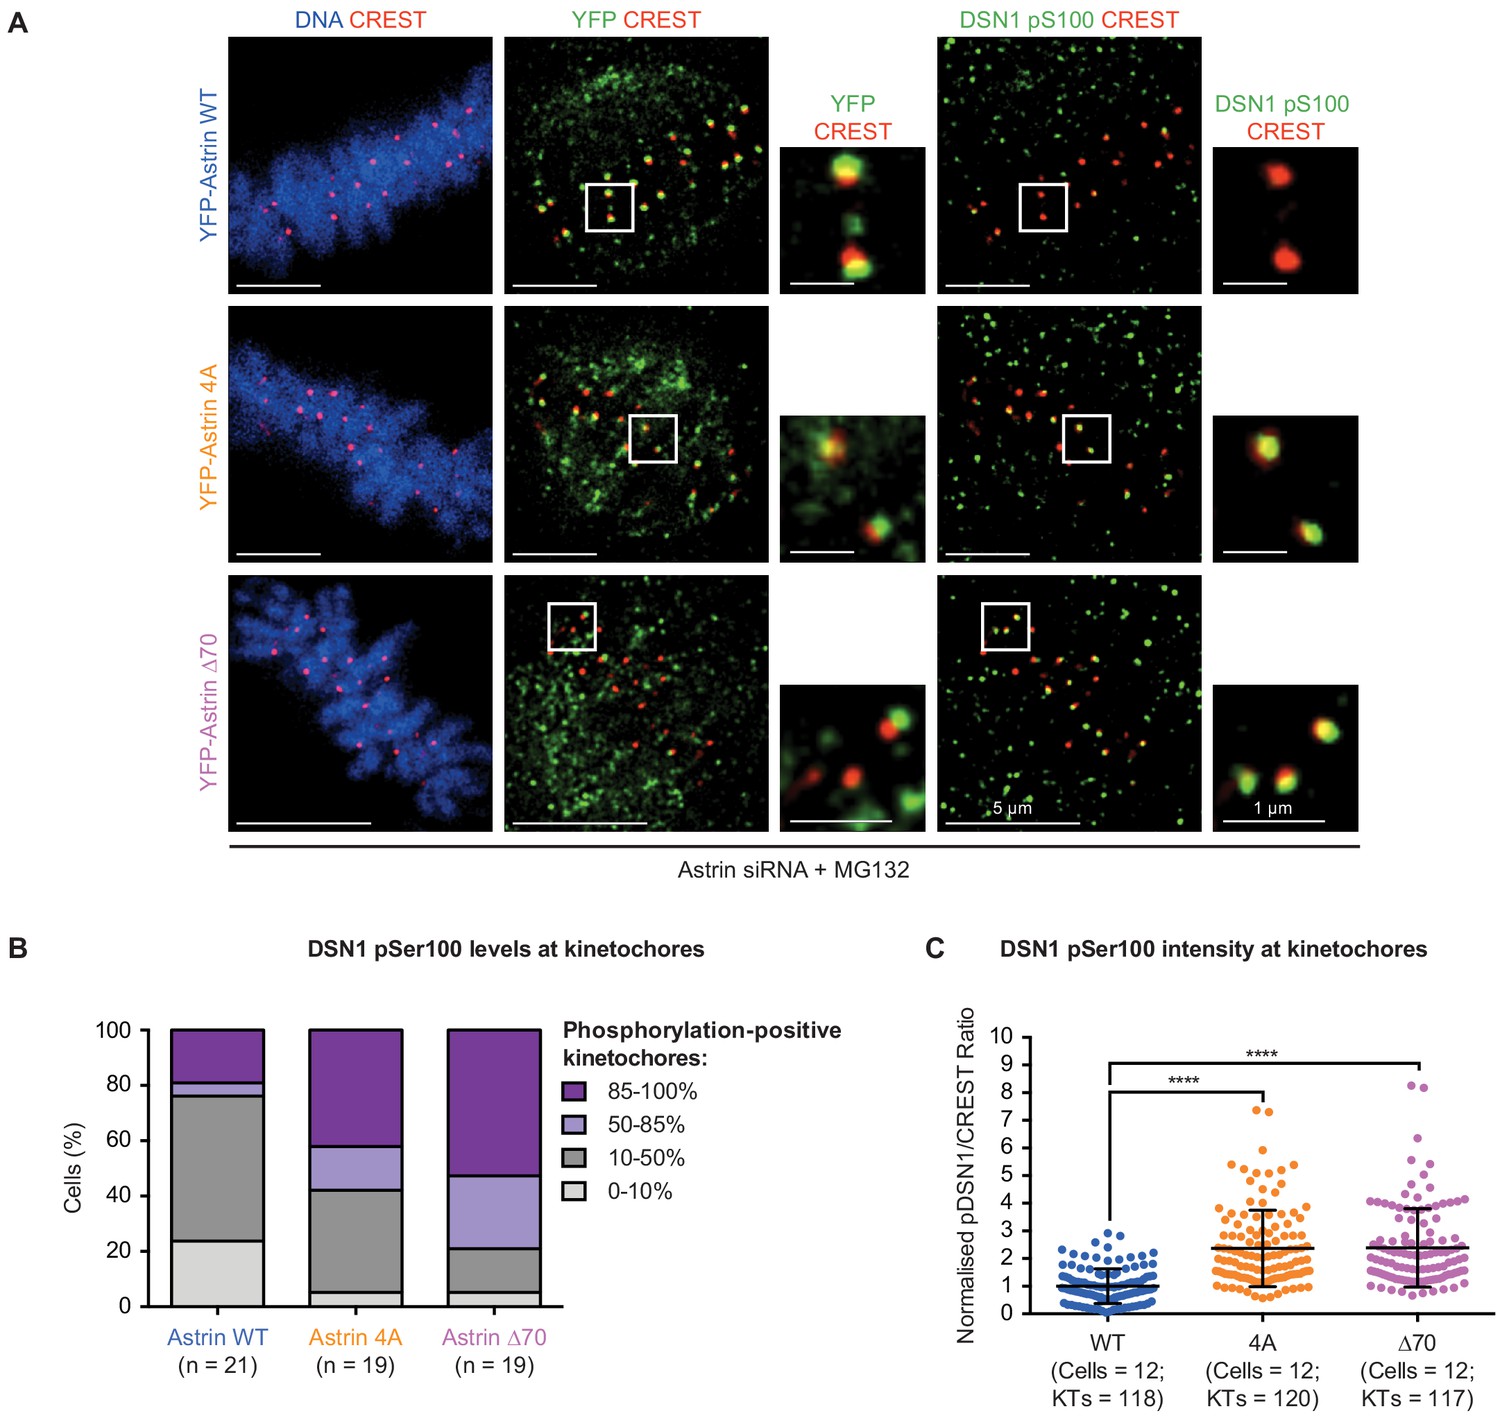
Status of DSN1 Ser100 phosphorylation in Astrin:PP1 docking mutant expressing cells.
(A) Representative images show levels of phosphorylated DSN1 Ser100 levels at kinetochores in HeLa cells depleted of endogenous Astrin and transiently expressing YFP-Astrin (WT, 4A or ∆70 mutant). Cells were arrested in metaphase with MG132 for 1 hr before fixation and were immunostained with antibodies against GFP, DSN1 pSer100, CREST antiserum and stained with DAPI for DNA. Cropped images highlight DSN1 pSer100 or YFP-Astrin levels at kinetochores identified using CREST antisera (a centromere marker). Scale as indicated. (B) Bar graphs show percentage of cells with phospho-DSN1 positive kinetochores in 85–100%, 50–85%, 10–50% or 0–10% of metaphase kinetochores in cells treated with MG132 and expressing Astrin WT or mutants as indicated. Number (n) of cells indicated. Data represent values from at least three experimental repeats. (C) Scatter plot of the integrated fluorescence intensity ratio of DSN1 pSer100 and CREST signals at each kinetochore. 9–10 KTs/cell were randomly picked for intensity measurements. ‘*’ indicates statistically significant difference. Black bars and whiskers mark average value and standard deviation, respectively, of kinetochore intensities across cells from three independent repeats. .
Figure 6 with 3 supplements
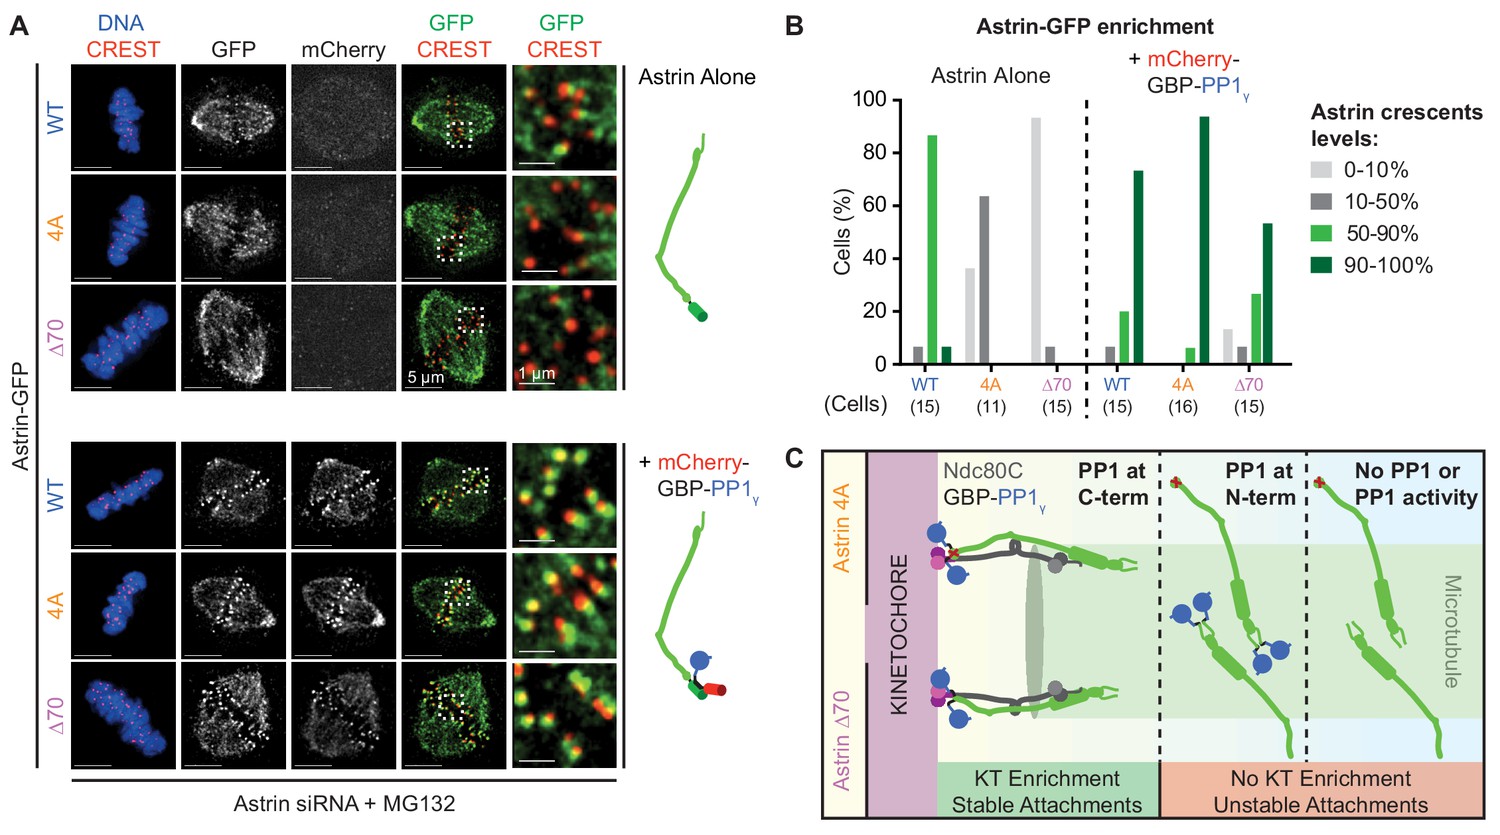
Spatially defined delivery of PP1 controls Astrin localisation and function.
(A) Representative deconvolved images show Astrin-GFP intensities at kinetochores of cells treated with Astrin siRNA and expressing Astrin-GFP (WT, 4A or ∆70) alone or along with mCherry-GBP-PP1γ (cartoons on right). Cells arrested in MG132 were immunostained with antibodies against GFP and mCherry along with CREST antisera and stained with DAPI for DNA. Cropped images are magnified areas boxed in dashed white lines. (B) Bar graph of percentage of cells displaying Astrin-crescents on 0–10%, 10–50%, 50–90% or 90–100% of kinetochores in cells expressing Astri-GFP (WT, 4A or ∆70) and mCherry-GBP-PP1γ and treated as in (A). Number of cells is indicated. (C) Cartoon summarises the consequence of abrogating or spatially restricting the delivery of phosphatase by Astrin. The PP1-docking mutants (4A and ∆70) are enriched at kinetochores only when active PP1 is tethered at Astrin’s C-terminus. Astrin:PP1 enrichment at kinetochores is required for the maintenance of cold-stable kinetochore-microtubule attachments. Scale as indicated.
Figure 6—figure supplement 1
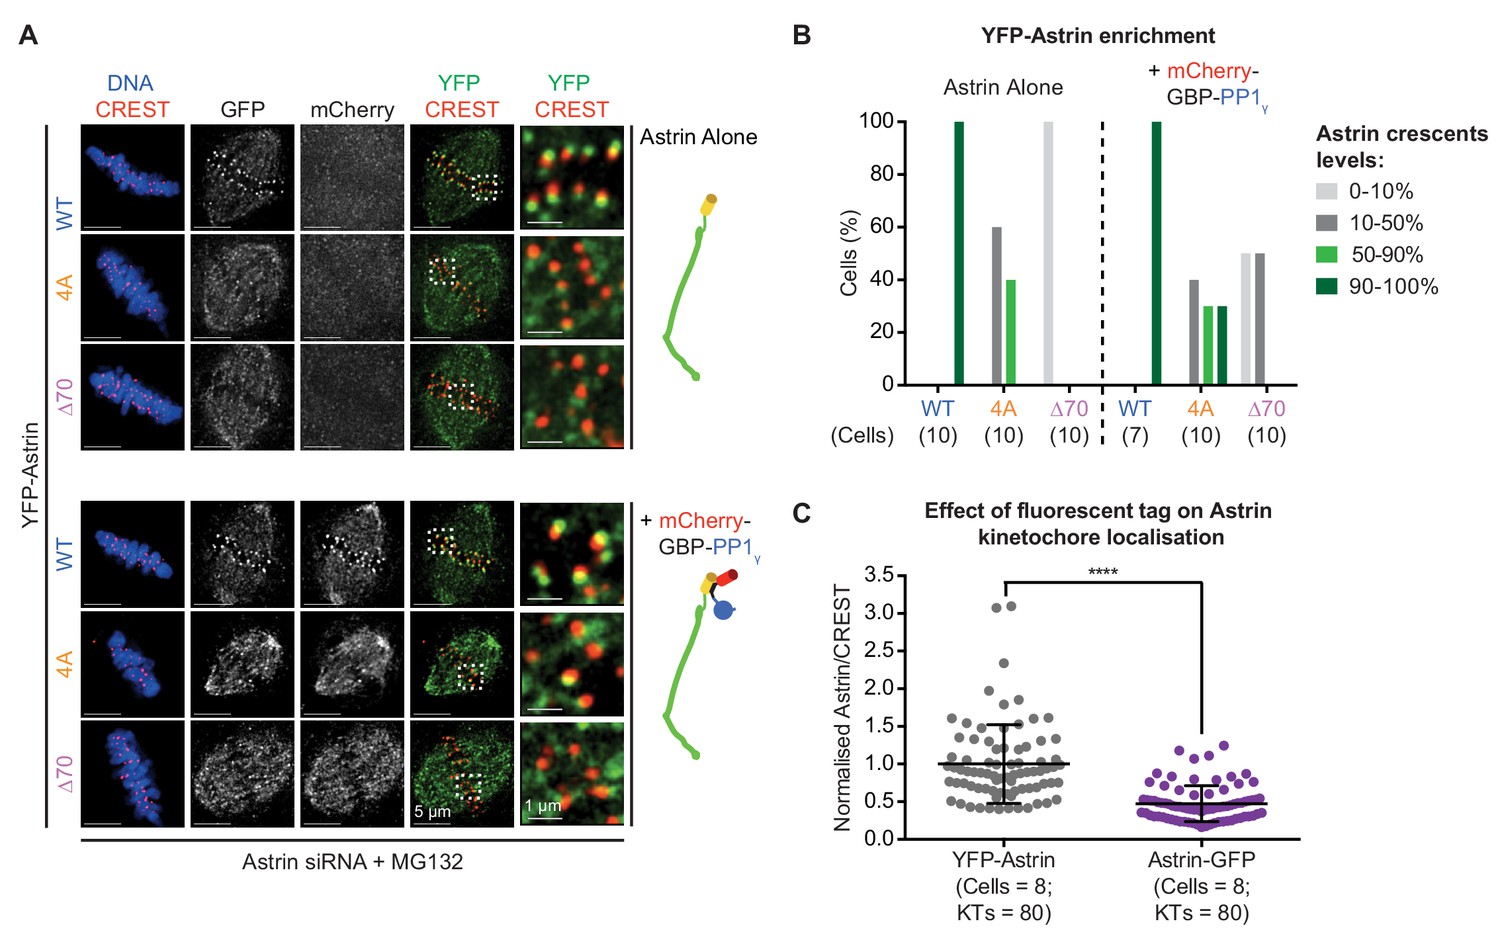
PP1-delivery away from the C-terminus of Ndc80 is insufficient to rescue Astrin mutant localisation.
(A) Representative deconvolved images show YFP-Astrin intensities at kinetochores of cells treated with Astrin siRNA and expressing YFP-Astrin (WT, 4A or ∆70) alone or along with mCherry-GBP-PP1γ (cartoons on the right). Cells arrested in MG132 (1 hr) were immunostained with antibodies against GFP and mCherry along with CREST antisera and stained with DAPI for DNA. Cropped images are magnified areas boxed in dashed white lines. (B) Bar graph of percentage of cells displaying Astrin-crescents on 0–10%, 10–50%, 50–90% or 90–100% of kinetochores in cells expressing YFP-Astrin (WT, 4A or ∆70) and mCherry-GBP-PP1γ and treated as in (A). Number of cells is indicated. (C) Graph shows normalised Astrin/CREST signal intensities in HeLa cells expressing YFP-Astrin or Astrin-GFP (both wild type) treated as in (A). Each dot represents value from one kinetochore. Black bars and whiskers mark average value and standard deviation, respectively, of kinetochore intensities across cells from two experimental repeats. ‘*' indicates statistically significant differences.
Figure 6—figure supplement 2
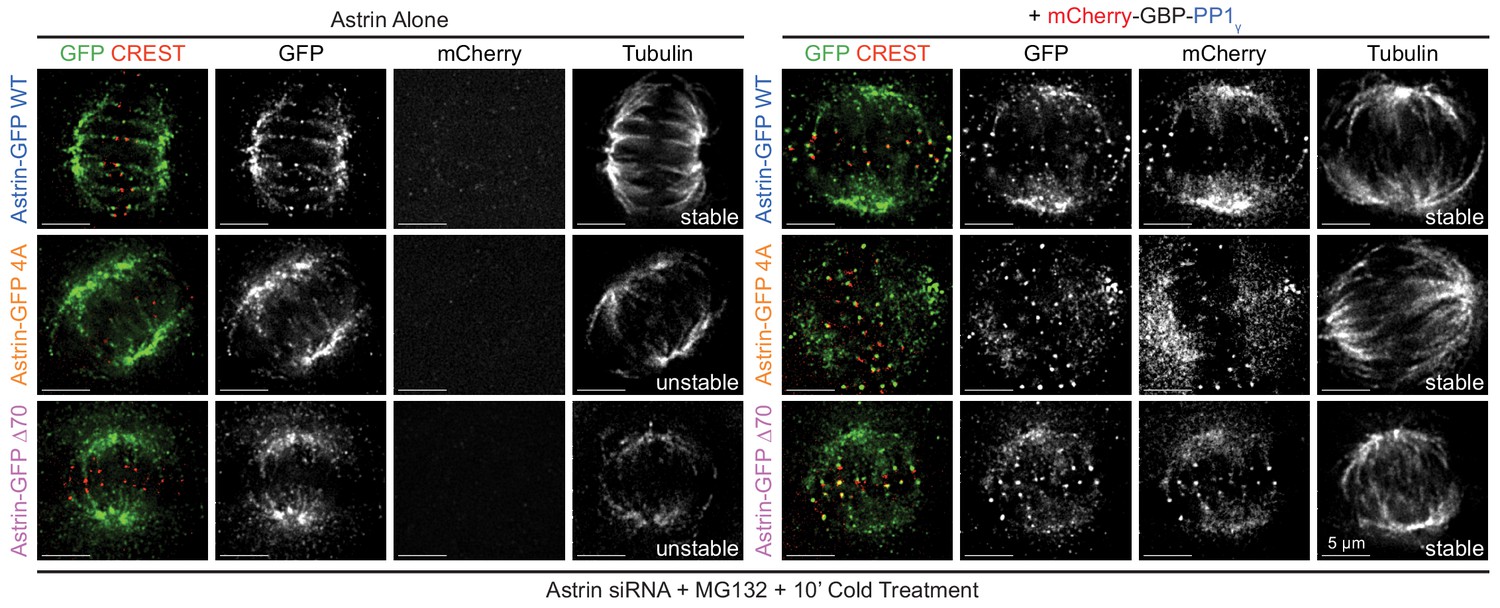
Active PP1γ is required for Astrin localisation and function .
Representative deconvolved images show cold stable microtubules in cells coexpressing mCherry-GBP-PP1γ and Astrin-GFP WT or 4A or ∆70 mutants, as indicated. In the absence of mCherry-GBP-PP1γ coexpression, cells expressing Astrin-GFP WT but not Astrin-GFP 4A or ∆70 mutants show cold stable microtubules. Cells were exposed to cold for 10 min and stained with antibodies against GFP, Tubulin and mCherry along with CREST antisera. Scale as indicated.
Figure 6—figure supplement 3
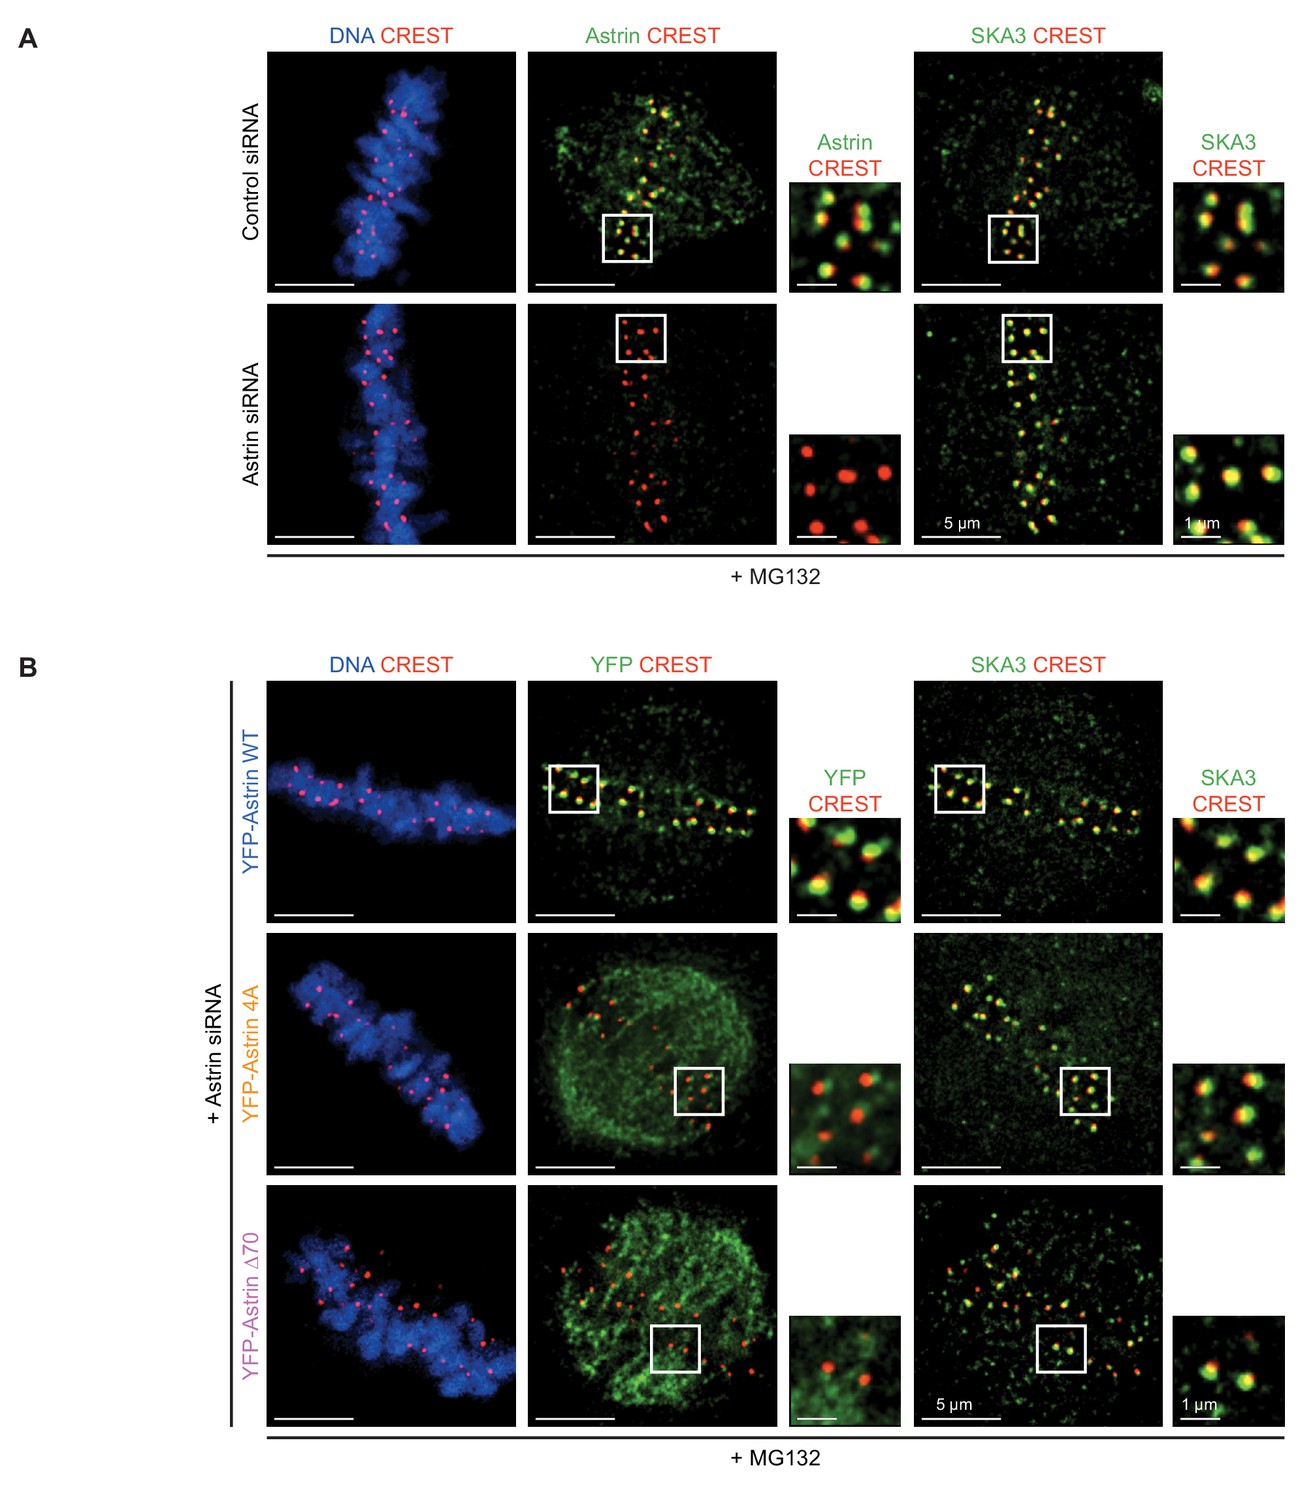
SKA3 localisation is not abrogated due to the lack of Astrin.
(A) Representative deconvolved images show SKA3 enrichment at kinetochores of HeLa cells treated with Control or Astrin siRNA. Cells were arrested in metaphase using MG132 for 1 hr prior to fixation and were immunostained with antibodies against Astrin and SKA3 and CREST antiserum (to mark centromeres) and stained with DAPI for DNA. Cropped images show Astrin or SKA3 enrichment at kinetochores. (B) Representative images show SKA3 enrichment at kinetochores of HeLa cells treated with Astrin siRNA before transfection with eukaryotic protein expression vectors encoding YFP-Astrin (WT, 4A or ∆70, as indicated). Cells were arrested in metaphase using MG132 for 1 hr prior to fixation and were immunostained with antibodies against GFP (for detecting YFP-Astrin) and SKA3 and CREST antiserum and co-stained with DAPI for DNA. Cropped images show YFP-Astrin or SKA3 enrichment at kinetochores. Scale as indicated.
Figure 7 with 1 supplement
Astrin-PP1 and Aurora-B control attachment stability through distinct steps.
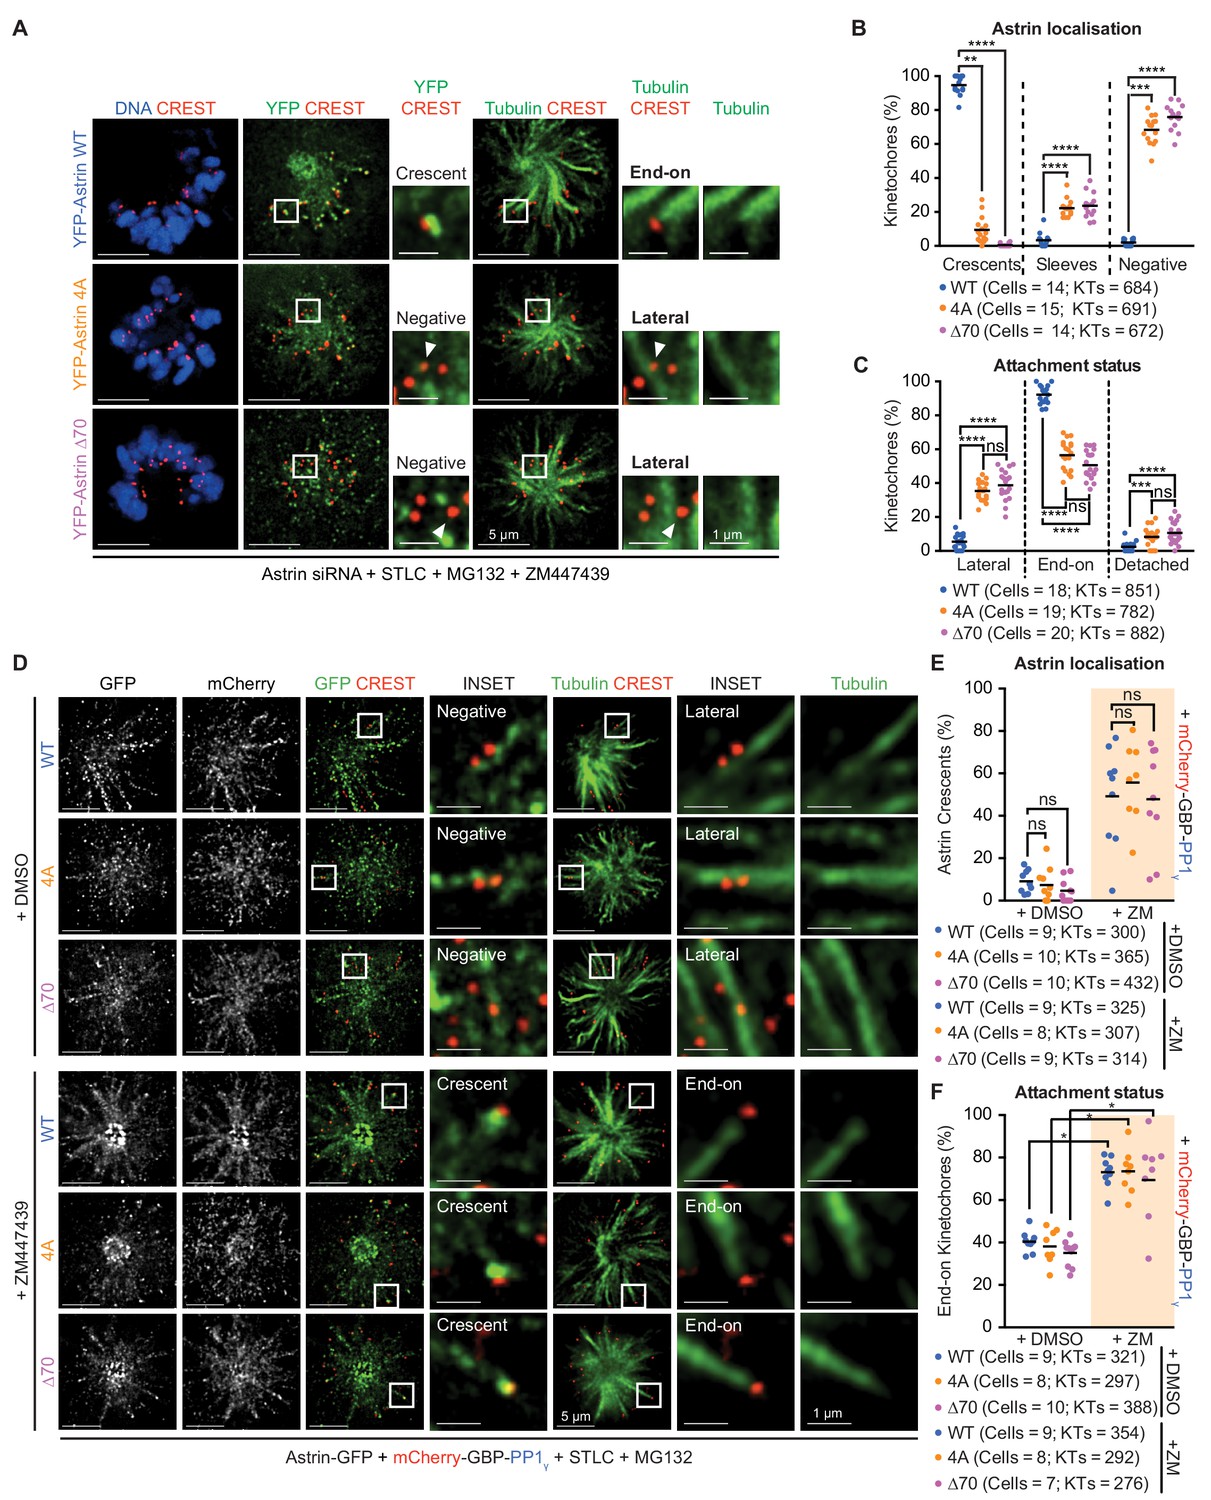
(A) Representative deconvolved images show Astrin localisation and KT-MT attachment status in monopolar spindles of cells depleted of endogenous Astrin expressing YFP-Astrin (WT, 4A or ∆70). STLC treated cells were exposed to MG132 and ZM447439 prior to immunostaining with antibodies against GFP and Tubulin and CREST antisera and staining with DAPI for DNA. Cropped images are areas boxed in white. (B and C) Graphs of percentage of kinetochores with Astrin-sleeves or -crescents (B) or lateral, end-on or detached kinetochores (C) in cells expressing YFP-Astrin (WT, 4A or ∆70) and treated as in (A). Black bars show average across at least two experimental repeats. (D) Representative deconvolved images show Astrin localisation and KT-MT attachment status in monopolar spindles of cells depleted of endogenous Astrin co-expressing Astrin-GFP (WT, 4A or ∆70) and mCherry-GBP-PP1γ. STLC treated cells were exposed to MG132 and either ZM447439 or DMSO prior to immunostaining with antibodies against GFP and mCherry along with CREST anti-sera and stained with DAPI for DNA. Cropped images are areas boxed in white. Absence and presence of Astrin-crescents is highlighted. (E and F) Graphs of percentage of kinetochores with Astrin-GFP crescents (E) or end-on attachments (F) in cells expressing YFP-Astrin (WT, 4A or ∆70) and treated as in (D). Black bars show average across at least two experimental repeats. Percentage of kinetochores with Astrin-GFP sleeves are in Figure 7—figure supplement 1B and percentage of lateral and detached kinetochores are in Figure 7—figure supplement 1C. ‘' and ‘ns’ indicate statistically significant and insignificant differences. Scale as indicated.
Figure 7—figure supplement 1
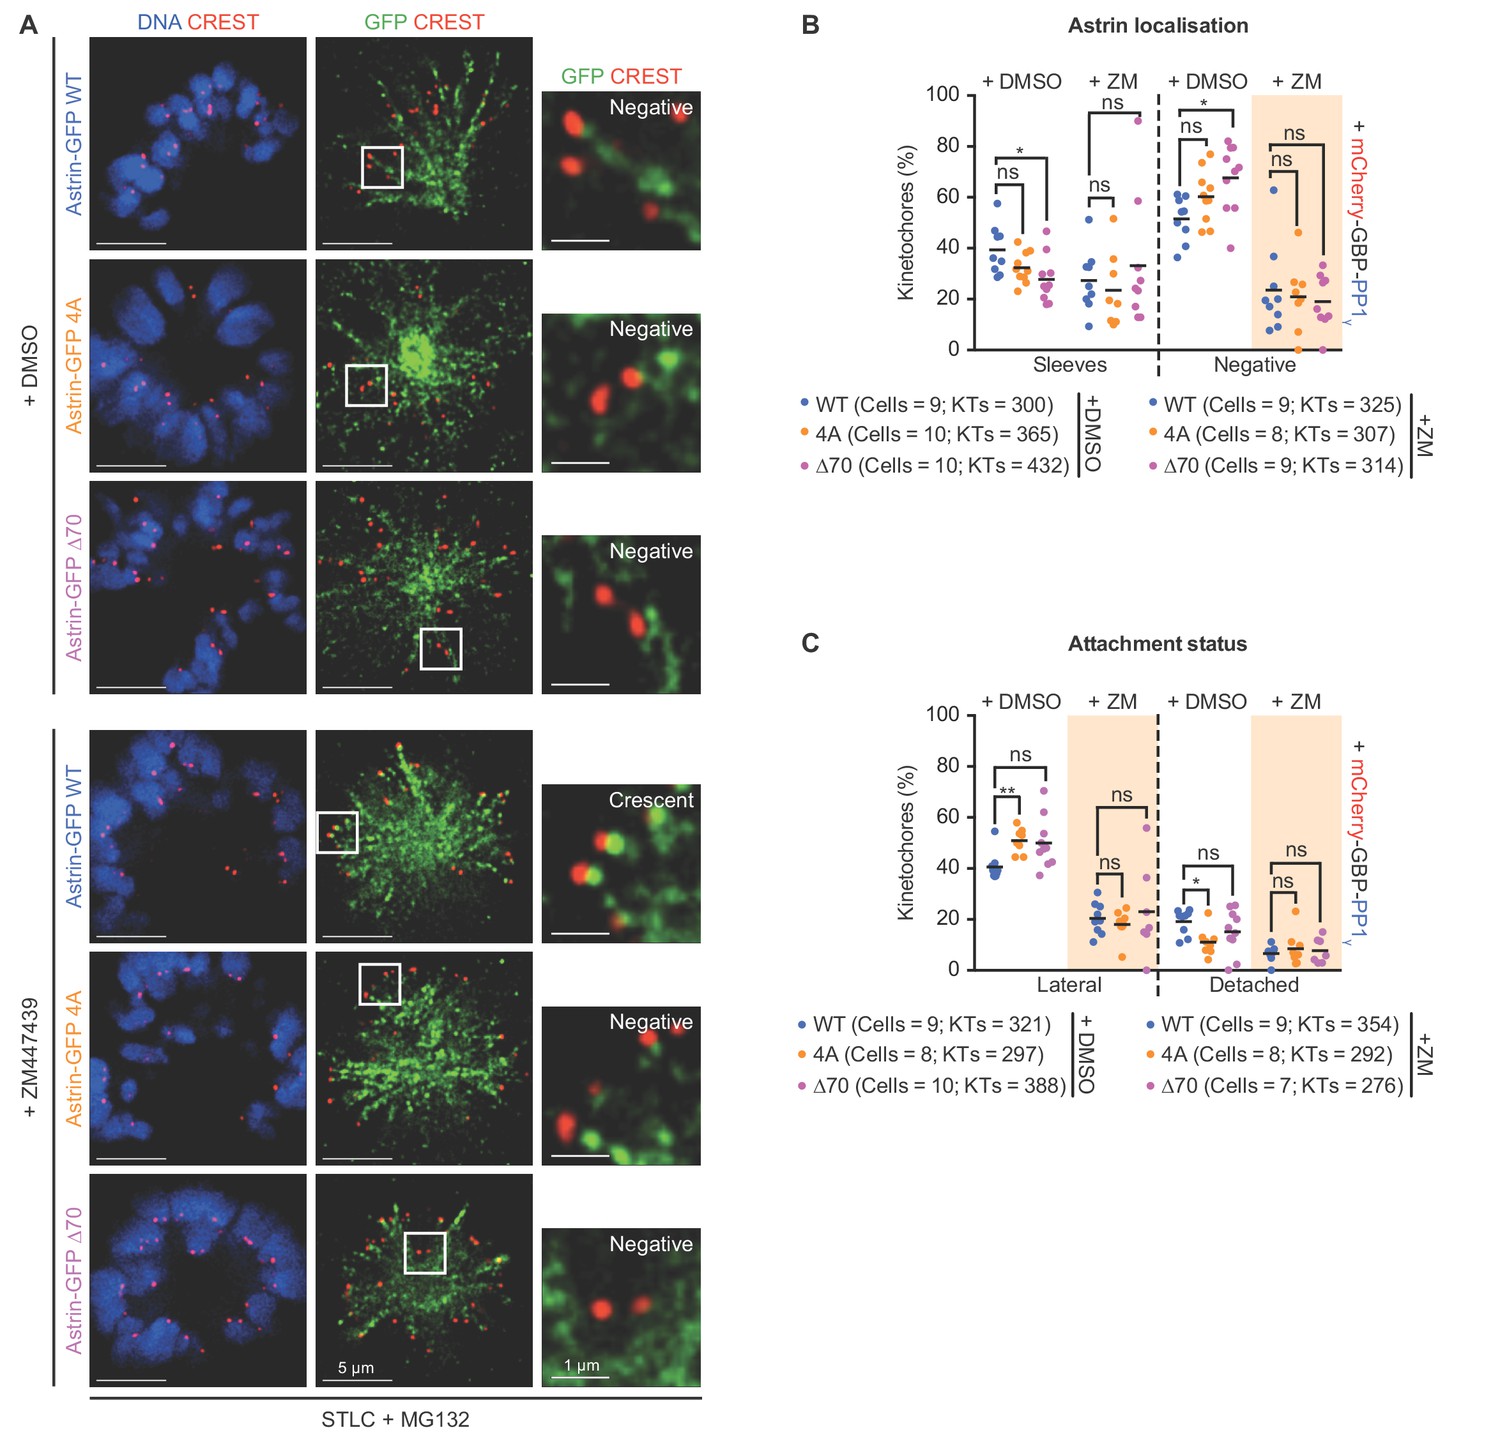
Aurora-B inhibition does not rescue the kinetochore enrichment defect of Astrin:PP1-docking mutants.
(A) Representative images of monopolar spindles show GFP-Astrin and SKAP levels at kinetochores of HeLa cells transfected with eukaryotic protein expression vectors encoding Astrin-GFP (WT, 4A or ∆70). Cells were exposed to STLC for 2 hr and then supplemented with MG132 and either DMSO or ZM447439 drugs for 15’ prior to fixation. Cells were immunostained with anti-GFP antibody and CREST antisera and co-stained with DAPI for DNA. Cropped images highlight Astrin-GFP localisation at kinetochores. (B) Graph of percentage of kinetochores presenting sleeve-like structures or no Astrin signals in cells treated as in Figure 7D and presented in Figure 7E. Graph Each dot represents a value from one cell. Black bars show average across two experimental repeats. (C) Graph of percentage of lateral and detached kinetochores in monopolar spindles of Astrin depleted cells expressing Astrin-GFP (WT, 4A or ∆70, as indicated) along with mCherry-GBP-PP1γ and treated as in Figure 7D and presented in Figure 7F. Beige boxes highlight key changes following Aurora-B inhibition. Each dot represents a value from one cell. Black bars show average across two experimental repeats. ‘ns’ indicates statistically insignificant differences assessed. Scale as indicated.
Figure 8 with 1 supplement
Premature constitutive recruitment of Astrin:PP1 to kinetochores disrupts chromosome congression and segregation.
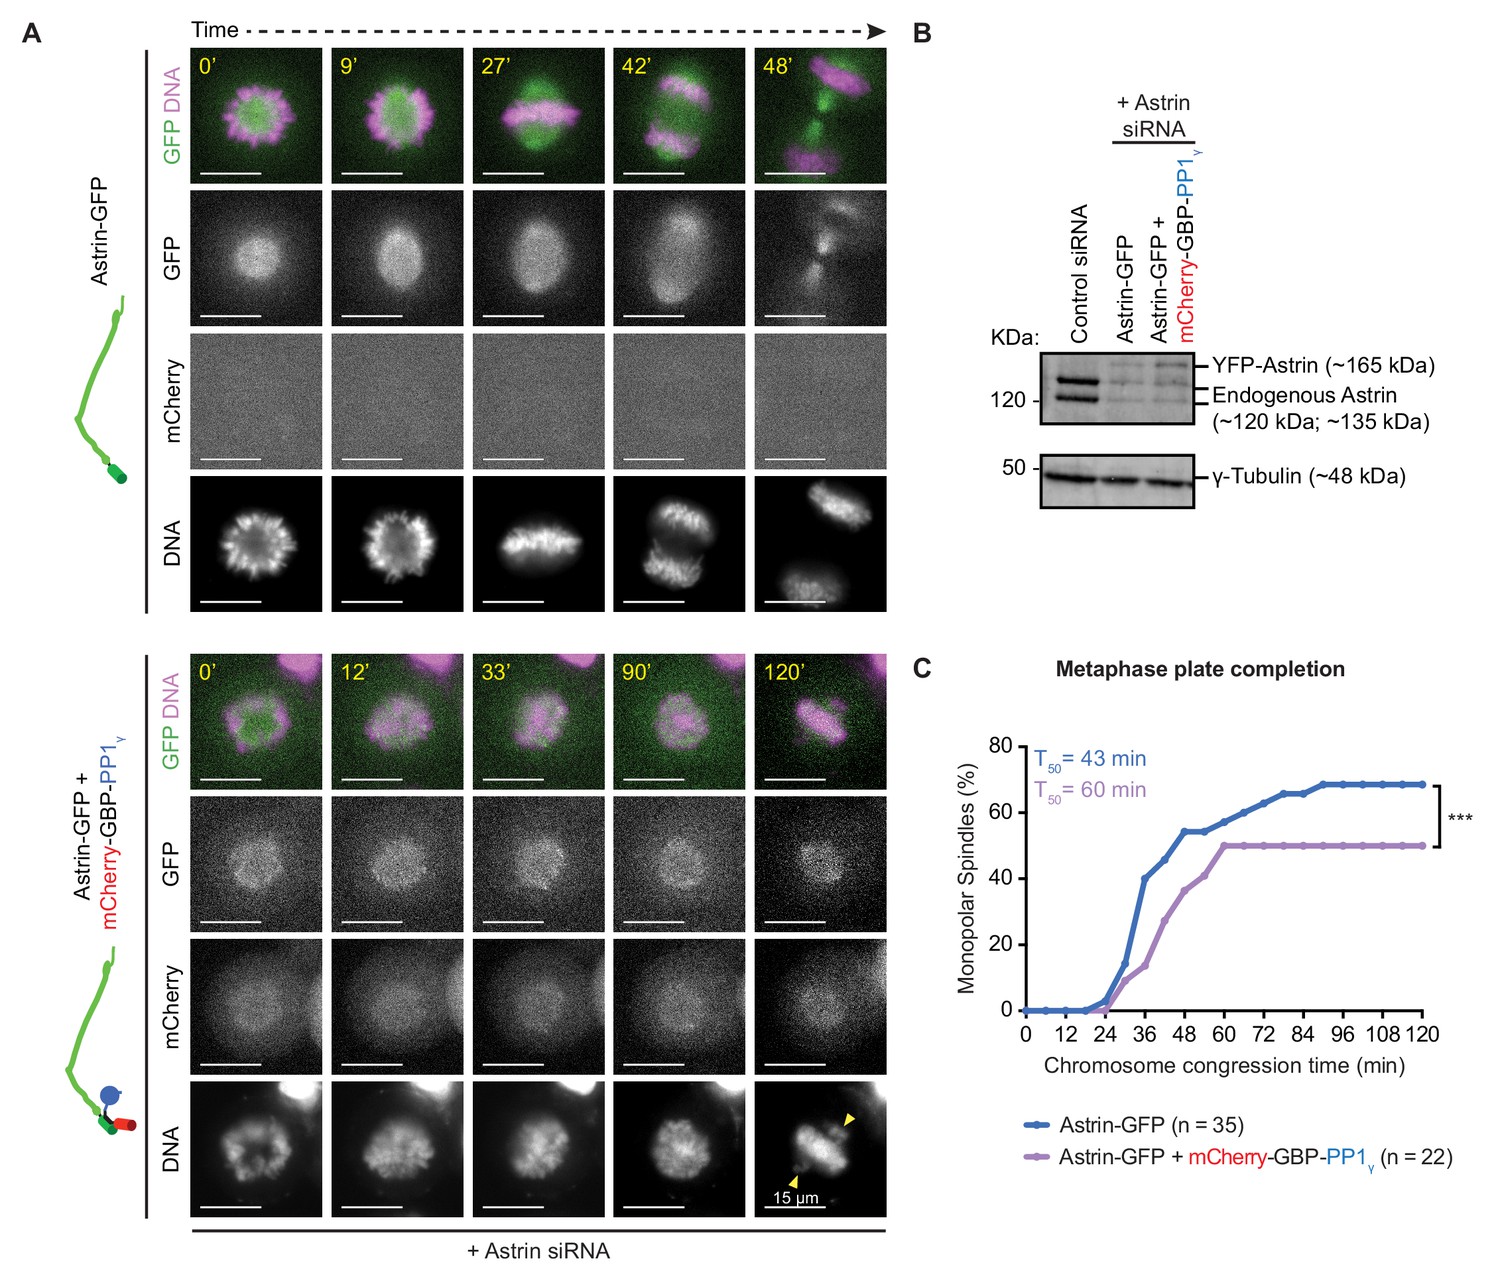
(A) Time-lapse images show monopolar to bipolar conversion of spindles in Astrin-siRNA treated cells expressing either Astrin-GFP alone or Astrin-GFP and mCherry-GBP-PP1γ as indicated. Yellow arrows mark chromosomes not aligned or congressed during a prolonged metaphase arrest. Scale as indicated. Monopolar to bipolar spindle conversion assay regime outlined in Figure 8—figure supplement 1A. (B) Immunoblot shows the extent of Astrin depletion following Control or Astrin siRNA treatment as indicated. Lysates were harvested at the end of the time-lapse microscopy shown in A. (C) Cumulative graph of percentage of cells with monopolar spindles that aligned or congressed all chromosomes along the metaphase plate, assessed from time-lapse movies of cells as shown in A. Only cells that displayed monopolar spindles at the beginning of imaging were considered for analysis. ‘*' indicates a statistically significant difference in the proportion of monopolar spindles that congress chromosomes within 2 hr following STLC release. Scale as indicated.
Figure 8—figure supplement 1
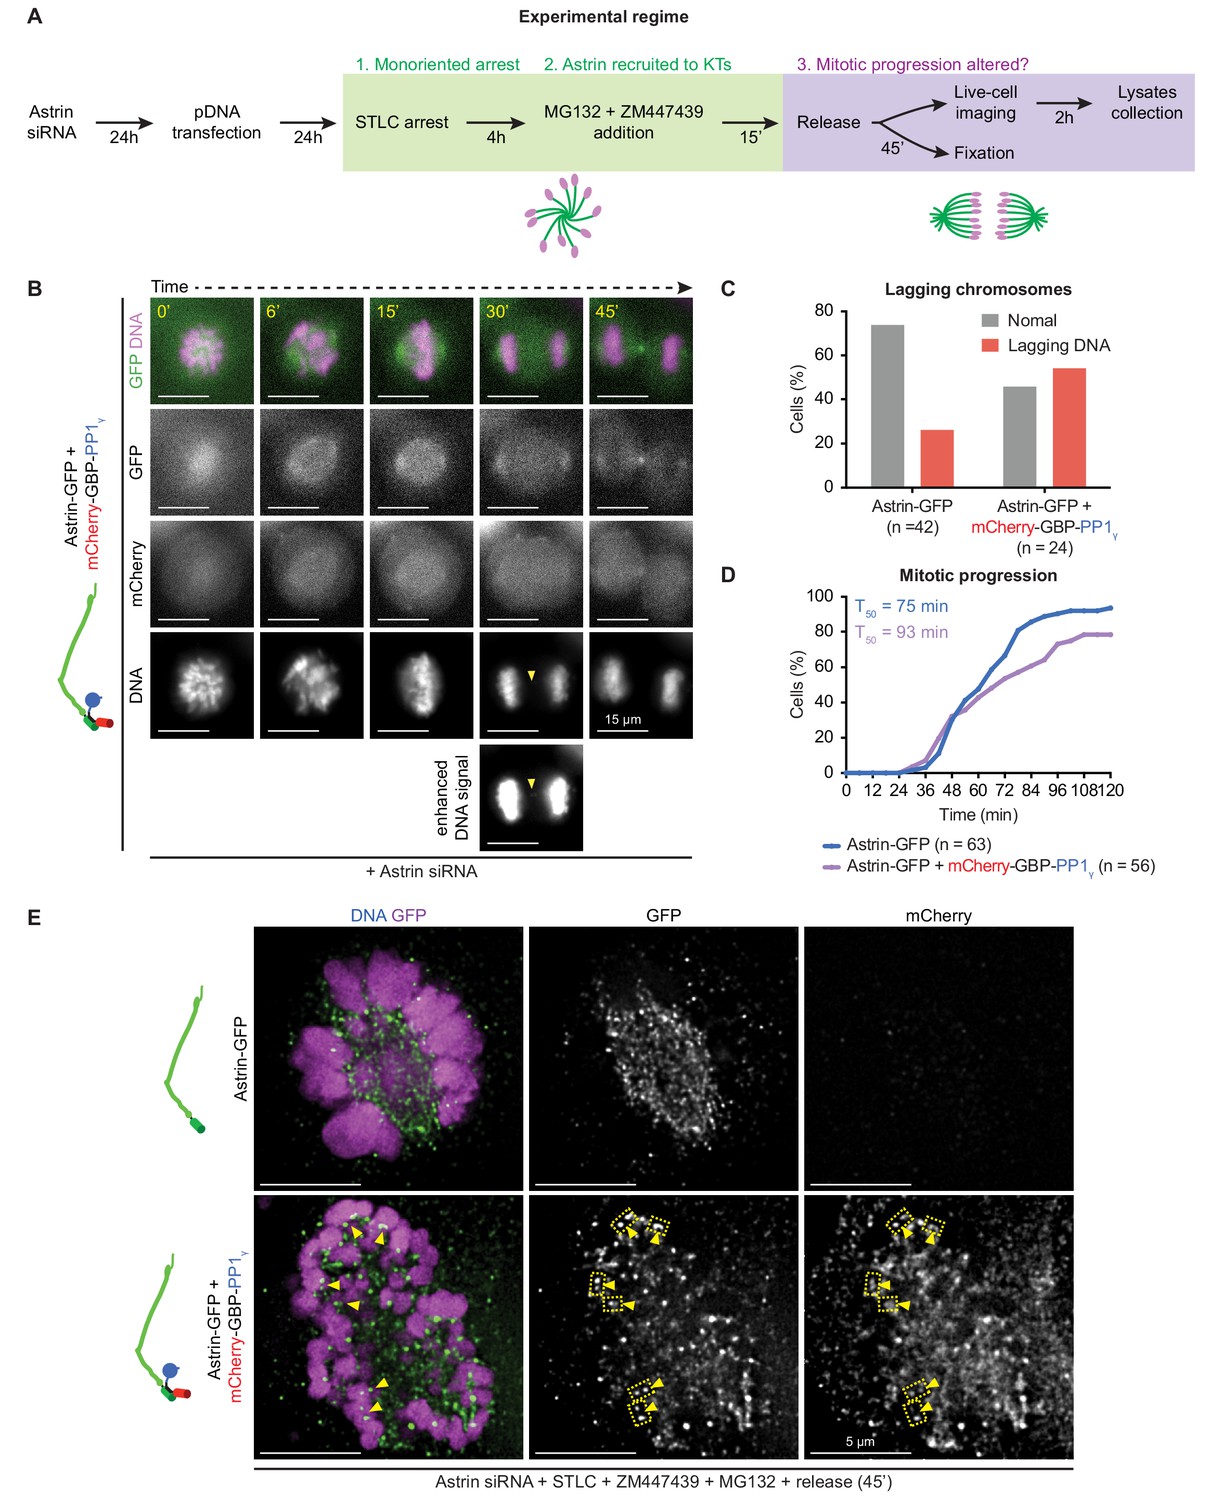
Premature and constitutive delivery of Astrin:PP1 disrupts anaphase onset and segregation accuracy.
(A) Astrin siRNA treated cells expressing either Astrin-GFP alone or Astrin GFP along with mCherry-GBP-PP1γ were exposed to STLC and Aurora-B inhibitor to generate monopolar spindles with stable Astrin:PP1 at kinetochores. After drug wash-off, monopolar to bipolar conversion and chromosome segregation were monitored using live-cell microscopy of Astrin-GFP (spindle) and SiR-DNA dye (chromosomes). (B) Time-lapse images of a cell co-expressing Astrin-GFP and mCherry-GBP-PP1γ undergoing monopolar to bipolar conversion of spindles Yellow arrows mark lagging chromosomes. Cells assessed from the same experiment shown in Figure 8A. (C) Bar graph showing the percentage of lagging chromosomes as shown in B that were counted in time-lapse movies of cells treated as in (A). (D) Cumulative graph showing the percentage of cells that completed monopolar to bipolar conversion and initiated anaphase, assessed using time-lapse movies as shown in Figure 8A. (E) Representative images of spindles undergoing monopolar to bipolar spindle conversion (45 min after STLC wash) show Astrin-GFP and mCherry-GBP-PP1γ signals at the kinetochore of cells expressing both Astrin-GFP and mCherry-GBP-PP1γ but not Astrin-GFP alone. Scale as indicated.
Figure 9
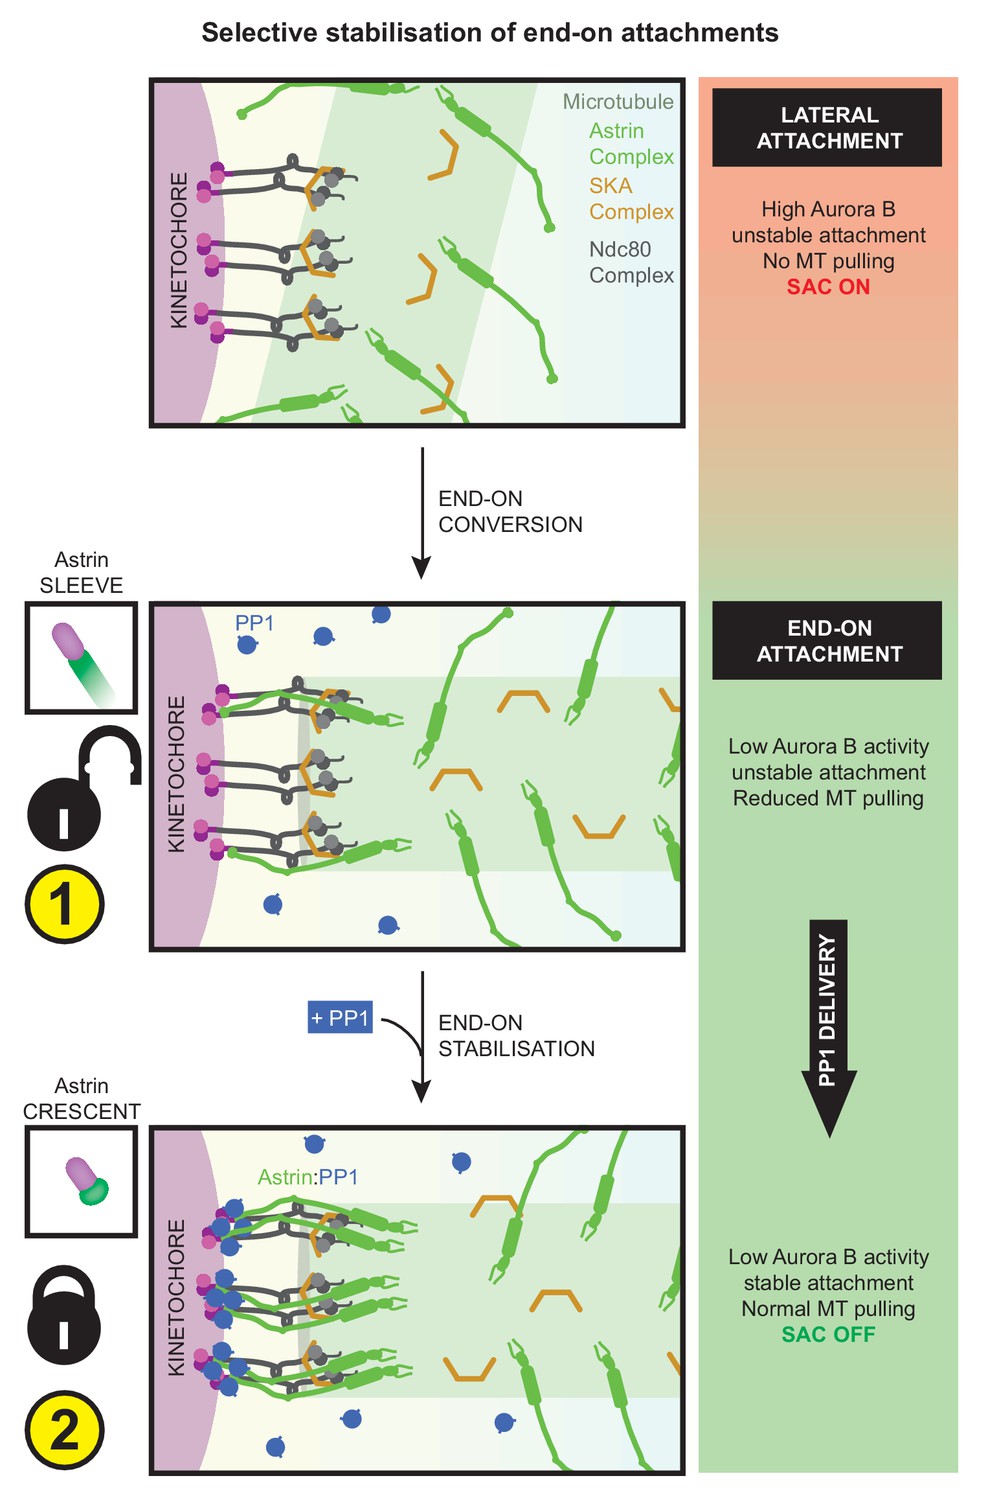
Astrin mediates rapid and selective stabilisation of end-on attachments, via local and timely delivery of PP1.
Kinetochores are first captured along microtubule-walls (immature lateral attachments) and then attached to microtubule-ends (mature end-on attachments). This process of end-on conversion requires the lowering of Aurora-B at the outer-kinetochore. We show that in the absence of Astrin's tail mediated PP1 interaction, Aurora-B inhibition alone is however insufficient to stably enrich Astrin or maintain end-on attachments. Astrin:PP1 interaction is required to promote Astrin’s own enrichment; this positive feedback loop allows rapid stabilisation of end-on attachments. Without Astrin:PP1 interaction, KT-MT attachments become unstable to cold treatment and can not withstand microtubule-mediated pulling forces, triggering the spindle checkpoint and delaying anaphase onset. Conversely, premature constitutive delivery of Astrin:PP1 interferes with error correction, chromosome congression and segregation fidelity. Thus, by dynamically regulating its own enrichment at kinetochores, Astrin-PP1 acts as a spatially restricted ‘lock’ that recognises and stabilises microtubule interactions, specifically, at end-on attached kinetochores.
Additional files
-
Source data 1
Includes fasta sequences used for bioinformatic search of Astrin elsewhere in Bilateria.
- https://cdn.elifesciences.org/articles/49325/elife-49325-data1-v2.fasta
-
Supplementary file 1
Key resource table contains the details of all the key reagents used during the development of this work.
- https://cdn.elifesciences.org/articles/49325/elife-49325-supp1-v2.docx
-
Transparent reporting form
- https://cdn.elifesciences.org/articles/49325/elife-49325-transrepform-v2.docx
Download links
A two-part list of links to download the article, or parts of the article, in various formats.
Downloads (link to download the article as PDF)
Open citations (links to open the citations from this article in various online reference manager services)
Cite this article (links to download the citations from this article in formats compatible with various reference manager tools)
Kinetochores attached to microtubule-ends are stabilised by Astrin bound PP1 to ensure proper chromosome segregation
eLife 8:e49325.
https://doi.org/10.7554/eLife.49325


