ON selectivity in the Drosophila visual system is a multisynaptic process involving both glutamatergic and GABAergic inhibition
- Johannes Gutenberg-Universität Mainz, Germany
- European Neuroscience Institute Göttingen – A Joint Initiative of the University Medical Center Göttingen and the Max-Planck-Society, Germany
- International Max Planck Research School and Göttingen Graduate School for Neurosciences, Biophysics, and Molecular Biosciences (GGNB) at the University of Göttingen, Germany
- Center of Advanced European Studies and Research (caesar), Germany
- Philipps-Universität Marburg, Germany
Figures
Figure 1
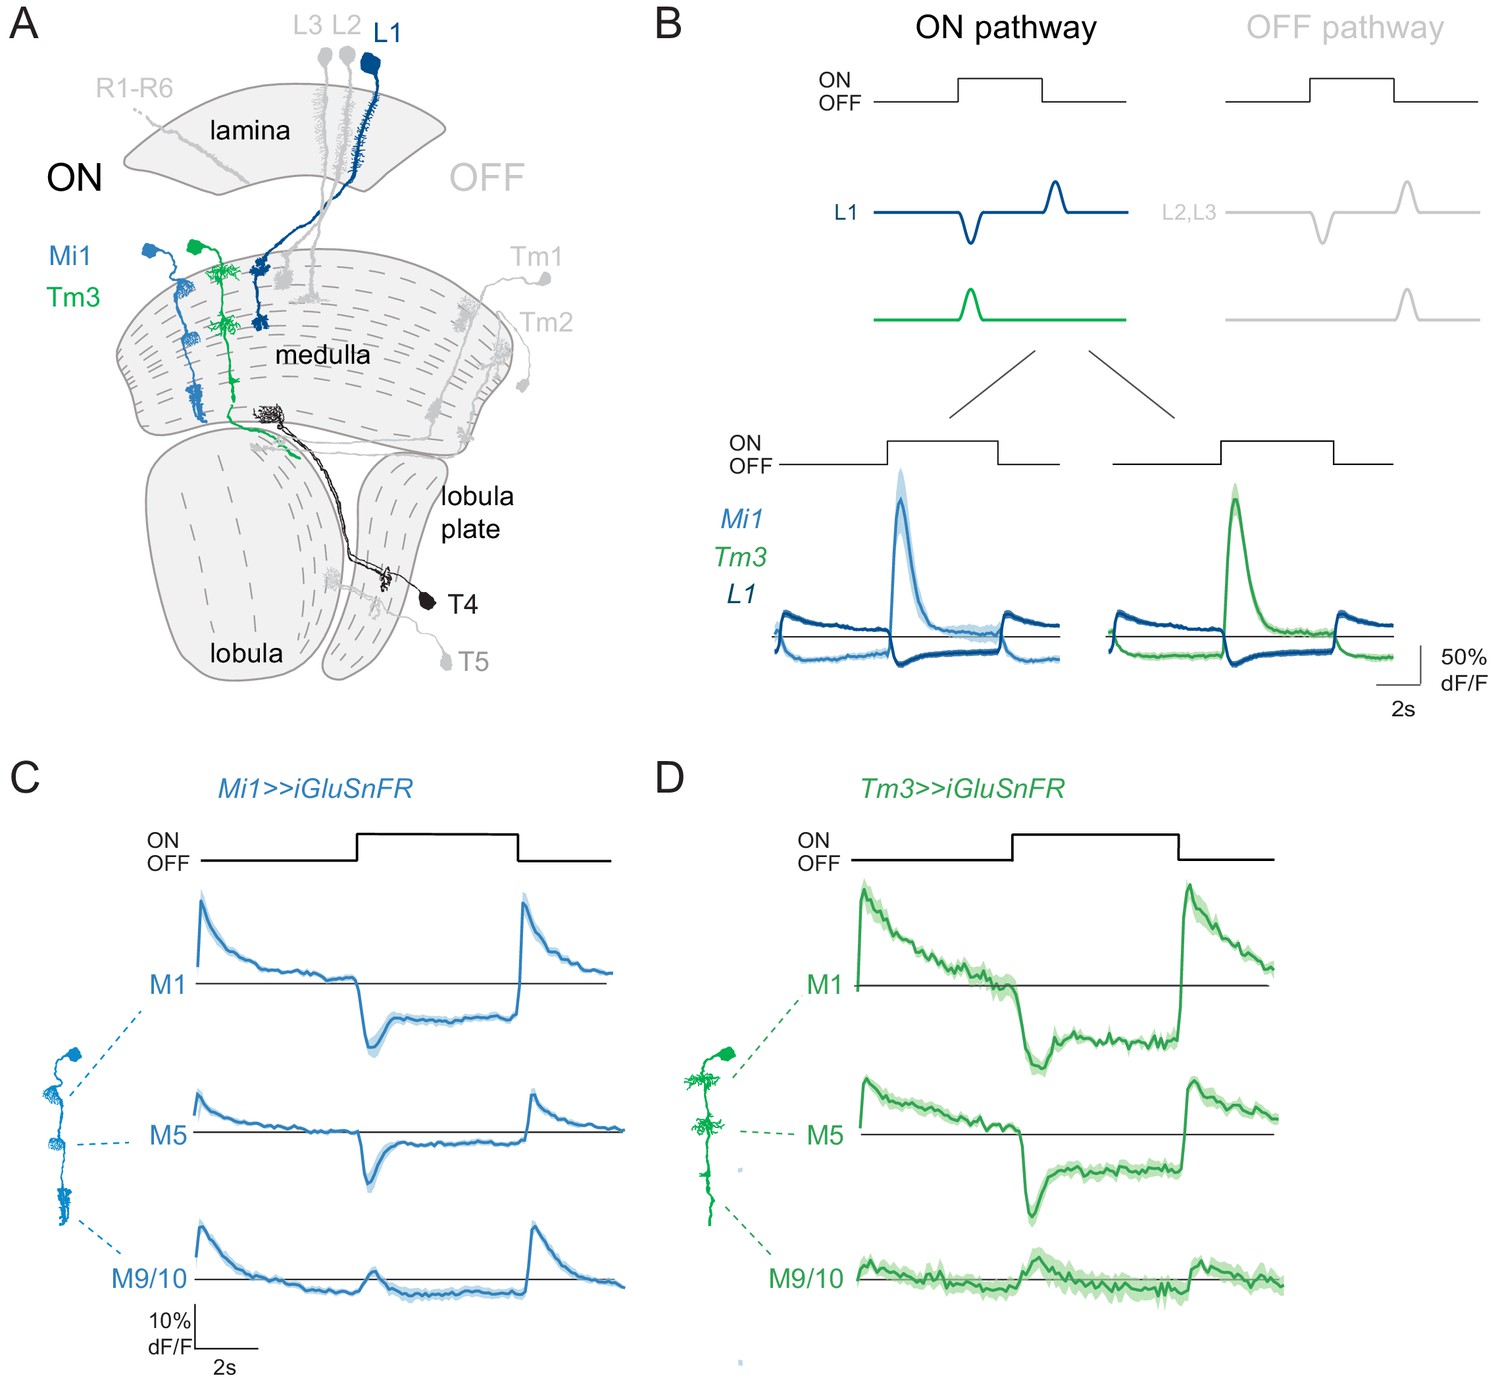
ON pathway medulla neurons that receive graded, glutamatergic input.
(A) Schematic of the fly visual system, highlighting major neurons of the ON (colored) and OFF (gray) pathways. Visual information travels from the photoreceptors (R1–R6) through the lamina, medulla and lobula complex (lobula + lobula plate). In the ON pathway, the L1 input and its two major postsynaptic targets Mi1 and Tm3 are highlighted, as well as their common target, the T4 ON-direction-selective cell. (B) Top: Schematic representation of the signal transformations that occur at the lamina-to-medulla neuron synapse. In the ON pathway, a sign inversion is required downstream of linear lamina neuron inputs. Bottom: In vivo calcium signals in response to 5 s full-field flashes. L1 calcium signals (dark blue, n = 6 [99]) are of the opposite sign to the calcium signal in its major postsynaptic partners Mi1 (light blue, n = 5 [89]) and Tm3 (green, n = 7 [84]). (C,D) In vivo iGluSnFR signals in response to 5 s long full-field flashes at the dendrites of Mi1 (C, n = 9[278] in layer M1, n = 9[250] in M5) and Tm3 (D, n = 6[137] in layer M1, n = 6[141] in M5), or at the output region of these neuron types in medulla layers M9/10 (n = 9[326] for Mi1 in C, n = 6[161] for Tm3 in D). All traces show mean ± SEM. Sample sizes are given as number of flies [number of cells].
Figure 2 with 3 supplements
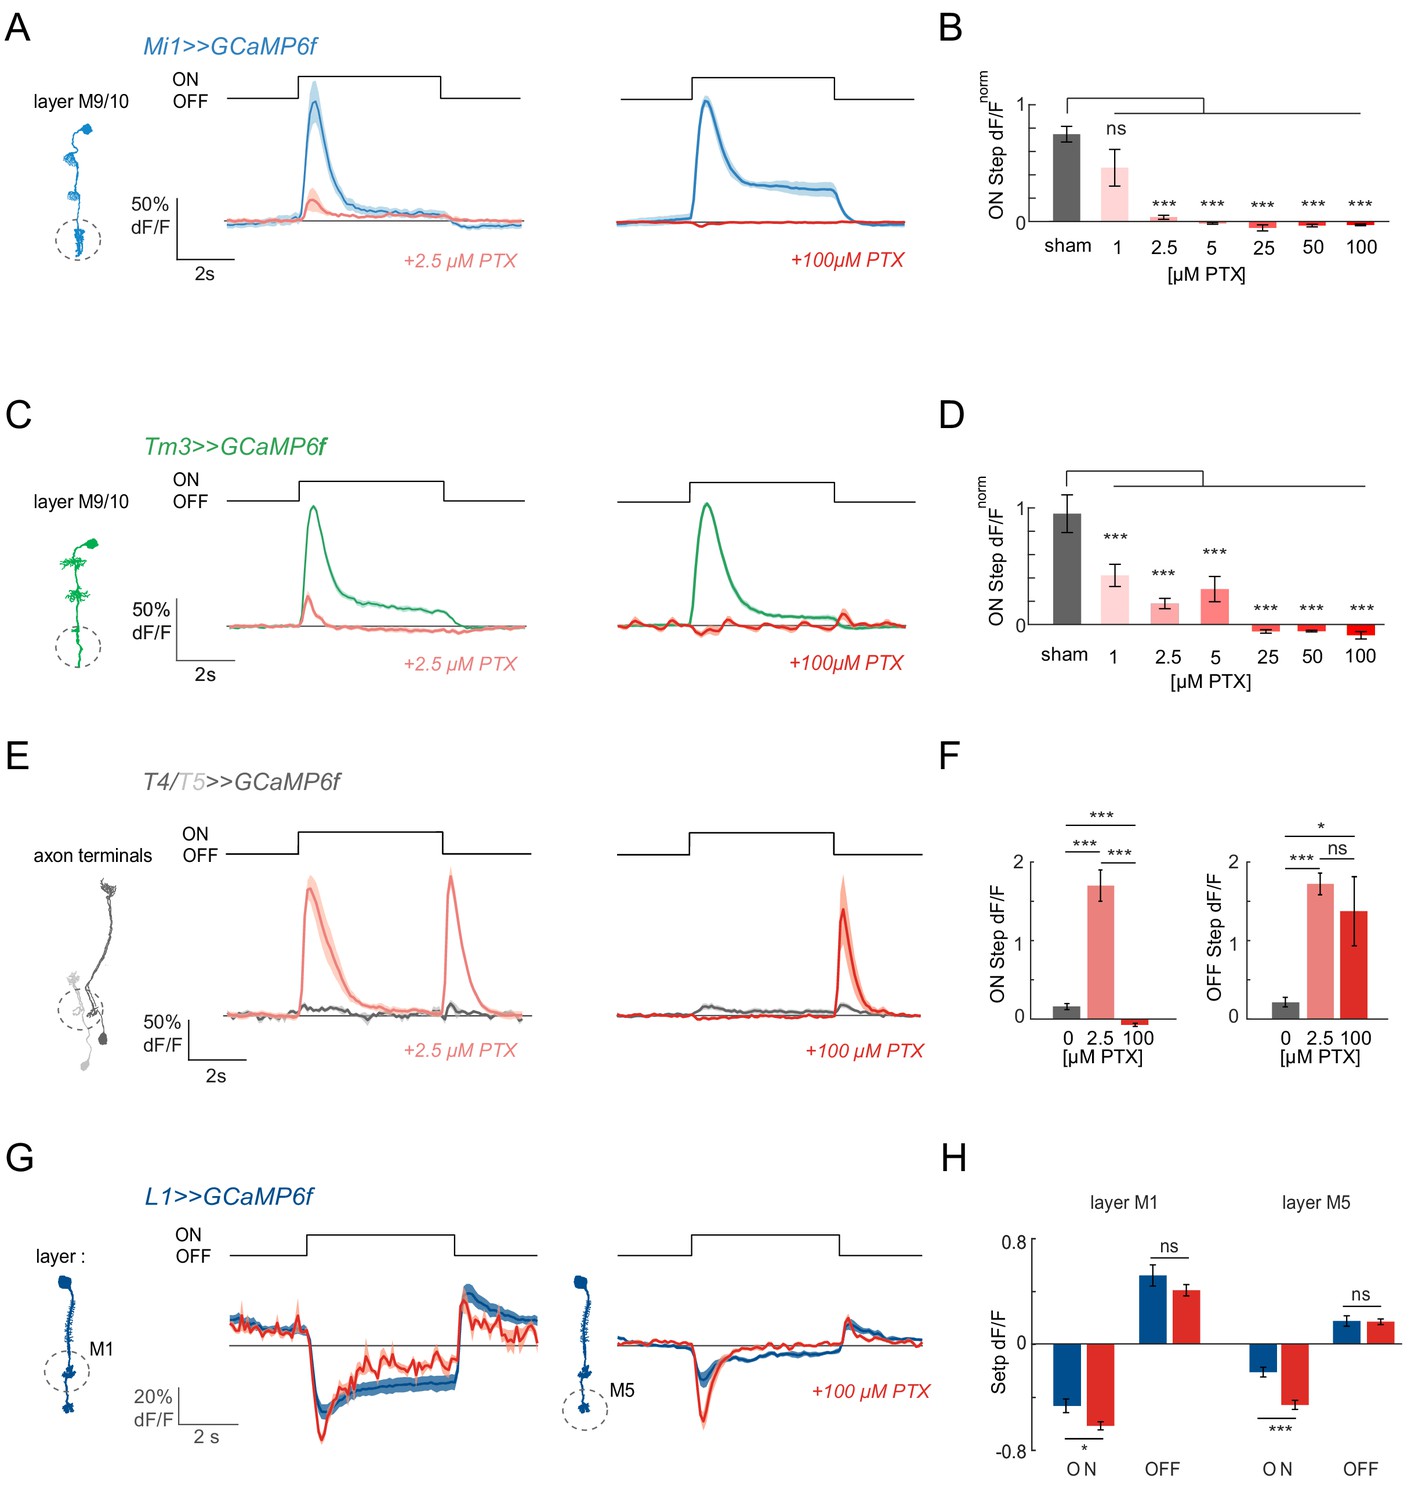
ON responses are abolished by PTX concentrations affecting GABAARs and GluCls.
(A) In vivo calcium signals recorded in layer M9/10 of Mi1 neurons, before (blue) and after (light red) PTX application. (B) Bar plot showing the quantification of the effect of PTX at various concentrations. A two-tailed Student t test was performed for each concentration against the sham control. Sample sizes were as follows: sham, n = 5 (89); 1 µM PTX, n = 5 (68); 2.5 µM PTX, n = 8 (102); 5 µM PTX, n = 5 (64); 25 µM PTX, n = 4 (30); 50 µM PTX, n = 5 (87); 100 µM PTX, n = 5 (89). (C) In vivo calcium signals recorded in layer M9/10 of Tm3 neurons, before (green) and after (light red) PTX application. (D) Bar plots showing the quantification of the effect of PTX at various concentrations. A two-tailed Student t test was performed for each concentration against the sham control. Sample sizes were as follows: sham, n = 7 (84); 1 µM PTX, n = 8 (108); 2.5 µM PTX, n = 9 (127); 5 µM PTX, n = 7 (74); 25 µM PTX, n = 5 (64); 50 µM PTX, n = 5 (51); 100 µM PTX, n = 6 (92). (E) In vivo calcium signals in response to full-field flashes recorded in the axon terminals of T4/T5 neurons (n = 9 [229]), before (gray) and after (red) PTX application. (F) Bar plots showing the quantification of the results in (E). (G) In vivo calcium signals recorded in layer M1 (n = 6 [99]) and M5 (n = 6 [103]) of L1 neurons, before (dark blue) and after (red) 100 µM PTX application. (H) Bar plot showing the quantification of the data shown in (G). All traces show mean ± SEM. Sample sizes are given as number of flies (number of cells). *p<0.05, **p<0.01, ***p<0.001, tested with a one-way ANOVA and a post-hoc unpaired t-test with Bonferroni-Holm correction for multiple comparisons in (B,D,F), and a paired Student t test in (H).
-
Figure 2—source data 1
Table 1 contains all mean ± s.e.m.
Data related to quantifications shown in main Figure 2, sorted by genotype and experimental condition.
- https://doi.org/10.7554/eLife.49373.011
Figure 2—figure supplement 1
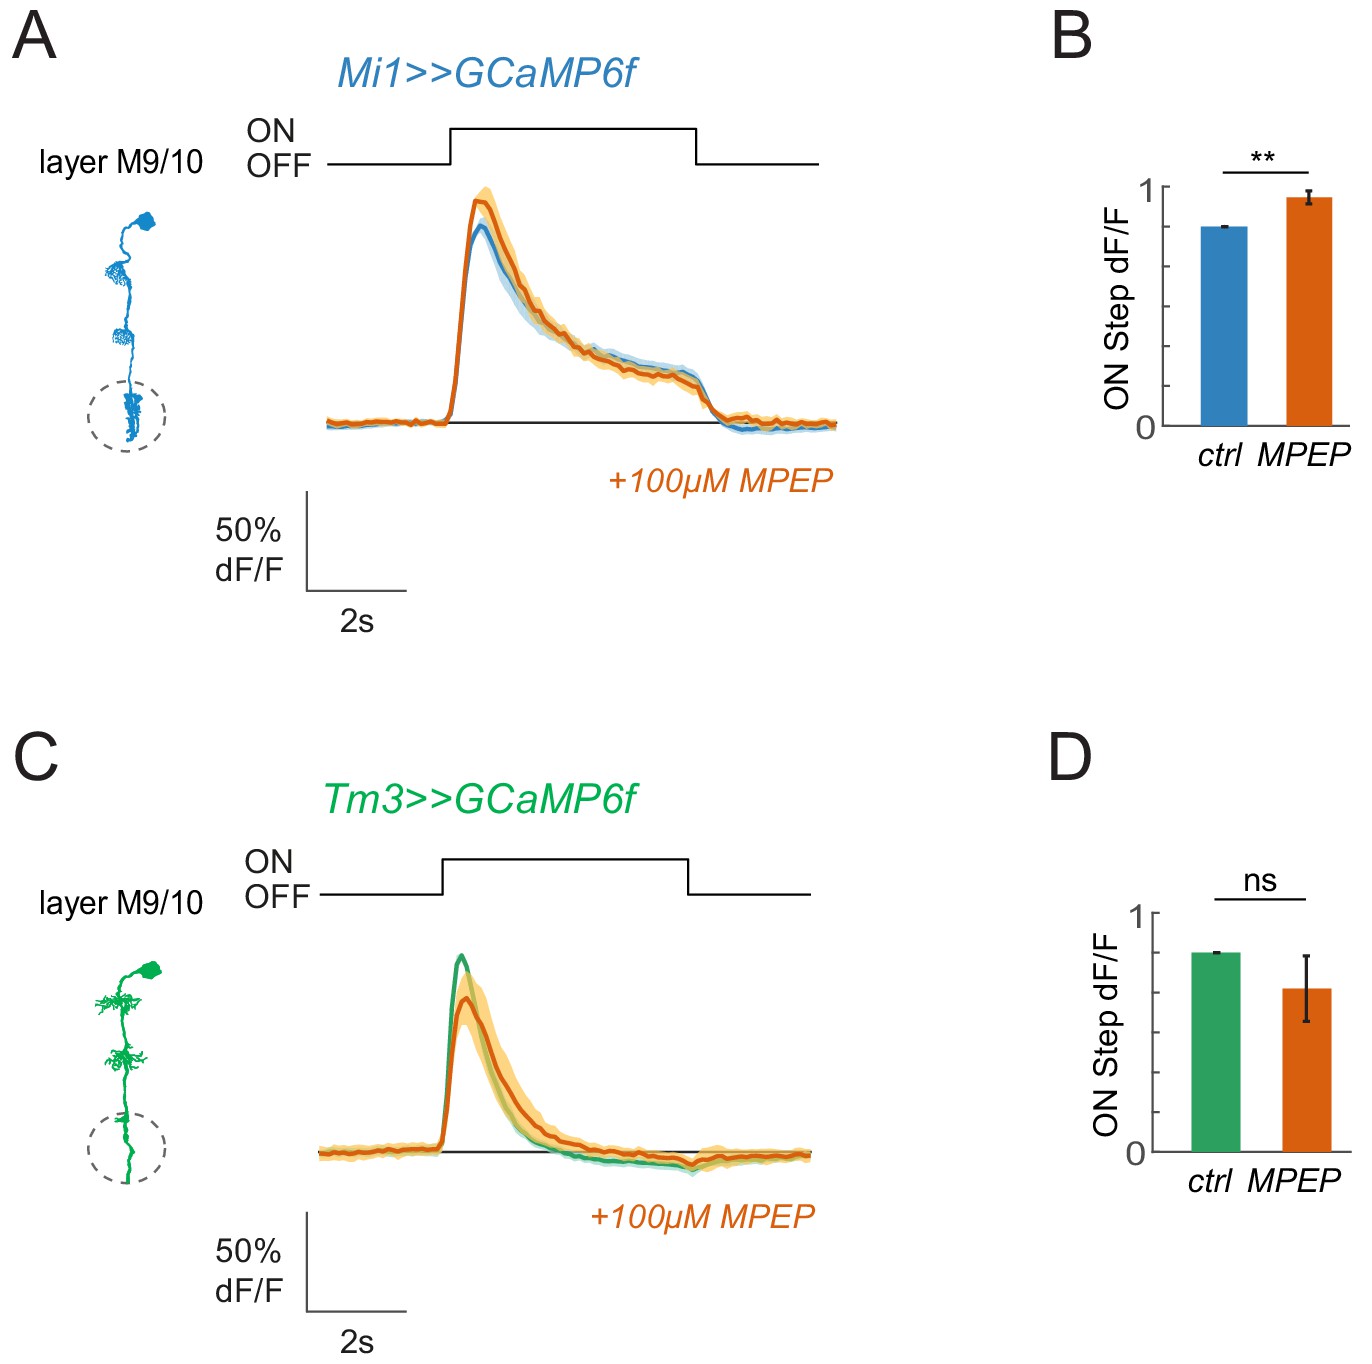
Blocking metabotropic glutamate receptors does not abolish ON responses.
(A,C) GCaMP6f signals in response to 5 s full-field flashes in layer M9/10 before (blue for Mi1, green for Tm3) and after (orange) application of 100 µM MPEP. The same cells were imaged before and after drug application. Sample sizes were n = 5 (58)±MPEP for Mi1, and n = 5 (40)±MPEP for Tm3. (B,D) Bar plots showing the quantification of the ON step. *p<0.05, **p<0.01, ***p<0.001, tested with paired Student t test. All traces and bar plots show mean ± SEM. Sample sizes are given as n = number of flies (number of cells).
-
Figure 2—figure supplement 1—source data 1
Table 1 contains all mean ± s.e.m.
Data related to quantifications shown in main Figure 2—figure supplement 1, sorted by genotype and experimental condition.
- https://doi.org/10.7554/eLife.49373.006
Figure 2—figure supplement 2
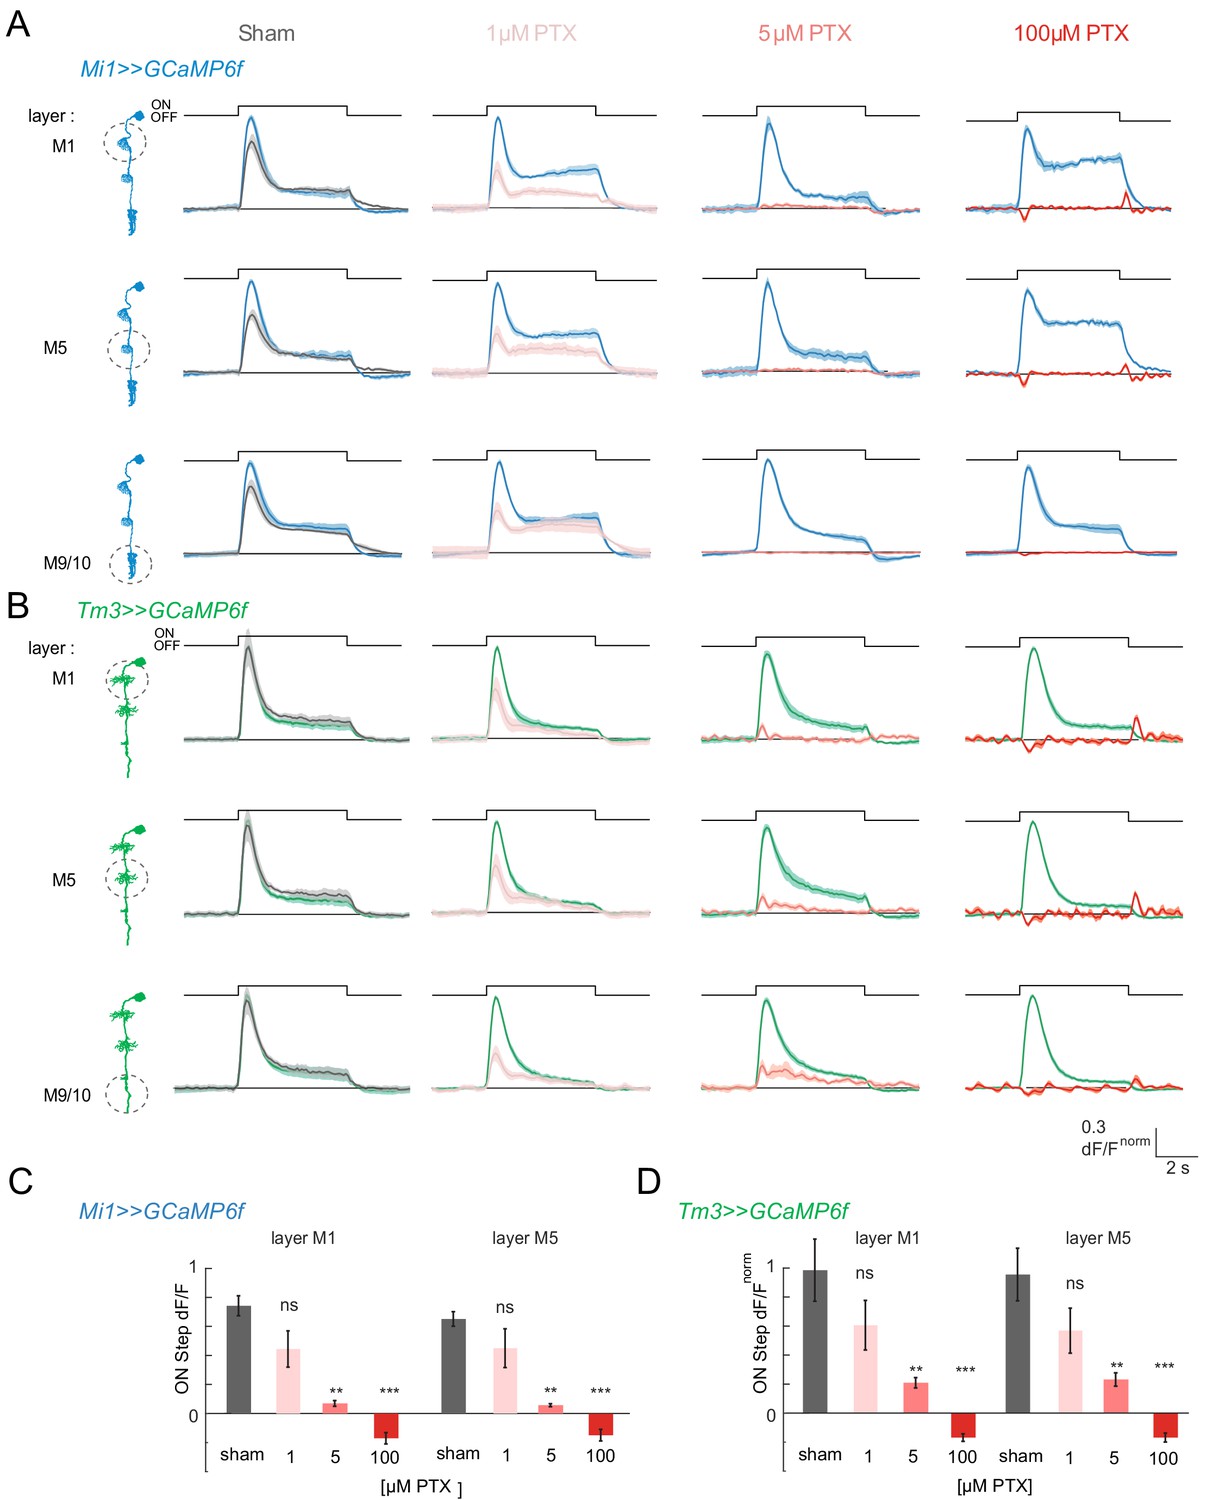
ON responses are abolished by PTX concentrations affecting GABAARs and GluCls.
(A,B) In vivo GCaMP6f signals recorded in layers M1, M5 and M9/10 of Mi1 (A) and Tm3 (B) neurons, before (blue, green) and after (gray, red) application of 0 (sham), 1, 5 or 100 µM PTX. (C,D) Bar plot showing the quantification of the ON step in (A,B). Sample sizes: sham, n = 5 (89); 1 µM, n = 5 (68); 5 µM, n = 5 (64); 100 µM, n = 5 (89). All traces show mean ± SEM. All sample sizes are given as number of flies (number of cells). *: p<0.05, **: p<0.01, ***: p<0.001, tested with a one-way ANOVA and a post-hoc unpaired t-test with Bonferroni-Holm correction for multiple comparisons.
-
Figure 2—figure supplement 2—source data 1
Table 1 contains all mean ± s.e.m.
Data related to quantifications shown in main Figure 2—figure supplement 2, sorted by genotype and experimental condition.
- https://doi.org/10.7554/eLife.49373.008
Figure 2—figure supplement 3
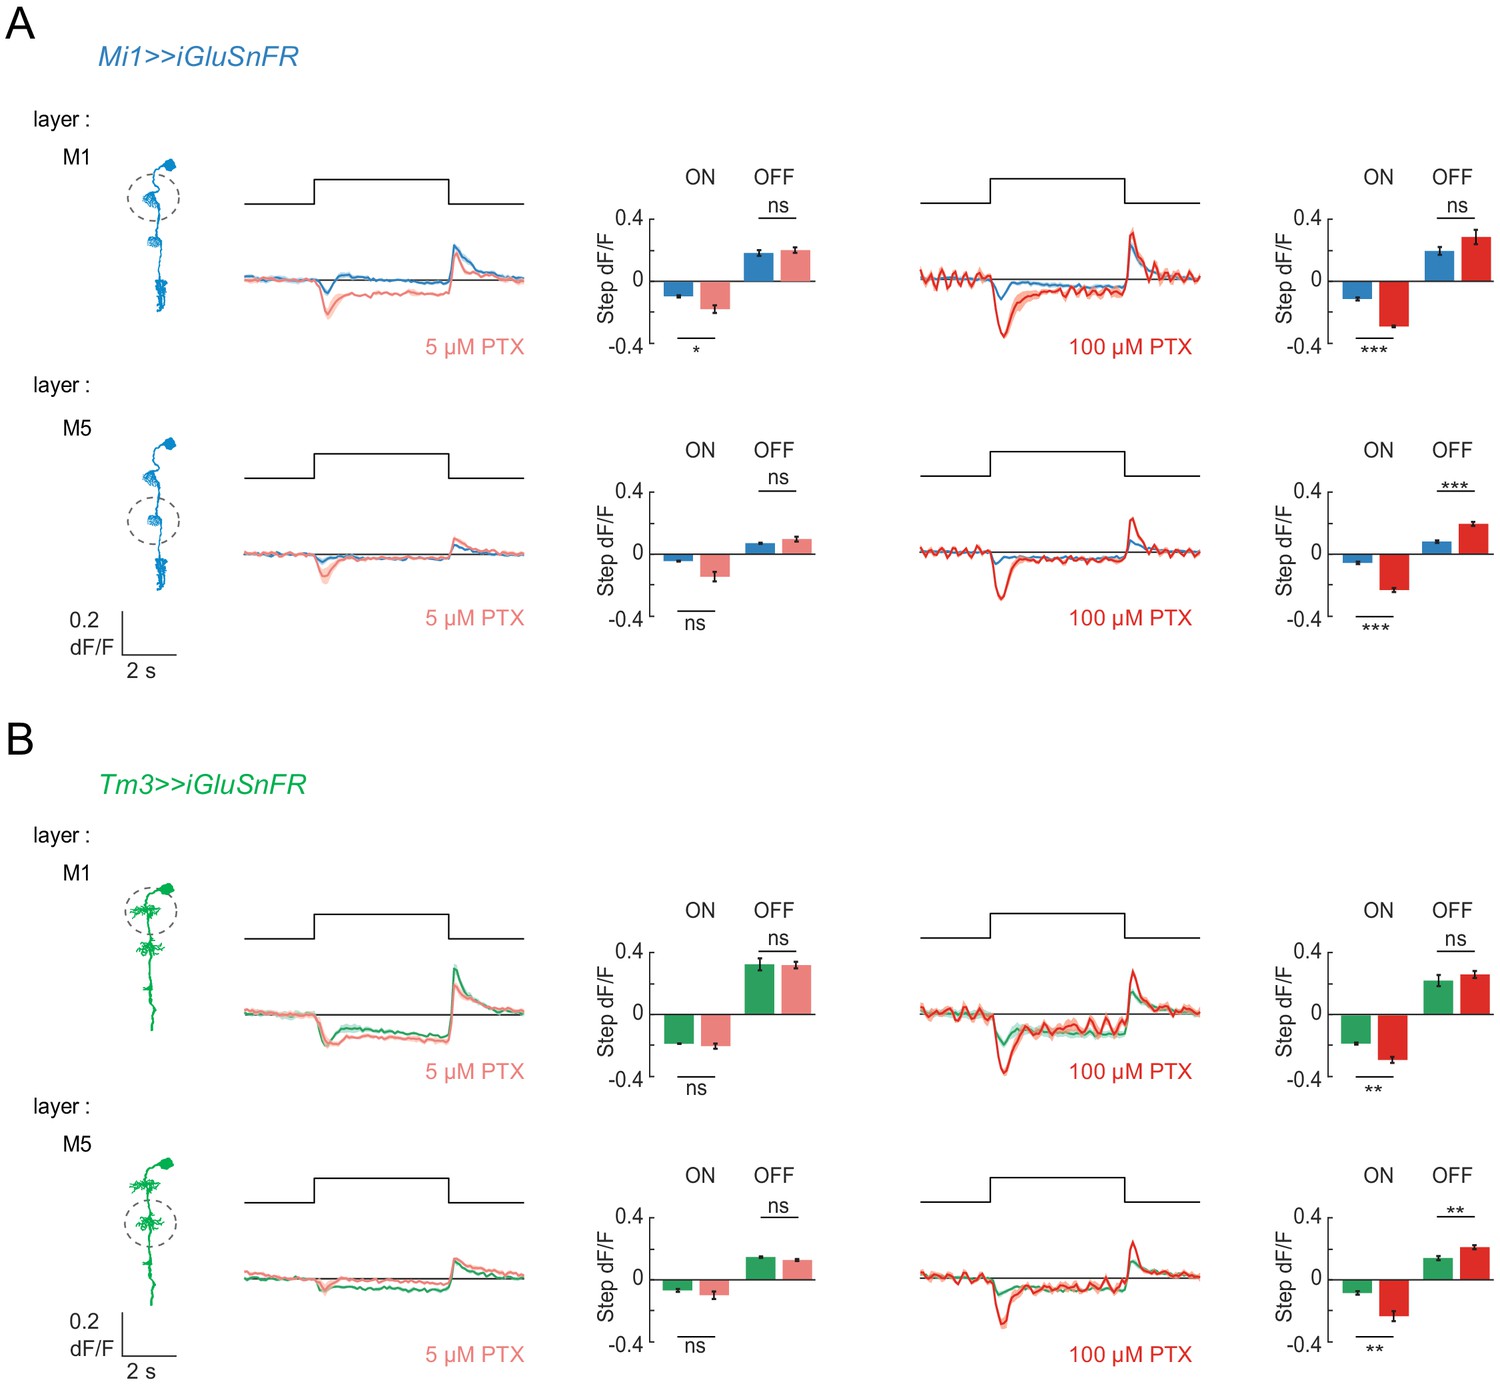
The glutamatergic input onto Mi1 and Tm3 dendrites is still present upon PTX application.
(A,B) In vivo iGluSnFR signals recorded in layers M1 and M5 of Mi1 (A) or Tm3 (B) neurons, before (blue) and after application of either 5 or 100 µM PTX (light red/red). Bar plots showing the quantification of the ON and OFF response. **p<0.01, ***p<0.001, tested with paired Student t test. Sample sizes were N = 5 (64/67) for Mi1 in 5 µM PTX, N = 6 (72/72) for Mi1 in 100 µM PTX, N = 5 (62/60) for Tm3 in 5 µM PTX, and N = 5 (60/63) for Tm3 in 100 µM PTX, given as N = number of flies (number of cells in M1/M5). All traces show mean ± SEM.
-
Figure 2—figure supplement 3—source data 1
Table 1 contains all mean ± s.e.m.
Data related to quantifications shown in main Figure 2—figure supplement 3, sorted by genotype and experimental condition.
- https://doi.org/10.7554/eLife.49373.010
Figure 3 with 1 supplement
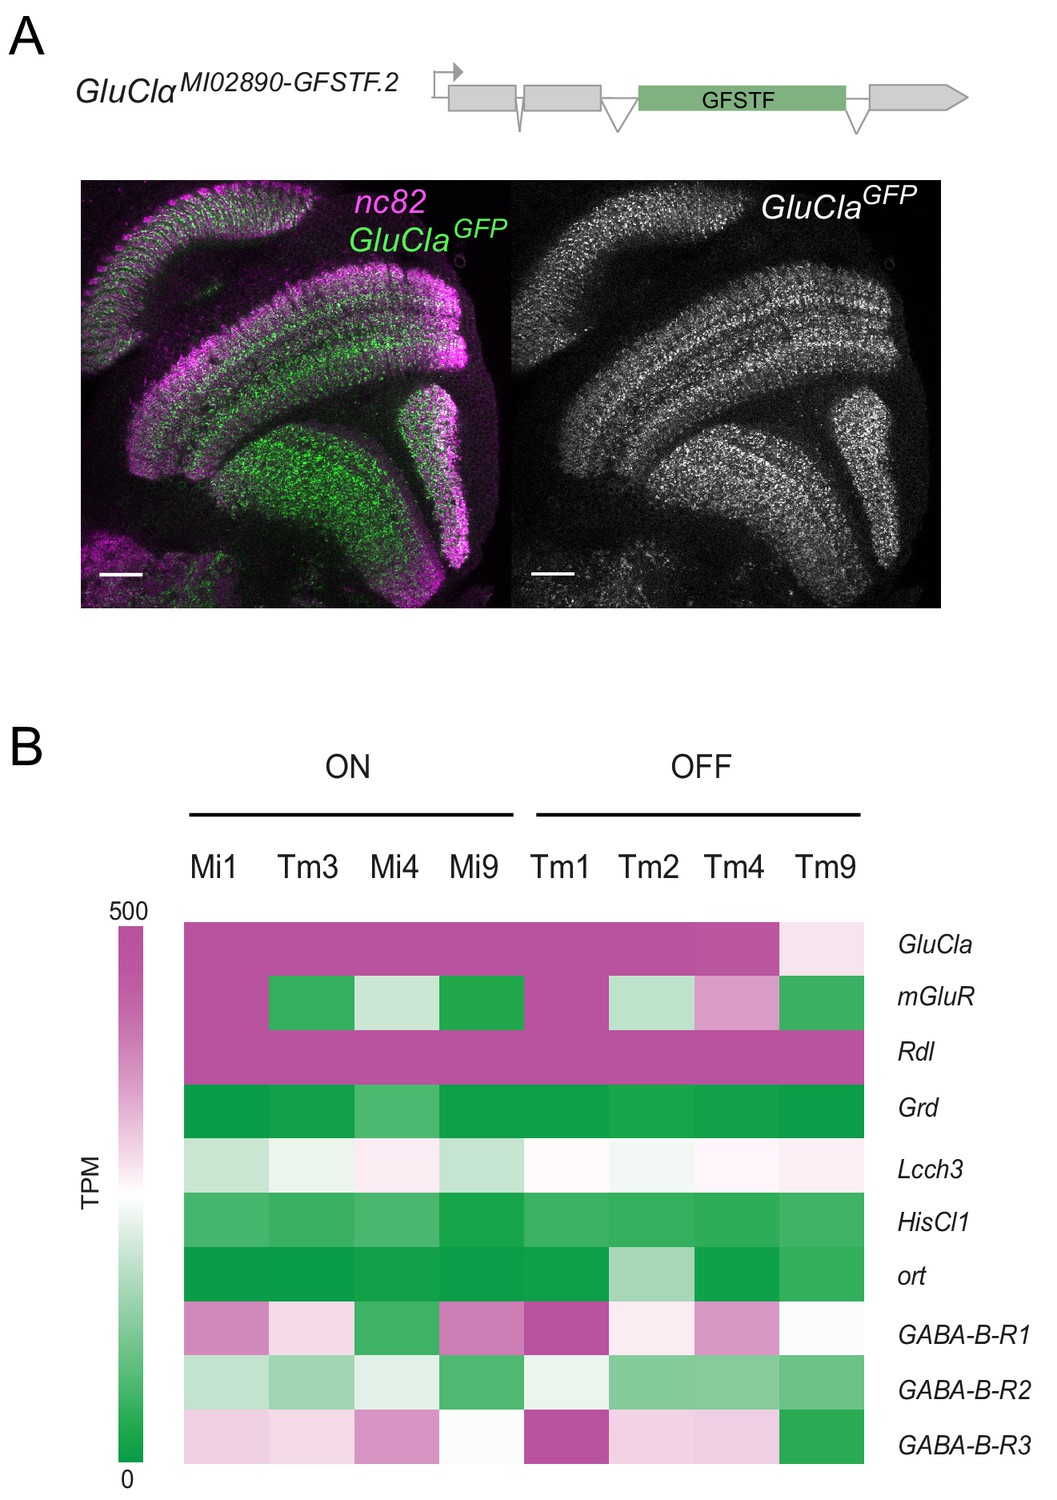
GluClα and Rdl are broadly expressed in the visual system.
(A) Confocal cross-section of the visual system of a fly carrying a GFP exon trap within the GluClα locus (GluClαMI02890.GFSTF.2). The neuropil is marked with nc82 (magenta) and endogenous GFP is in green/gray. Scale bar is 20 µm. (B) Expression levels shown as TPM (transcripts per kilobase million) values of inhibitory glutamate, GABA and histamine receptors. RNAseq data are from Davis et al. (2018) (GEO accession number: GSE 116969). Expression in the four most prominent medulla interneurons of the ON and OFF pathways are depicted.
Figure 3—figure supplement 1
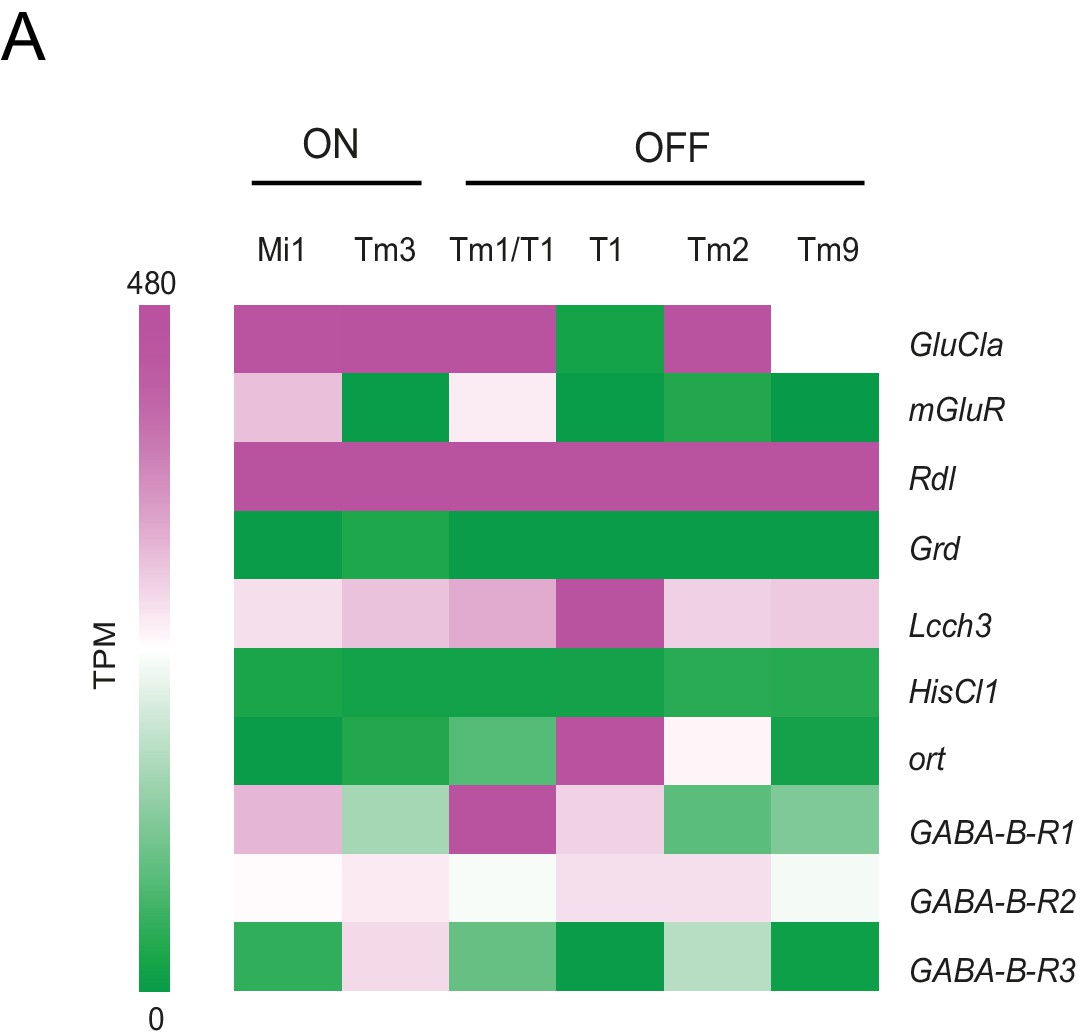
GluClα and Rdl are broadly expressed in the visual system.
(A) Expression levels shown as TPM (transcripts per kilobase million) values of candidate glutamate, GABA and histamine receptors. RNAseq data are from Konstantinides et al. (2018) (GEO accession number: GSE103772). Expression in all available medulla interneurons in the data set of the major ON and OFF pathways components is depicted.
Figure 4 with 2 supplements
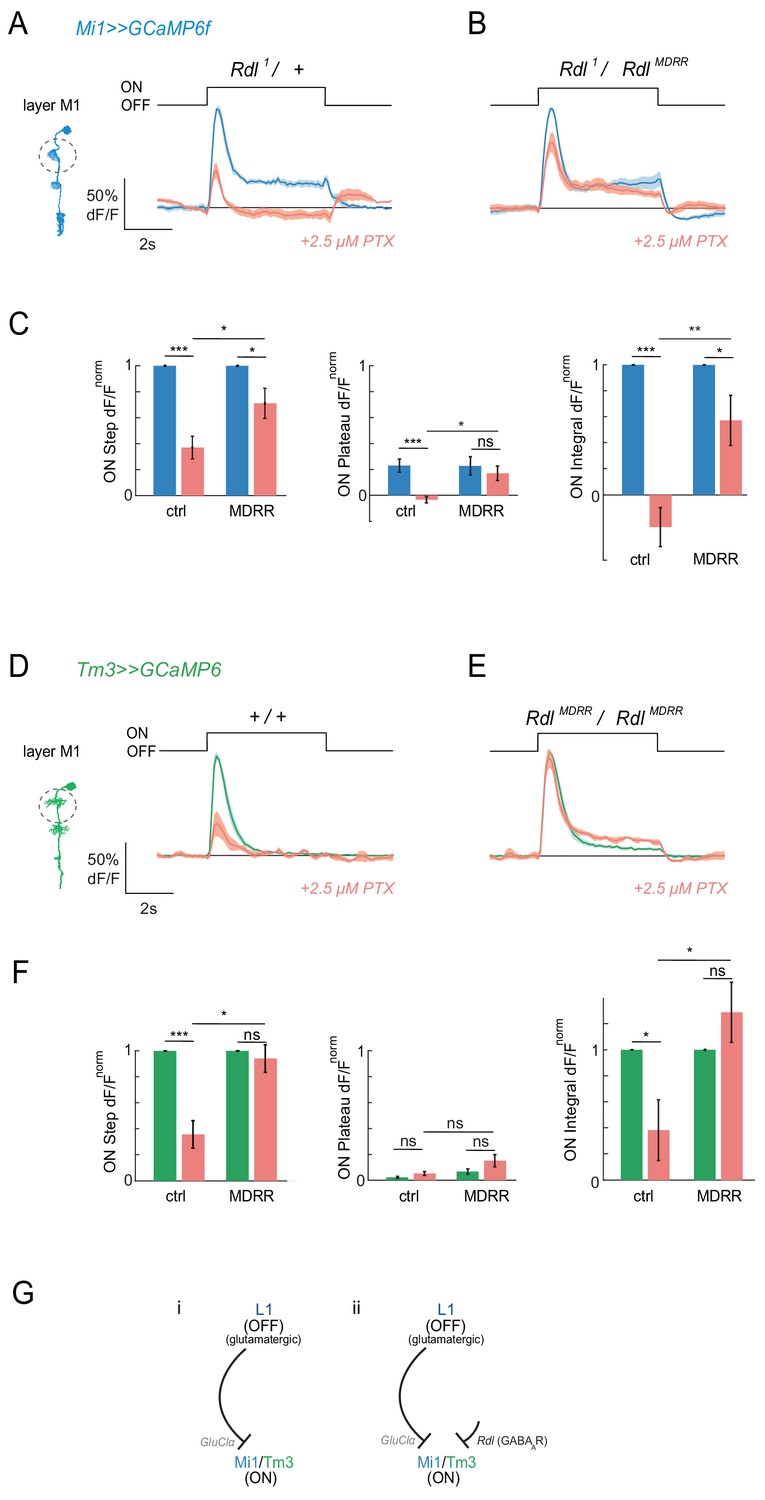
Pharmacogenetics shows that ON responses are partially mediated by the GABAAR Rdl.
(A,B) In vivo calcium signals in response to full-field flashes recorded in layer M1 of Mi1 neurons. Figure shows traces before (blue) and after (red) 2.5 µM PTX application in heterozygous Rdl1/+ controls (A, n = 7 (58)), or flies only expressing the PTX-insensitive RdlMDRR allele (Rdl1/RdlMDRR) (B, n = 8 (77)). (C) Bar plots showing the quantification of the normalized ON step, ON plateau and ON integral of the data shown in (A,B). *p<0.05, **p<0.01, ***p<0.001, tested with an unbalanced two-way ANOVA, corrected for multiple comparisons. (D,E) In vivo calcium signals in response to full-field flashes recorded in the layer M1 of Tm3 neurons. Genotypes: ctrl = Rdl1/+ and 1 = Rdl1/RdlMDRR. Figure shows traces before (green) and after (red) PTX application +/+ controls (D, 1 = 5[34]), or flies only expressing the PTX-insensitive RdlMDRR allele (RdlMDRR/RdlMDRR) (E, n = 5[46]). (F) Bar plots showing the quantification of the traces shown in (D,E). All traces show mean ± SEM. Sample sizes are given as number of flies (number of cells). *p<0.05, **p<0.01, ***p<0.001, tested with an unbalanced two-way ANOVA, corrected for multiple comparisons. (G) Schematic summarizing the results. Our results suggest that ON-selectivity does not arise solely through glutamate-gated chloride channels as initially thought (i). The GABAAR Rdl is required for ON-responses in a pathway parallel to the monosynaptic L1-Mi1/Tm3 connection (ii).
-
Figure 4—source data 1
Table 1 contains all mean ± s.e.m.
Data related to quantifications shown in main Figure 4, sorted by genotype and experimental condition.
- https://doi.org/10.7554/eLife.49373.018
Figure 4—figure supplement 1
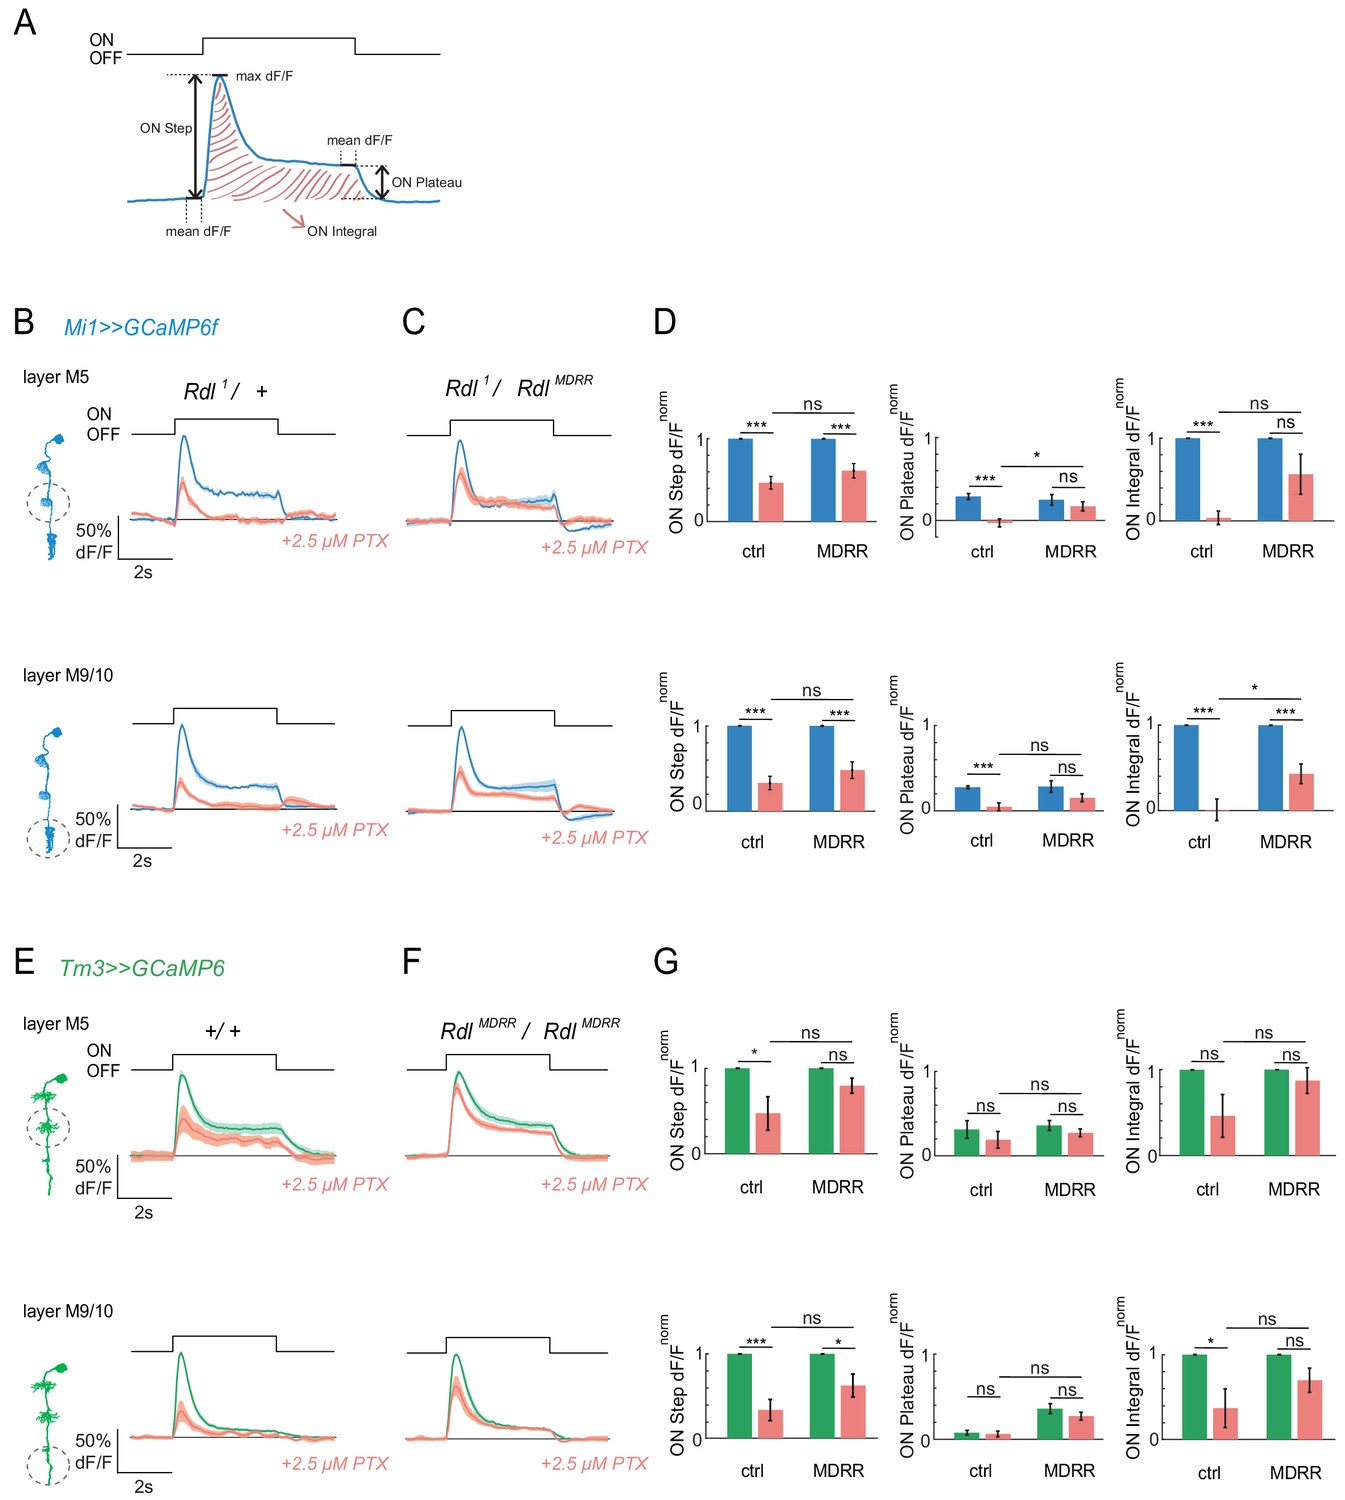
Pharmacogenetics shows that ON responses are partially mediated by the GABAAR Rdl.
(A) Schematics showing the quantification of the step response, the plateau response and the integrated response. (B,C) In vivo calcium signals in response to full-field stimulation recorded in layers M5 and M9/10 of Mi1 neurons. Figure shows traces before (blue) and after (red) application of 2.5 µM PTX in heterozygous Rdl1/+ controls (A, n = 7[55]/[78]), or flies only expressing the PTX-insensitive RdlMDRR allele (Rdl1/RdlMDRR) (B, n = 8[76]/[90]). (D) Bar plots showing the quantification of the data from (A, B). (E,F) In vivo calcium signals in response to full-field flashes recorded in the layers M5 and M9/10 of Tm3 neurons. Figure shows traces before (green) and after (red) PTX application in wild type (+/+) (D, n = 5[36]/[47]), or flies only expressing the PTX-insensitive RdlMDRR allele (RdlMDRR/RdlMDRR) (E, n = 5[57]/[57]). (G) Bar plots showing the quantification of data from (D,E). All traces show mean ± SEM. Sample sizes are given as number of flies [number of cells in M5/M9/10], *p<0.05, ***p<0.001, tested with an unbalanced two-way ANOVA, corrected for multiple comparisons.
-
Figure 4—figure supplement 1—source data 1
Table 1 contains all mean ± s.e.m.
Data related to quantifications shown in main Figure 4—figure supplement 1, sorted by genotype and experimental condition.
- https://doi.org/10.7554/eLife.49373.016
Figure 4—figure supplement 2
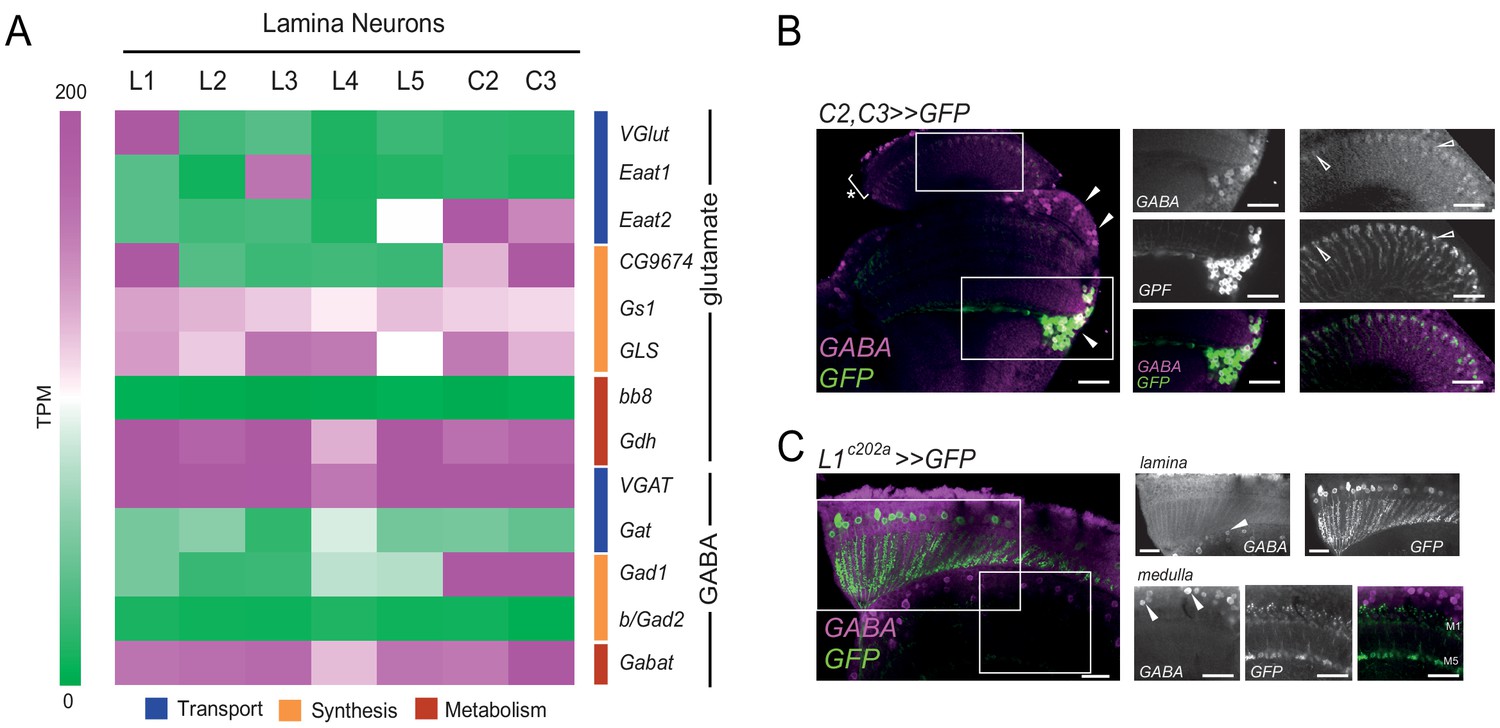
L1 neurons are not GABAergic.
(A) Expression levels shown as TPM values of genes related to the synthesis, transport and release of the neurotransmitters glutamate and GABA. RNAseq data are from Davis et al. (2018) (GEO accession number: GSE 116969). Expression in the lamina neurons L1, L2, L3, L4, L5, C2 and C3. (B,C) Confocal images of the fly visual system of a fly expressing C2/C3 >> GFP (B) or L1 >>GFP (C) and marked with anti-GFP (green/gray) and anti-GABA (magenta/gray). C2/C3 are known GABAergic cell types and serve as positive controls. (B) The GABA staining shows GABA-positive signal in medulla cell bodies and C2/C3 cell bodies (filled arrowheads), as well as in C2/C3 axon terminals in the lamina (open arrowheads), but not in the lamina cortex (asterisk). (C) L1 cell bodies and medulla layers M1 and M5 housing the L1 axon terminals do not show specific anti-GABA signal whereas some medulla neuron cell bodies are GABA-positive (filled arrowheads). White boxes mark approximate location of the individual images to the left. Note that the medulla image in (C) is from a different brain. Scale bars are 20 µm.
Figure 5

A GluClα allele insensitive to picrotoxin.
(A) 3D protein structure of Drosophila melanogaster GluClα binding PTX, obtained by homology modeling with its C. elegans homolog GluClα using the Protein Homology/analogY Recognition Engine Phyre 2. (Kelley et al., 2015). The PTX structure was obtained from DrugBank, identification number DB00466. Structures were edited using Chimera 1.13, (Pettersen et al., 2004). (B) Alignment of the M2 helix of different ligand-gated chloride channel. The histamine-gated chloride channel ort (Zheng et al., 2002), the glutamate-gated chloride channels glc-1, glc-2, glc-3, GluClα, (Cully et al., 1996; Cully et al., 1994; Horoszok et al., 2001), and the GABAAR Rdl. PTX sensitivities are indicated as shades of red. D.mel = Drosophila melanogaster, C.ele = Caenorhabditis elegans, M.dom = Musca domestica. (C,D) Two-electrode voltage-clamp recordings at a holding potential of −70 mV from X. laevis oocytes expressing wild type (C) or S278T (D) GluClα. Currents were evoked by glutamate wash in (lower bars) in the absence or presence of 10 µM or 100 µM picrotoxin (upper bars). (E) Mean peak-current amplitudes of the glutamate-evoked response in the presence (red) and absence (gray) of picrotoxin, normalized to the peak-current amplitude evoked by glutamate after picrotoxin wash out. Bars show mean ± SEM. *p<0.05, **p<0.01, tested with a one-way ANOVA and a post-hoc unpaired t-test with Bonferroni-Holm correction for multiple comparisons. Sample sizes: WT n = 6 and S278T n = 4 for 10 µM, and WT n = 6 and S278T n = 6 for 100 µM PTX.
-
Figure 5—source data 1
Table 1 contains all mean ± s.e.m.
Data related to quantifications shown in main Figure 5, sorted by genotype and experimental condition.
- https://doi.org/10.7554/eLife.49373.020
Figure 6 with 1 supplement
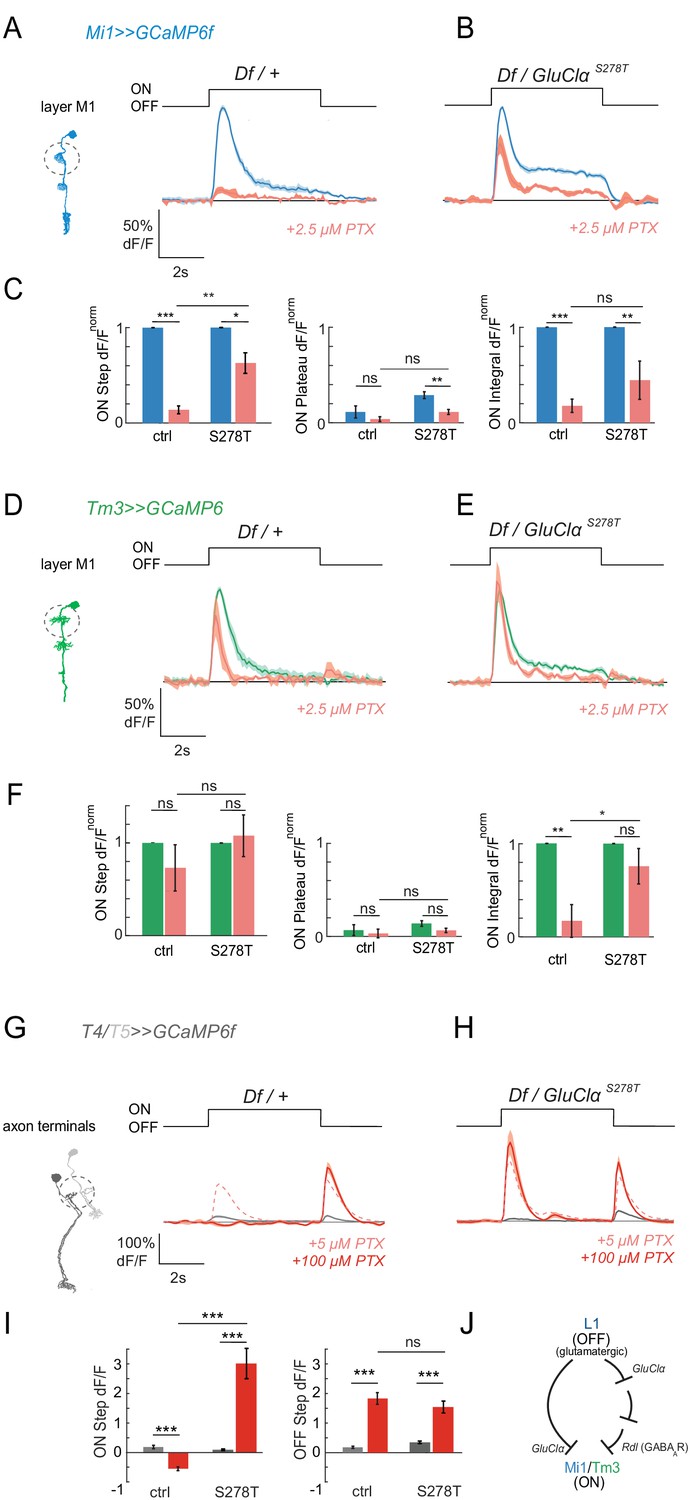
Pharmacogenetics shows that ON responses are mediated by GluClα.
(A,B) In vivo calcium signals in response to full-field flashes recorded in layer M1 of Mi1 neurons. Figure shows traces before (blue) and after (red) 2.5 µM PTX application in heterozygous GluClαDf/+ deficient controls (A, n = 5 [63]), as well as flies only expressing the PTX-insensitive GluClαS278T allele (GluClαS278T/GluClαDf).(B, n = 5 [47]). (C) Bar plots showing the quantification of the data from (A,B). *p<0.05, **p<0.01, ***p<0.001, tested with an unbalanced two-way ANOVA, corrected for multiple comparisons. (D,E) In vivo calcium signals in response to full-field flashes recorded in the layer M1 of Tm3 neurons. Figure shows traces before (green) and after (red) PTX application in heterozygous GluClα Df/+ deficient controls (D, n = 5 [30]), as well as flies only expressing the PTX-insensitive GluClαS278T allele (GluClαS278T/GluClαDf) (E, n = 5 [40]). (F) Bar plots showing the quantification of the data shown in (D,E). *p<0.05, **p<0.01, ***p<0.001, tested with an unbalanced two-way ANOVA, corrected for multiple comparisons. (G,H) In vivo calcium signals in response to full-field flashes recorded in T4/T5 axon terminals. Figure shows traces before (gray) and after (red) 100 µM PTX application in heterozygous GluClα Df/+ deficient controls (G, n = 10[440]), as well as flies only expressing the PTX-insensitive GluClαS278T allele (GluClαS278T/GluClαDf) (H, n = 5[192]). The pink dotted line shows responses after the application of 5 µM PTX. (I) Bar plots showing the quantification of the data shown in (G,H). *p<0.05, **p<0.01, ***p<0.001. Statistics was done using an unbalanced two-way ANOVA, corrected for multiple comparisons. All traces show mean ± SEM. Sample sizes are given as number of flies (number of cells). (J) Schematic summarizing the results. Our results provide support for a combinatorial role of glutamatergic and GABAergic inhibition in mediating ON responses. Since GluClα is likely to be the receptor on all neurons postsynaptic to L1, Rdl could function downstream of GluClα.
-
Figure 6—source data 1
Table 1 contains all mean ± s.e.m.
Data related to quantifications shown in main Figure 6, sorted by genotype and experimental condition.
- https://doi.org/10.7554/eLife.49373.024
Figure 6—figure supplement 1
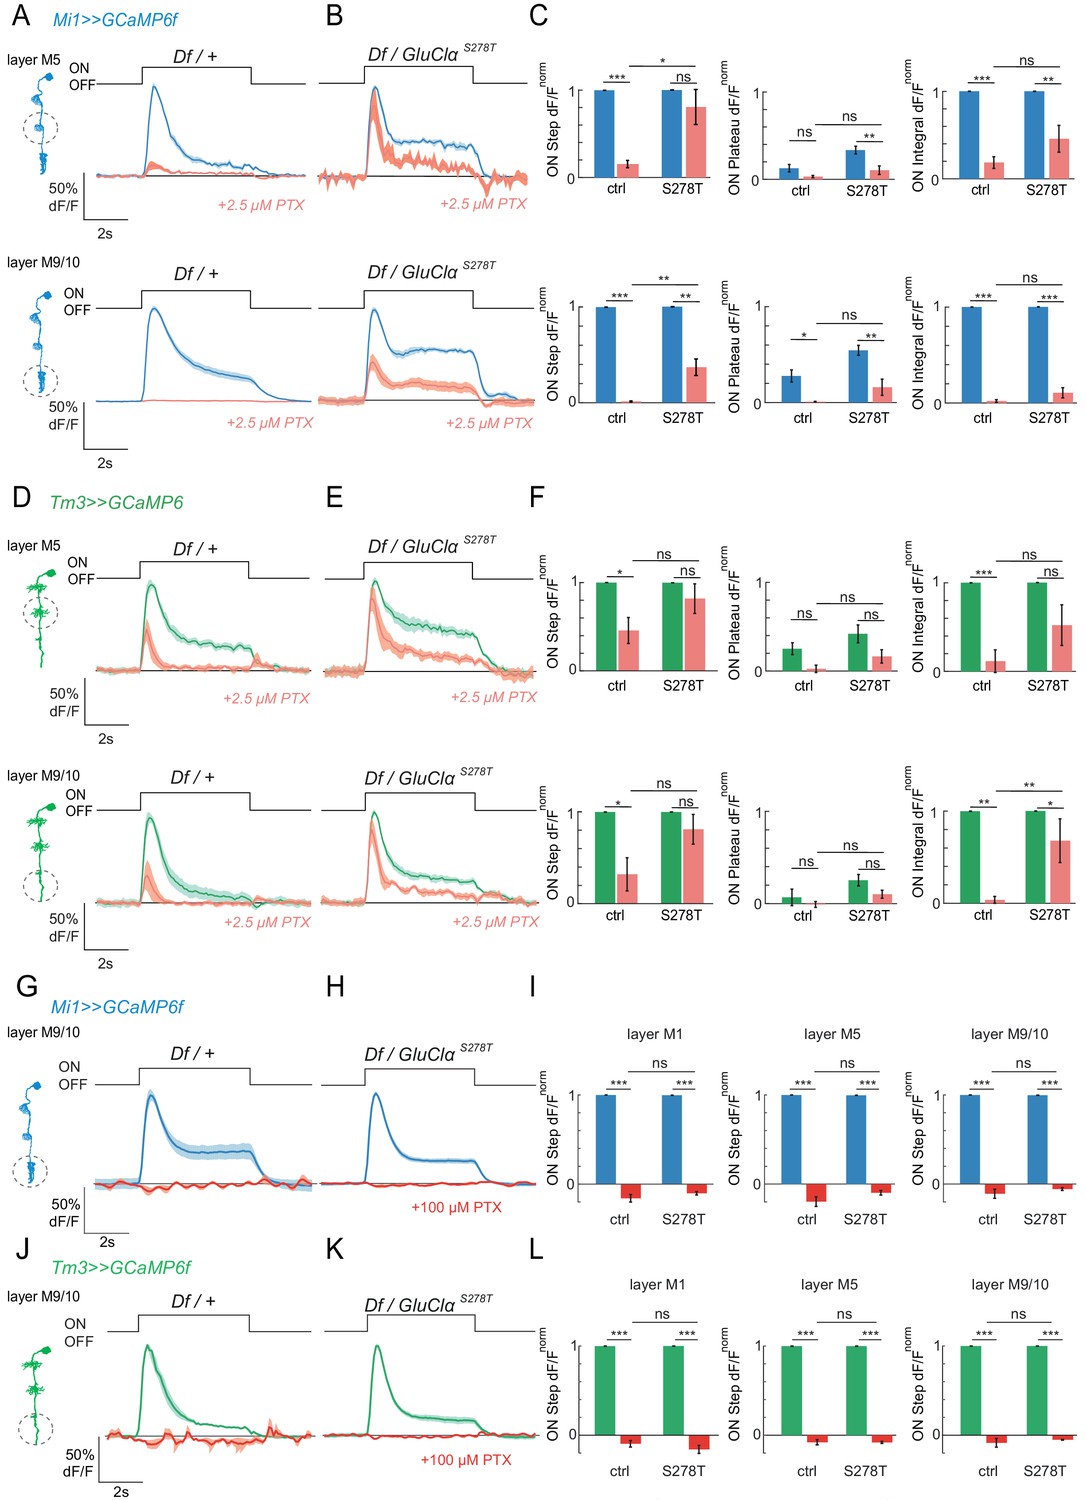
Pharmacogenetics shows that ON responses are mediated by GluClα.
(A,B) In vivo calcium signals in response to full-field flashes recorded in layers M5 and M9/10 of Mi1 neurons. Figure shows traces before (blue) and after (red) application of 2.5 µM PTX in heterozygous GluClαDf/+ controls (A, n = 5[44]/[63]), or flies only expressing the PTX-insensitive GluClαS278T allele (GluClαS278T/GluClαDf) (B, n = 5 [49]/[47]). Sample sizes are given as number of flies (number of cells in M5/M9/10). (C) Bar plots showing the quantification of the data shown in (A,B). (D,E) In vivo calcium signals in response to full field stimulation recorded in layers M5 and M9/10 of Tm3 neurons. Shown are traces before (green) and after (red) PTX application in heterozygous GluClαDf/+ controls (D, n = 5 [33]/[30]), or flies only expressing the PTX-insensitive GluClαS278T allele (GluClαS278T/GluClαDf) (E, n = 5 [37]/[40]). Sample sizes are given as number of flies [number of cells in M5/M9/10]. (F) Bar plots showing the quantification of the normalized data from (D,E). (G,H,J,K) In vivo calcium signals in response to full-field flashes recorded in layer M9/10 of Mi1 (G,H) or Tm3 (J,K) neurons. Figure shows traces before (blue/green) and after (red) application of 100 µm PTX in heterozygous GluClαDf/+ controls (G, n = 5[54]; J, n = 4[73]), or flies only expressing the PTX-insensitive GluClαS278T allele (GluClαS278T/GluClαDf) (H, n = 6[78]; K, n = 5[57]). (I,L) Bar plots showing the quantification for Mi1 (I) and Tm3 (L). Sample sizes are shown as number of flies [number of cells]. All traces show mean ± SEM. *p<0.05, **p<0.01, ***p<0.001, tested with an unbalanced two-way ANOVA, corrected for multiple comparisons in (C,F,I,L).
-
Figure 6—figure supplement 1—source data 1
Table 1 contains all mean ± s.e.m.
Data related to quantifications shown in main Figure 6—figure supplement 1, sorted by genotype and experimental condition.
- https://doi.org/10.7554/eLife.49373.023
Figure 7
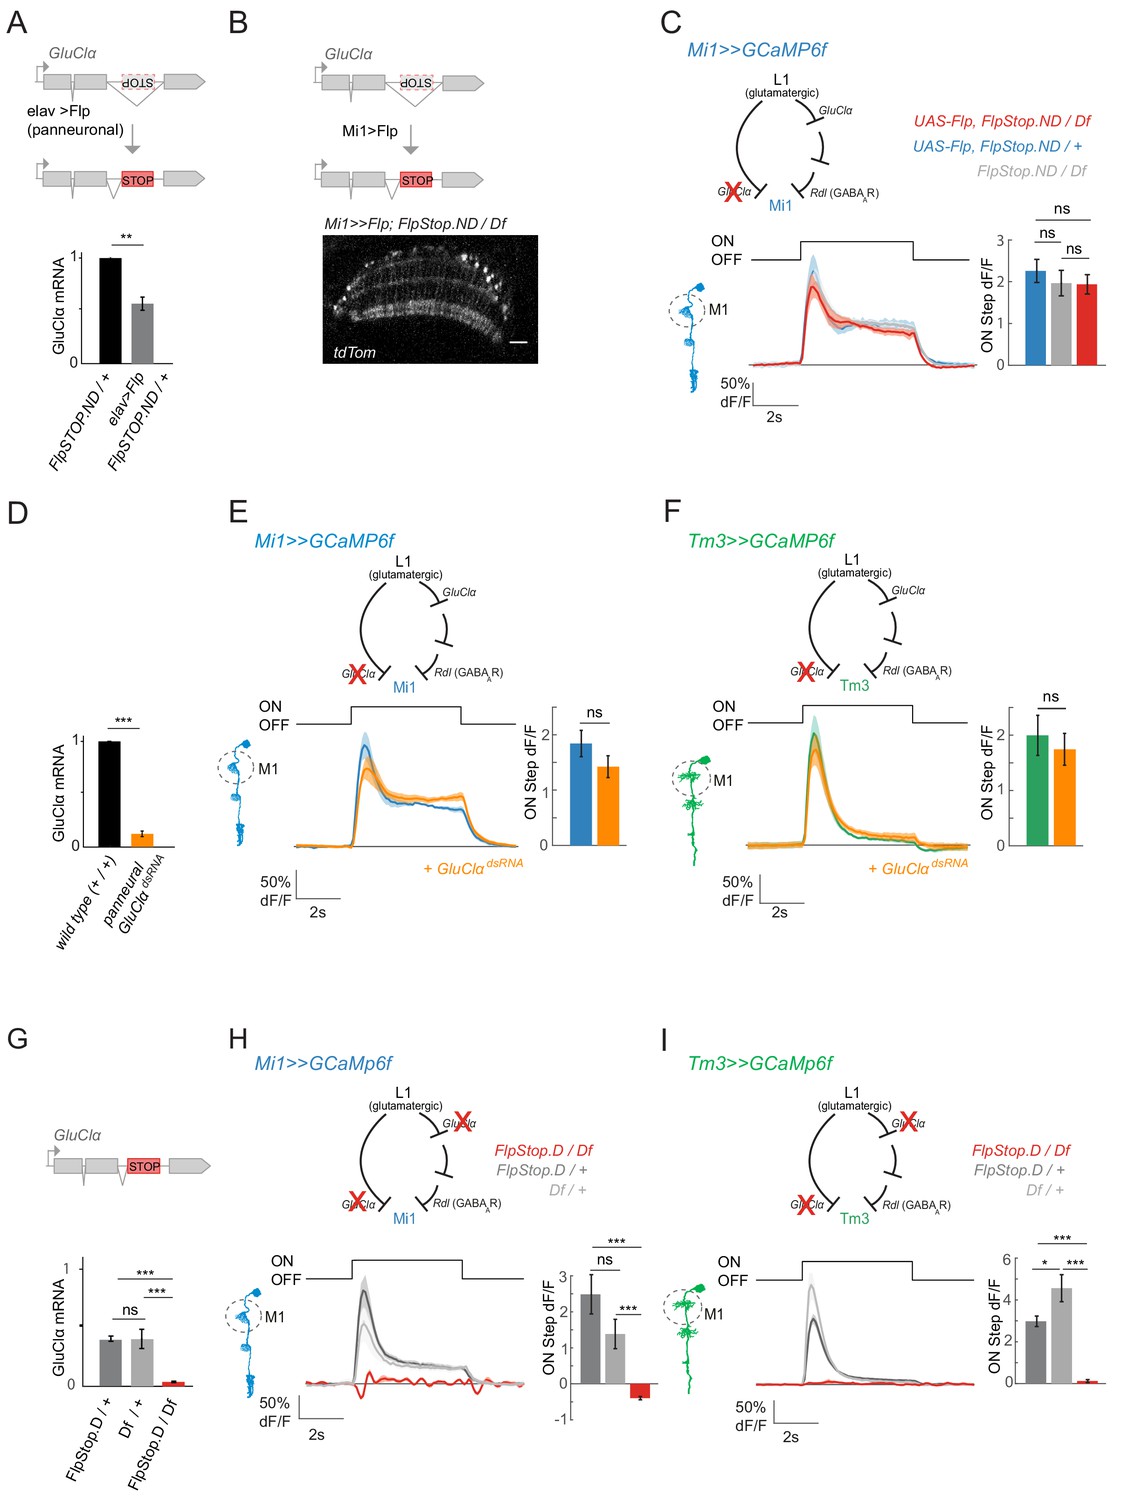
ON selectivity is a multisynaptic computation mediated by GluClα.
(A) Schematic illustrating inversion of the GluClα FlpStop exon in all neurons by panneuronal expression of Flp recombinase using elav-Gal4. qRT-PCR results show GluClα mRNA levels relative to the GAPDH housekeeping gene, normalized to controls. (B) The FlpStop exon in the non-disrupting (ND) orientation was inverted specifically in Mi1 neurons by cell-type-specific expression of Flp recombinase. This is visualized via expression of tdTom signal, and is specific to and broad in Mi1. (C) In vivo calcium signals recorded in a cell-type-specific Mi1 GluClα loss-of-function. Calcium signals were recorded in layer M1 of GluClα mutant Mi1 neurons (n = 5 (136)) (red), and heterozygous controls (n = 5[166], n = 5[139]) (blue, gray). The bar plot shows quantification of the ON step. (D) qRT PCR results quantifying pan neuronal knockdown of UAS-GluClαRNAi using elav-Gal4, normalized to control. (E,F) In vivo calcium signals upon cell-type-specific GluClα knockdown. Calcium signals in response to full-field flashes were recorded in layer M1 of (E) Mi1 control (n = 8[229]) or Mi1 >>GluClαRNAi (n = 6[215]) or of (F) Tm3 control (n = 8[150]) and Tm3 >>GluClαRNAi (n = 6[146]). Bar plot show quantification. (G) qRT PCR results quantifying GluClα mRNA levels in heterozygous GluClαFlp.Stop.D/+ and GluClαDf/+, as well as the homozygous mutant GluClαFlp.Stop.D/Df. (H,I) In vivo calcium signals recorded in a full GluClαFlpStop.D mutant background (red). Heterozygous GluClαFlpStop.D controls are in blue (Mi1, n = 5 (117)) or green (Tm3, n = 8 (275)), heterozygous Df controls are in gray (Mi1, n = 5[142]; Tm3, n = 5[198]) and the experimental condition is in red (Mi1, n = 9 [134]; Tm3, n = 5[96]). Bar plots show quantification of the ON step response. All traces show mean ± SEM. All sample sizes are shown as number of flies (number of cells). Statistics was done using an unpaired Student t test for comparison in (A,D,E,F), and a one-way ANOVA and a post-hoc unpaired t-test with Bonferroni-Holm correction for multiple comparisons in (C,G,H,I). *p<0.05, **p<0.01, ***p<0.001.
-
Figure 7—source data 1
Table 1 contains all mean ± s.e.m.
Data related to quantifications shown in main Figure 7, sorted by genotype and experimental condition.
- https://doi.org/10.7554/eLife.49373.026
Figure 8

GluClα mediates ON but not OFF direction-selective responses.
(A–D) In vivo calcium signals recorded in direction-selective T4/T5 neurons. (A,B) Schematic of T4 and T5 axon terminal innervating the four anatomical layers in the lobula plate (left). Visually evoked calcium signals recorded from all four layers in response to OFF and ON moving edges in eight different directions in heterozygous controls (A, n = 8 [62/60/59/50]) and a full GluClα mutant background, GluClαFlpStop.D/Df (B, n = 9 [69/73/70/64]). (C,D) Polar plots showing the calcium signals in response to moving ON (C) or OFF (D) edges. Genotypes are as indicated. Bar plots show the quantification of the preferred direction (PD) response and the direction selectivity index (DSI) for each layer. Sample size shows number of flies (number of cells in layers A/B/C/D) (E,F) Calcium signals in response to full-field flashes recorded in T4/T5 axon terminals in the lobula plate (E) or T4 dendrites in the medulla (F). (G,H) Bar plots show the quantification of the ON or OFF response in T4/T5 axon terminals (G) or T4 dendrites (H). Heterozygous GluClαFlpStop.D (n = 8 (225/40)) and GluClαDf (n = 8 [141/36]) controls are in gray and the GluClαFlpStop.D/Df mutant (n = 5 [198/22]) is in red in (E–H). All traces show mean ± SEM. Sample size are given as number of number of flies (number of ROIs). Statistical comparisons were done using an unpaired Student t test in (C,D), and a one-way ANOVA and a post-hoc unpaired t-test with Bonferroni-Holm correction for multiple comparisons in (G,H), ***p<0.001.
-
Figure 8—source data 1
Table 1 contains all mean ± s.e.m.
Data related to quantifications shown in main Figure 8, sorted by genotype and experimental condition.
- https://doi.org/10.7554/eLife.49373.028
Author response image 1

Extraction of PD and ND responses from T4/T5 calcium imaging data.
(A) Expression of GCaMP6f in T4/T5 neurons. ROIs are manually drawn and assigned to different lobula plate (LP) or medulla (Me) layers. (B) Single ROI responses to ON (bright background) and OFF (grey background) moving into different directions of motion. (C) Upon averaging across trials and ROIs, the preferred direction (PD) is determined as the direction of motion that was eliciting the strongest response. The null direction (ND) is set as the direction of motion that is 180° relative to the PD.
Tables
Key resources table
| Reagent type (species) or resource | Designation | Source or reference | Identifiers | Additional information |
|---|---|---|---|---|
| Strain, strain background (Drosophila melanogaster) | Mi1 >> GCaMP6f | Bloomington Drosophila Stock Center | w+; R19F01-p65ADZpattP40 / +; R71D01-ZpGdbdattP2/UAS-GCaMP6f | Figures 1, 2 and 7 Figure 2—figure supplement 1 |
| Strain, strain background (Drosophila melanogaster) | Tm3 >> GCaMP6f | Bloomington Drosophila Stock Center | w+; R38C11-p65ADZpattP40 / +; R59C10-ZpGdbdattP2/UAS- GCaMP6f | Figures 1, 2 and 7 Figure 2—figure supplement 1 |
| Strain, strain background (Drosophila melanogaster) | L1 >> GCaMP6f | Bloomington Drosophila Stock Center | w+; L1[c202]-Gal4 / +; UAS-GCaMP6f / + | Figure 1, 2 |
| Strain, strain background (Drosophila melanogaster) | Mi1 >> iGluSnFR | Bloomington Drosophila Stock Center | w+; R19F01-p65ADZpattP40 / +; R71D01-ZpGdbdattP2/UAS iGluSnFR A184A attP2 | Figure 1, Figure 2—figure supplement 3 |
| Strain, strain background (Drosophila melanogaster) | Tm3 >> iGluSnFR | Bloomington Drosophila Stock Center | w+; R38C11-p65ADZp[attP40] / +; R59C10-ZpGdbdattP2/UAS iGluSnFR A184AattP2 | Figure 1, Figure 2—figure supplement 3 |
| Strain, strain background (Drosophila melanogaster) | T4/T5 >> GCaMP6f | Bloomington Drosophila Stock Center | w+; R64G09-LexAattP40, lexAop2-IVS-GCaMP6f-p10su(Hw)attP5 / +; + / + | Figure 2, Figure 8 |
| Strain, strain background (Drosophila melanogaster) | GluClα MI02890-GFSTF.2 | Bloomington Drosophila Stock Center | y1 w*; Mi{PT-GFSTF.2} GluClα MI02890-GFSTF.2/TM6C, Sb1 Tb1 | Figure 3 |
| Antibody | Anti-GFP (chicken polyclonal) | Abcam | Cat# ab13970, RRID:AB_300798 | IF (1:2000) Figure 3, Figure 4—figure supplement 2 |
| Antibody | Anti-Bruchpilot (mouse monoclonal nc82) | DSHB | Cat# nc82, RRID:AB_2314866 | IF (1:25) Figure 3 |
| Antibody | Alexa Fluor 488-conjugates AffinityPure Goat Anti-Chicken IgG | Jackson ImmunoResearch Labs | Cat# 103-545-155, RRID:AB_2337390 | IF (1:200) Figure 3 |
| Antibody | Alexa Fluor 594-conjugates AffinityPure Goat Anti-Mouse IgG | Jackson ImmunoResearch Labs | Cat# 115-585-206, RRID:AB_2338886 | IF (1:200) Figure 3 |
| Strain, strain background (Drosophila melanogaster) | Mi1 >> GCaMP6f, Rdl1/+ control | Bloomington Drosophila Stock Center | w +; R19F01-LexAattP40, lexAop2-IVS-GCaMP6f-p10su(Hw)attP5 / +; Rdl1 / + | Figure 4, Figure 4—figure supplement 1 |
| Strain, strain background (Drosophila melanogaster) | Tm3 >> GCaMP6f, +/+ control | Bloomington Drosophila Stock Center | w +; R13E12-LexAattP40, lexAop2-IVS-GCaMP6f-p10su(Hw)attP5 / +; + / + | Figure 4, Figure 4—figure supplement 1 |
| Strain, strain background (Drosophila melanogaster) | Mi1 >> GCaMP6f, Rdl1/RdlMDMD-RR * | Bloomington Drosophila Stock Center | w +; R19F01-LexAattP40, lexAop2-IVS-GCaMP6f-p10su(Hw)attP5 / +; Rdl1/RdlMDMD-RR | Figure 4, Figure 4—figure supplement 1 |
| Strain, strain background (Drosophila melanogaster) | Tm3 >> GCaMP6f,RdlMD-RR/RdlMDMD-RR * | Bloomington Drosophila Stock Center | w +; R13E12-LexAattP40, lexAop2-IVS-GCaMP6f-p10su(Hw)attP5 / +; RdlMD-RR/RdlMDMD-RR | Figure 4, Figure 4—figure supplement 1 |
| Strain, strain background (Drosophila melanogaster) | C2,C3 >> GFP | Bloomington Drosophila Stock Center | w+/UAS-CD8::GFP; R20C11 -p65ADZpattP40/UAS-2xEGFP; R48D11-ZpGdbdattP2/+ | Figure 4—figure supplement 2 |
| Strain, strain background (Drosophila melanogaster) | L1 >> GFP | Bloomington Drosophila Stock Center | w+/UAS-CD8::GFP; L1[c202]-Gal4/UAS-2xEGFP; + / + | Figure 4—figure supplement 2 |
| Antibody | Anti-GABA (rabbit polyclonal) | Sigma-Aldrich | Cat# A2052, RRID:AB_477652 | IF (1:200) Figure 4—figure supplement 2 |
| Antibody | Alexa Fluor 594-conjugates AffiniPure Goat Anti-Rabbit IgG | Jackson ImmunoResearch Labs | Cat# 111-585-003, RRID:AB_2338059 | IF (1:200) Figure 6 |
| Strain, strain background (Drosophila melanogaster) | Mi1 >> GCaMP6f, GluClαDf/+ control | Bloomington Drosophila Stock Center | w +; R19F01-LexAattP40, lexAop2-IVS-GCaMP6f-p10su(Hw)attP5 / +; Df(3R)ED6025/ + | Figure 6, Figure 6—figure supplement 1 |
| Strain, strain background (Drosophila melanogaster) | Tm3 >> GCaMP6f, GluClαDf/+ control | Bloomington Drosophila Stock Center | w +; R13E12-LexAattP40, lexAop2-IVS-GCaMP6f-p10su(Hw)attP5 / +; Df(3R)ED6025/ + | Figure 6, Figure 6—figure supplement 1 |
| Strain, strain background (Drosophila melanogaster) | Mi1 >> GCaMP6f, GluClαS278T/GluClαDf | This paper | w +; R19F01-LexAattP40, lexAop2-IVS-GCaMP6f-p10su(Hw)attP5 / +; Df(3R)ED6025/GluClαS278T | Figure 6, Figure 6—figure supplement 1 More information in the Materials and methods section under ‘Molecular biology’ |
| Strain, strain background (Drosophila melanogaster) | Tm3 >> GCaMP6f, GluClαS278T/GluClαDf | This paper | w +; R13E12-LexAattP40, lexAop2-IVS-GCaMP6f-p10su(Hw)attP5 / +; ; Df(3R)ED6025/GluClαS278T | Figure 6, Figure 6—figure supplement 1 More information in the Materials and methods section under ‘Molecular biology’ |
| Strain, strain background (Drosophila melanogaster) | T4/T5 >> GCaMP6f, GluClαDf/+ control | Bloomington Drosophila Stock Center | w+; R64G09-LexAattP40, lexAop2-IVS-GCaMP6f-p10su(Hw)attP5 / +; ; Df(3R)ED6025 / + | Figure 6, Figure 6—figure supplement 1 |
| Strain, strain background (Drosophila melanogaster) | T4/T5 >> GCaMP6f, GluClαS278T/GluClαDf | This paper | w+; R64G09-LexAattP40, lexAop2-IVS-GCaMP6f-p10su(Hw)attP5 / + ; Df(3R)ED6025/GluClαS278T CRISPR | Figure 6, Figure 6—figure supplement 1 More information in the Materials and methods section under ‘Molecular biology’ |
| Strain, strain background (Drosophila melanogaster) | Mi1 >> Flp,GCaMP6f; GluClαFlpStop.ND/GluClαDf | This paper | w+; R19F01-p65ADZpattP40/UAS-GCaMP6f, UAS-Flp; R71D01-ZpGdbdattP2, GluClαDf/GluClαFlpStop.ND | Figure 7 More information in the Materials and methods section under ‘Generation of transgenic lines’ |
| Strain, strain background (Drosophila melanogaster) | Mi1 >> Flp,GCaMP6f; GluClαFlpStop.ND / +(Heterozygous control) | This paper | w+; R19F01-p65ADZpattP40/UAS-GCaMP6f, UAS-Flp; R71D01-ZpGdbdattP2/GluClαFlpStop.ND | Figure 7 More information in the Materials and methods section under‘Generation of transgenic lines’ |
| Strain, strain background (Drosophila melanogaster) | Mi1 >> GCaMP6f; GluClαFlpStop.ND/GluClαDf(No Flp control) | This paper | w+; R19F01-p65ADZpattP40/UAS-GCaMP6f; R71D01-ZpGdbdattP2, GluClαDf / ; GluClαFlpStop.ND | Figure 7 More information in the Materials and methods section under‘Generation of transgenic lines’ |
| Strain, strain background (Drosophila melanogaster) | Mi1 >> GCaMP6f, GluClαdsRNA | Bloomington Drosophila Stock Center | w+; R19F01-p65ADZpattP40/P{y[+t7.7] v[+t1.8]=TRiP.HMC03585}attP40; R71D01-ZpGdbdattP2/UAS-GCaMP6f | Figure 7 |
| Strain, strain background (Drosophila melanogaster) | Tm3 >> GCaMP6f, GluClαdsRNA | Bloomington Drosophila Stock Center | w+; R38C11-p65ADZpattP40/P{y[+t7.7] v[+t1.8]=TRiP.HMC03585}attP40; R59C10-ZpGdbdattP2/UAS-GCaMP6f | Figure 7 |
| Strain, strain background (Drosophila melanogaster) | Mi1 >> GCaMP6f, GluClαFlpStop.D / + | This paper | w +; R19F01-LexAattP40, lexAop2-IVS-GCaMP6f-p10su(Hw)attP5 / +; GluClαFlpStop.D / + | Figure 7 More information in the Materials and methods section under‘Generation of transgenic lines’ |
| Strain, strain background (Drosophila melanogaster) | Mi1 >> GCaMP6f, GluClαDf / + | Bloomington Drosophila Stock Center | w +; R19F01-LexAattP40, lexAop2-IVS-GCaMP6f-p10su(Hw)attP5 / +; ; Df(3R)ED6025/GluClαWT | Figure 7 |
| Strain, strain background (Drosophila melanogaster) | Mi1 >> GCaMP6f, GluClαFlpStop.D/GluClαDf ** | This paper | w +; R19F01-LexA}attP40, lexAop2-IVS-GCaMP6f-p10su(Hw)attP5 / +; ; Df(3R)ED6025/GluClαFlpStop.D | Figure 7 More information in the Materials and methods section under‘Generation of transgenic lines’ |
| Strain, strain background (Drosophila melanogaster) | Tm3 >> GCaMP6f, GluClαFlpStop.D / + | This paper | w +; R13E12-LexAattP40, lexAop2-IVS-GCaMP6f-p10su(Hw)attP5 / +; GluClαFlpStop.D / +T | Figure 7 More information in the Materials and methods section under‘Generation of transgenic lines’ |
| Strain, strain background (Drosophila melanogaster) | Tm3 >> GCaMP6f, GluClαDf / + | Bloomington Drosophila Stock Center | w +; R13E12-lexA}attP40, lexAop2-IVS-GCaMP6f-p10su(Hw)attP5 / +; ; Df(3R)ED6025/ + | Figure 7 |
| Strain, strain background (Drosophila melanogaster) | Tm3 >> GCaMP6f, GluClαFlpStop.D/GluClαDf ** | This paper | w +; R13E12-LexAattP40, lexAop2-IVS-GCaMP6f-p10su(Hw)attP5 / +; ; Df(3R)ED6025/GluClαFlpStop.D | Figure 7 More information in the Materials and methods section under‘Generation of transgenic lines’ |
| Strain, strain background (Drosophila melanogaster) | T4/T5 >> GCaMP6f, GluClαFlpStop.D / + | This paper | w+; R64G09-LexAattP40, lexAop2-IVS-GCaMP6f-p10su(Hw)attP5 / +; GluClαFlpStop.D / + | Figure 8 More information in the Materials and methods section under ‘Generation of transgenic lines’ |
| Strain, strain background (Drosophila melanogaster) | T4/T5 >> GCaMP6f, GluClαDf / + | Bloomington Drosophila Stock Center | w+; R64G09-LexAattP40, lexAop2-IVS-GCaMP6f-p10su(Hw)attP5 / +; ; Df(3R)ED6025/ + | Figure 8 |
| Strain, strain background (Drosophila melanogaster) | T4/T5 >> GCaMP6f, GluClαFlpStop.D/GluClαDf ** | This paper | w+; R64G09-LexAattP40, lexAop2-IVS-GCaMP6f-p10su(Hw)attP5 / +; ; Df(3R)ED6025/GluClαFlpStop.D | Figure 8 More information in the Materials and methods section under ‘Generation of transgenic lines’ |
| Chemical compound, drug | Picrotoxin | Sigma Aldrich | P1675_SIGMA | Figures 2, 4, 5 and 6 Figure 2—figure supplements 2 and 3, Figure 4—figure supplement 1, Figure 6—figure supplement 1 |
| Chemical compound, drug | MPEP | Abcam | Ab120008 | Figure 2—figure supplement 1 |
| Sequence-based reagent | GluCla_forward | This paper | ACCAAACTGCTGCAAGAC | qRT-PCR Figure 7 More information in the Materials and methods section under ‘Molecular biology’ |
| Sequence-based reagent | GluCla_reverse | This paper | GATATGTGCTCCAGTAGACC | qRT-PCR Figure 7 More information in the Materials and methods section under ‘Molecular biology’ |
| Sequence-based reagent | GAPDH2_forward | This paper | GATGAGGAGGTCGTTTCTAC | qRT-PCR Figure 7 More information in the Materials and methods section under ‘Molecular biology’ |
| Sequence-based reagent | GAPDH2_reverse | This paper | GTACTTGATCAGGTCGATG | qRT-PCR Figure 7 More information in the Materials and methods section under ‘Molecular biology’ |
| Software, algorithm | MATLAB R2017a | The MathWorks Inc.50 Natick, MA | Custom scripts | Codes are available in the Source code 1 |
-
*We used different allelic combinations for the RdlMDRR insensitive allele when imaging Mi1 (RdlMD-RR/Rdl1) or Tm3 (RdlMD-RR/RdlMDMD-RR). While the use of the Rdl1 null mutant is genetically cleaner, application of low concentrations of PTX has weaker phenotypes in genetic backgrounds carrying the Rdl1 allele than in wild type, possibly due to homeostatic mechanisms (Figure 2A,B, Figure 4A). The 2.5 µM PTX phenotype was even weaker in Tm3, and did not leave a margin to look for rescue by RdlMDRR, which is why we instead used two copies of the RdlMDRR allele, which has a PTX phenotype similar to wild type in heterozygosity.
**GluClαFlpStop.D/Df mutant larvae failed to crawl out of the food, but adult flies could be obtained after saving pupae from the food.
Additional files
-
Source code 1
Data analysis and statistics.
- https://doi.org/10.7554/eLife.49373.029
-
Transparent reporting form
- https://doi.org/10.7554/eLife.49373.030
Download links
A two-part list of links to download the article, or parts of the article, in various formats.
Downloads (link to download the article as PDF)
Open citations (links to open the citations from this article in various online reference manager services)
Cite this article (links to download the citations from this article in formats compatible with various reference manager tools)
ON selectivity in the Drosophila visual system is a multisynaptic process involving both glutamatergic and GABAergic inhibition
eLife 8:e49373.
https://doi.org/10.7554/eLife.49373


