Inhibition of IRF4 in dendritic cells by PRR-independent and -dependent signals inhibit Th2 and promote Th17 responses
- University of California San Diego, United States
- The Second Affiliated Hospital of Guangzhou Medical University (GMU), The State Key Laboratory of Respiratory Disease, Guangdong Provincial Key Laboratory of Allergy & Clinical Immunology, China
- Center for Immunology, Inflammation and Immune-mediated disease, GMU, China
- Dankook University College of Medicine, Republic of Korea
- Alicante Institute for Health and Biomedical Research (ISABIAL - FISABIO), Spain
- Institute of Health Carlos III, Spain
- University of Tübingen, Germany
- Boston University School of Medicine, United States
- VA Boston Healthcare System, United States
- University of California, Davis, United States
- VA San Diego Healthcare System, United States
Figures
Figure 1 with 4 supplements
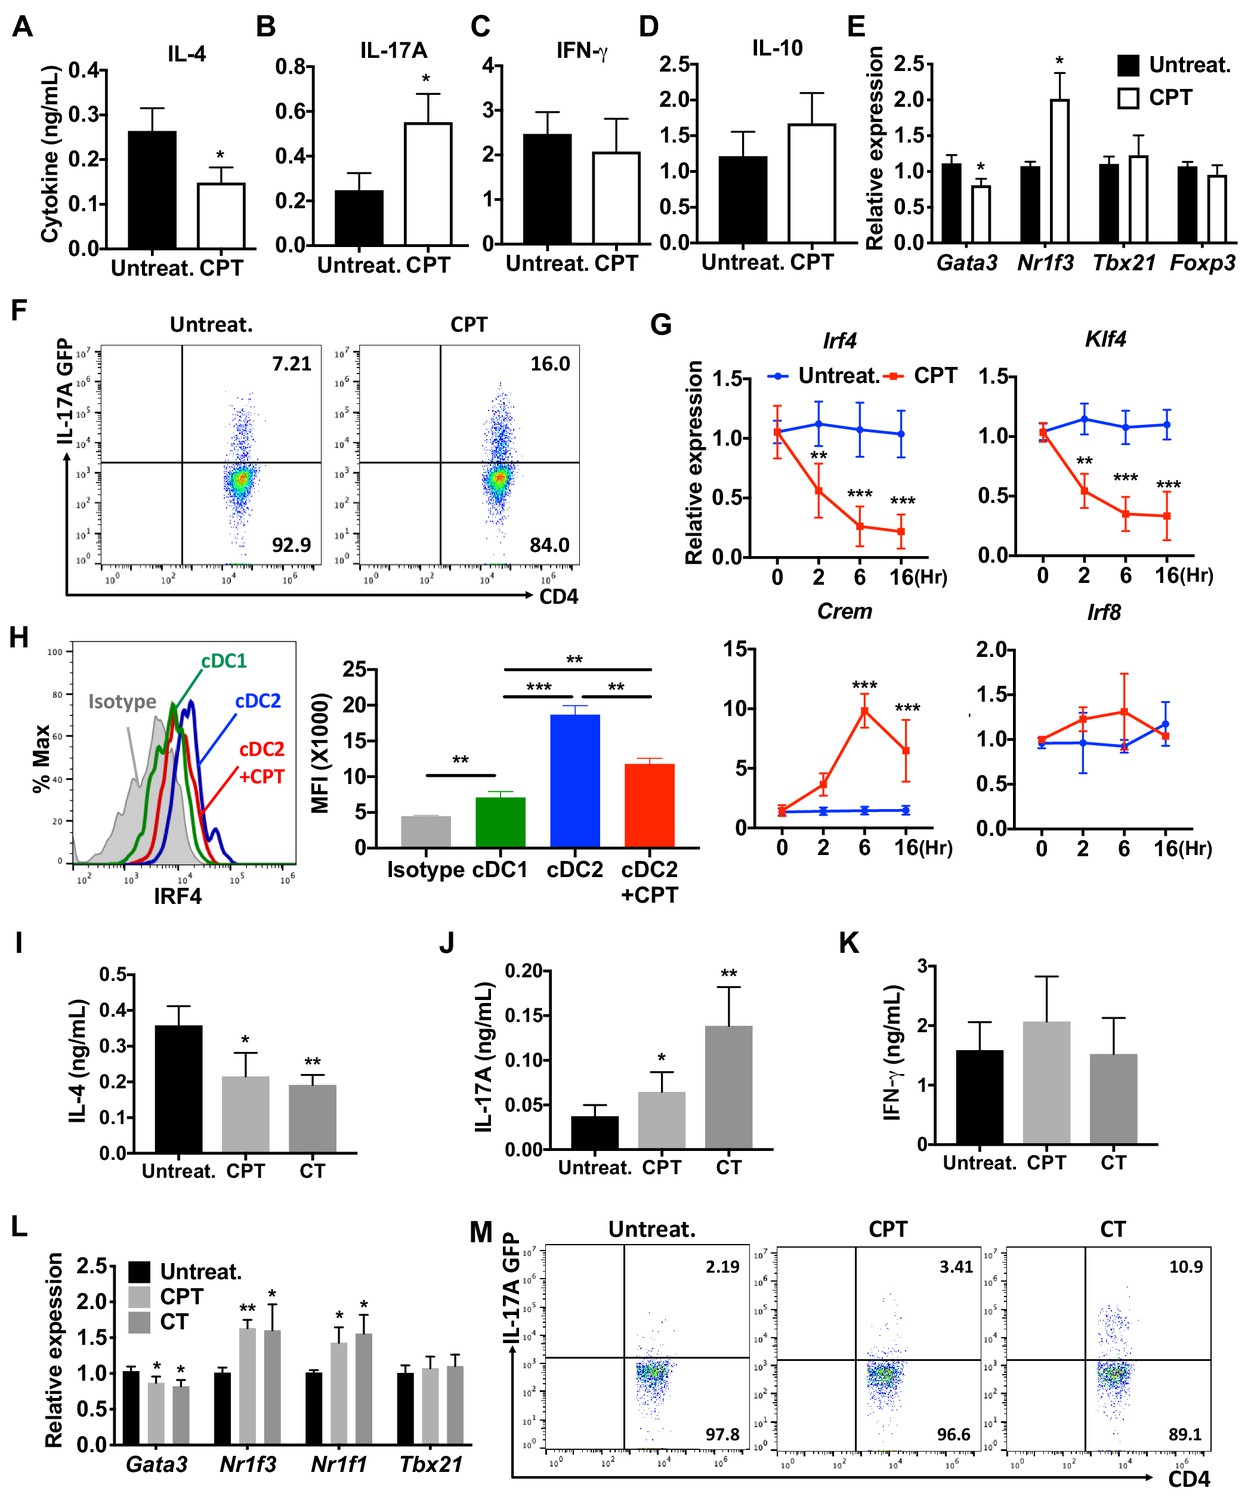
cAMP signaling switches cDC2s to a pro-Th17 bias.
(A–D) IL-4, IL-17A, IFN-γ and IL-10 levels from anti-CD3/28 Ab-stimulated OT-II cells co-cultured with WT splenic cDC2s (CD11c+CD11b+CD8α-) pretreated with or without CPT. (E) qPCR analysis of lineage commitment factors in OT-II T cells co-cultured with WT cDC2s in the presence of CPT. (F) GFP expression from IL-17GFP OT-II CD4+ T cells co-cultured with WT cDC2s pretreated with or without CPT. (G) qPCR of TFs in WT cDC2s treated with CPT (50 μM). Two-way ANOVA with Sidak’s multiple comparisons test; n = 3 in each group, **p<0.01, ***p<0.001. Effect of CPT treatment; Irf4 (p=0.002), Klf4 (p<0.001) and Crem (p<0.001). (H) Intracellular staining of IRF4 in WT cDC1 and cDC2s treated with or without CPT for 48 hr. (I–M) Fate mapping: IL-17GFP OT-II CD4+ T cells were co-cultured with GnasΔCD11c BM-APCs to generate memory Th2 cells (1st co-culture). From the 1st co-culture, T1/ST2+ cells were FACS sorted and then used for co-culture with WT cDC2s pretreated with or without CPT or Cholera toxin (CT) (2nd co-culture). (I) IL-4, (J) IL-17A and (K) IFN-γ levels, (L) qPCR of lineage commitment factors, and (M) GFP signal for IL-17 expression in the re-stimulated CD4+ T cells from 2nd co-culture. Data are representative of three independent experiments; *p<0.05, **p<0.01, ***p<0.001.
Figure 1—figure supplement 1
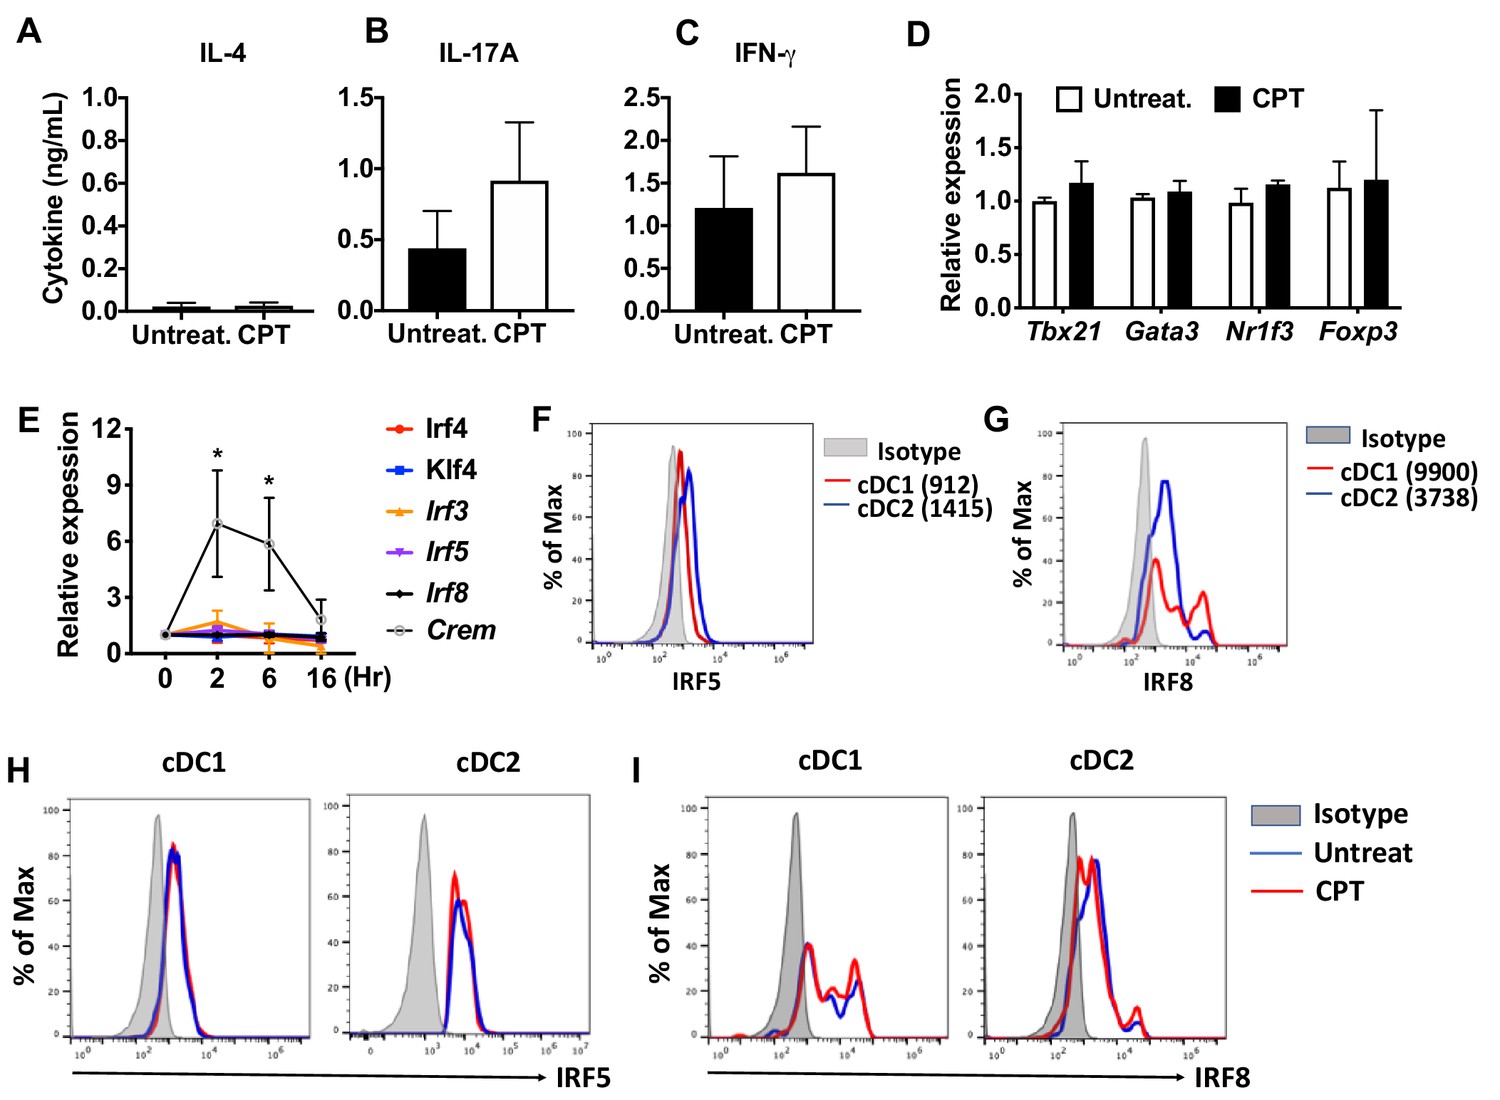
cAMP signaling in cDC1s does not affect the expression of IRF and subsequent T cell differentiation.
(A–C) IL-4, IL-17A and IFN-γ levels from anti-CD3/28 Ab-stimulated OT-II cells co-cultured with cDC1s (CD11c+CD11b-CD8α+) cells from WT mice pretreated with or without CPT. (D) qPCR analysis of lineage commitment factors in OT-II cells co-cultured with WT cDC1s in the presence of CPT. (E) Relative expression of TFs in WT cDC1s treated with CPT for indicated time. (F) IRF5 and (G) IRF8 expression in WT cDC1s and cDC2s. (H) IRF5 and (I) IRF8 expression in cDC1s and cDC2s after CPT treatment for 48 hr. Data are representative of three independent experiments; *p<0.05.
Figure 1—figure supplement 2
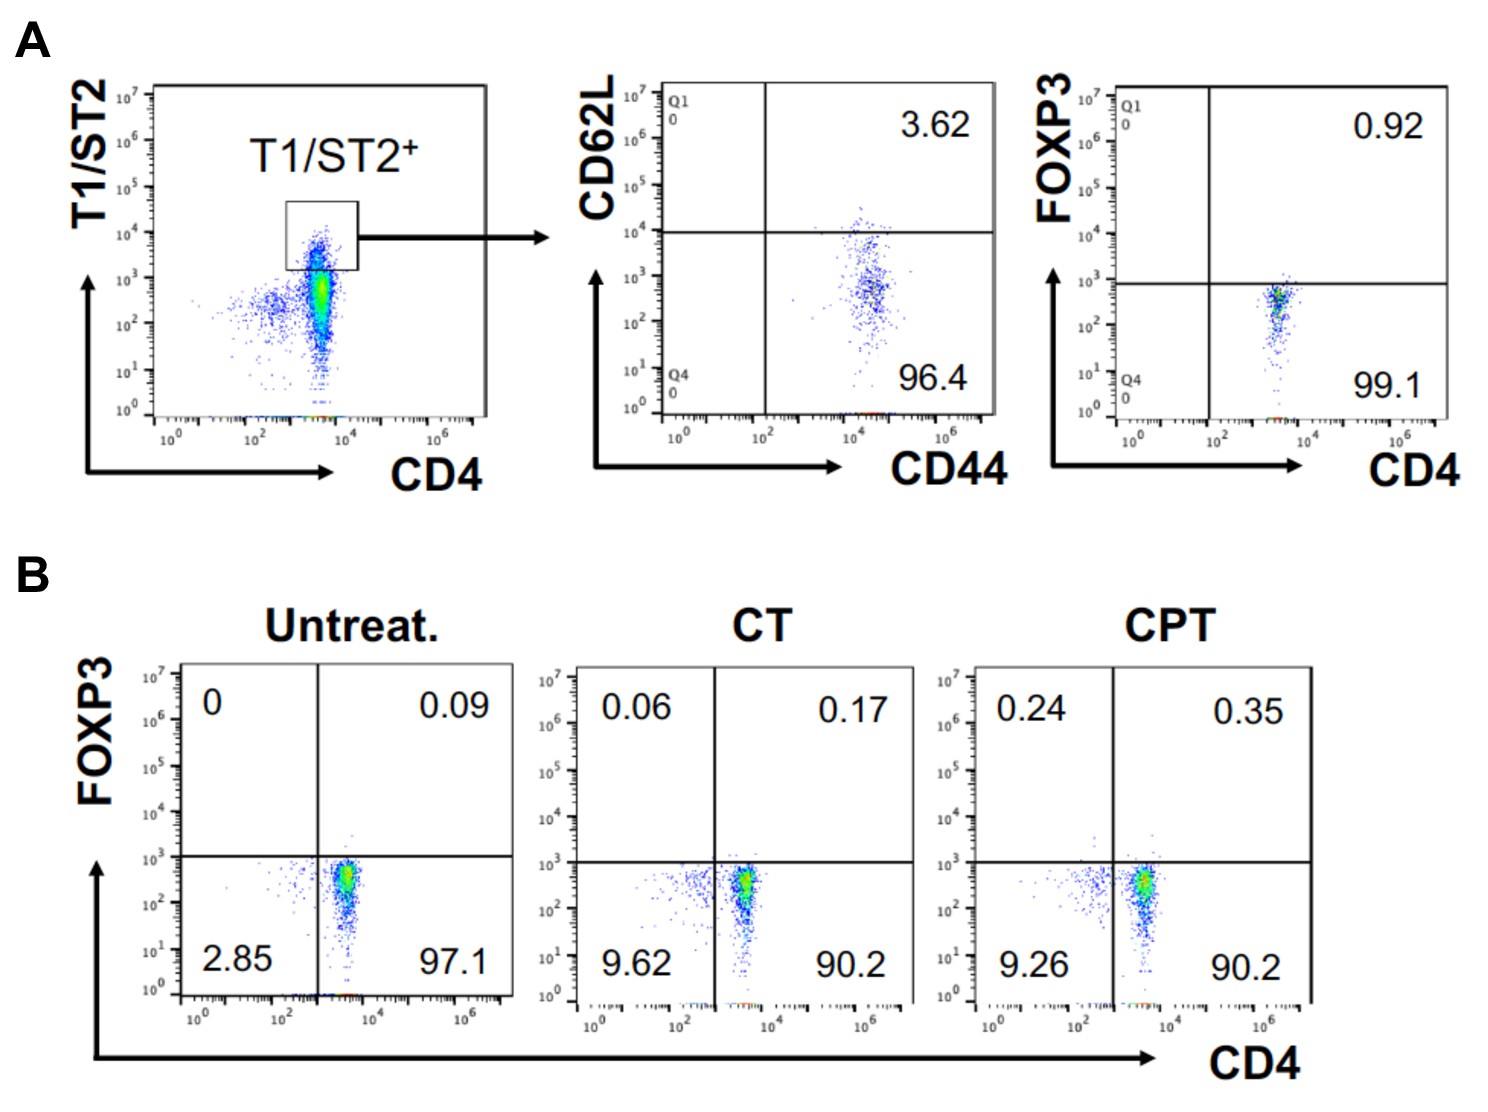
FOXP3 expression in T1/ST2+ cells OT-II CD4+ T cells were co-cultured with GnasΔCD11c BM-APCs to generate memory Th2 cells (1 st co-culture).
From the 1 st co-culture, T1/ST2+ cells were FACS sorted and then used for co-culture with WT cDC2s pretreated with or without CPT or Cholera toxin (CT) (2nd co-culture). (A) Memory T cell marker and FOXP3 were analyzed in the 1 st co-cultured T cells. (B) FOXP3 were analyzed in the 2nd co-cultured T cells.
Figure 1—figure supplement 3
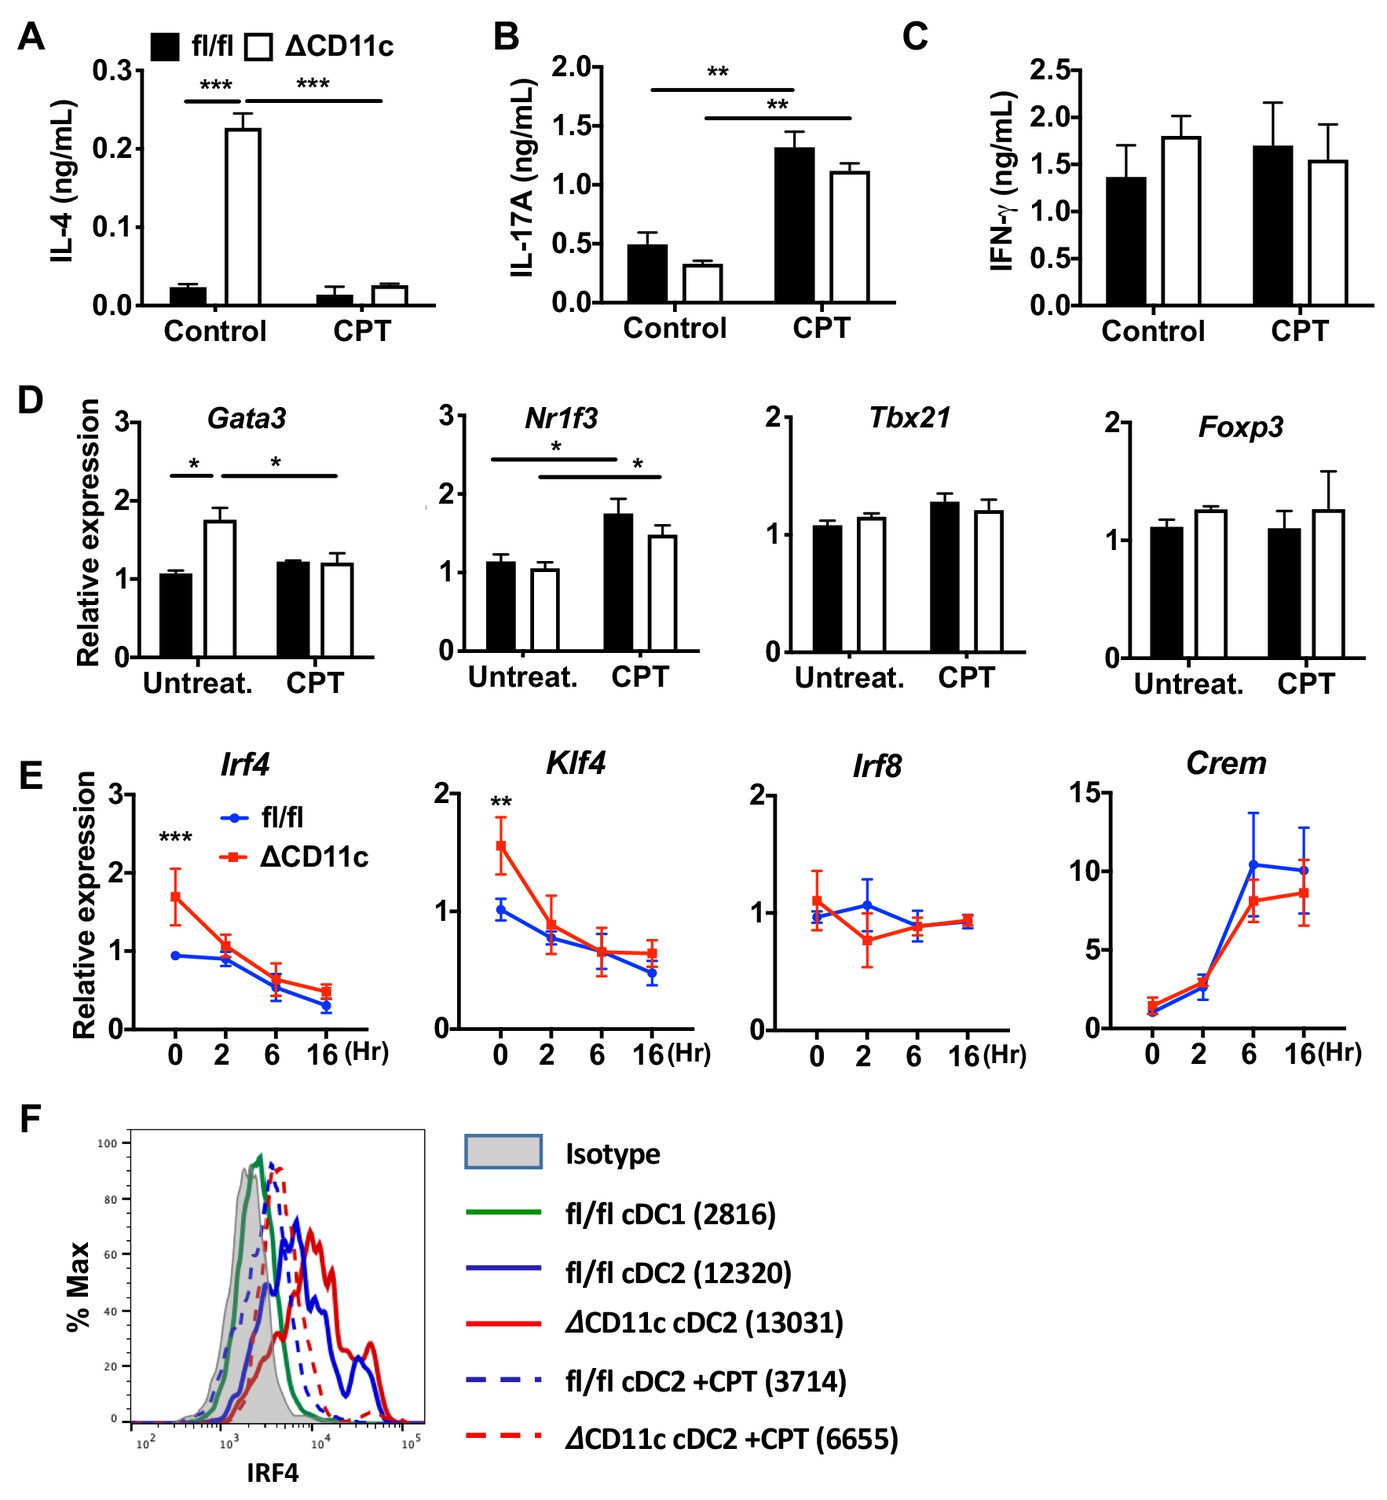
cAMP signaling switches a pro-Th2 GnasΔCD11c to a pro-Th17 phenotype.
(A–C) IL-4, IL-17A and IFN-γ levels from anti-CD3/28 Ab-stimulated OT-II cells co-cultured with splenic cDC2s from Gnasfl/fl and GnasΔCD11c mice treated in the absence or presence of CPT. (D) qPCR analysis of lineage commitment factors in the isolated OT-II cells co-cultured with Gnasfl/fl or GnasΔCD11c cDC2s. (E) qPCR of TFs in CPT-treated Gnasfl/fl or GnasΔCD11c cDC2s. Two-way ANOVA with Sidak’s multiple comparisons test; **p<0.01, ***p<0.001. Effect of CPT treatment; Irf4 (p<0.001), Klf4 (p<0.001) and Crem (p<0.001). Effect of strain: Irf4 (p<0.001). (F) Intracellular staining (FACS) of IRF4 in untreated and CPT-treated Gnasfl/fl and GnasΔCD11c cDC2s for 48 hr. Data are representative of three independent experiments; *p<0.05, **p<0.01, ***p<0.001.
Figure 1—figure supplement 4
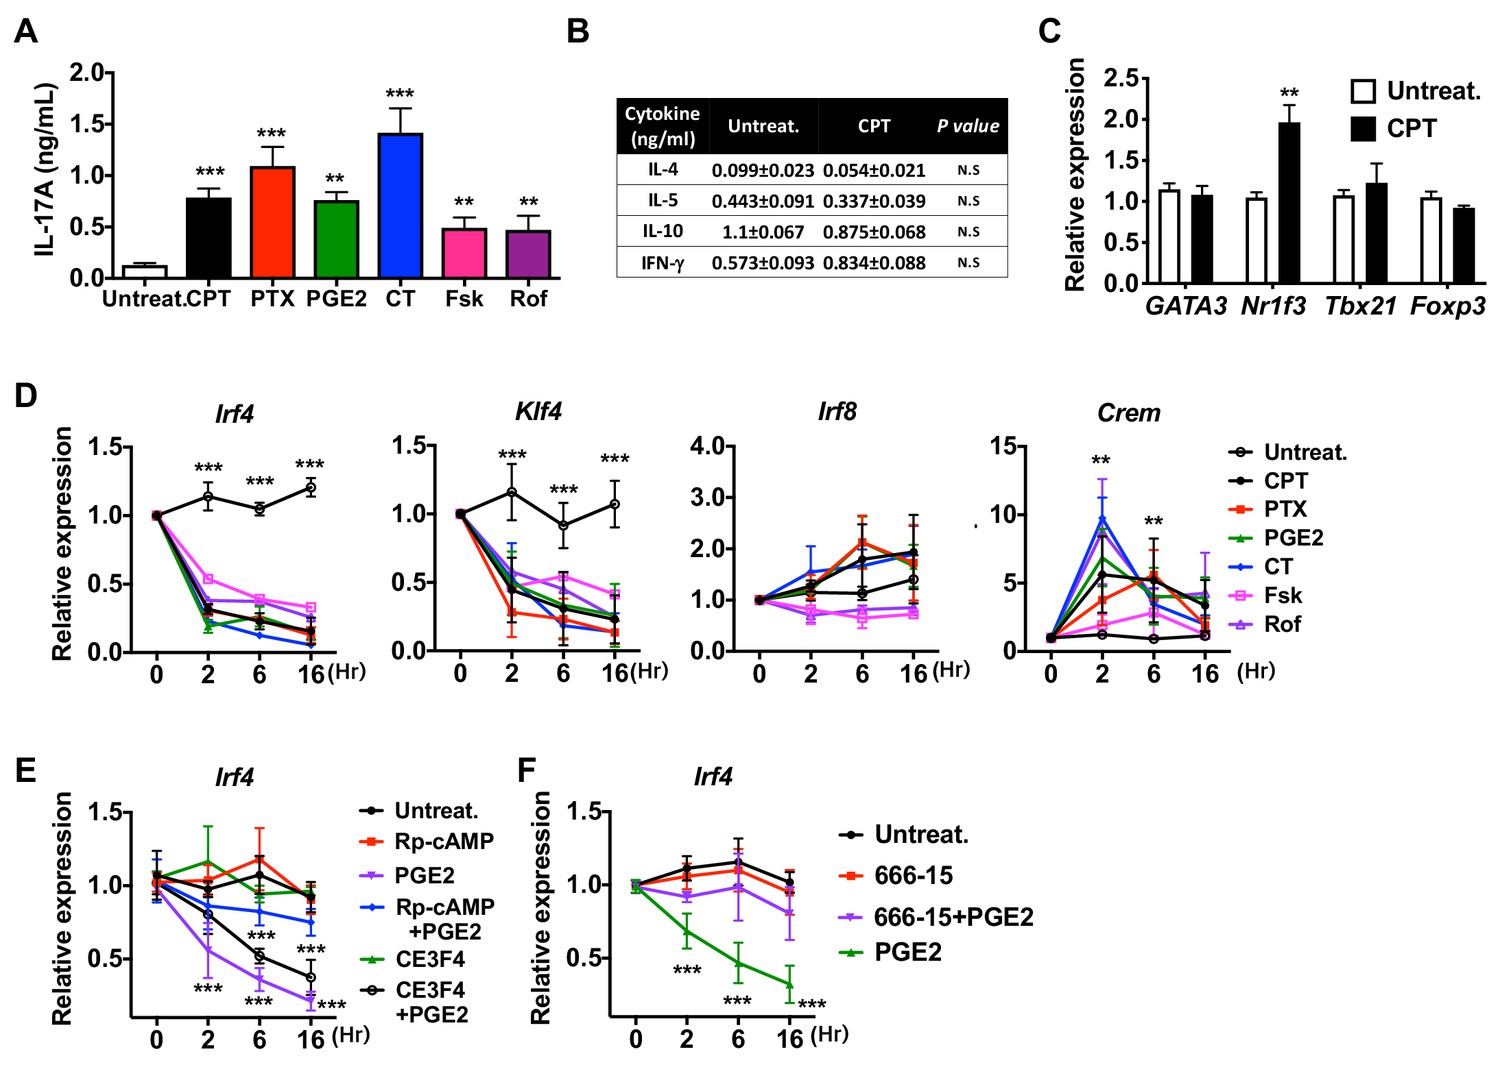
Induction of pro-Th17 BM-APCs and altered transcriptional program by cAMP agonists.
(A) IL-17A levels from anti-CD3/28 Ab-stimulated OT-II cells co-cultured with BM-APCs from WT mice treated with various cAMP agonists: CPT (50 μM), pertussis toxin (PTX, which inhibits Gαi, 100 ng/ml), prostaglandin E2 (PGE2, 1 μM), cholera toxin (CT, an activator of Gαs, 1 μg/ml), forskolin (Fsk, an activator of AC, 10 μM), rolipram (Rol, PDE4 inhibitor, 10 μM). (B) Levels of the indicated cytokines and (C) mRNA expression of lineage commitment factors in OT-II cells co-cultured with WT BM-APCs treated with CPT. (D) QPCR of TFs in the WT BM-APCs treated with the indicated cAMP agonists. Two-way ANOVA with Sidak’s multiple comparisons test; n = 3 in each group, different from untreated in the CPT-treated group; *p<0.05, **p<0.01, ***p<0.001. Effect of treatment; Irf4 (p<0.001), Klf4 (p<0.001), Irf8 (p<0.001) and Crem (p<0.001). (E, F) qPCR of Irf4 in the WT BM-APCs treated with PGE2 in the presence of inhibitors of PKA (Rp-cAMP, 50 μM), EPAC (CE3F5, 50 μM), or CREB (666–15, 1 μM). Two-way ANOVA with Sidak’s multiple comparisons test; n = 3 in each group, different from untreated; ***p<0.001. Data are representative of three independent experiments.
Figure 2
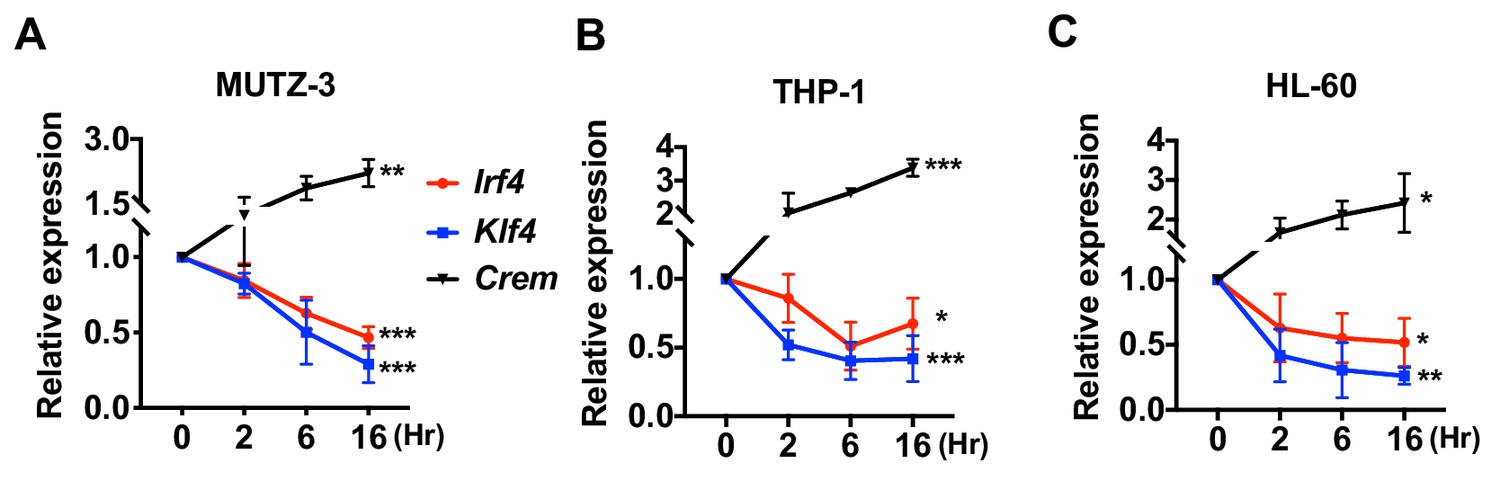
Decreased expression of Irf4 by CPT in human DC-like cells DC-like cells were differentiated from (A) MUTZ-3, (B) THP-1, and (C) HL-60 cell lines and treated with CPT for the indicated time.
Relative expression of Irf4, Klf4, and Crem were analyzed. Data are representative of three independent experiments; Two-way ANOVA *p<0.05, **p<0.01, ***p<0.001.
Figure 3 with 1 supplement
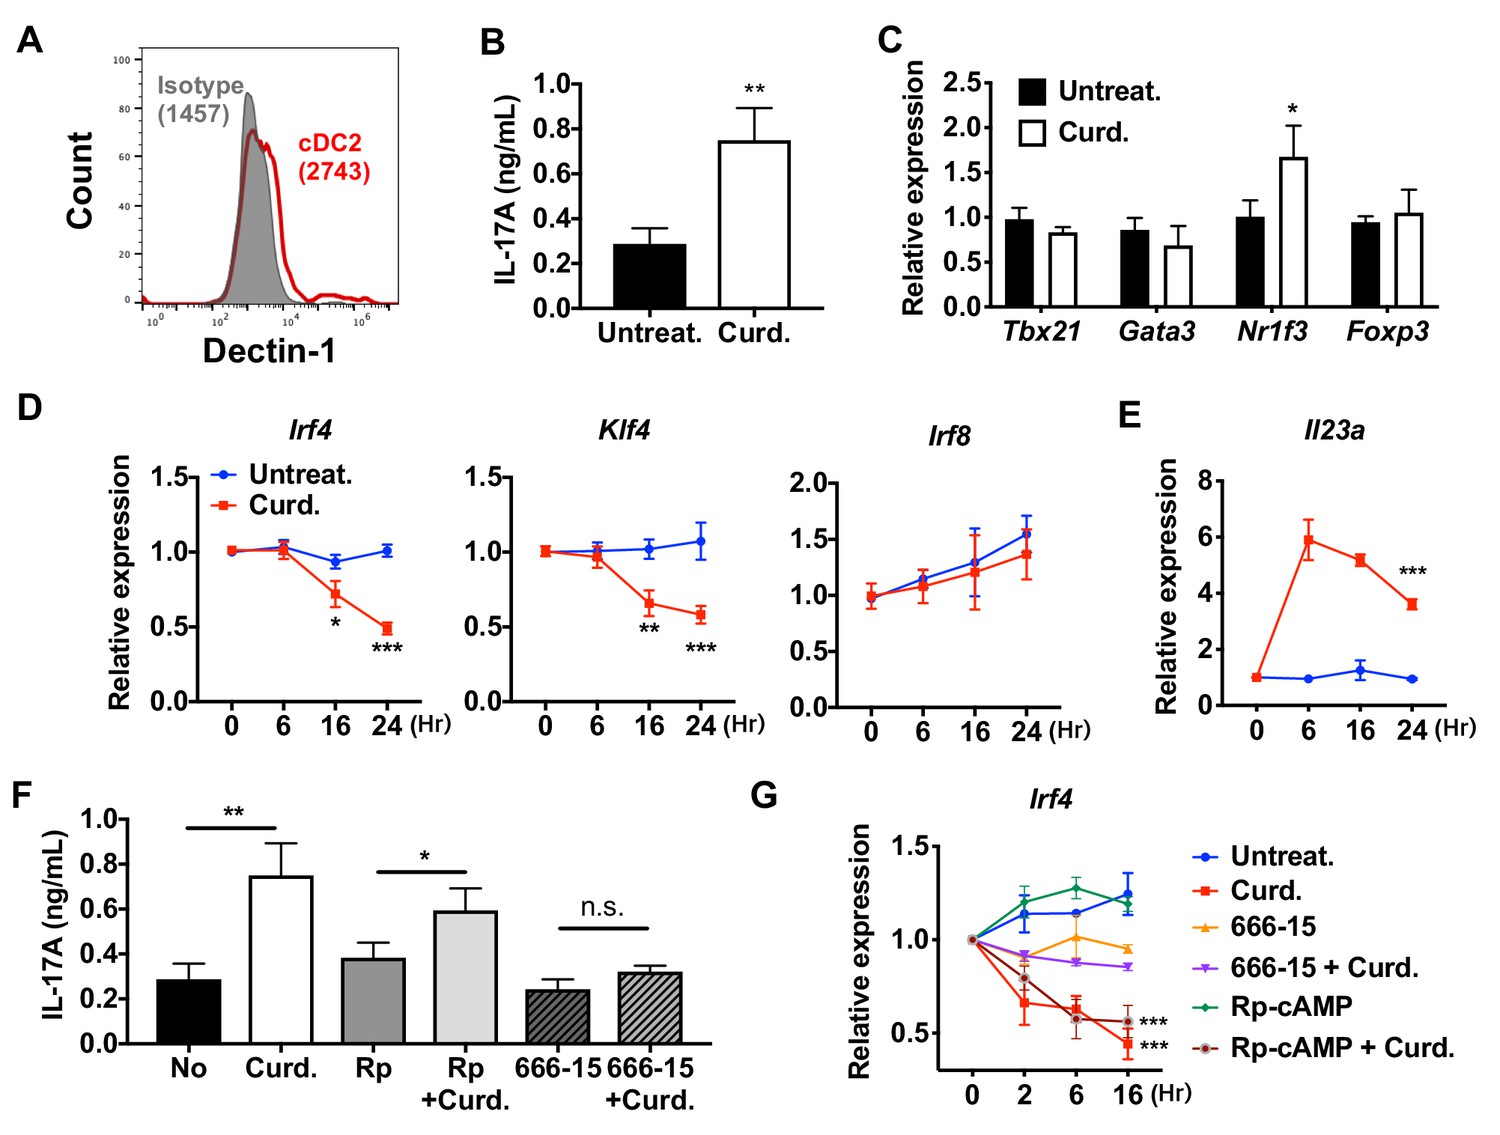
Stimulation of DCs via Dectin-1 (a PPR) regulates IRF4 and KLF4 expression, and induce Th17 differentiation.
(A) Expression of Dectin-1 on WT cDC2s. Numbers indicate mean fluorescence intensity (GeoMFI). (B) IL-17A levels produced by OT-II cells co-cultured with WT splenic cDC2s treated with or without curdlan (10 μg/ml). (C) qPCR of lineage commitment factors in OT-II cells co-cultured with curdlan-treated and untreated WT cDC2s. qPCR of (D) TFs and (E) IL-23 in the WT cDC2s treated with curdlan for the indicated time points. Two-way ANOVA; n = 3 in each group. (F) IL-17A levels produced by OT-II cells co-cultured with WT BM-APC pre-treated with Rp-cAMP (50 μM), or 666–15 (1 μM) 16 hr prior to curdlan treatment. (G) qPCR of Irf4 in WT cDC2s treated with or without curdlan in the presence of inhibitors of CREB (666–15, 1 μM) or PKA (Rp-cAMP, 50 μM). Two-way ANOVA; n = 3 in each group. Data are representative of three independent experiments; *p<0.05, **p<0.01, ***p<0.001.
Figure 3—figure supplement 1
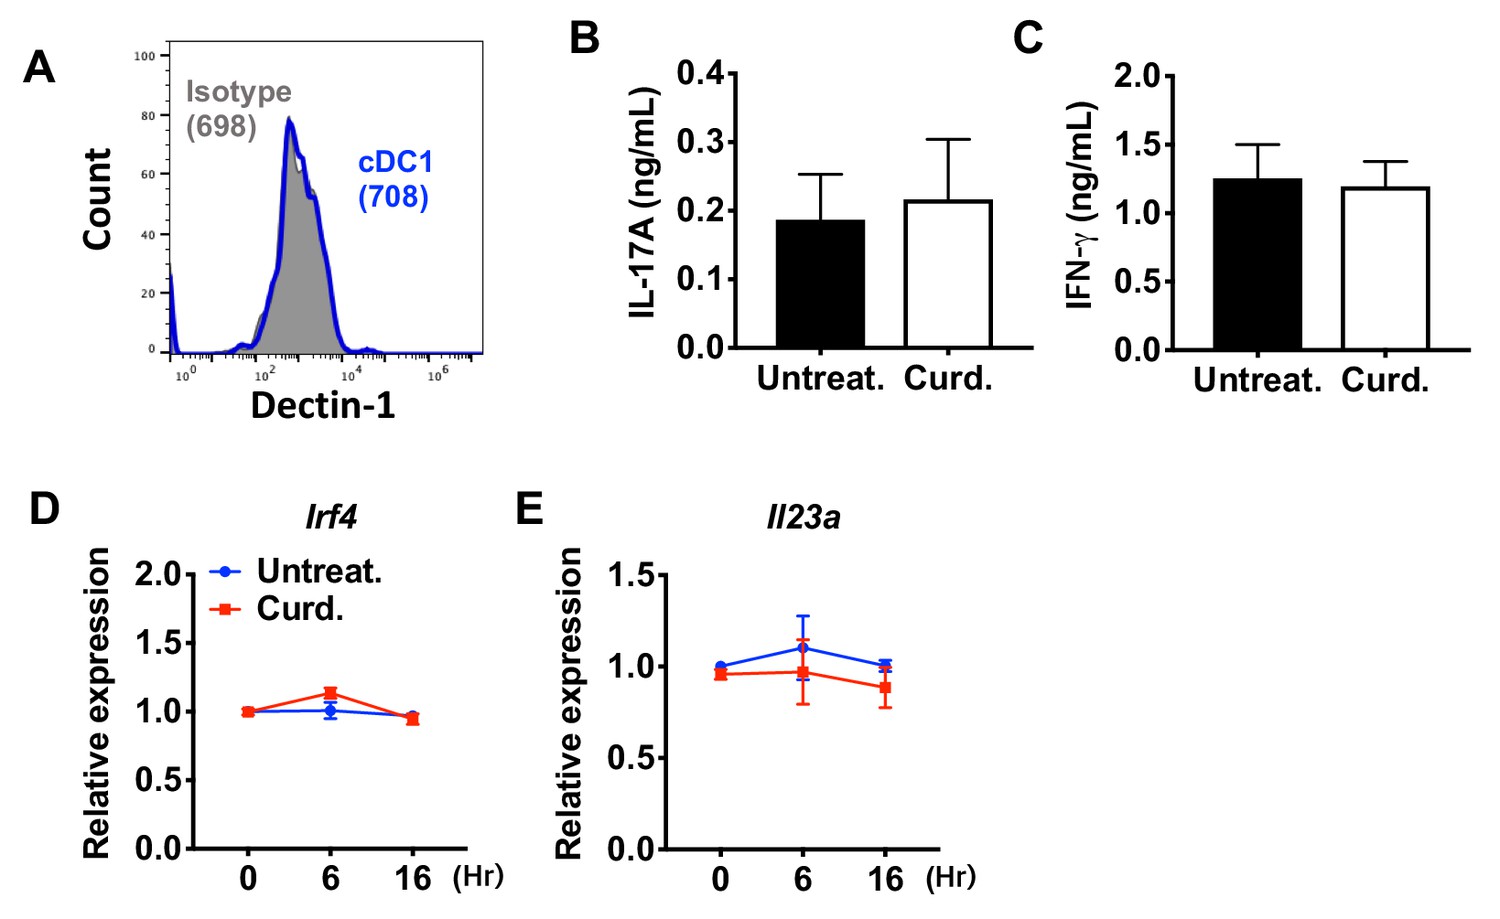
Curdlan does not affect the expression of Irf4 and subsequent T cell differentiation in cDC1s.
(A) Expression of Dectin-1 on WT cDC1s. Numbers indicate mean fluorescence intensity (GeoMFI). (B) IL-17A and (C) IFN-γ levels from anti-CD3/28 Ab-stimulated OT-II cells co-cultured with cDC1s from WT mice pretreated with or without curdlan. Relative expression of (D) Irf4 and (E) Il23a in WT cDC1s treated with curdlan for the indicated time points. Data are representative of three independent experiments.
Figure 4 with 2 supplements
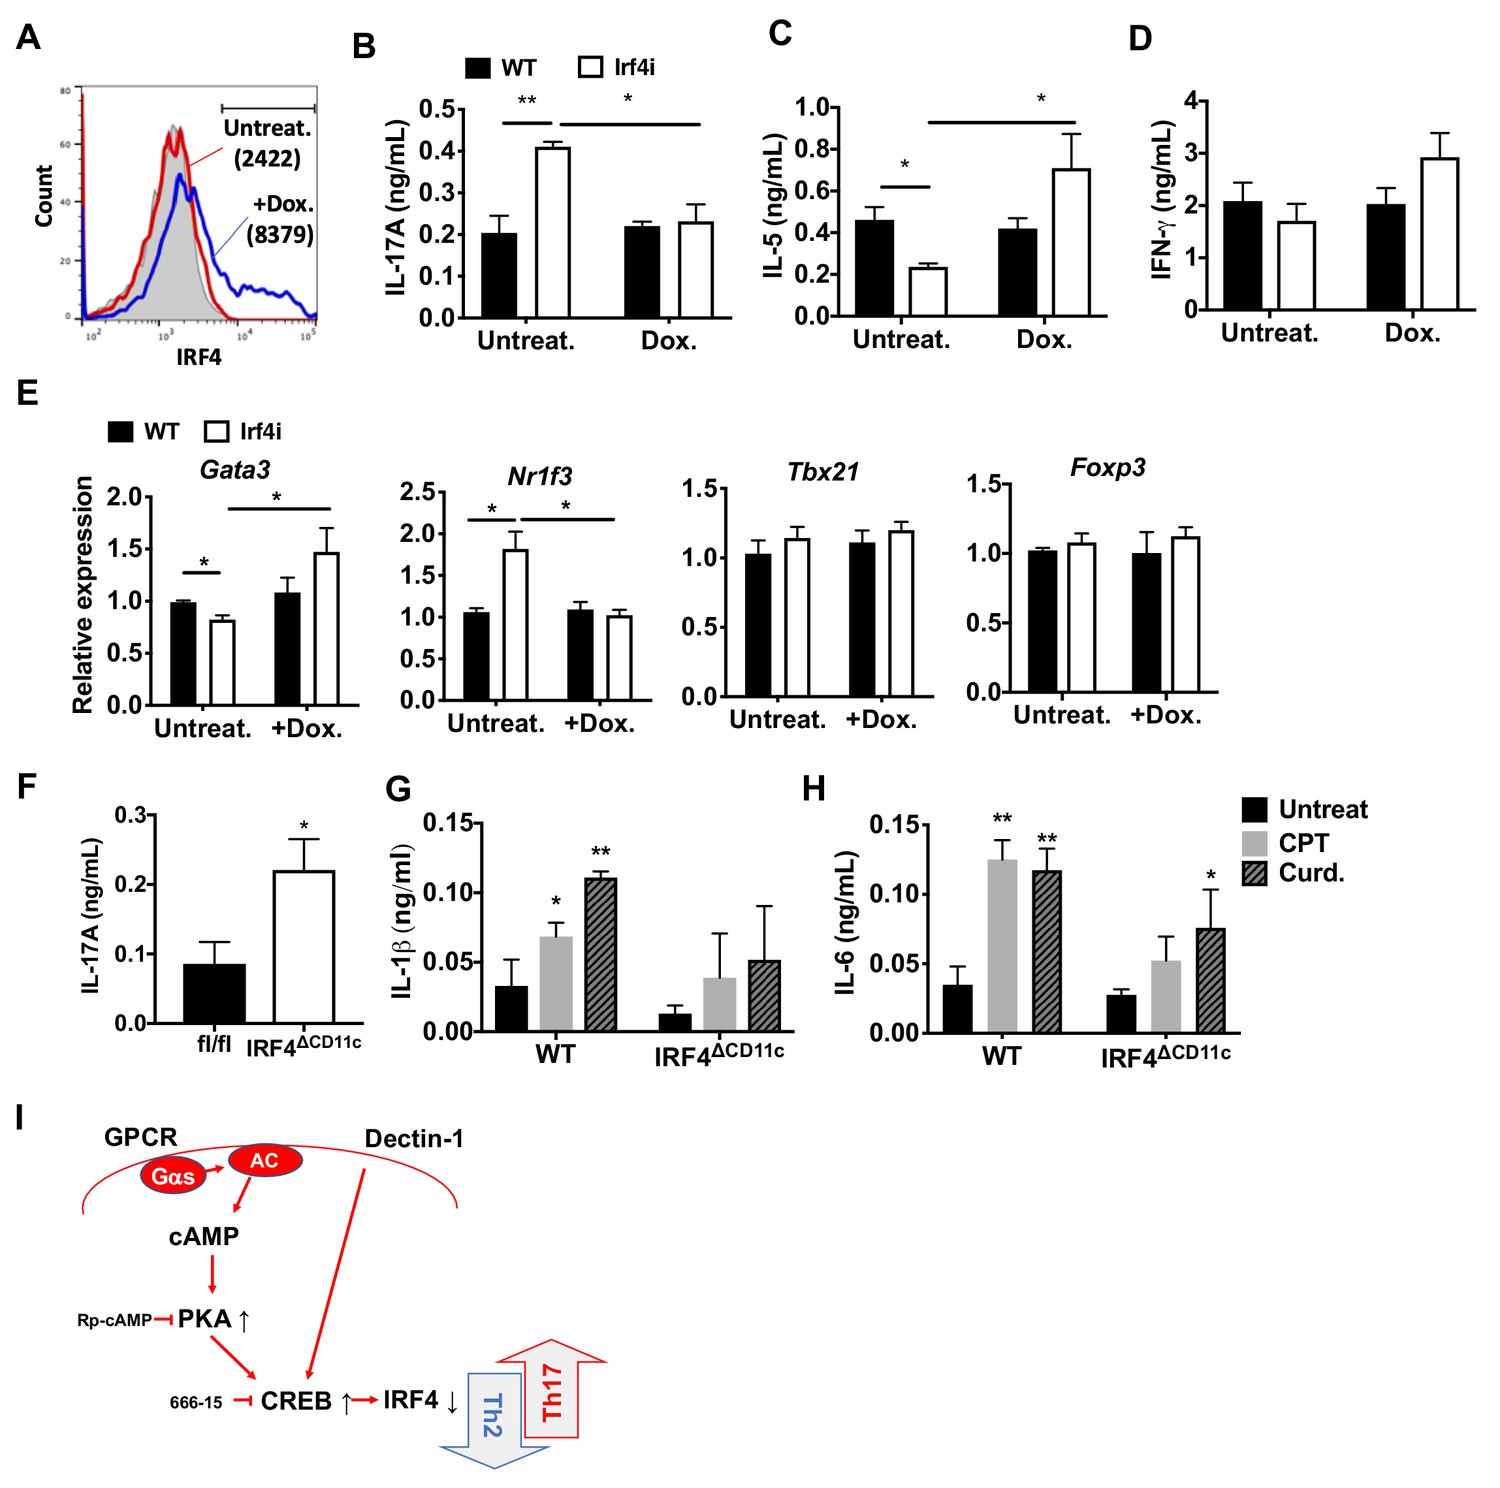
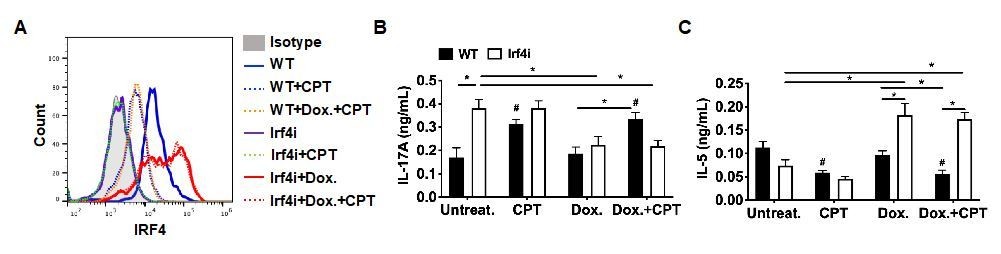
Decreased IRF4 expression in cDC2s promotes pro-Th17 phenotype.
(A) IRF4 expression in the Irf4i cDC2s treated with or without doxycycline (Dox, 200 ng/ml) for 16 hr. (B–D) IL-17A, IL-5 and IFN-γ levels and (E) T cell lineage commitment factors from the re-stimulated OT-II cells co-cultured with cDC2s from WT and Irf4i mice under the conditions described above. (F) IL-17A levels from anti-CD3/28 Ab-stimulated OT-II cells co-cultured with IRF4ΔCD11c cDC2s. (G) IL-1β and (H) IL-6 level in WT and IrfΔCD11c cDC2s after treatment of CPT or Curdlan for 24 hr. Data are representative of three independent experiments; *p<0.05, **p<0.01. (I) A schematic diagram of Th2 inhibition and pro-Th17 induction by PRR-independent and -dependent signals.
Figure 4—figure supplement 1
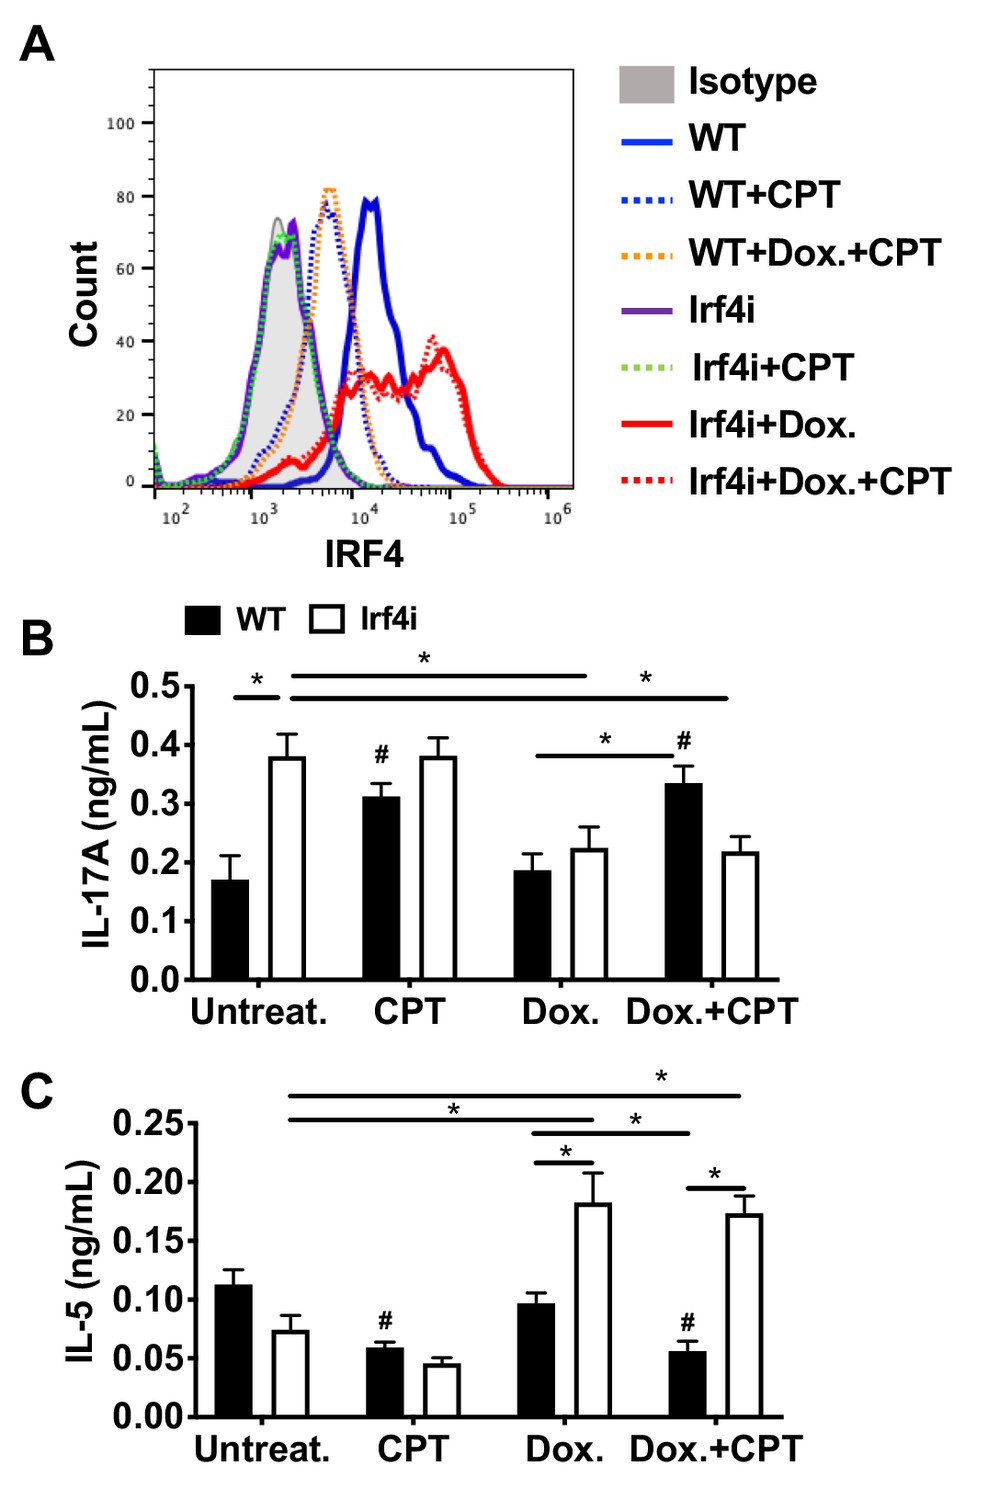
Decreased IRF4 expression in BM-APCs promotes pro-Th17 phenotype and sustained IRF4 expression blocks cAMP-induced Th17 bias.
(A) IRF4 expression in the WT and Irf4i BM-APCs treated with or without doxycycline (Dox, 200 ng/ml) for 16 hr. After the Dox treatment cells were washed and treated with CPT (50 μM) for 48 hr. (B, C) IL-17A and IL-5 levels from the re-stimulated OT-II cells co-cultured with BM-APCs from WT and Irf4i mice under the conditions described above. Data are mean ± s.e.m, n = 3 in each group; *p<0.05, # p<0.05 compared to WT untreated.
Figure 4—figure supplement 2
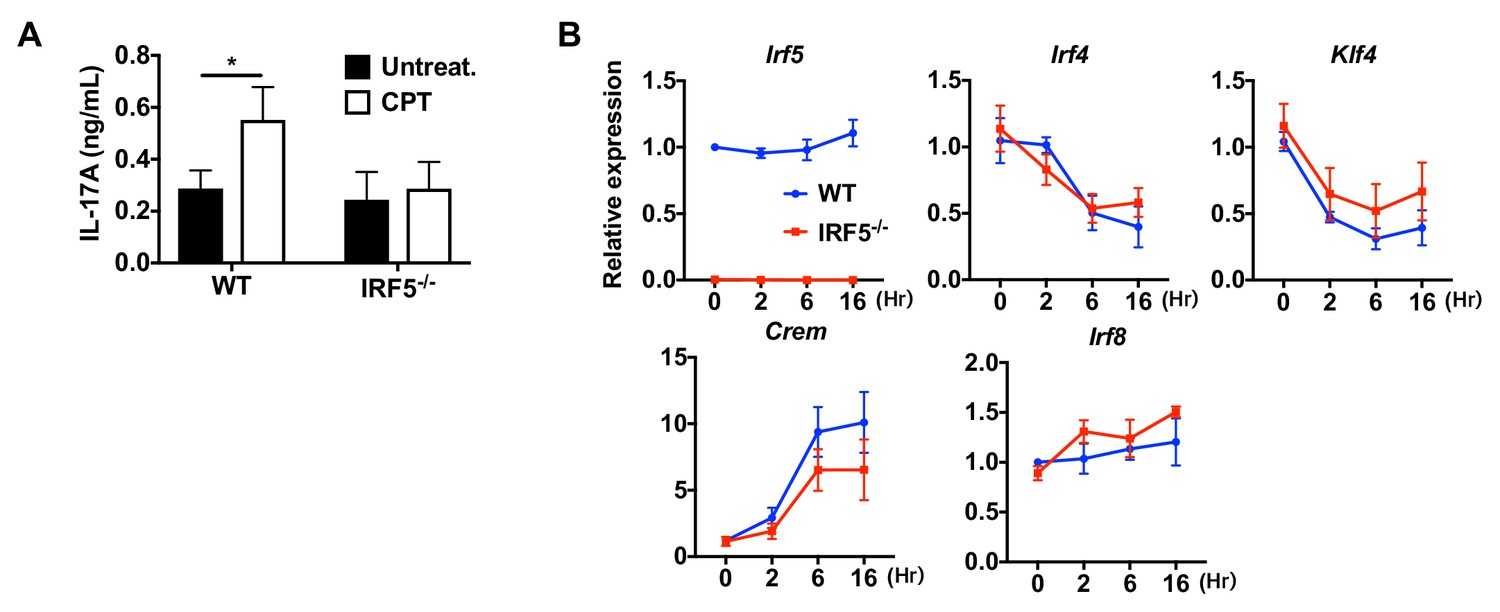
Loss of IRF5 in cDC2s inhibited CPT induced pro-Th17 phenotype.
(A) IL-17A levels from anti-CD3/28 Ab-stimulated OT-II cells co-cultured with CPT-treated cDC2s from WT and Irf5-/- mice. (B) QPCR of TFs in CPT-treated WT and Irf5-/- cDC2s. Data are representative of three independent experiments; *p<0.05.
Figure 5 with 4 supplements
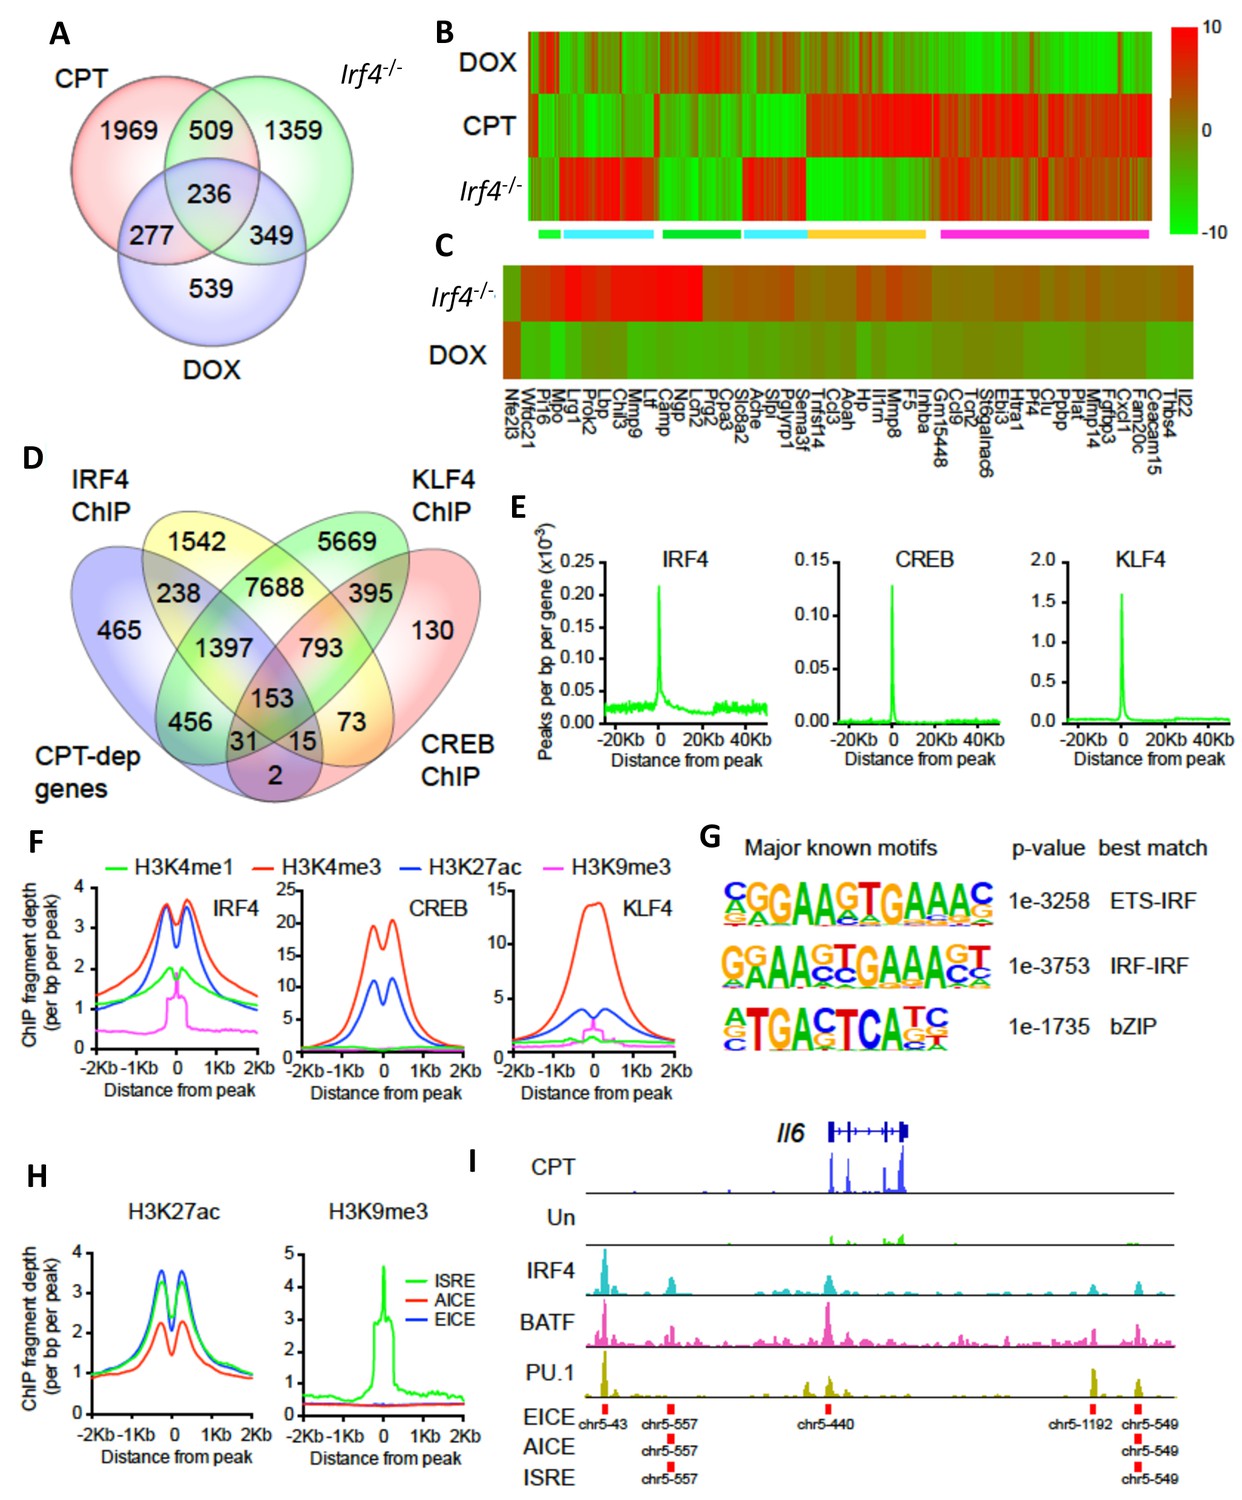
CPT and IRF4 transcriptomic effects and analysis of genome-wide binding of IRF4, CREB and KLF4.
(A) Venn diagram showing overlap of genes altered by CPT treatment (50 µM, 16 hr) of WT splenic cDC2s, with splenic cDC2s derived from Irf4-/- mice, and splenic cDC2s from Irf4-/- mice that have been induced with Dox (200 ng/ml, 16 hr). (B) Heatmap showing expression (log2 fold- change) of the 745 genes common to CPT and Irf4-/- cDC2s. Colored bars under the heatmap indicate clusters of genes with similar expression patterns. (C) Heatmap showing expression (log2 fold-change) of secreted genes that are altered in Irf4-/- and Dox datasets. (D) Venn diagram showing overlap of CPT-dependent genes with ChIPseq peaks for IRF4, CREB1 and KLF4. (E) Metagene analysis of the localized binding of IRF4, CREB1 and KLF4 to a synthetic gene. The synthetic gene is 25 kB in length and is flanked by 25 kB of upstream and downstream sequence. The transcriptional start site is indicated at 0. The plot shows the number of peaks per bp per gene (x10−3). (F) Co-localization of histone epigenetic modifications H3K4me1, H3K4me3, H3K27ac and H3K9me3 at IRF4, CREB and KLF4 peaks. The graphs show the ChIP fragment depth relative to the center of the TF peak. (G) Known transcription factor motifs identified in the IRF4 binding peaks. Height of the letter indicates its conservation. The p-value for the motif and its best match are shown. (H) Co-localization of H3K27ac and HeK9me3 modifications at the peaks with the three IRF4 motifs (ISRE, EICE, AICE). (I) IRF4, BATF, and PU.1 binding to the IRF4-super enhancer at the Il6 locus. The Il6 gene structure is shown at the top and RNAseq reads from untreated and CPT-treated cDC2s are shown in green and blue. Locations of individual motifs are indicated below the binding.
Figure 5—figure supplement 1
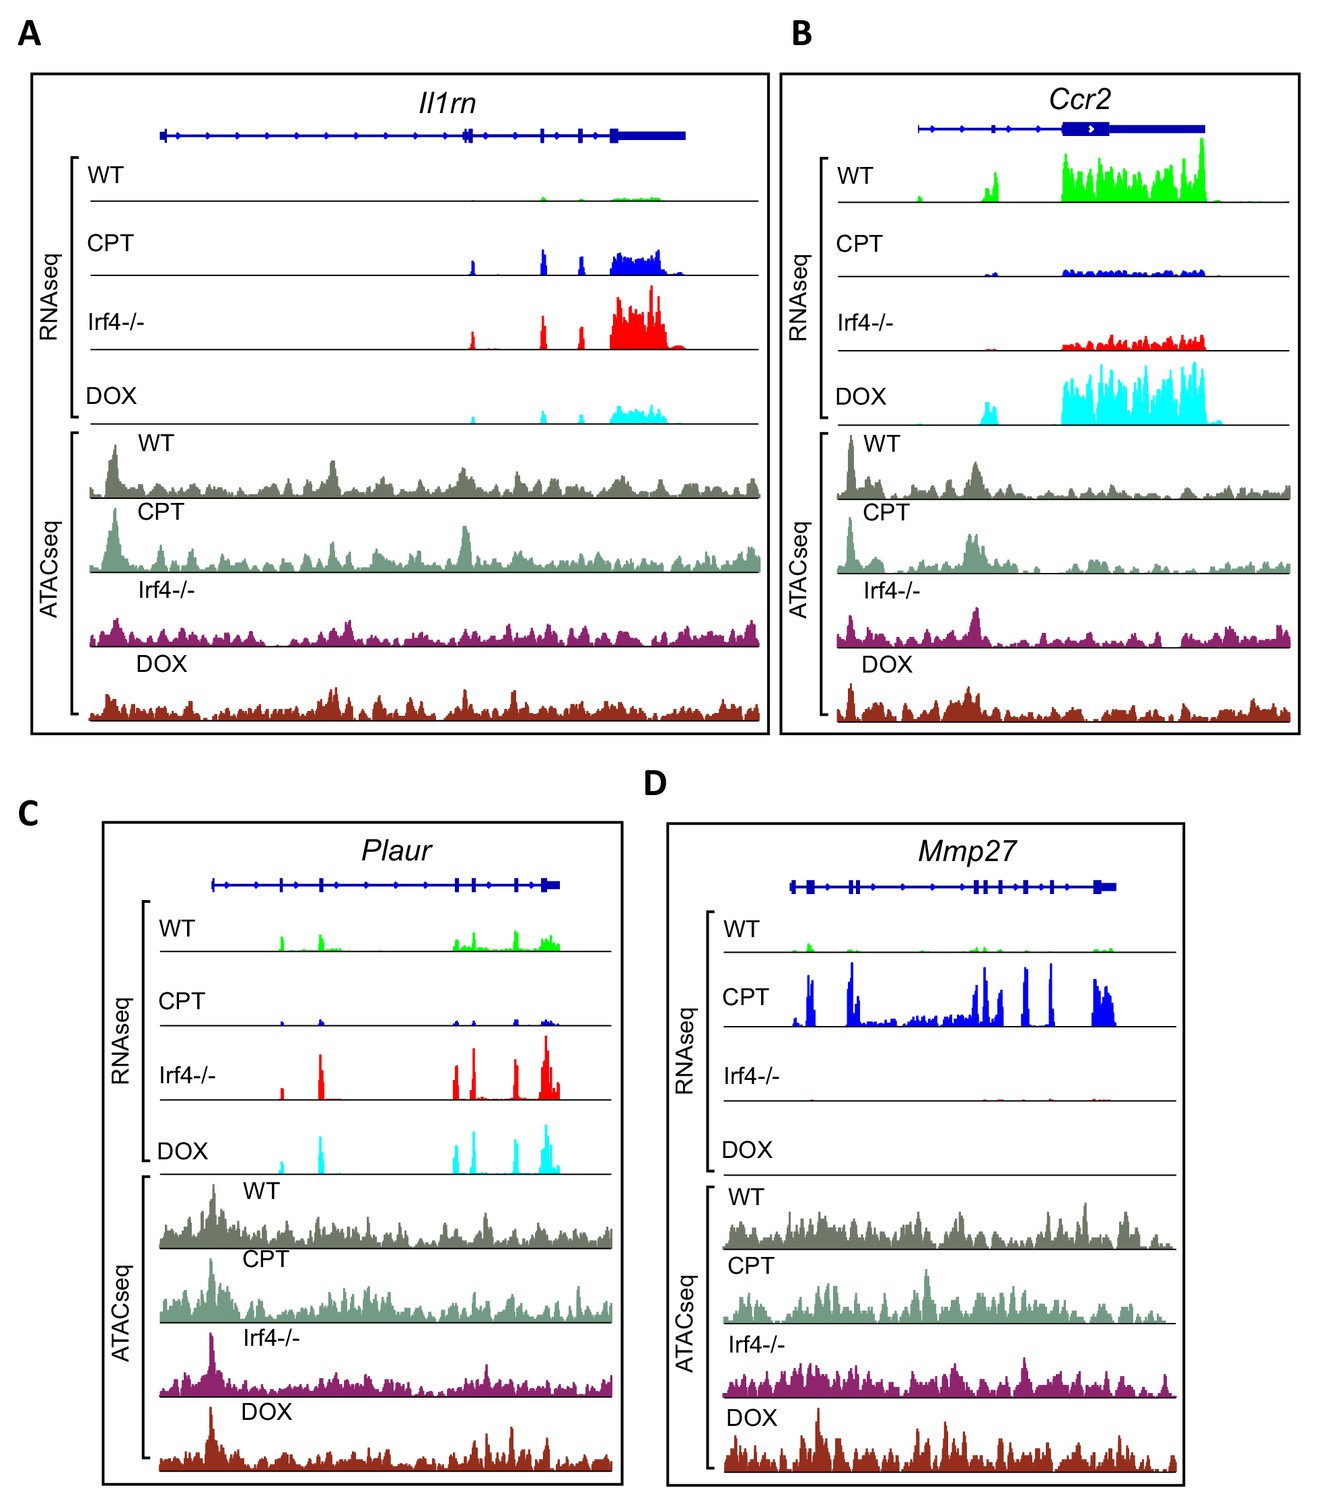
Examples of genes from transcriptional clusters.
(A–D) Aligned RNAseq reads for the Il1rn, Ccr2, Plaur and Mmp27 genes. Gene structure is indicated above in dark blue. Reads from untreated WT cells in green (WT), CPT-treated WT cells are in blue (CPT), Irf4-/- cDC2 s in red (Irf4-/-) and Dox-induced Irf4-/- cells in cyan (DOX). Chromatin accessibility was measured using ATACseq on the four groups. ATACseq peaks are shown below the RNAseq reads. Untreated cells are shown in gray (WT), CPT-treated cells in Gray-green, Irf4-/- cells in purple (Irf4-/-) and Dox-induced Irf4-/- cells in brown (DOX).
Figure 5—figure supplement 2
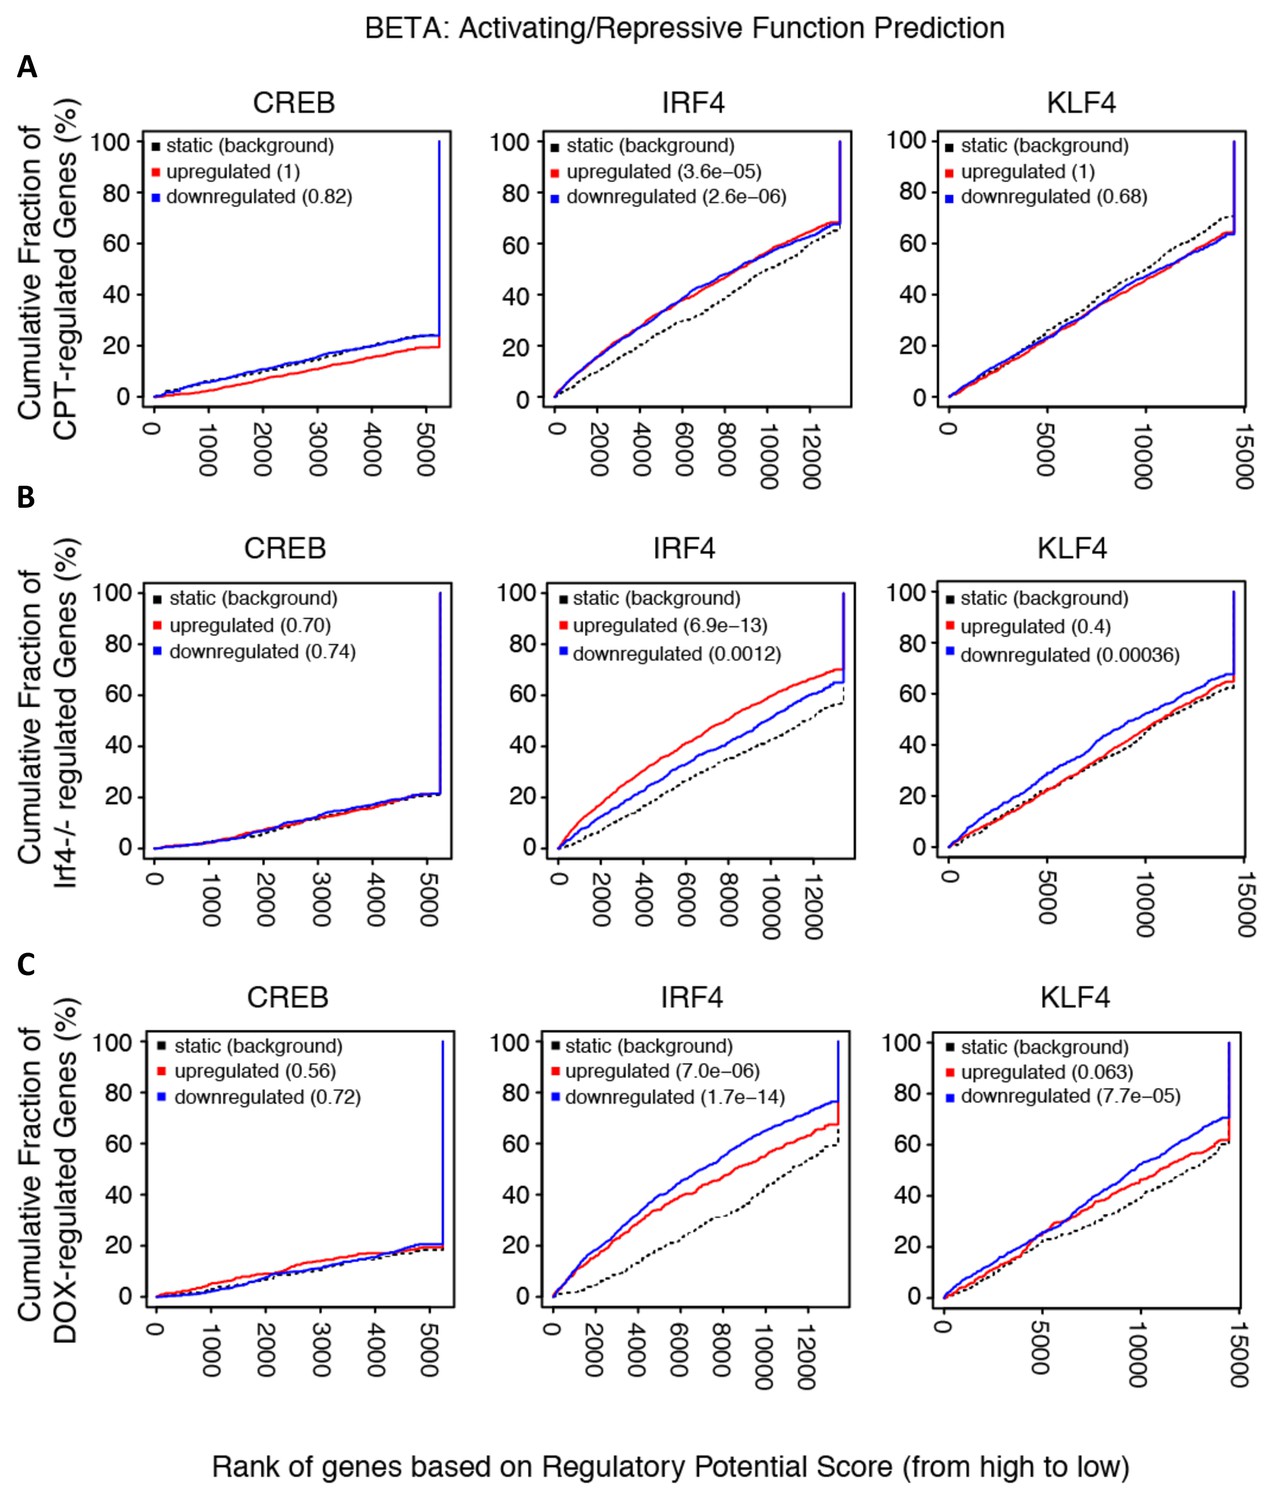
Transcriptional activation/repression prediction analysis.
(A–C) The graphs show the cumulative fraction of regulated genes plotted against rank of genes on regulatory score potential using the BETA approach. Dotted black lines show expected background for no predictive value. Red curves indicate gene activation, blue curves indicate gene repression. p-values indicate significant difference between actual and expected curves for up-regulated and down-regulated genes in the CPT, Irf4-/- and Dox datasets.
Figure 5—figure supplement 3
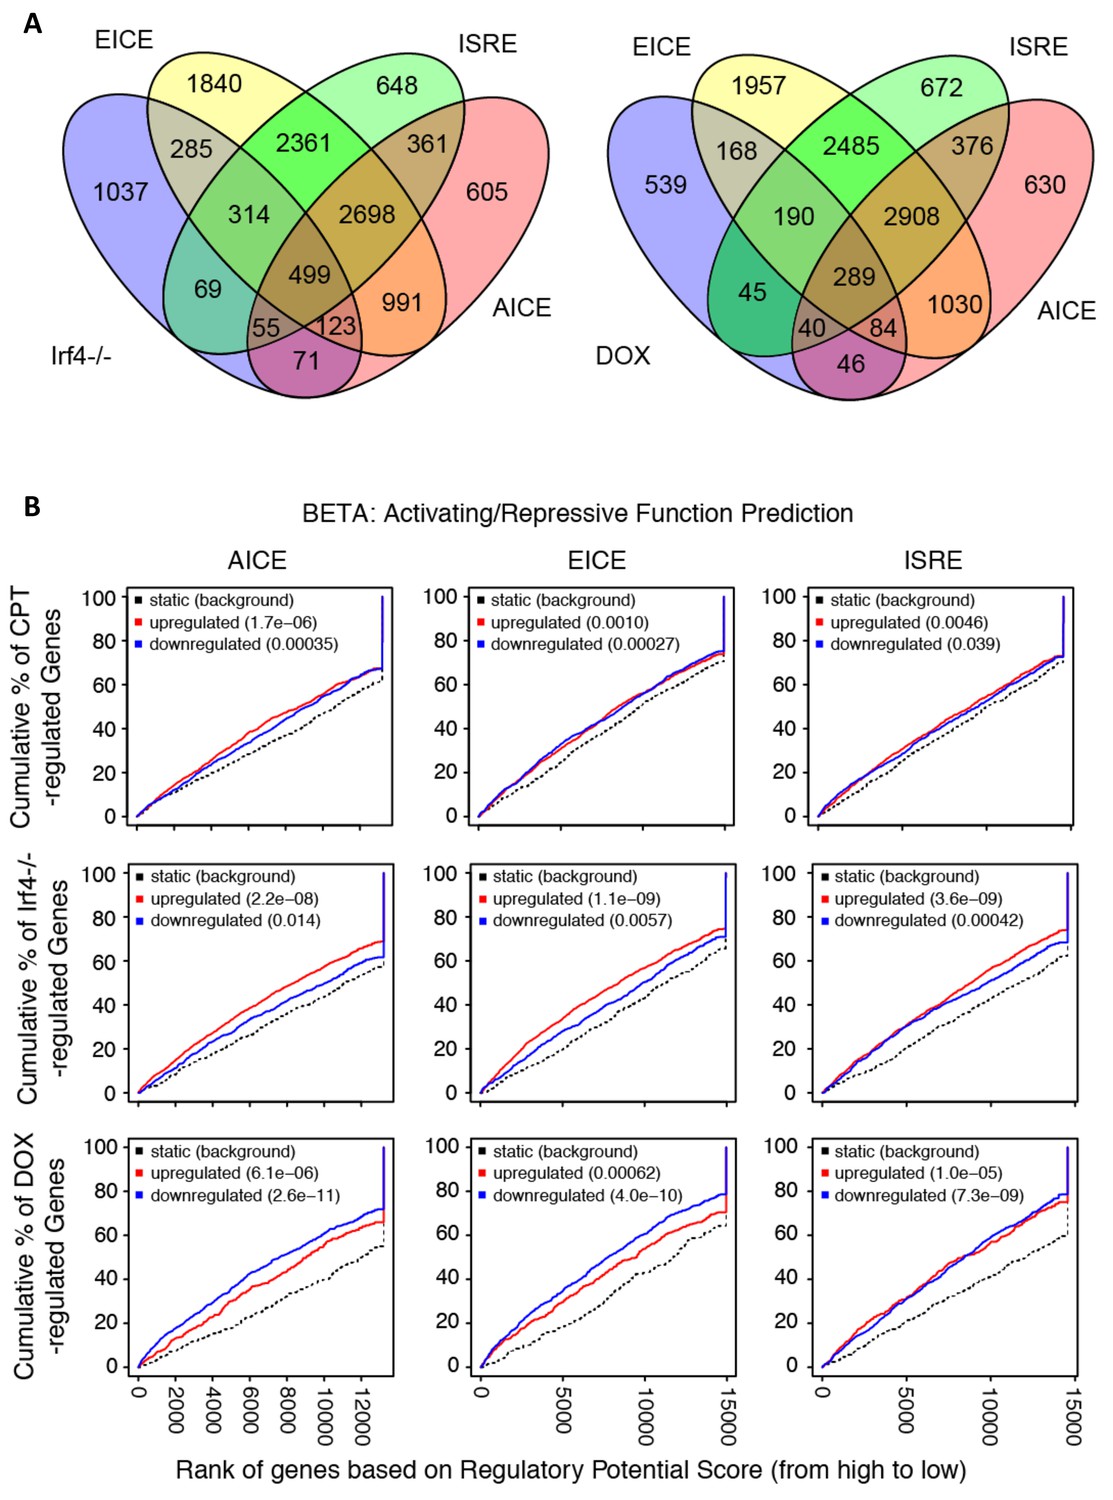
Prevalence and predictive value of IRF4 binding site subpopulations.
(A) Venn diagrams showing overlap of EICE, AICE and ISRE motifs in genes from Irf4-/- cDC2 s and from Irf4i cDC2s treated with Dox. (B) Prediction of CPT, Irf4-/- and Dox responsiveness with three IRF4 binding motifs. The graphs show the cumulative fraction of regulated genes plotted against rank of genes on regulatory score potential using the BETA approach. Dotted black lines show expected background for no predictive value. Red curves indicate gene activation, blue curves indicate gene repression. p-values indicate significant difference between actual and expected curves for up-regulated and down-regulated genes in the CPT, Irf4-/- and Dox datasets.
Figure 5—figure supplement 4
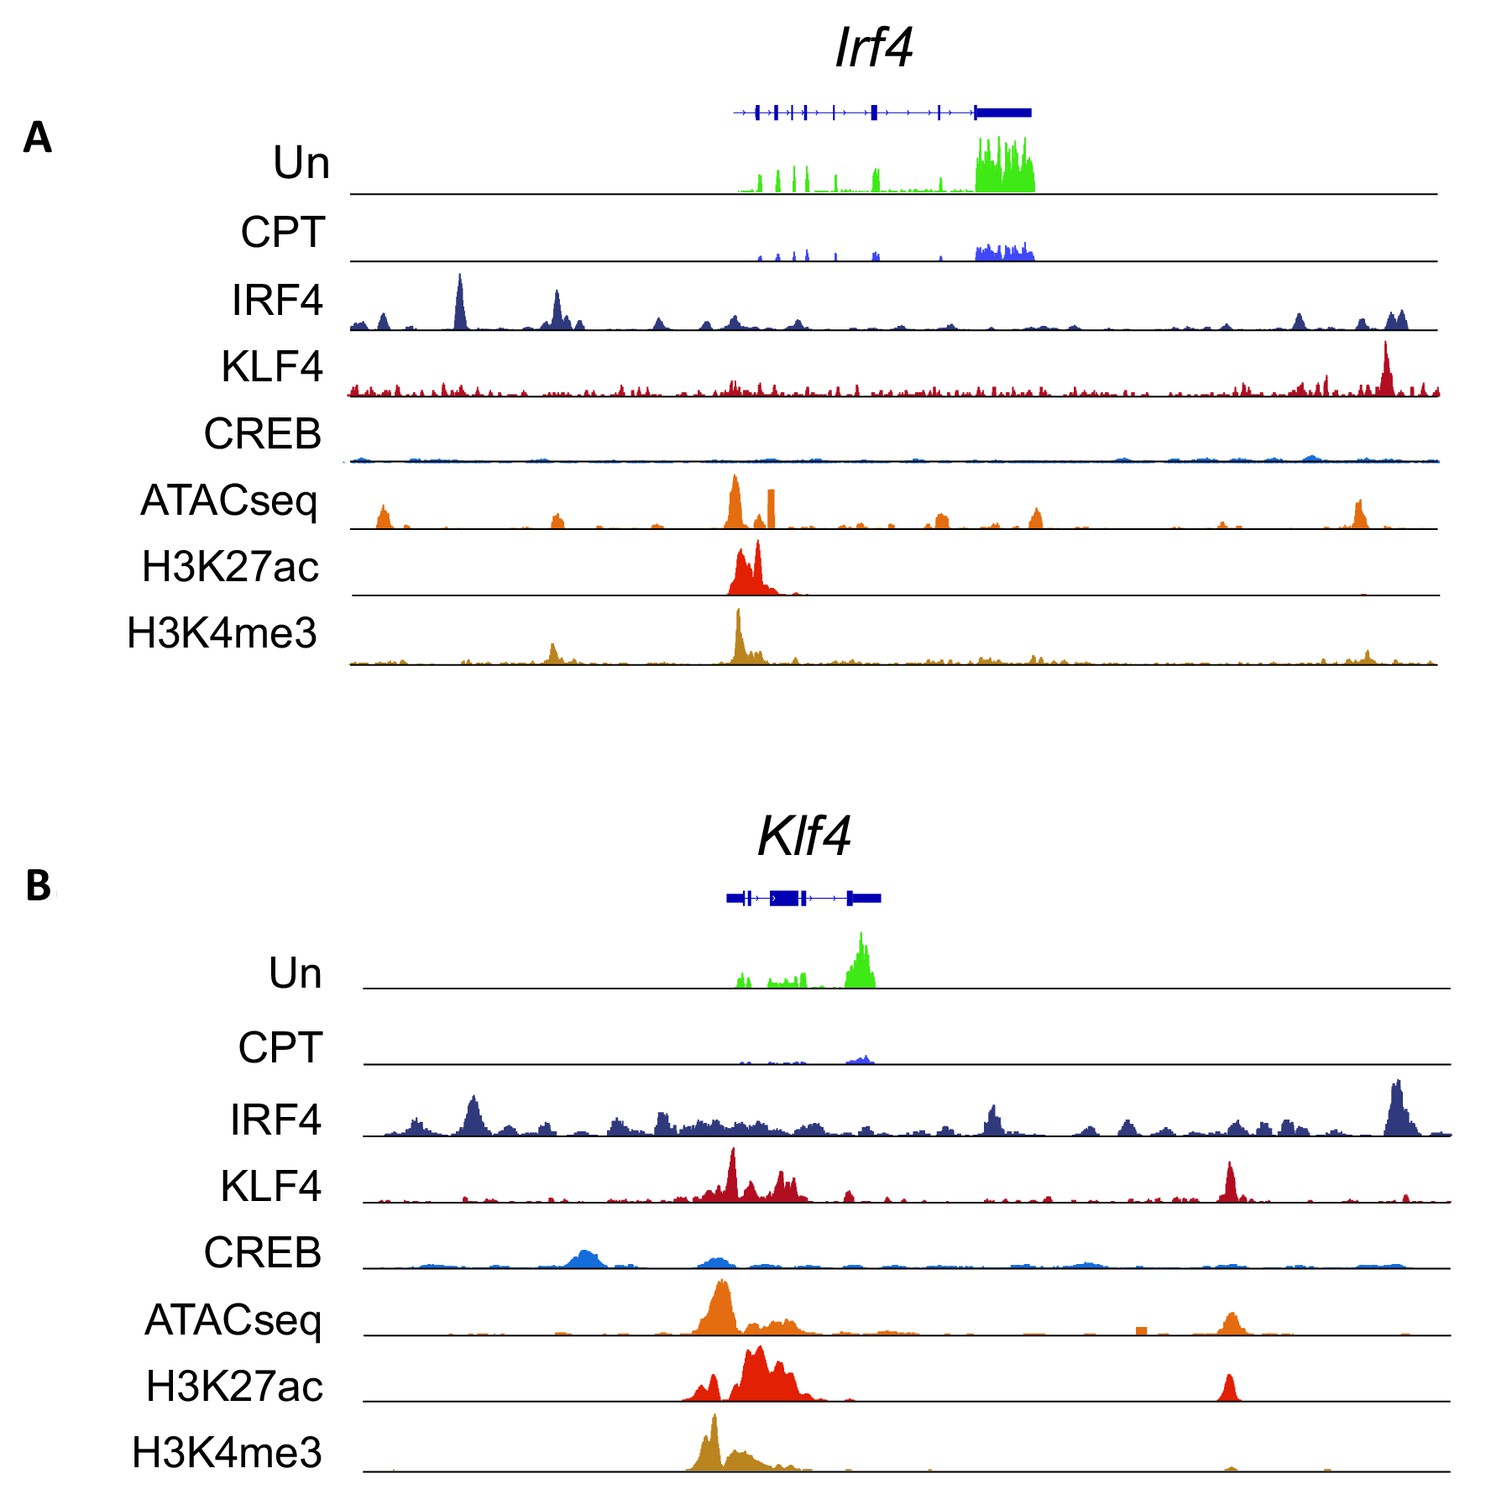
Expression from, chromatin structure of, and histone modifications at the Irf4 and Klf4 loci in cDC2s.
(A, B) IRF4, KLF4 and CREB binding to the Irf4 and Klf4 loci and co-localization with open chromatin (ATACseq) and H3K27ac (enhancers and promoters) and H3K4me3 (promoters) modifications. The gene structures are shown at the top and RNAseq reads from untreated (Un) and CPT-treated (CPT) cDC2s are shown in green and blue.
Figure 6 with 1 supplement
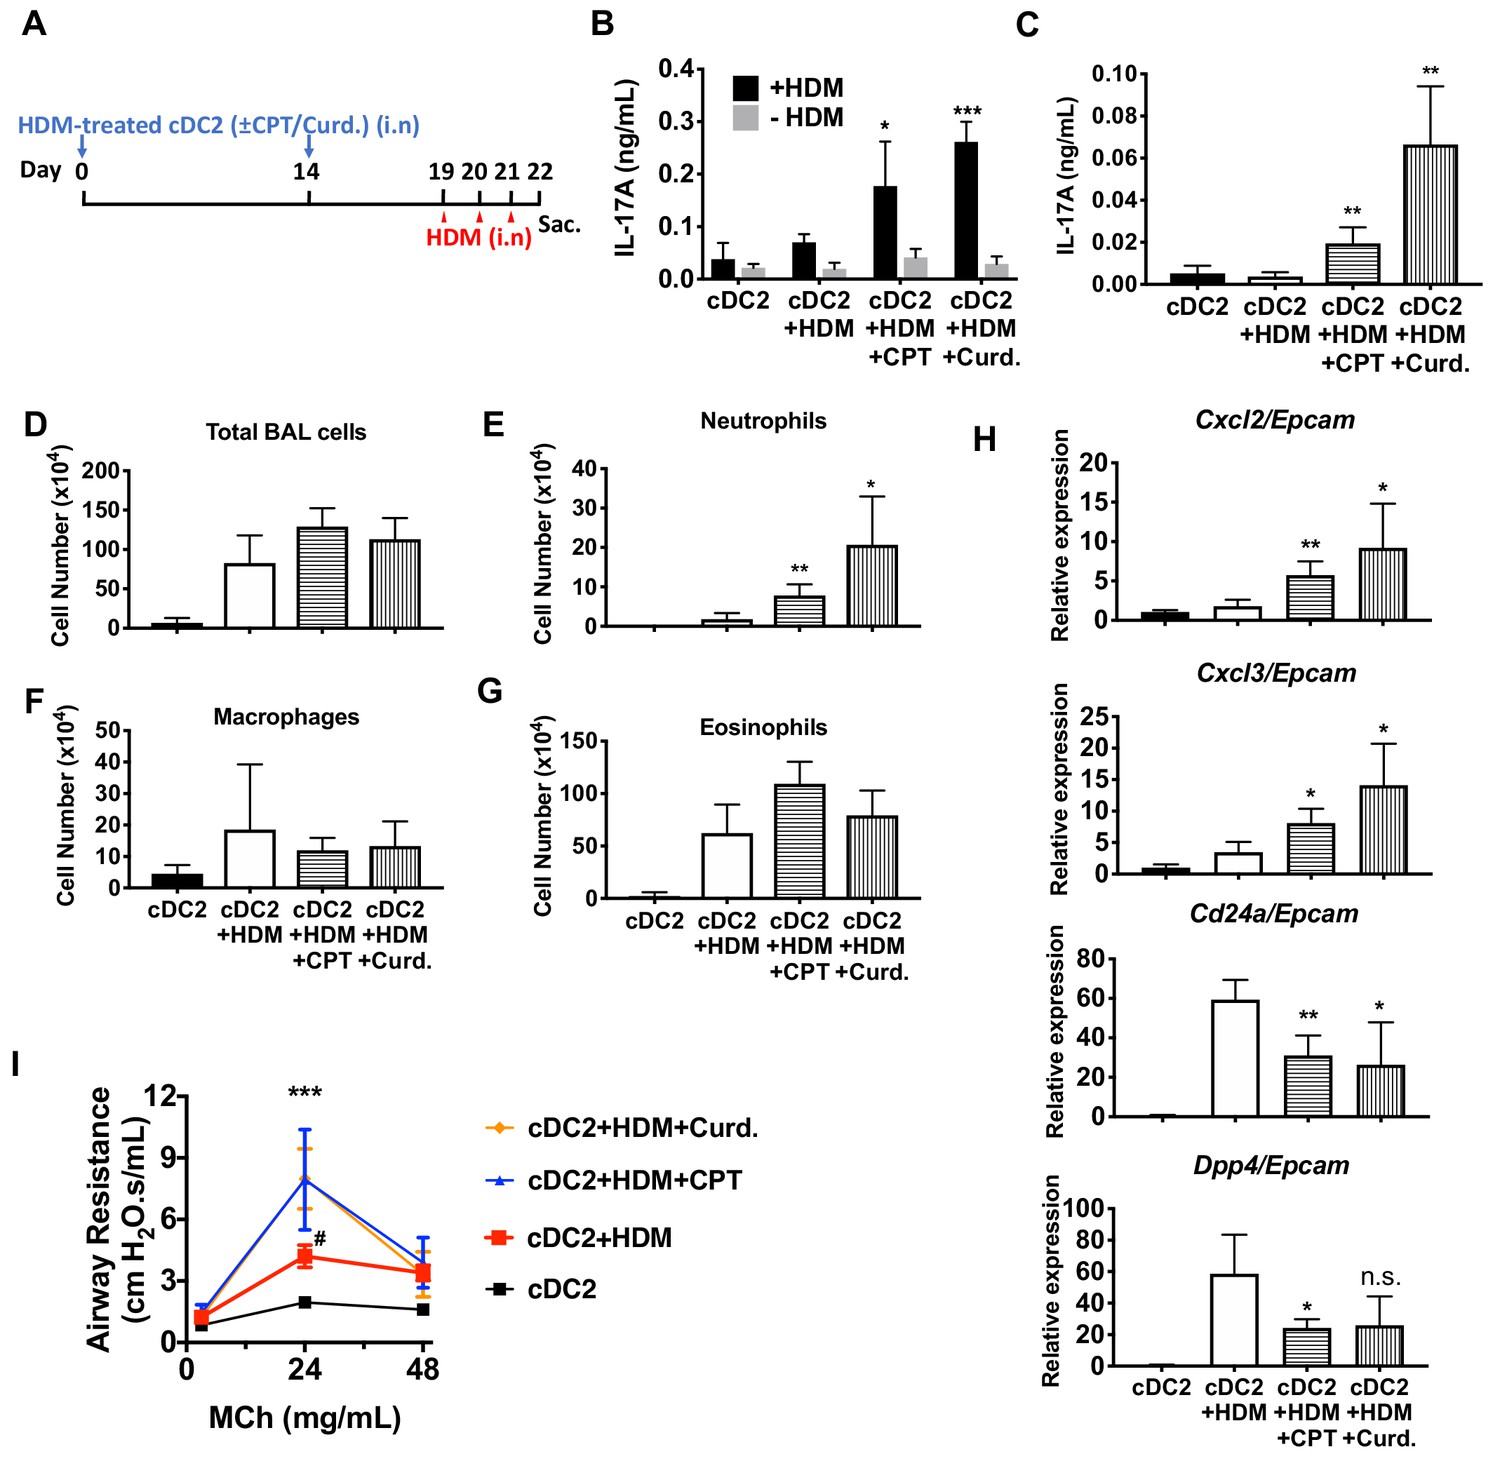
Adoptive transfer of HDM-pulsed, CPT or curdlan-treated cDC2 induces a Th17 bias and neutrophil infiltration in WT recipients.
(A) Schematic of adoptive transfer protocol. WT cDC2s were incubated with HDM (50 μg/ml) in the presence of CPT or curdlan prior to i.n. transfer to WT mice (B6 mice, 1 × 10⁶ cells/recipient) on day 0 and 14. HDM (12.5 µg/mouse) was used for the i.n. challenge on days 19, 20 and 21. On day 22, lungs from each group were harvested and processed a single cell suspension. (B) IL-17A level in the HDM (50 μg/ml)-stimulated lung cells. BAL fluid was analyzed for (C) IL-17 level (ELISA). (D) Total cells (E) neutrophils, (F) macrophages and (G) eosinophils number were counted in the BAL fluid. (H) Relative expression of Neut (Cxcl2 and Cxcl3)- and/Eos (Cd24a and Dpp4)- infiltration related genes in the lung tissue. Expression of each gene was normalized by expression of epithelial specific housekeeping gene, Epcam. (I) Airway resistance after MCh challenge was measured in the various experimental groups. Data were collected from four animals in each group and are representative of two independent experiments; *p<0.05, **p<0.01, ***p<0.001 by two-tailed Student’s t-test.
Figure 6—figure supplement 1
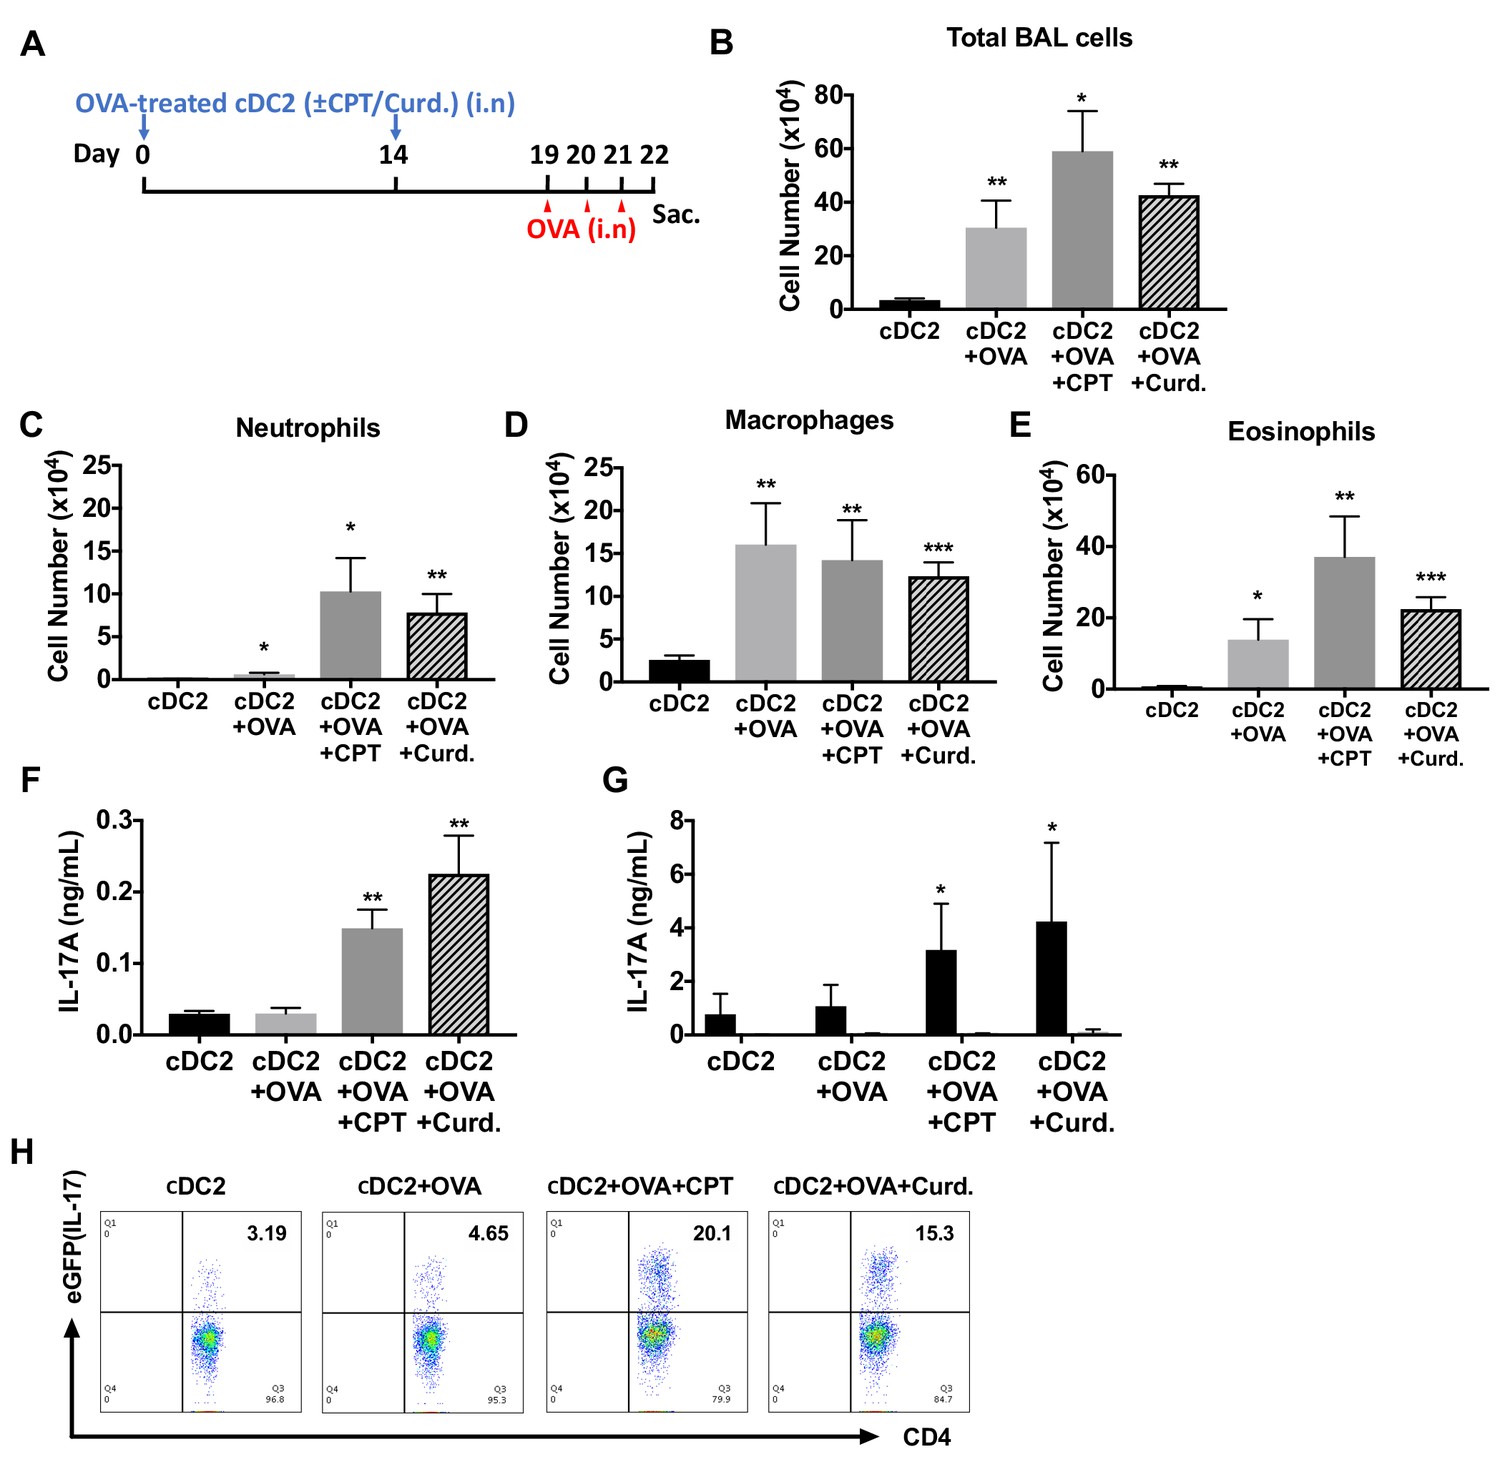
Adoptive transfer of OVA-pulsed, CPT or curdlan-treated cDC2s induces a Th17 bias and neutrophilic asthma in WT recipients.
(A) Schematic of adoptive transfer protocol. WT cDC2s were incubated with OVA (200 μg/ml) in the presence of CPT or curdlan prior to i.n. transfer to WT (B6 mice) or IL-17-GFP mice (1 × 10⁶ cells/recipient) on day 0 and 14. OVA (50 µg/mouse) was used for the i.n. challenge on days 19, 20 and 21. (B) Total cell number, (C) neutrophils, (D) macrophages and (E) eosinophils number of BAL fluid. IL-17A levels from the (F) BAL fluid and (G) OVA (200 μg/ml)-stimulated lung cells. (H) Isolated lung cells from IL-17-GFP mice were analyzed (FACS) for the eGFP fluorescence intensity after PMA/ionomycin stimulation. Data were collected from five animals in each group and are representative of two independent experiments; *p<0.05, **p<0.01, ***p<0.001 by two-tailed Student’s t-test.
Author response image 1

The impact of sustained IRF4 expression on cAMP induced Th17 bias.
(A) IRF4 expression in the WT and Irf4i BM-APCs treated with or without doxycycline (Dox, 200 ng/ml) for 16 hour. After the Dox treatment cells were washed and treated with CPT (50 μM) for 48 hour. (B, C) IL-17A and IL-5 levels from the re-stimulated OT-II cells co-cultured with BM-APCs from WT and Irf4i mice under the conditions described above. Data are mean ± s.e.m, n=3 in each group; *p<0.05, # p<0.05 compared to WT untreated.
Author response image 2
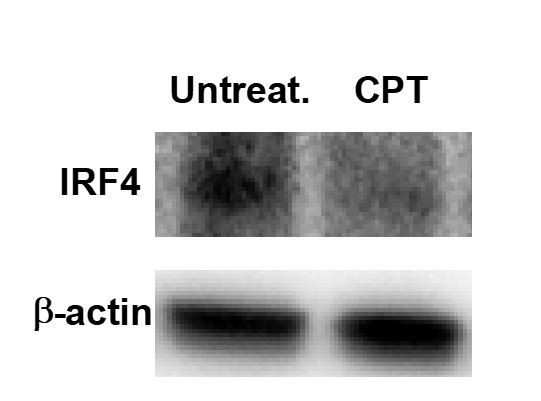
Decreased IRF4 expression by CPT treatment in WT cDC2.
WT cDC2 were treated with CPT (50 μM) for 48 hour and IRF4 were analyzed by western blot.
Author response image 3
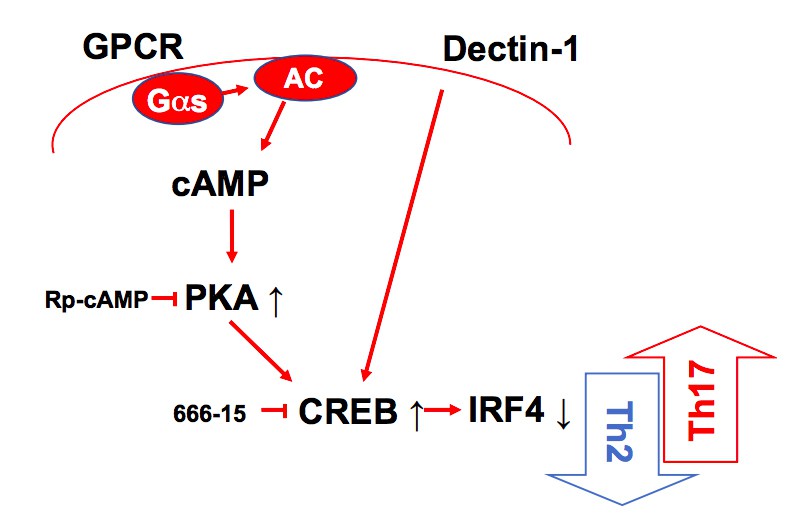
A schematic diagram of Th2 inhibition and Pro-Th17 induction by PRR-independent and -dependent signals.
Author response image 4
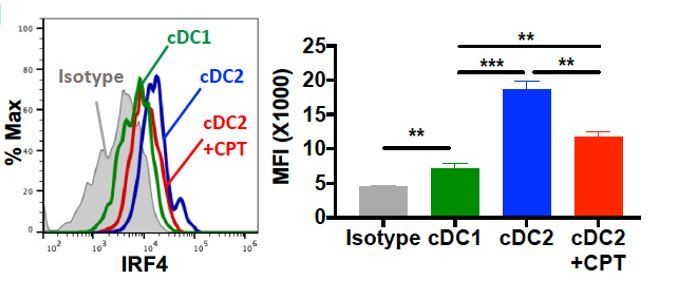
Intracellular staining of IRF4 in WT cDC1 and cDC2s treated with or without CPT for 48 hour.
Author response image 5
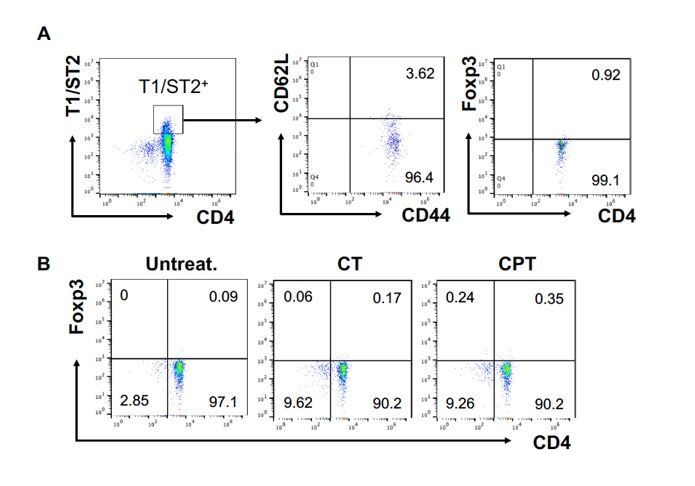
FOXP3 expression in T1/ST2+ cells.
OT-II CD4+ T cells were co-cultured with GnasΔCD11c BM-APCs to generate memory Th2 cells (first co-culture). From the first co-culture, T1/ST2+ cells were FACS sorted and then used for co-culture with WT cDC2s pretreated with or without CPT or Cholera toxin (CT) (second co-culture). (A) Memory T cell marker and FOXP3 were analyzed in the first co-cultured T cells. (B) FOXP3 were analyzed in the second co-cultured T cells.
Author response image 6
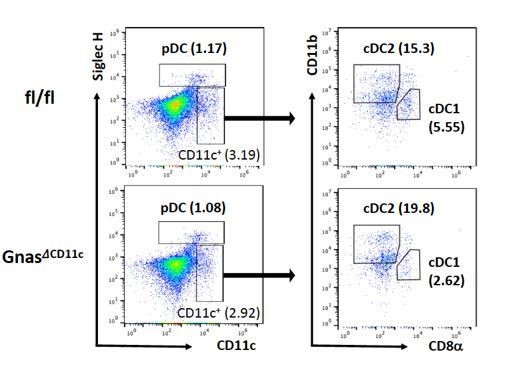
DC composition in the GNASfl/fl and GNASΔCD11c mice.
Splenocytes were isolated from GNASfl/fl and GNASΔCD11c mice and used for the analysis for pDCs and cDCs population.
Author response image 7
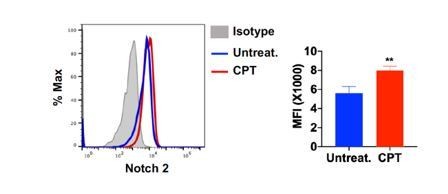
Notch 2 expression on cDC2 after CPT treatment.
Splenocytes were isolated from WT mice and treated with CPT (50 μM) for 24hour and then Notch 2 expression on cDC2 was analyzed by FACS.
Author response image 8
Decreased IRF4 expression in BM-APCs promotes pro-Th17 phenotype and sustained IRF4 expression blocks cAMP-induced Th17 bias.
(A) IRF4 expression in the WT and Irf4i BM-APCs treated with or without doxycycline (Dox, 200 ng/ml) for 16 hour. After the Dox treatment cells were washed and treated with CPT (50 μM) for 48 hour. (B, C) IL-17A and IL-5 levels from the re-stimulated OT-II cells co-cultured with BM-APCs from WT and Irf4i mice under the conditions described above. Data are mean ± s.e.m, n=3 in each group; *p<0.05, # p<0.05 compared to WT-untreated.
Tables
Key resources table
| Reagent type (species) or resource | Designation | Source or reference | Identifiers | Additional information |
|---|---|---|---|---|
| Strain, strain background (Mus musculus) | C57BL/6J (B6) | The Jackson Laboratory | RRID:IMSR_JAX:000664 | |
| Strain, strain background (Mus musculus, B6) | CD11c-Cre | The Jackson Laboratory | RRID:IMSR_JAX:008068 | |
| Strain, strain background (Mus musculus, B6) | OT-II | The Jackson Laboratory | RRID:IMSR_JAX:004194) | |
| Strain, strain background (Mus musculus, B6) | IL17A-eGFP | The Jackson Laboratory | RRID:IMSR_JAX:018472 | |
| Strain, strain background (Mus musculus, B6) | Irf4fl/fl | The Jackson Laboratory | RRID:IMSR_JAX:009380 | |
| Strain, strain background (Mus musculus, B6) | Gnas fl/fl | Lee Weinstein (NIH) | MGI:3609165 PMID: 15883378 | |
| Strain, strain background (Mus musculus, B6) | 4Get | Dr. M. Kronenberg (LAI, San Diego, CA) | RRID:IMSR_JAX:004190 | |
| Strain, strain background (Mus musculus, B6) | Irf4-inducible (Irf4-/-) (Irf4i) | Dr. R. Sciammas (University of California, Davis) | PMID: 23684984 | |
| Strain, strain background (Mus musculus, B6) | Irf5-/- | Dr. I. R. Rifkin (Boston University) | PMID: 25595782 | |
| Strain, strain background (Mus musculus, B6) | Il17a-/- | Dr. Y. Iwakura (The University of Tokyo, Japan) | MGI:2388010 PMID: 12354389 | |
| Cell line (Homo-sapiens) | MUTZ-3 | Dr. Martin L. Yarmush (Rutgers University, New Jersey) | PMID: 29682279 | |
| Cell line (Homo-sapiens) | THP-1 | ATCC | RRID:CVCL_0006 | |
| Cell line (Homo-sapiens) | HL-60 | ATCC | RRID:CVCL_0002 | |
| Antibody | PE anti-mouse monoclonal CD11c | eBioscience | Cat# 12-0114-82 | FACS (1:200) |
| Antibody | FITC anti-mouse monoclonal CD11c | BioLegend | Cat# 117306 | FACS (1:200) |
| Antibody | APC anti-mouse monoclonal CD8α | BD Bioscience | Cat# 553035 | FACS (1:200) |
| Antibody | FITC anti-mouse monoclonal CD8α | BD Bioscience | Cat# 553031 | FACS (1:200) |
| Antibody | APC anti-mouse monoclonal CD11b | eBioscience | Cat# 17-0112-82 | FACS (1:200) |
| Antibody | PE/Cy7 anti-mouse monoclonal CD11b | BioLegend | Cat# 101216 | FACS (1:100) |
| Antibody | PerCP-eFluor 710 anti-mouse monoclonal CD135 | eBioscience | Cat#46-1351-80 | FACS (1:200) |
| Antibody | PerCP-eFluor710 anti-human/mouse monoclonal IRF4 | eBioscience | Cat# 46-9858-80 | FACS (1:200) |
| Antibody | PE anti-human/mouse monoclonal IRF8 | R and D Systems | Cat# IC8447P | FACS (1:200) |
| Antibody | PE anti-mouse monoclonal IRF5 | Invitrogen | Cat# PCS-201–012 | FACS (1:200) |
| Antibody | PerCP anti-mouse monoclonal CD4 | BD Bioscience | Cat# 553052 | FACS (1:200) |
| Antibody | FITC anti-mouse monoclonal CD4 | BD Bioscience | Cat# 553729 | FACS (1:200) |
| Antibody | PE anti-mouse monoclonal IL-33Rα | BioLegend | Cat# 145303 | FACS (1:200) |
| Antibody | PEcy7 anti-mouse monoclonal CD44 | eBioscience | Cat# 25-0441-82 | FACS (1:200) |
| Antibody | APC anti-mouse monoclonal CD62L | eBioscience | Cat# 17-0621-83 | FACS (1:200) |
| Antibody | APC anti-mouse monoclonal FOXP3 | eBioscience | Cat# 17-5773-82 | FACS (1:200) |
| Antibody | PE anti-mouse monoclonal Dectin-1 | BioLegend | Cat# 144303 | FACS (1:200) |
| Antibody | anti-mouse monoclonal CD3e (2C11) | BioXcell | Cat# BE0001-1FAB | 10 μg/ml |
| Antibody | anti-mouse monoclonal CD28 | BioXcell | Cat# BE0015-5 | 1 μg/ml |
| Commercial assay or kit | EasySep Mouse Naïve CD4+ T Cell Isolation Kit | StemCell Technologies | Cat# 19765 | |
| Peptide, recombinant protein | Recombinant Mouse GM-CSF | BioLegend | Cat# 576302 | 10 ng/ml |
| Peptide, recombinant protein | Recombinant Human GM-CSF | BioLegend | Cat# 572903 | 100 ng/ml |
| Peptide, recombinant protein | TGF-β | R and D systems | Cat# 240-B-002 | 10 ng/ml |
| Peptide, recombinant protein | TNF-α | R and D systems | Cat# 210-TA-005 | 2.5 ng/ml |
| Peptide, recombinant protein | rhIL-4 | BioLegend | Cat# 574002 | 100 ng/ml |
| Chemical compound, drug | Calcium ionophore A23187 | Sigma-Aldrich | Cat# C7522 | 180 ng/ml |
| Chemical compound, drug | CPT-cAMP | Sigma-Aldrich | Cat# C3912 | 50 μM |
| Chemical compound, drug | Prostaglandin E2 | Sigma-Aldrich | Cat# P5640 | 10 μM |
| Chemical compound, drug | Forskolin | Sigma-Aldrich | Cat# F6886 | 10 μM |
| Chemical compound, drug | Pertussis toxin | Sigma-Aldrich | Cat# P7208 | 100 ng/ml |
| Chemical compound, drug | Phorbol 12-myristate 13-acetate | Sigma-Aldrich | Cat# P8139 | 50 ng/ml |
| Chemical compound, drug | Ionomycin | Sigma-Aldrich | Cat# I3909 | 1 μM |
| Chemical compound, drug | Doxycycline | Sigma-Aldrich | Cat# D9891 | 200 ng/ml |
| Chemical compound, drug | CREB inhibitor (666-15) | Millipore Sigma | Cat# 5383410001 | 1 μM |
| Chemical compound, drug | Cholera toxin | List biological laboratories | Cat# 101B | 1 μg/ml |
| Chemical compound, drug | Ovalbumin | Worthington Biochemical | Cat# LS003054 | 100 μg/ml |
| Chemical compound, drug | MHC class II OVA peptide | GenScript | Cat# RP10610 | 1 μg/ml |
| Chemical compound, drug | HDM extract | Greer Laboratories | Cat# XPB82D3A2.5 | |
| Chemical compound, drug | Rp-cAMP | BioLog | Cat# A002S | 50 μM |
| Chemical compound, drug | Rolipram | Tocris Bioscience | Cat# 0905 | 10 μM |
| Chemical compound, drug | CE3F4 | Tocris Bioscience | Cat# 4793 | 10 μM |
| Chemical compound, drug | Curdlan | Wako Chemicals | Cat# 034–09901 | 10 μg/ml |
Additional files
-
Supplementary file 1
Tables of transcriptional profiling (RNAseq).
Supplementary Table 1: Genes altered by CPT treatment of cDC2 Table shows genes altered in CPT-treated splenic cDC2 cells. RNAseq data was analyzed by DESeq2 using a FDR < 0.05 multiple testing correction. Columns indicate gene symbol; chromosome; start and end positions of the gene; chromosome strand; stable Ensembl gene ID; description of gene; mean read counts for CPT-treated WT (CPT), untreated WT (UN), doxycycline-treated Irf4-/- (DOX), Irf4-/- (IRF4KO), and WT littermate (WT) cDC2 cells; fold change for CPT-treated versus untreated (FC); the log2-transformed fold change (log2FC); and the corrected p-value (FDR). Supplementary Table 2: Genes altered in Irf4-/- cDC2 Table shows genes altered in splenic cDC2 cells from Irf4-/- mice. RNAseq data was analyzed by DESeq2 using a FDR < 0.05 multiple testing correction. Columns indicate gene symbol; chromosome; start and end positions of the gene; chromosome strand; stable Ensembl gene ID; description of gene; mean read counts for CPT-treated WT (CPT), untreated WT (UN), doxycycline-treated Irf4-/- (DOX), Irf4-/- (IRF4KO), and WT littermate (WT) cDC2 cells; fold change for CPT-treated versus untreated (FC); the log2-transformed fold change (log2FC); and the corrected p-value (FDR). Supplementary Table 3: Genes altered in IRF4 overexpressing Irf4-/- cDC2 Table shows genes altered in splenic cDC2 cells from Irf4-/- mice that had been treated with doxycycline to over-express IRF4. RNAseq data was analyzed by DESeq2 using a FDR < 0.05 multiple testing correction. Columns indicate gene symbol; chromosome; start and end positions of the gene; chromosome strand; stable Ensembl gene ID; description of gene; mean read counts for CPT-treated WT (CPT), untreated WT (UN), doxycycline-treated Irf4-/- (DOX), Irf4-/- (IRF4KO), and WT littermate (WT) cDC2 cells; fold change for CPT-treated versus untreated (FC); the log2-transformed fold change (log2FC); and the corrected p-value (FDR). Supplementary Table 4: Transcription factor networks derived from CPT-regulated genes. Table shows transcription factor networks generated using genes differentially expressed in CPT-treated cDC2 cells. Networks were generated using GeneGo’s MetaCore software. Columns contain network number; transcription factor driving network (Network); gene ontology (GO) processes that are enriched for the network; total number of genes (nodes) in network; number of input differentially-expressed genes (seed nodes) in network; number of canonical pathways in the network; the p-value for the network (p-Value), the z-score (zScore) indicating the number of SDs from the mean for the network, and the z-score corrected for the interactions of non-seed nodes (gScore) for the network. Supplementary Table 5: Transcription factor networks derived from genes differentially expressed in Irf4-/- cDC2. Table shows transcription factor networks generated using genes differentially expressed in Irf4-/- cDC2 cells. Networks were generated using GeneGo’s MetaCore software. Columns contain network number; transcription factor driving network (Network); gene ontology (GO) processes that are enriched for the network; total number of genes (nodes) in network; number of input differentially-expressed genes (seed nodes) in network; number of canonical pathways in the network; the p-value for the network (p-Value), the z-score (zScore) indicating the number of SDs from the mean for the network, and the z-score corrected for the interactions of non-seed nodes (gScore) for the network. Supplementary Table 6: Transcription factor networks derived from genes differentially expressed by over-expression of IRF4. Table shows transcription factor networks generated using genes differentially expressed in doxycycline-treated Irf4-/- cDC2 cells. Networks were generated using GeneGo’s MetaCore software. Columns contain network number; transcription factor driving network (Network); gene ontology (GO) processes that are enriched for the network; total number of genes (nodes) in network; number of input differentially-expressed genes (seed nodes) in network; number of canonical pathways in the network; the p-value for the network (p-Value), the z-score (zScore) indicating the number of SDs from the mean for the network, and the z-score corrected for the interactions of non-seed nodes (gScore) for the network. Supplementary Table 7: Genes altered in both CPT-treated and Irf4-/- cDC2 Table shows genes differentially expressed in both CPT-treated and from Irf4-/- splenic cDC2 cells. RNAseq data was analyzed by DESeq2 using a FDR < 0.05 multiple testing correction. Columns indicate gene symbol; chromosome; start and end positions of the gene; chromosome strand; stable Ensembl gene ID; mean read counts for CPT-treated WT (CPT), untreated WT (Untreated), doxycycline-treated Irf4-/- (DOX), Irf4-/- (IRF4-KO), and WT littermate (WT) cDC2 cells; the log2-transformed fold change for CPT-treated cDC2 (log2FC CPT/UN); the log2-transformed fold change for doxycycline-treated Irf4-/- cDC2 (log2FC DOX/KO); the log2-transformed fold change for Irf4-/- cDC2 (log2FC KO/WT); and the description of the gene. Supplementary Table 8: Genes altered in both Irf4-/- cDC2 and in the IRF4 over-expressing cDC2 Table shows genes differentially expressed in both Irf4-/- splenic cDC2 cells and in doxycycline-treated Irf4-/- cDC2. RNAseq data was analyzed by DESeq2 using a FDR < 0.05 multiple testing correction. Columns indicate gene symbol; chromosome; start and end positions of the gene; chromosome strand; stable Ensembl gene ID; mean read counts for CPT-treated WT (CPT), untreated WT (Untreated), doxycycline-treated Irf4-/- (DOX), Irf4-/- (IRF4-KO), and WT littermate (WT) cDC2 cells; the log2-transformed fold change for CPT-treated cDC2 (log2FC CPT/UN); the log2-transformed fold change for doxycycline-treated Irf4-/- cDC2 (log2FC DOX/KO); the log2-transformed fold change for Irf4-/- cDC2 (log2FC KO/WT); and the description of the gene. Supplementary Table 9: Genes altered in CPT-treated, Irf4-/- cDC2, and IRF4 over-expressing splenic cDC2 Table shows genes differentially expressed in CPT-treated cDC2, Irf4-/- cDC2 cells, and Irf4-/- cDC2 treated with doxycycline to over-express IRF4. RNAseq data was analyzed by DESeq2 using a FDR < 0.05 multiple testing correction. Columns indicate gene symbol; chromosome; start and end positions of the gene; chromosome strand; stable Ensembl gene ID; mean read counts for CPT-treated WT (CPT), untreated WT (Untreated), doxycycline-treated Irf4-/- (DOX), Irf4-/- (IRF4-KO), and WT littermate (WT) cDC2 cells; the log2-transformed fold change for CPT-treated cDC2 (log2FC CPT/UN); the log2-transformed fold change for doxycycline-treated Irf4-/- cDC2 (log2FC DOX/KO); the log2-transformed fold change for Irf4-/- cDC2 (log2FC KO/WT); and the description of the gene. Supplementary Table 10: Transcription factor networks derived from genes differentially expressed in CPT-treated cDC2, Irf4-/- cDC2, and in Irf4-/- cDC2 over-expressing IRF4. Table shows transcription factor networks generated using genes differentially expressed in CPT-treated cDC2, Irf4-/- cDC2 cells, and Irf4-/- cDC2 treated with doxycycline to over-express IRF4. Networks were generated using GeneGo’s MetaCore software. Columns contain network number; transcription factor driving network (Network); gene ontology (GO) processes that are enriched for the network; total number of genes (nodes) in network; number of input differentially-expressed genes (seed nodes) in network; number of canonical pathways in the network; the p-value for the network (p-Value), the z-score (zScore) indicating the number of SDs from the mean for the network, and the z-score corrected for the interactions of non-seed nodes (gScore) for the network. Supplementary Table 11: Enrichment analysis using the 239 genes differentially expressed in CPT-treated cDC2, Irf4-/- cDC2, and in Irf4-/- cDC2 over-expressing IRF4. Table shows the top ten enriched pathways, process networks, and GO processes transcription factor networks generated using genes differentially expressed in CPT-treated cDC2, Irf4-/- cDC2 cells, and Irf4-/- cDC2 treated with doxycycline to over-express IRF4. Enrichment was performed using GeneGo’s MetaCore software. Columns contain the pathway map, network, or process name; the total number of genes involved; the p-value (p-Value); the FDR corrected p-value (FDR); the number of differentially expressed genes in the pathway, network or process; and the gene symbols for these genes in the pathway, network, or process. Supplementary Table 12: Common genes encoding secreted proteins. Table shows the 239 differentially expressed genes common to CPT-treatment Irf4-/- or IRF4 over-expression that are annotated to encode secreted proteins. Columns indicate gene symbol; chromosome; start and end positions of the gene; chromosome strand; stable Ensembl gene ID; description of the gene; mean read counts for CPT-treated WT (CPT), untreated WT (Untreated), doxycycline-treated Irf4-/- (DOX), Irf4-/- (IRF4-KO), and WT littermate (WT) cDC2 cells; the log2-transformed fold change for CPT-treated cDC2 (log2FC CPT/UN); the log2-transformed fold change for doxycycline-treated Irf4-/- cDC2 (log2FC DOX/KO); the log2-transformed fold change for Irf4-/- cDC2 (log2FC KO/WT); the FDR-corrected p-values (FDR); the Uniprot accession number; gene synonyms; the UniProt info; and the UniProt protein name. Table is separated into two panels for genes showing concordant versus discordant regulation by CPT and IRF4. Supplementary Table 13: Common genes encoding plasma membrane proteins. Table shows the 239 differentially expressed genes common to CPT-treatment Irf4-/- or IRF4 over-expression that are annotated to encode plasma-membrane proteins. Columns indicate gene symbol; chromosome; start and end positions of the gene; chromosome strand; stable Ensembl gene ID; description of the gene; mean read counts for CPT-treated WT (CPT), untreated WT (Untreated), doxycycline-treated Irf4-/- (DOX), Irf4-/- (IRF4-KO), and WT littermate (WT) cDC2 cells; the log2-transformed fold change for CPT-treated cDC2 (log2FC CPT/UN); the log2-transformed fold change for doxycycline-treated Irf4-/- cDC2 (log2FC DOX/KO); the log2-transformed fold change for Irf4-/- cDC2 (log2FC KO/WT); the FDR-corrected p-values (FDR); the Uniprot accession number; gene synonyms; the UniProt info; and the UniProt protein name. Table is separated into two panels for genes showing concordant versus discordant regulation by CPT and IRF4. Supplementary Table 14: Chromatin accessibility by ATACseq. Table shows the genome-wide ATACseq peak enrichment for CPT-treated cDC2, Irf4-/- cDC2, or IRF4 over-expressing Irf4-/- cDC2. Sequence reads were analyzed using HOMER. Columns indicate peak-ID; chromosome; start and end positions of the peak; chromosome strand; peak score; the focus ratio for the region size; the location of the peak; the distance to nearest transcription start site (TSS); the nearest promoter ID; the Entrez ID; the nearest Unigene ID; the nearest RefSeq gene; the nearest Ensembl gene ID; the gene symbol; gene aliases; the description of the gene; the type of gene; the sequence tag counts; and the peak p-value and adjusted p-value. Table is split into three panels for CPT-treated, Irf4-/- enriched, or IRF4 over-expression enriched peaks. Supplementary Table 15: ChIPseq and ATACseq datasets used in this paper. Table shows ChIP target, SRA file numbers, cells used to generate data, and publication reference. Supplementary Table 16: IRF4-super enhancers in BMDC. Table shows the IRF4 super enhancers derived from IRF4 ChIPseq data. Sequence reads were analyzed using HOMER. Columns indicate peak-ID; chromosome; start and end positions of the peak; chromosome strand; peak score; the focus ratio for the region size; the location of the peak; the distance to nearest transcription start site (TSS); the nearest promoter ID; the Entrez ID; the nearest Unigene ID; the nearest RefSeq gene; the nearest Ensembl gene ID; the gene symbol; gene aliases; the type of gene; and the description of the gene.
- https://cdn.elifesciences.org/articles/49416/elife-49416-supp1-v1.xlsx
-
Transparent reporting form
- https://cdn.elifesciences.org/articles/49416/elife-49416-transrepform-v1.docx
Download links
A two-part list of links to download the article, or parts of the article, in various formats.
Downloads (link to download the article as PDF)
Open citations (links to open the citations from this article in various online reference manager services)
Cite this article (links to download the citations from this article in formats compatible with various reference manager tools)
Inhibition of IRF4 in dendritic cells by PRR-independent and -dependent signals inhibit Th2 and promote Th17 responses
eLife 9:e49416.
https://doi.org/10.7554/eLife.49416


