Single-cell transcriptomes and whole-brain projections of serotonin neurons in the mouse dorsal and median raphe nuclei
- Stanford University, United States
- National Institute of Biological Science, China
- Stanford University School of Medicine, United States
- Wuhan National Laboratory for Optoelectronics, Huazhong University of Science and Technology (HUST), China
- HUST-Suzhou Institute for Brainsmatics, JITRI Institute for Brainsmatics, China
- Tsinghua University, China
- Chan Zuckerberg Biohub, United States
Figures
Figure 1 with 6 supplements

Single-cell transcriptomic profiling of serotonergic neurons.
(A) Schematic representation of scRNA-seq pipeline used to analyze individual serotonin neurons. Tissue slices containing either principal dorsal raphe (pDR, n = 6 brains) or entire DR and MR (n = 8 brains) of Sert-Cre;Ai14 adult were dissociated to a single-cell suspension. tdTomato+ neurons were FACS-sorted in 96-well plates and processed for scRNA-seq using Smart-seq2 protocol. tSNE plot of all processed Tph2+ neurons colored by anatomical localization. cDR, caudal DR; MR, median raphe. (B) tSNE plot of 999 Tph2+ cells obtained from 14 brains and clustered by gene expression. Cells are colored-coded according to identified transcriptomic clusters. (C) Expression of genes defining distinct serotonin neuron populations. Cells are colored by log-normalized expression of each transcript, and the color legend reflects the expression values of ln(CPM+1). CPM, counts per million. (D) Violin plots of expression of marker genes across 11 clusters.
Figure 1—figure supplement 1
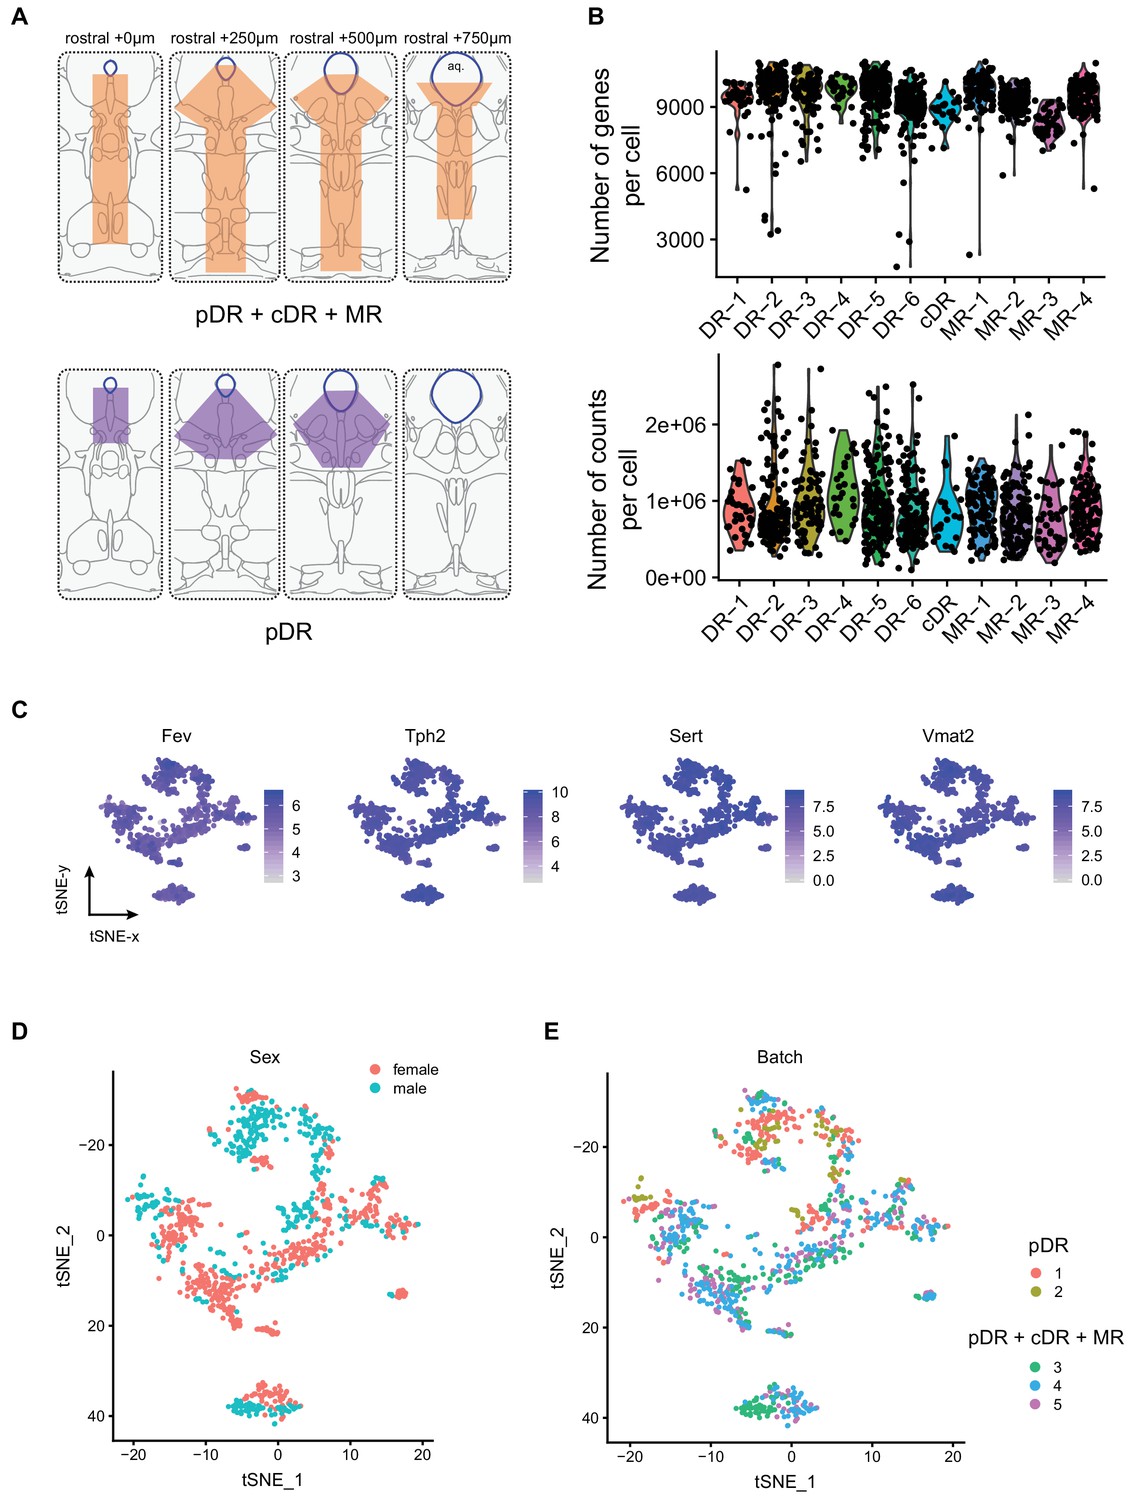
Technical characteristics of scRNA-seq experiments.
(A) Schematic illustration of the sampling strategy. Top, orange shadows indicate dissected regions in the coronal brainstem sections in the first set of experiments. These regions contain the entire MR and DR. Bottom, purple shadows indicate dissected regions in the coronal brainstem sections in the second set of experiments. These regions only contain the principal DR. aq, aqueduct. (B) Number of genes per cell and number of reads per cells mapping to exons across 11 clusters. (C) Expression of Fev, Tph2, Sert and Vmat2 across individual cells. Cells are colored by log-normalized expression of each transcript, and the color legend reflects the expression values of ln(CPM+1). (D,E) tSNE plots of 999 analyzed cells colored by sex (D) and batch (E).
Figure 1—figure supplement 2
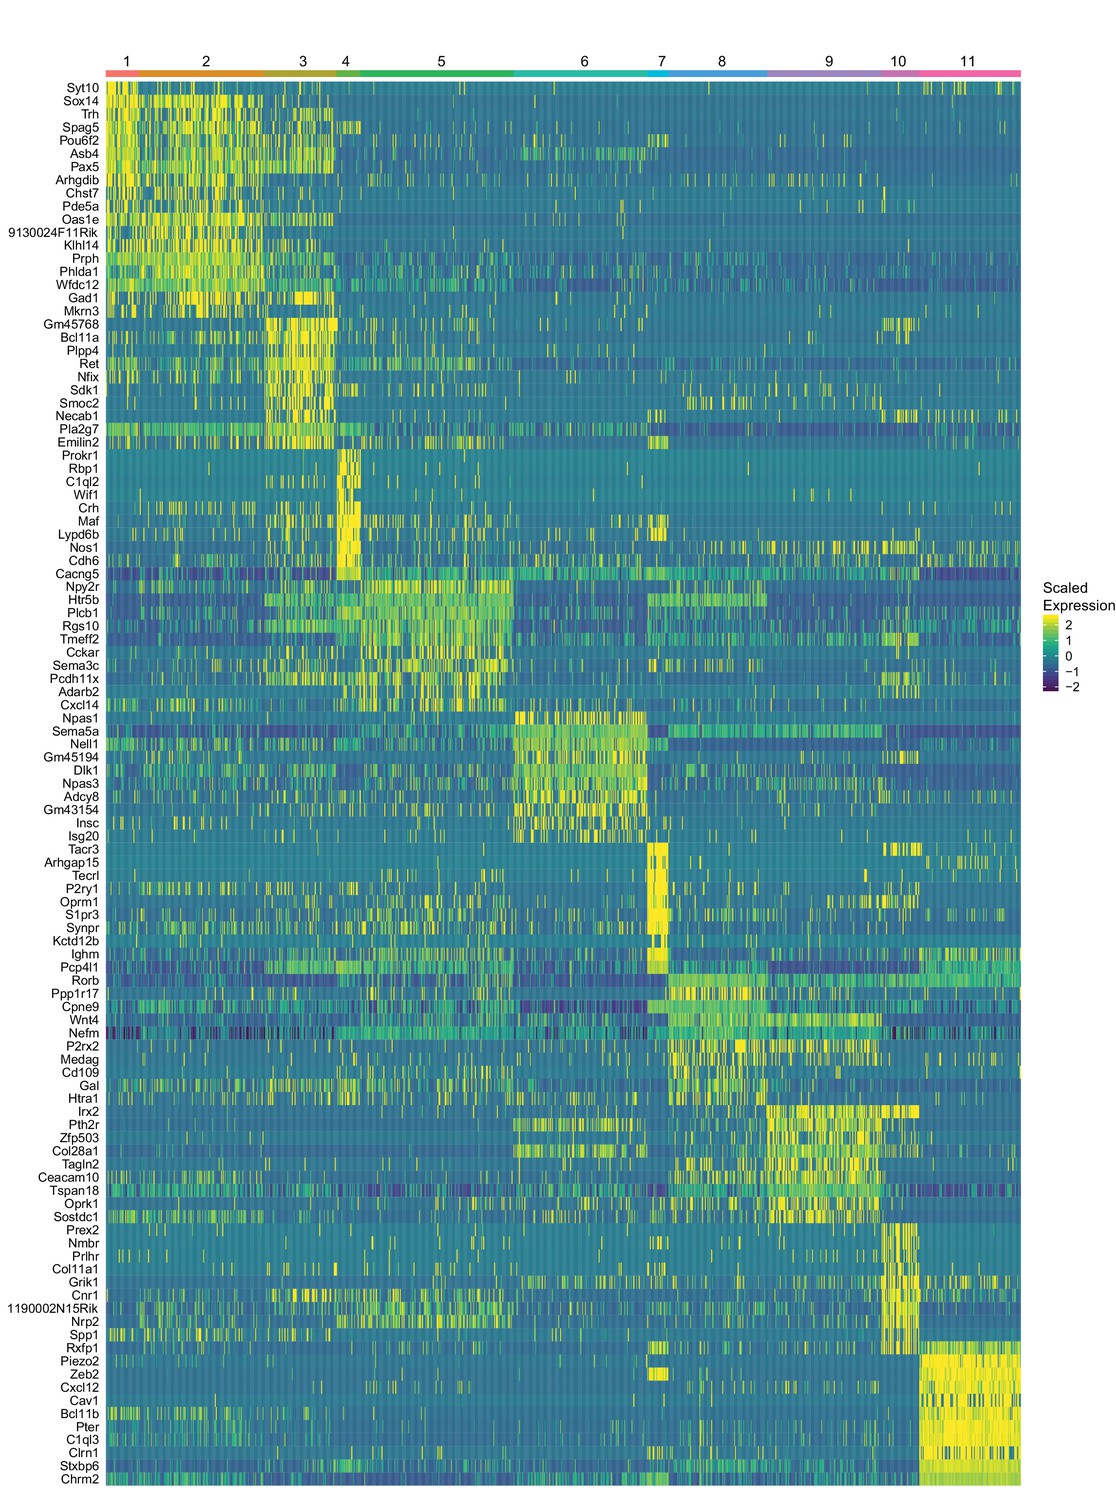
Heatmap of gene expression of top ten marker genes identified for each cluster.
Expression values represent z-scores of ln(CPM+1).
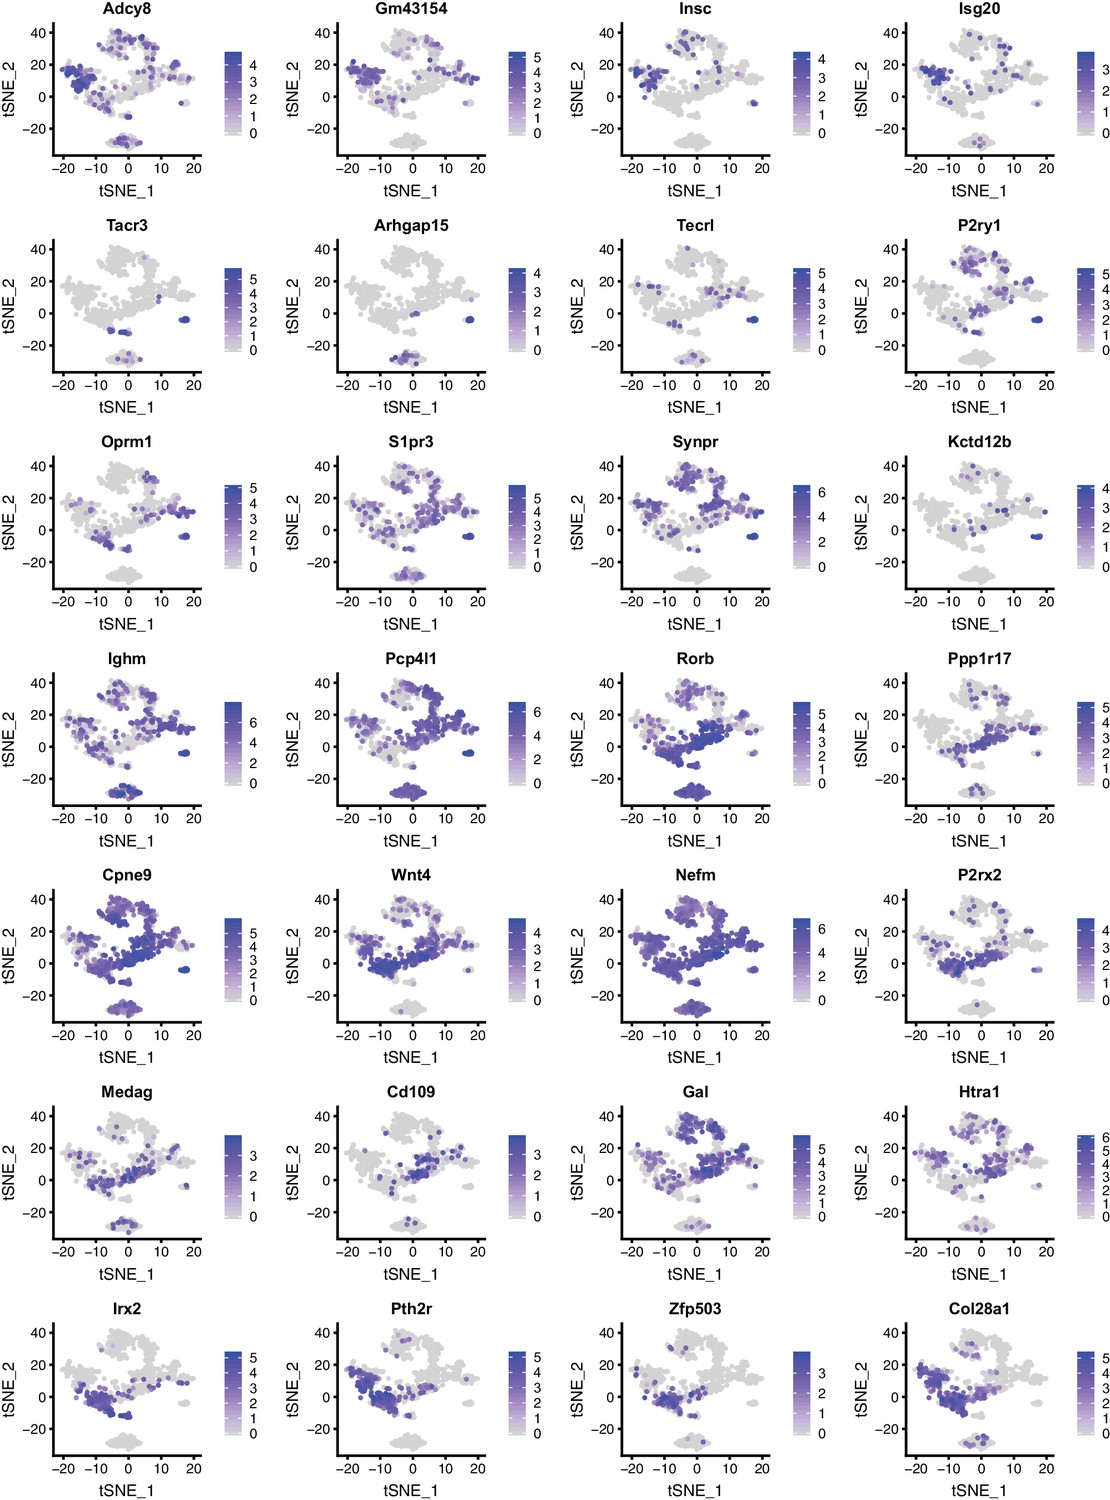
Figure 1—figure supplement 3
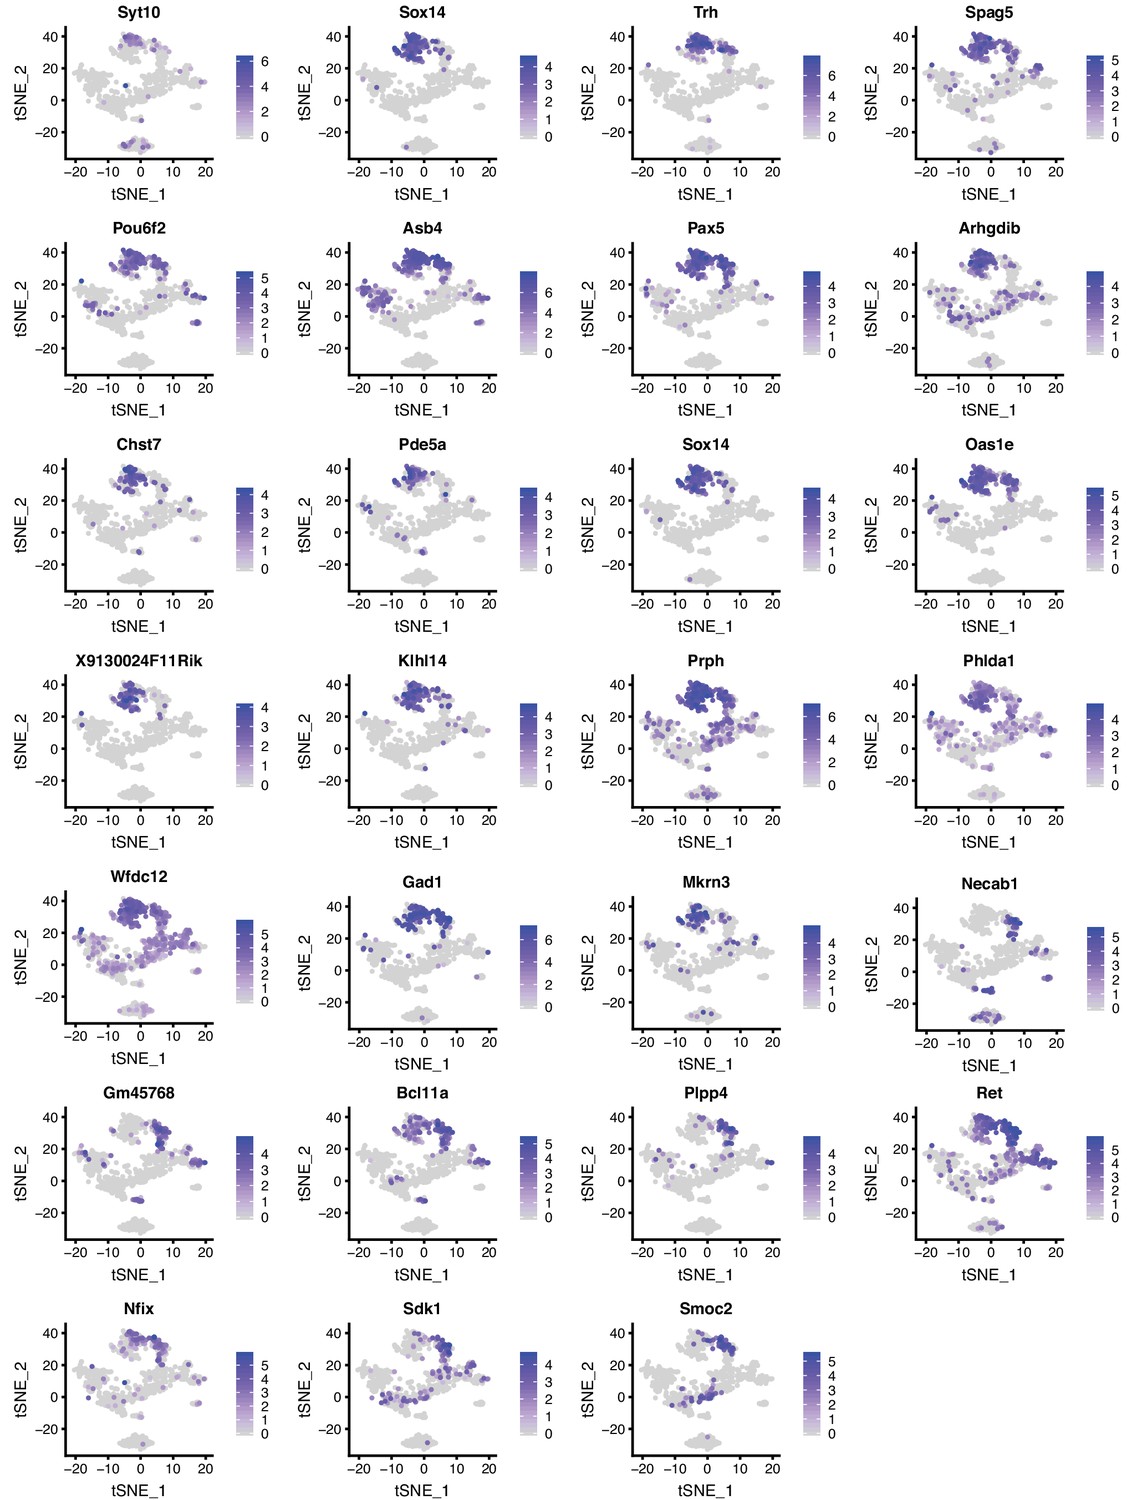
Expression patterns of selected genes in DR and MR across individual serotonin neurons presented as tSNE plots (Part I).
Cells are colored by log-normalized expression of each transcript, and the color legend reflects the expression values of ln(CPM+1).
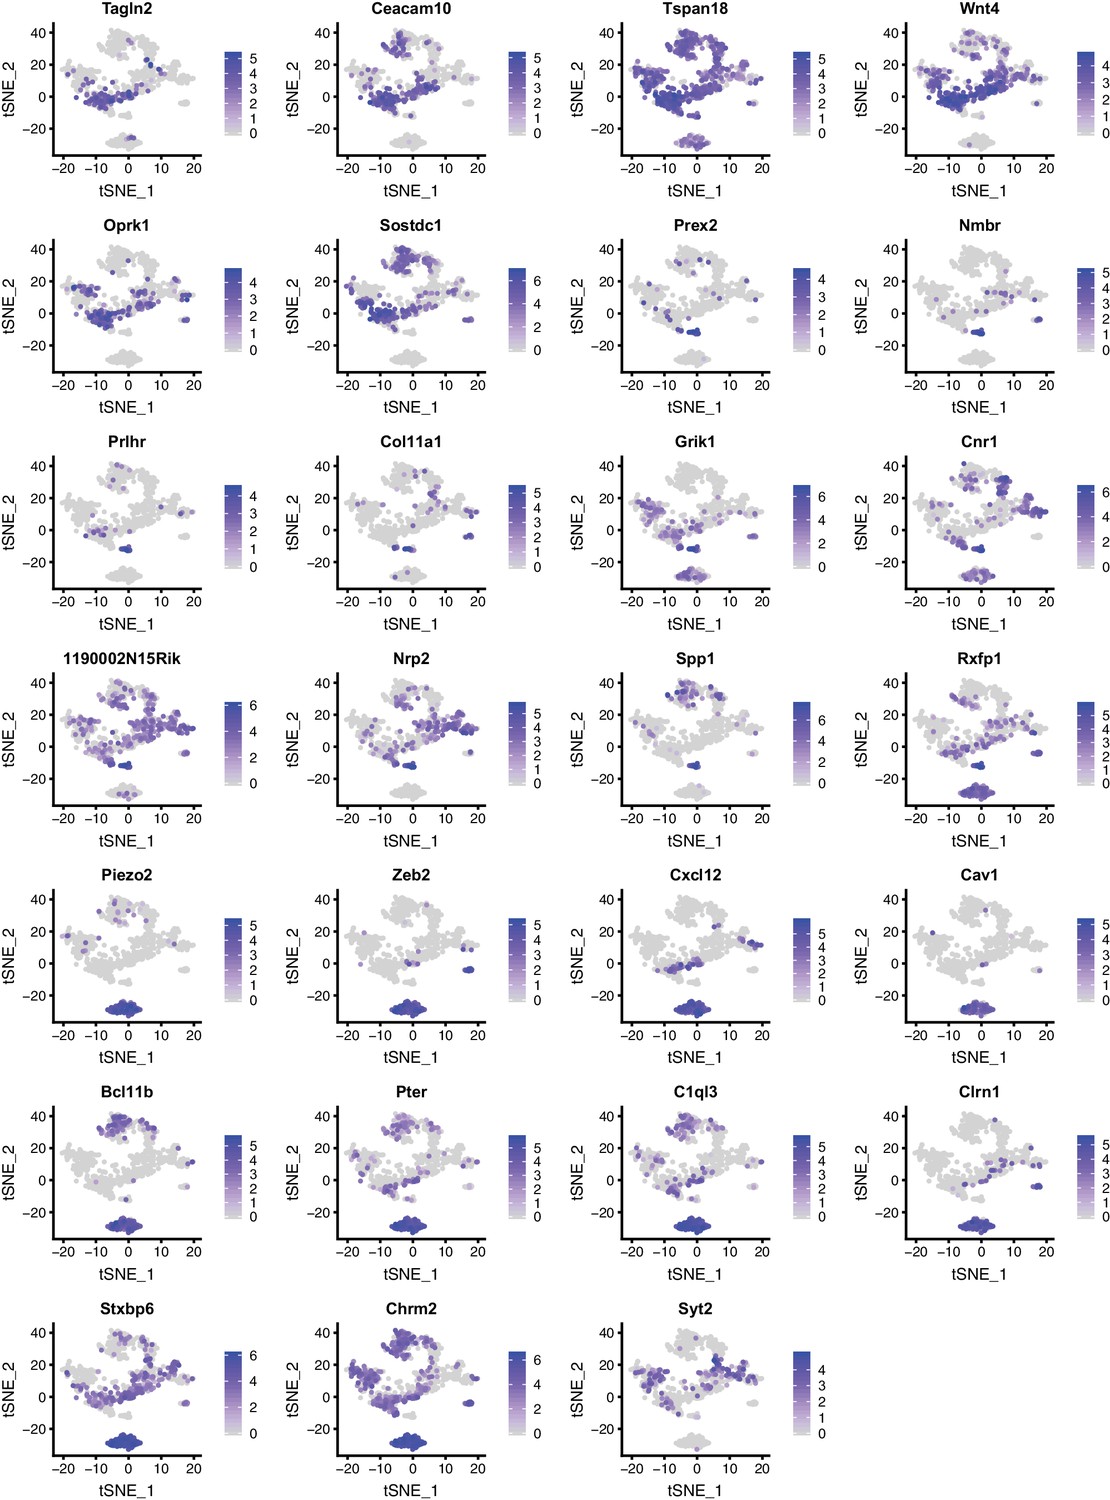
Figure 1—figure supplement 4
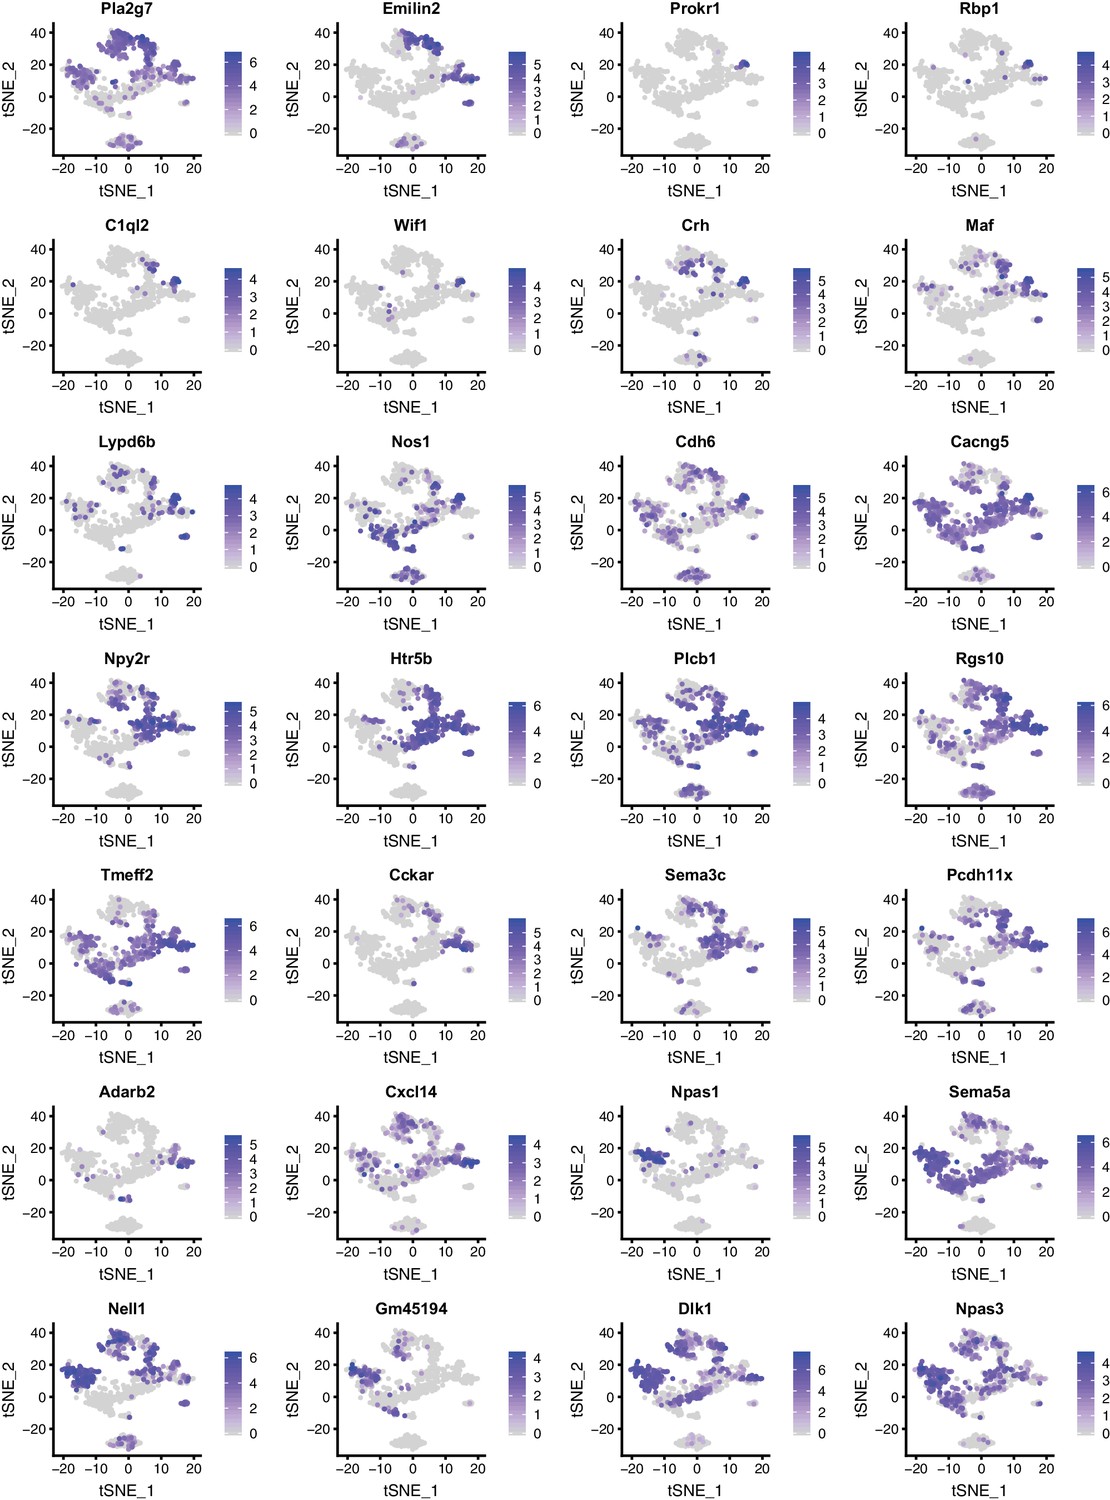
Expression patterns of selected genes in DR and MR across individual serotonin neurons presented as tSNE plots (Part II).
https://doi.org/10.7554/eLife.49424.006
Figure 1—figure supplement 5
Expression patterns of selected genes in DR and MR across individual serotonin neurons presented as tSNE plots (Part III).
https://doi.org/10.7554/eLife.49424.007
Figure 1—figure supplement 6
Expression patterns of selected genes in DR and MR across individual serotonin neurons presented as tSNE plots (Part IV).
https://doi.org/10.7554/eLife.49424.008
Figure 2 with 2 supplements
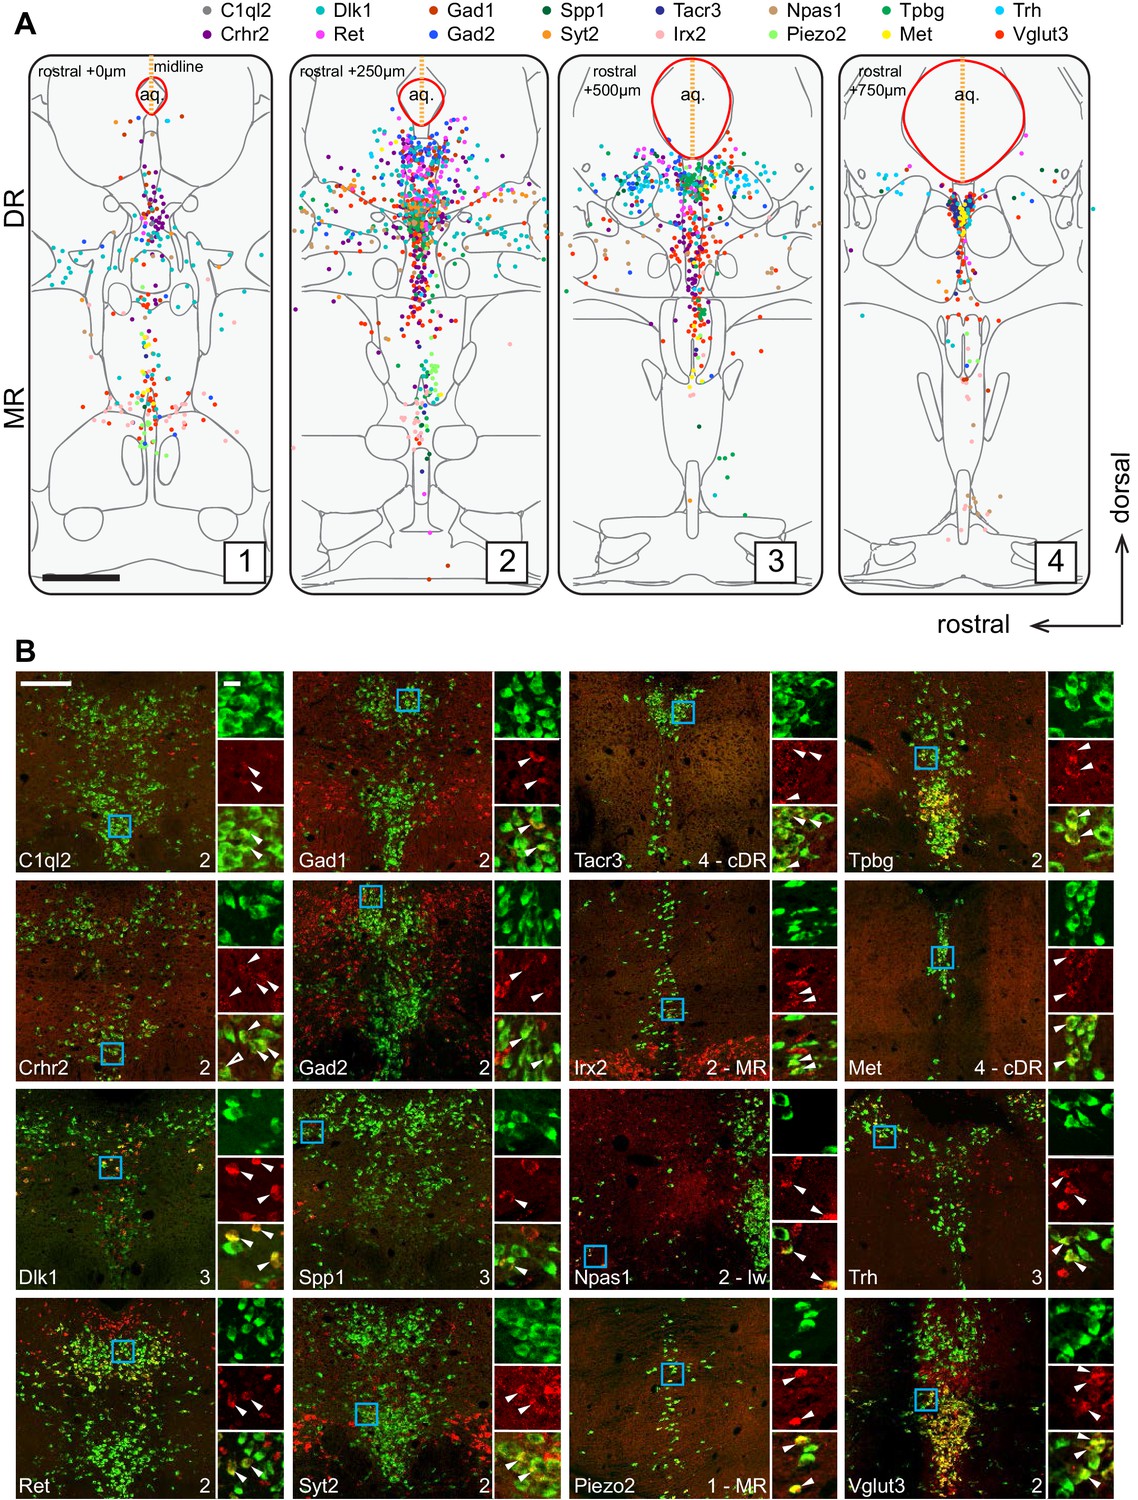
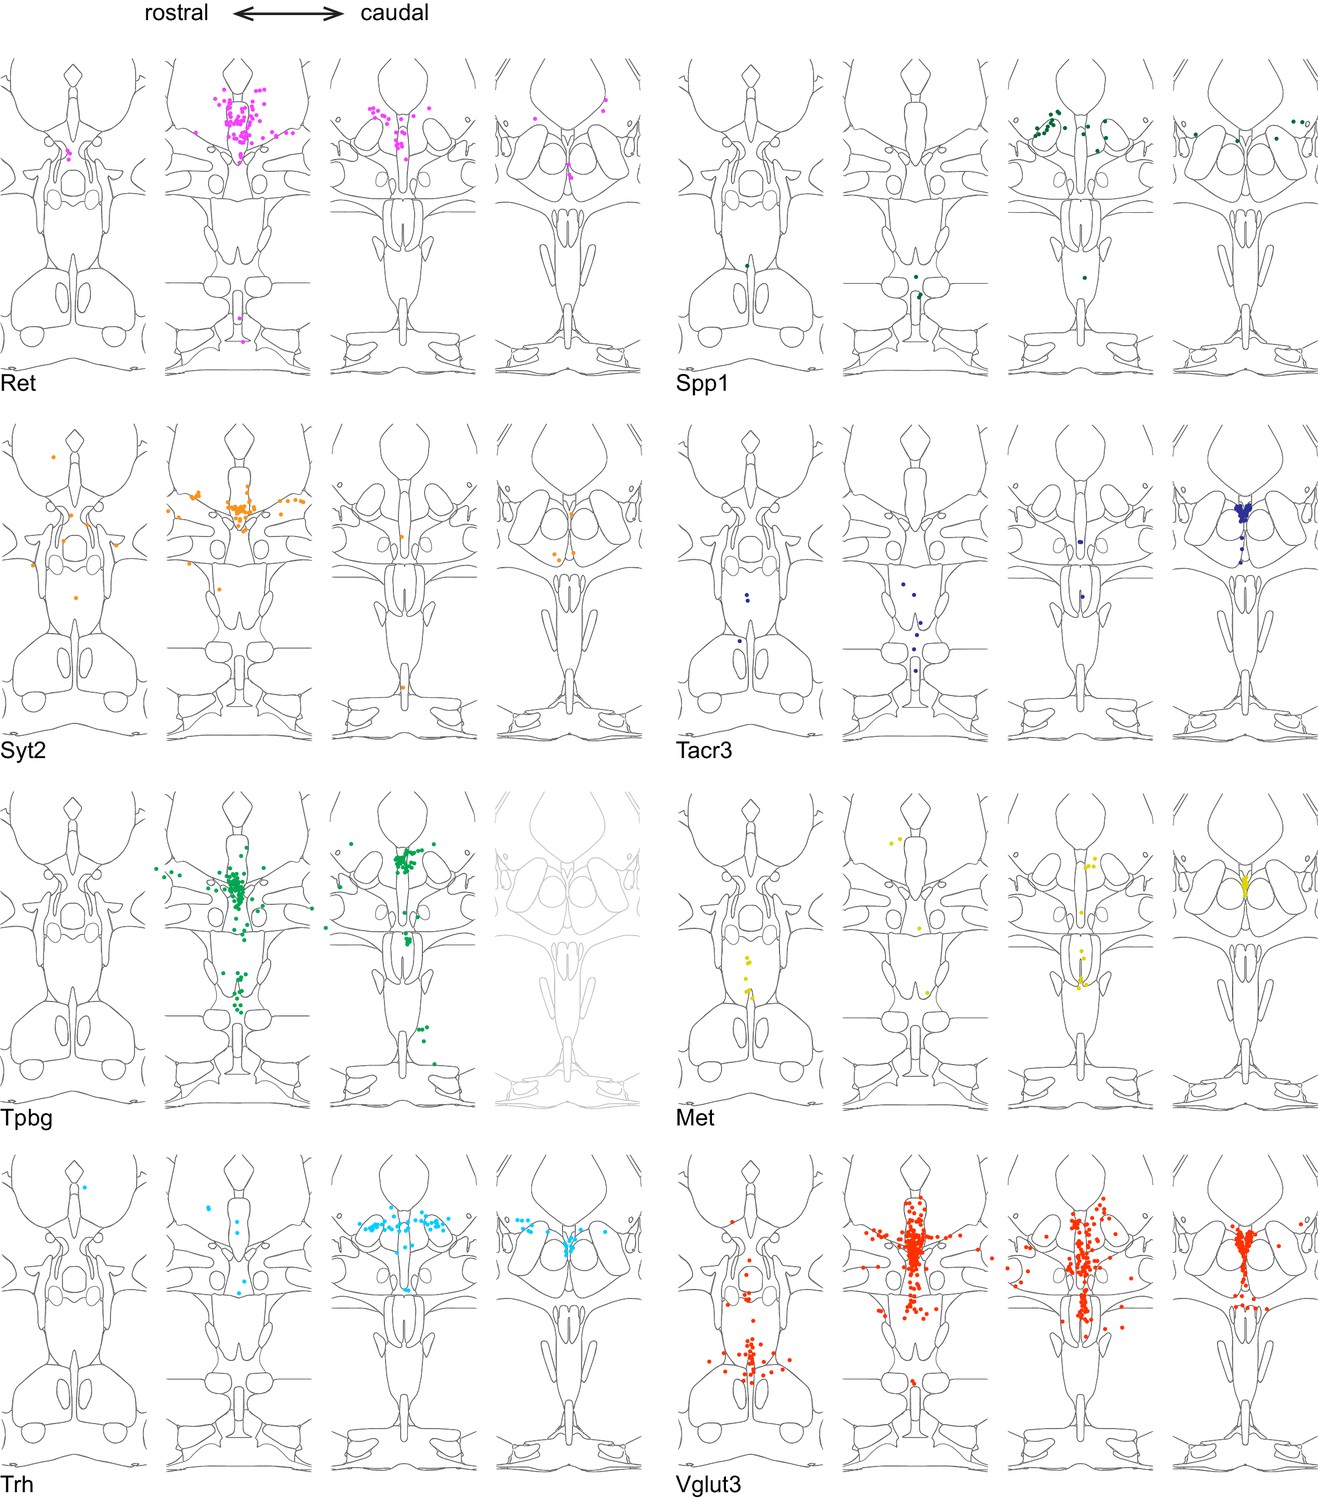
Anatomical location of serotonin neuron clusters determined by hybridization-chain reaction-based single-molecule fluorescence in situ hybridization (HCR-smFISH) of 16 cluster markers.
(A) Positions of double-positive neurons (Tph2 and each of 16 marker genes color-coded on the top) are shown on four schematics representing coronal slices 250 µm apart. Red line around the aqueduct represents the average boundary drawn from raw data for each slice. Scale bar, 500 µm. Schematics summarizing HCR-smFISH data for individual genes can be found in Figure 2—figure supplements 1 and 2. (B) Representative images for each of the genes schematized in (A). All green cells are Tph2-positive, red cells express the indicated marker gene. Each image corresponds to one of the four numbered schematics in (A) and is located immediately ventral to the aqueduct unless otherwise noted as MR, lateral wing (lw), or cDR. Cyan box highlights the individual color zoom region at right. White arrowheads mark examples of double-positive neurons. Scale bars, 200 µm main panels, 20 µm zoom panels.
Figure 2—figure supplement 1
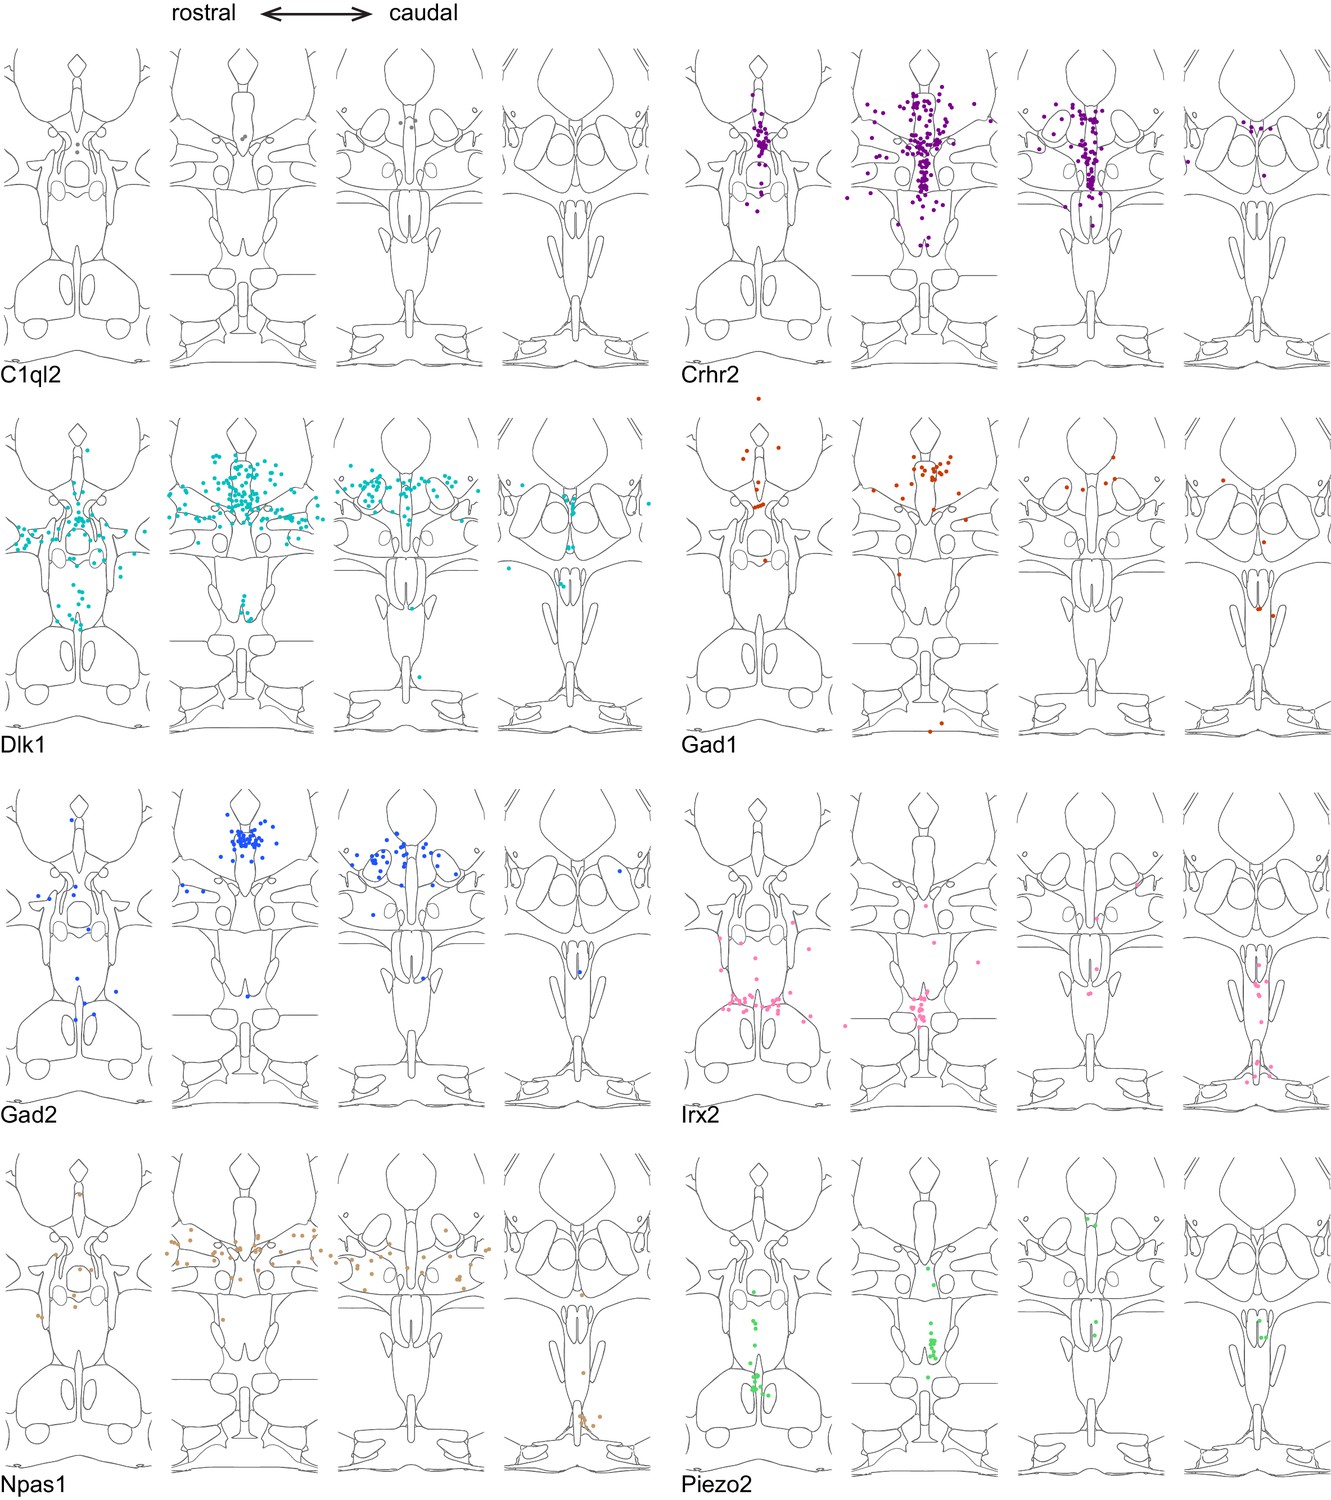
Location of cluster marker genes determined by HCR-smFISH (Part I).
Schematics as described in Figure 2, broken out to show double-positive cells for Tph2 and one marker gene at a time.
Figure 2—figure supplement 2
Location of cluster marker genes determined by HCR-smFISH (Part II).
https://doi.org/10.7554/eLife.49424.011
Figure 3 with 4 supplements
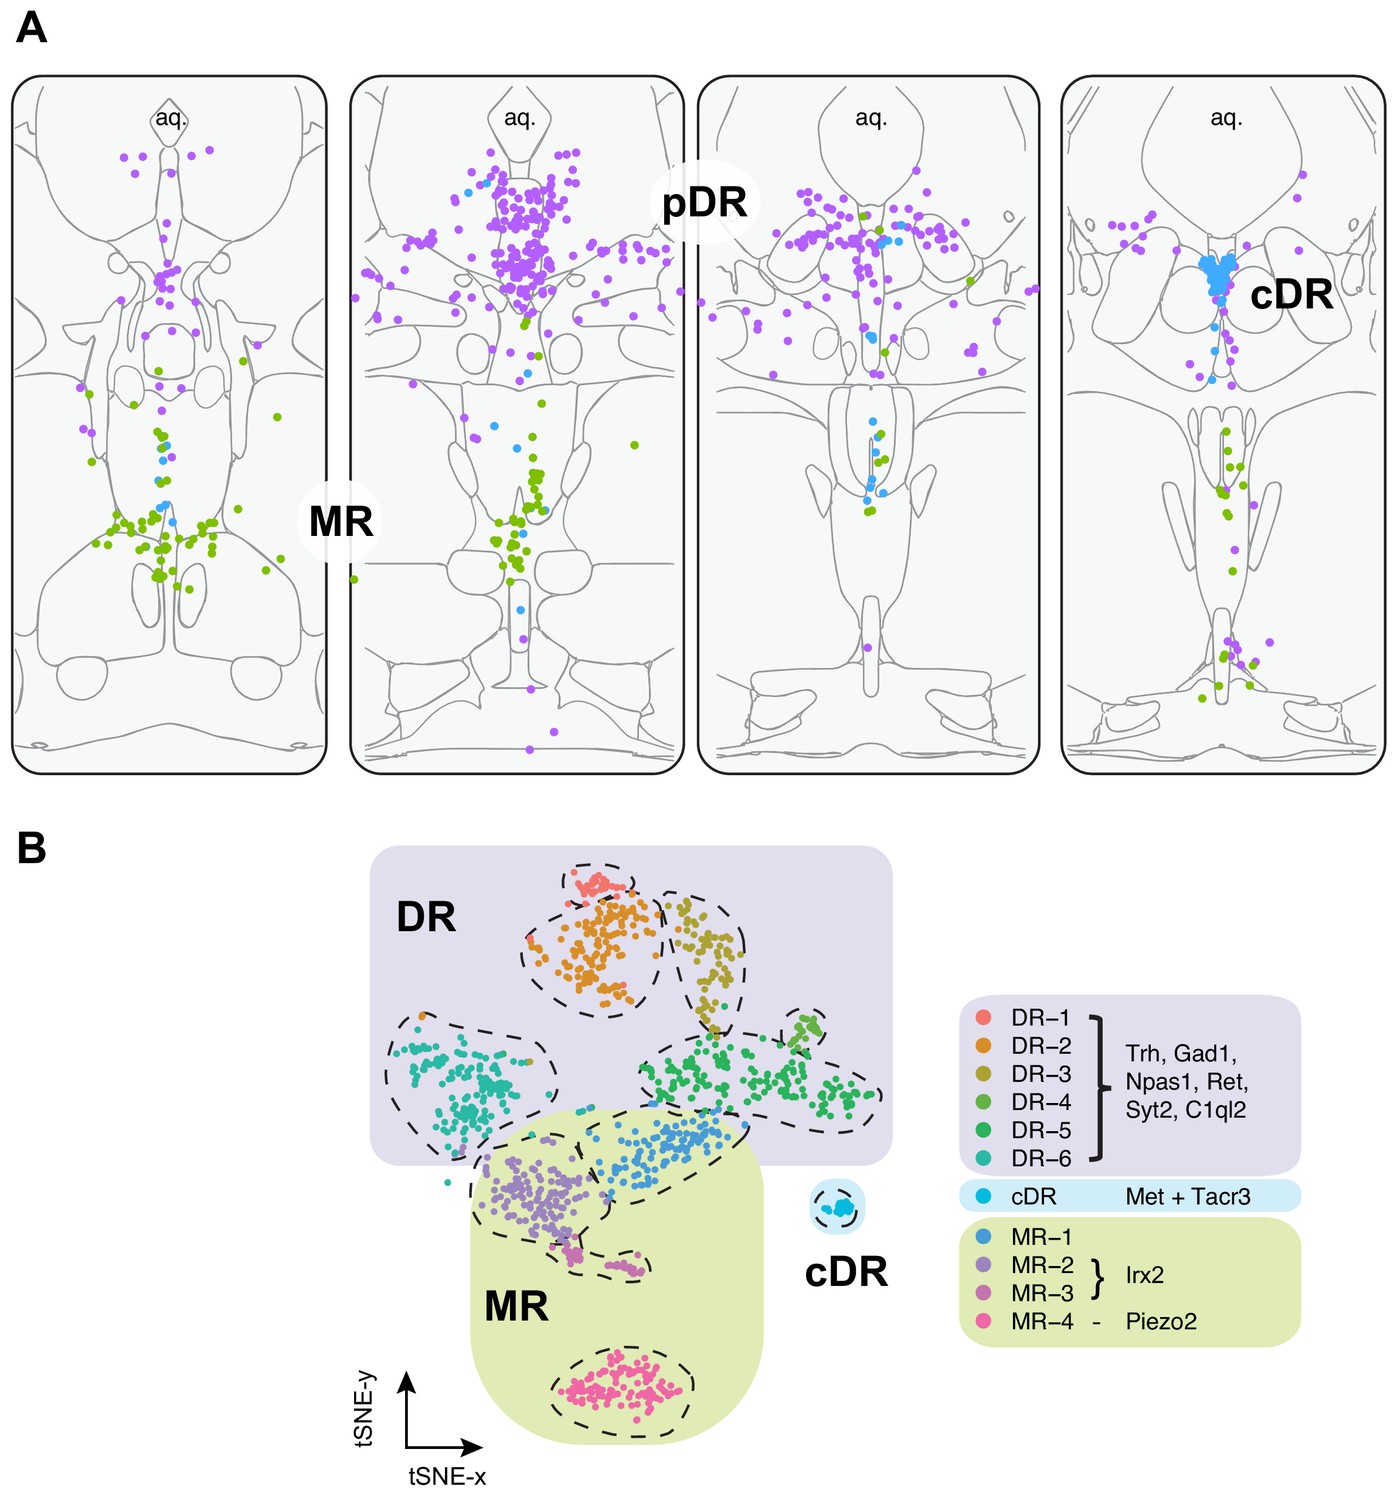
Summary of spatial distribution of transcriptomic clusters of serotonin neurons.
(A) Purple dots represent distribution of Clusters 1–6 markers listed in panel (B); green dots represent the distribution Irx2 and Piezo2 cells that are Cluster 9–11 markers; and cyan dots present distribution of Met+ and Tacr3+ cells, which are co-expressed in Cluster 7, but is additionally expressed in Cluster 10 (Met) or Cluster 11 (Tacr3). (B) Collectively, scRNA-seq and HCR-smFISH experiments support the model that Clusters 1–6 from Figure 1B correspond to pDR serotonin neurons (renamed DR-1–6), Cluster 7 corresponds to cDR serotonin neurons, and Clusters 8–11 correspond to MR serotonin neurons (renamed MR-1–4).
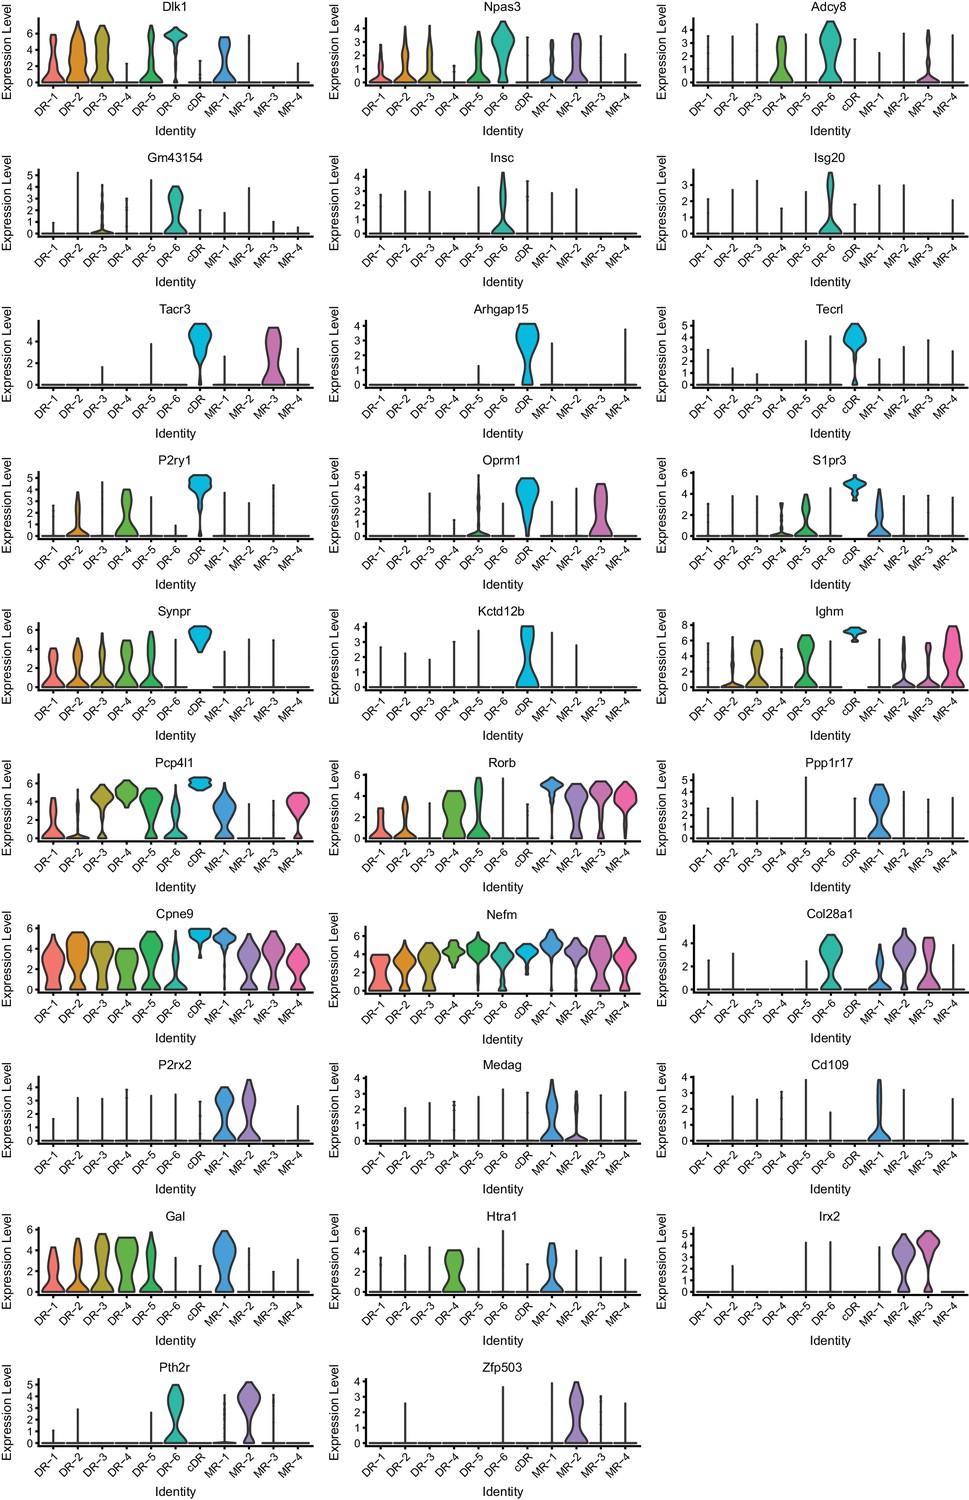
Figure 3—figure supplement 1

Expression of marker genes across 11 clusters (Part I).
Expression levels denote for log-transformed expression [ln(counts per million+1)] of each transcript.
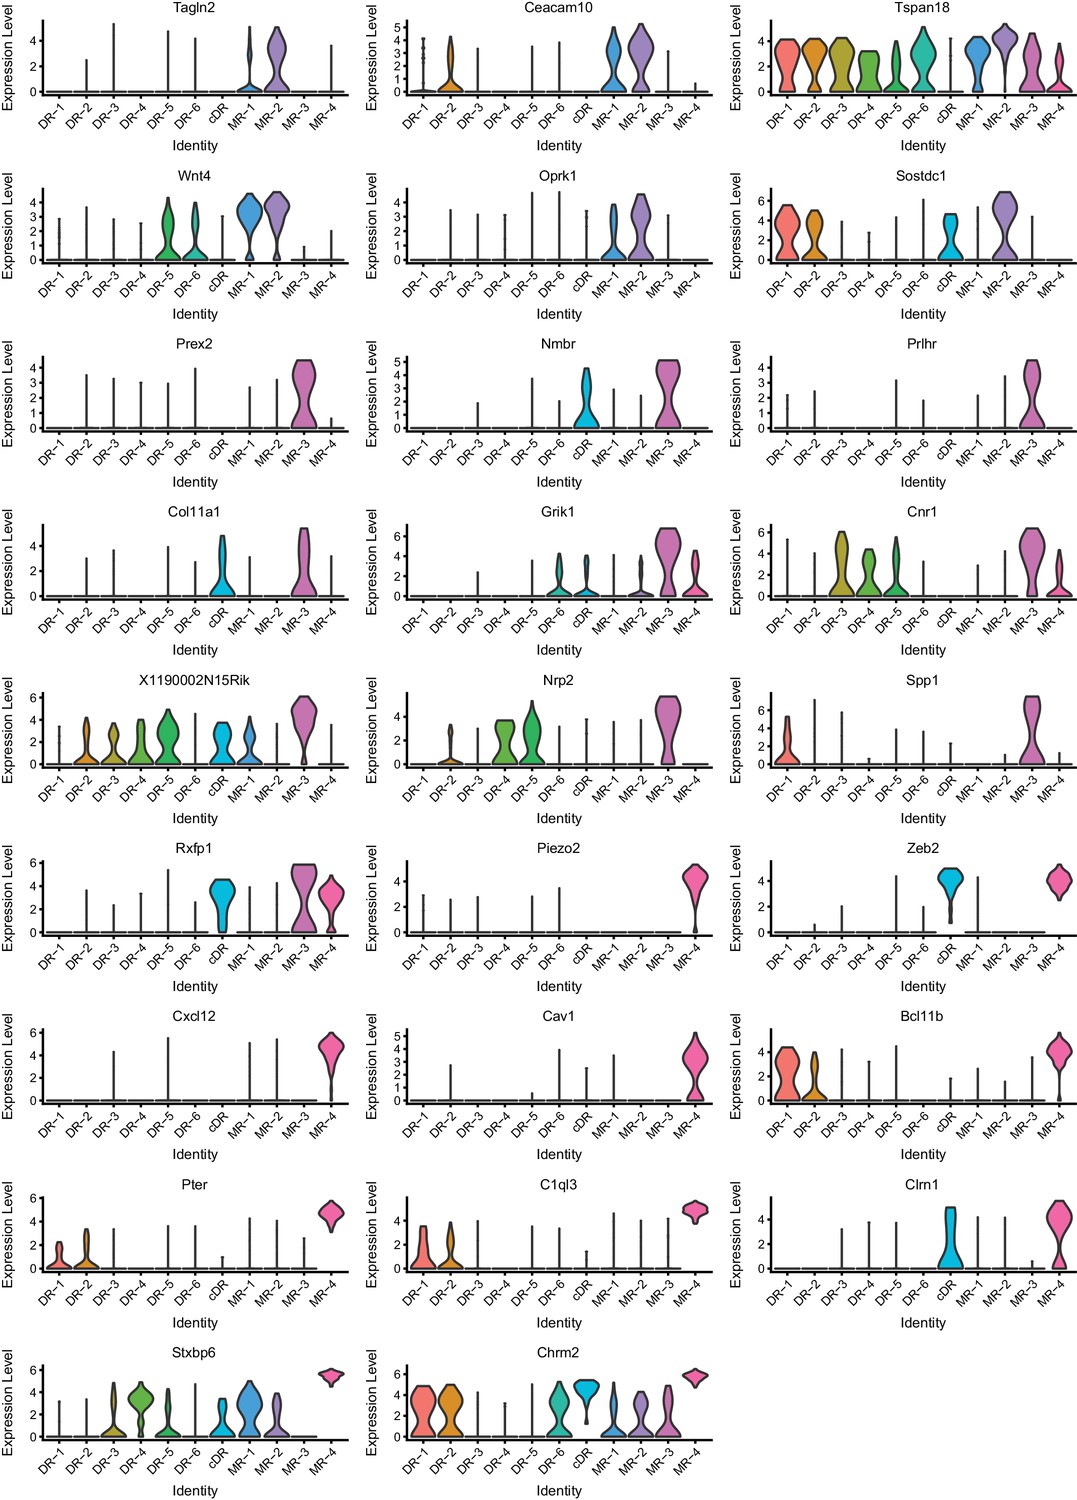
Figure 3—figure supplement 2
Expression of marker genes across 11 clusters (Part II).
https://doi.org/10.7554/eLife.49424.014
Figure 3—figure supplement 3
Expression of marker genes across 11 clusters (Part III).
https://doi.org/10.7554/eLife.49424.015
Figure 3—figure supplement 4
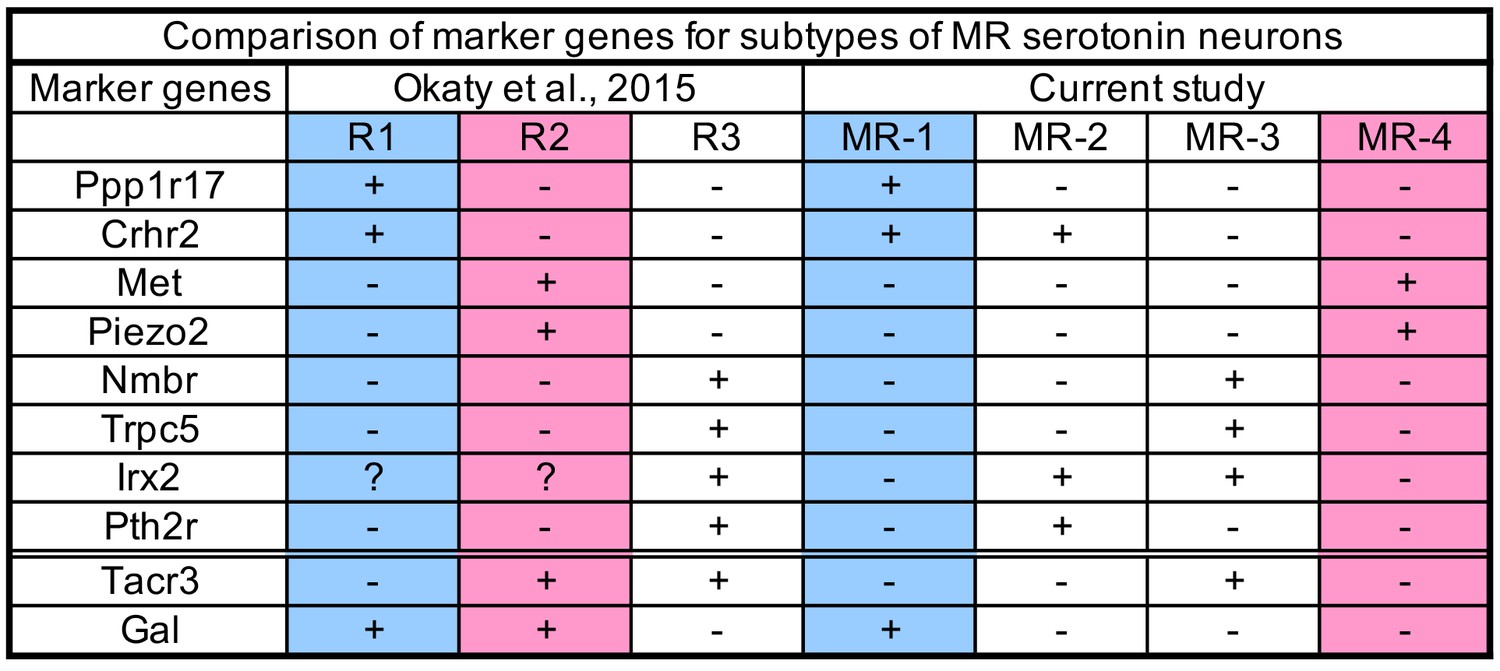
Comparison of Marker Genes for Subtypes of MR Serotonin Neurons.
Ten marker genes that are enriched in R1–R3-derived serotonin neurons from the Okaty et al. (2015) study (data taken from its Figure 2D, Figure S2, and Figure S5C) and MR-1–MR-4 transcriptomic clusters from this study. ‘+” indicate enriched compared to ‘–” in respective studies. The first eight markers support the correspondence between R1 and MR-1 (blue), R2 and MR-4, R3 and MR-2/3. The last two markers are not fully consistent.
Figure 4 with 2 supplements
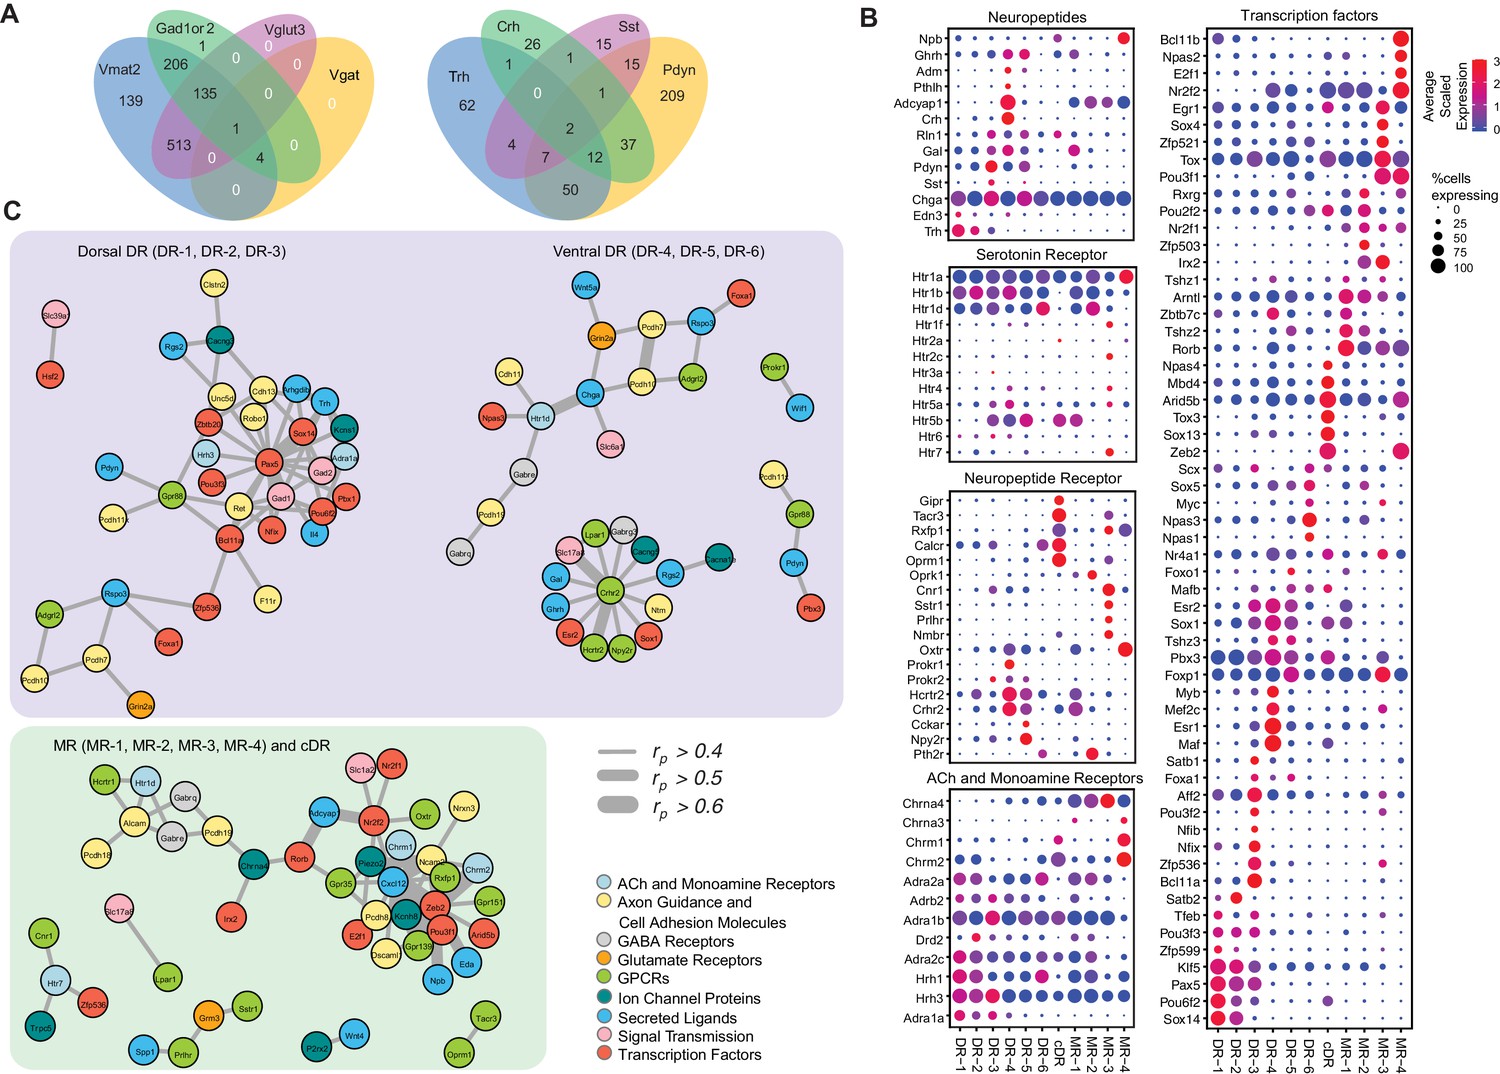
Molecular and functional characteristics of distinct serotonin neuron clusters.
(A) Venn diagram showing the number of cells co-expressing genes associated with markers for different neurotransmitter systems: Gad1/2, Vmat2, Vgat, and Vglut3 (left) and neuropeptides: Trh, Crh, Sst, Pdyn (right). We consider a gene to be expressed if it has at least one read mapping to it and is detected in at least 3 cells (Materials and methods). (B) Expression of the most variable neuropeptides, receptors, and transcription factors across molecularly distinct serotonin neuron clusters. (C) Network representation of co-expressed genes that belong to one of the functional gene categories that organize transcriptional regulation, synaptic connectivity, and neuronal communications. Networks were constructed based on Pearson correlation coefficient (rp) of gene expression across all 999 cells, and identified networks that are centered on pDR- and MR+cDR-specific genes. Genes appear connected if rp >0.4. Line width represents rp values as indicated. Nodes are colored according to functional gene categories.
Figure 4—figure supplement 1

Expression of the most variable genes among the listed functional categories across 11 molecularly distinct Tph2+ clusters.
https://doi.org/10.7554/eLife.49424.018
Figure 4—figure supplement 2
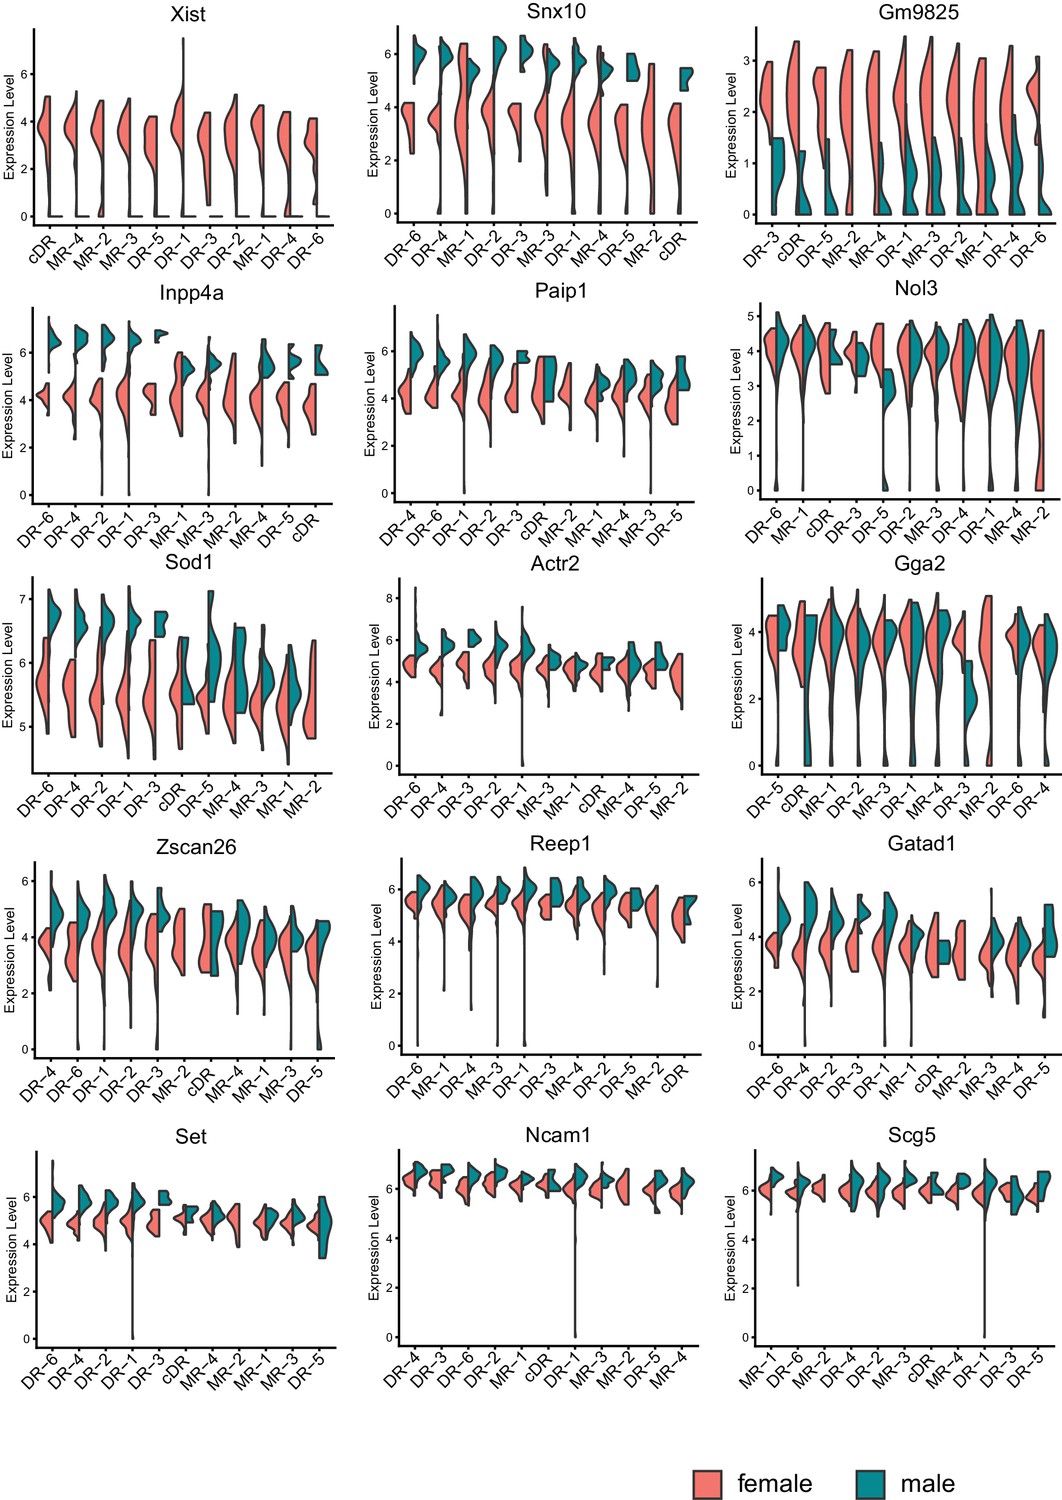
Sexually dimorphic genes consistently detected across the majority of serotonin cell subtypes.
Expression levels denote for log-transformed expression [ln(CPM+1)] of each transcript.
Figure 5
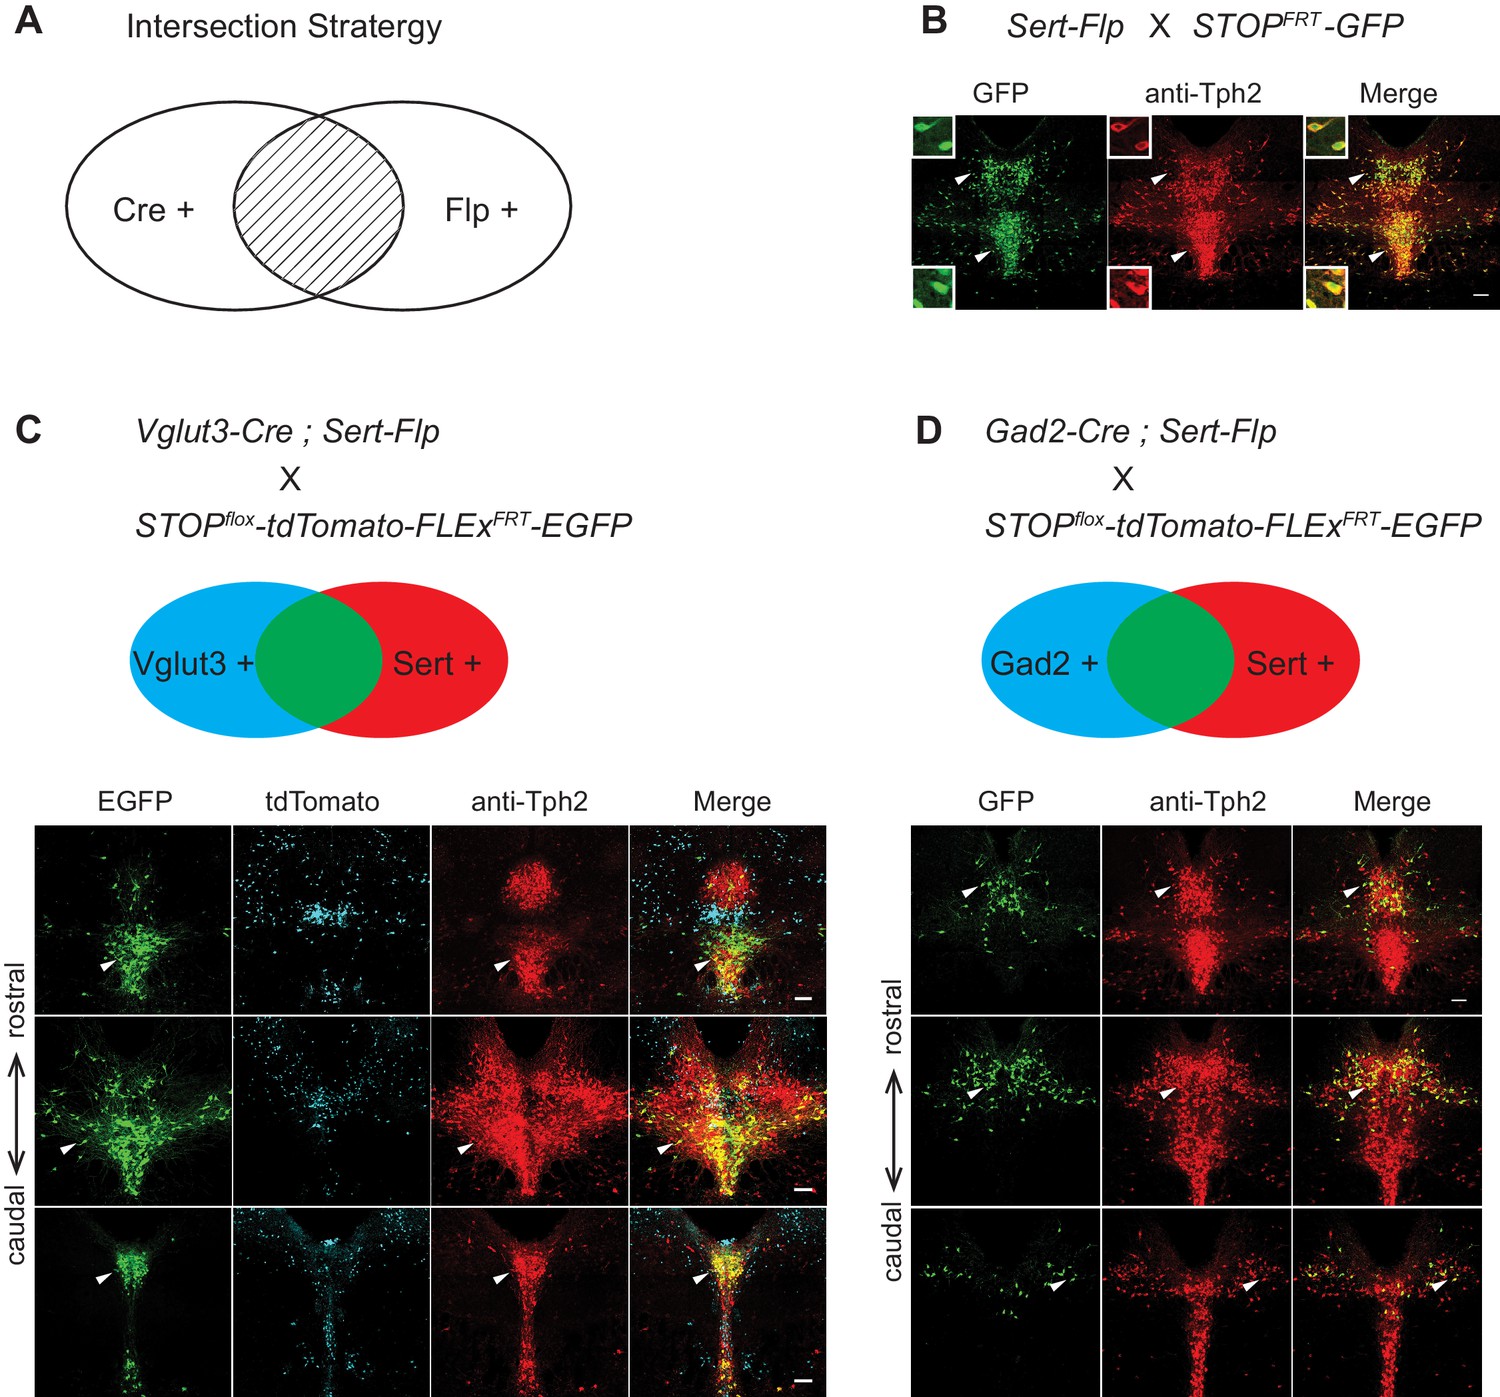
Intersectional strategy to genetically access specific serotonin neuron populations.
(A) Schematic representing cells dually gated by Cre- and Flp-expression. (B) Sert-Flp mice were crossed with H11-CAG-FRT-STOP-FRT-EGFP (STOPFRT-GFP) mice. Anti-Tph2 staining (red) was performed on consecutive coronal sections containing DR. 98.5% GFP+ neurons are Tph2+ and 100% Tph2+ neurons are GFP+ (n = 3 mice). Insets: magnified images showing the neurons indicated with arrowheads in individual channels. Scale, 25 µm. (C) In mice triple transgenic for Vglut3-Cre, Sert-Flp, and the IS reporter (Rosa-CAG-loxP-stop-loxP-FRT-tdTomato-FRT-EGFP), EGFP+ (Flp+Cre+) cells are referentially found in ventral pDR and in cDR (arrowheads). Coronal sections containing DR are shown, counterstained with Anti-Tph2 (red). (D) In mice triple transgenic for Gad2-Cre, Sert-Flp, and the IS reporter, EGFP+ (Flp+Cre+) cells are referentially found in dorsal pDR (arrows). Coronal sections containing DR are shown, counterstained with Anti-Tph2 (red). Scale, 100 µm.
Figure 6
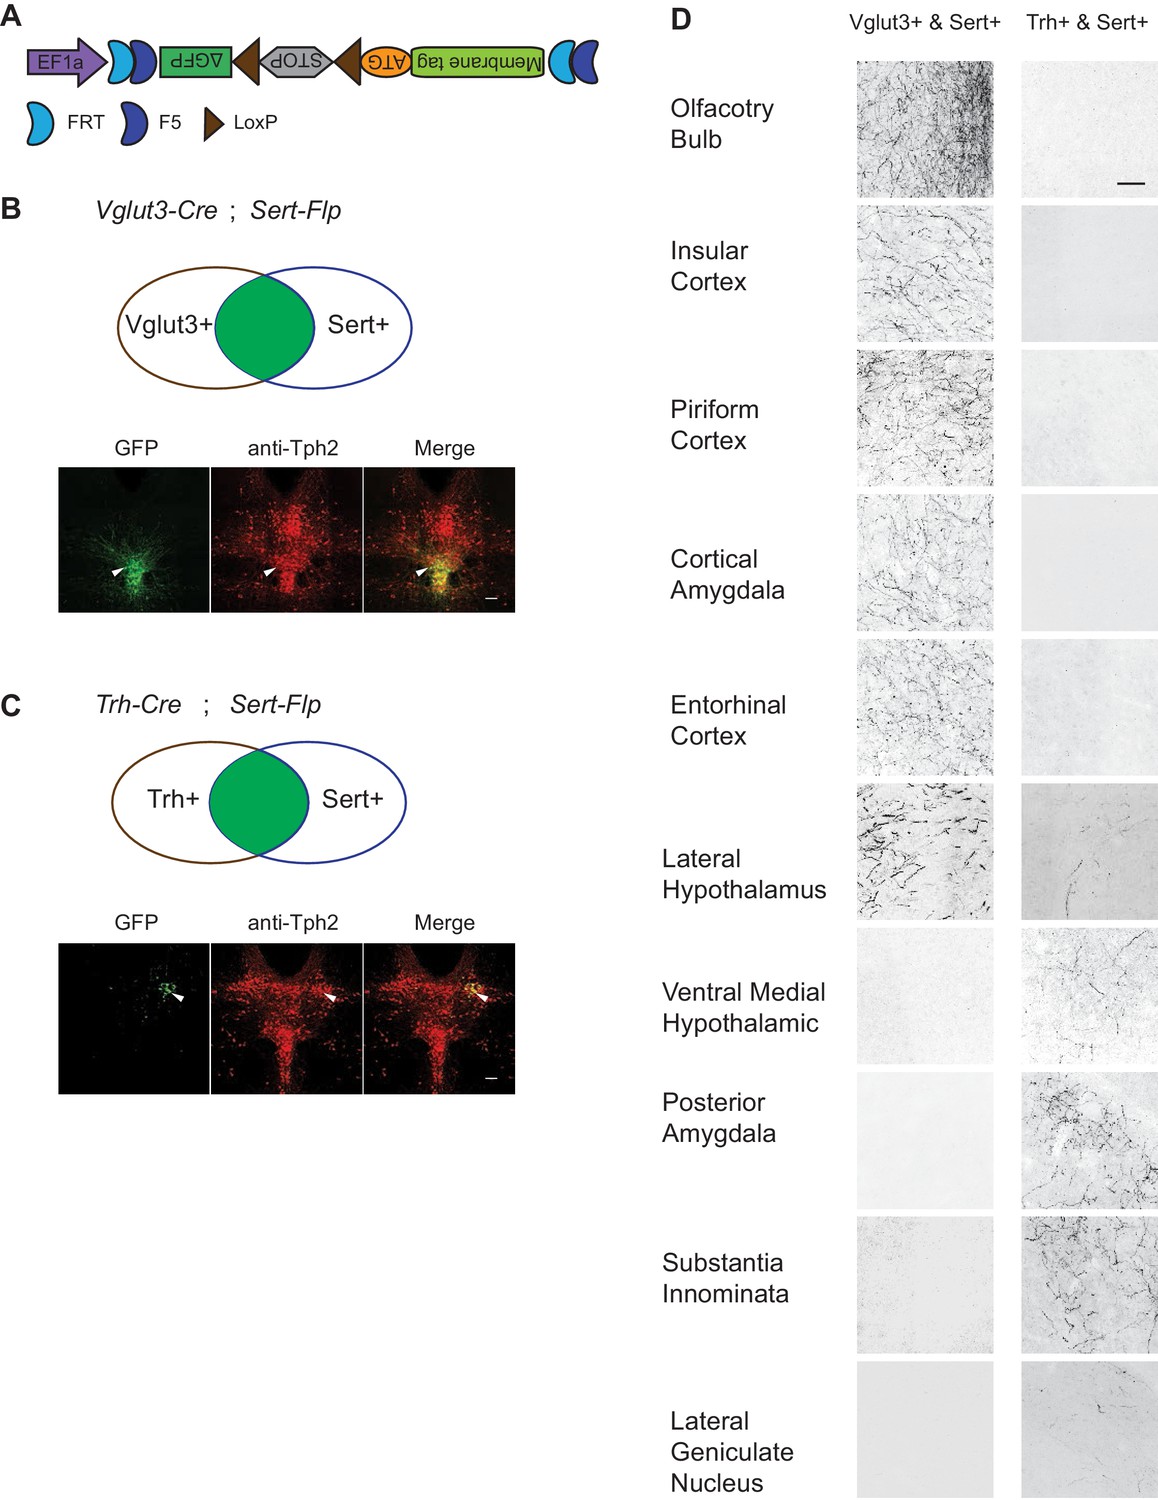
Dually gated serotonin neuron and axonal terminal labeling by viral-genetic intersection.
(A) Schematics representing of the AAV-CreON/FlpON-mGFP dual labeling design. (B) mGFP expression (green) and Tph2 immunoreactivity (red) after injection of AAV-CreON/FlpON-mGFP into the DR of Sert-Flp;Vglut3-Cre mice. mGFP is mostly restricted to ventral pDR. (C) mGFP expression (green) and Tph2 immunoreactivity (red) after injection of AAV-CreON/FlpON-mGFP into the DR of Sert-Flp;Trh-Cre mice. mGFP is mostly restricted to dorsal pDR; the left-right asymmetry was likely due to AAV injection being biased towards the right hemisphere. (D) Axonal terminal expression of mGFP in different brain regions of Sert-Flp;Vglut3-Cre mice and Sert-Flp;Trh-Cre mice. The left and right images represent comparable brain regions cropped from serial coronal sections. Scale, 100 µm.
Figure 7 with 4 supplements
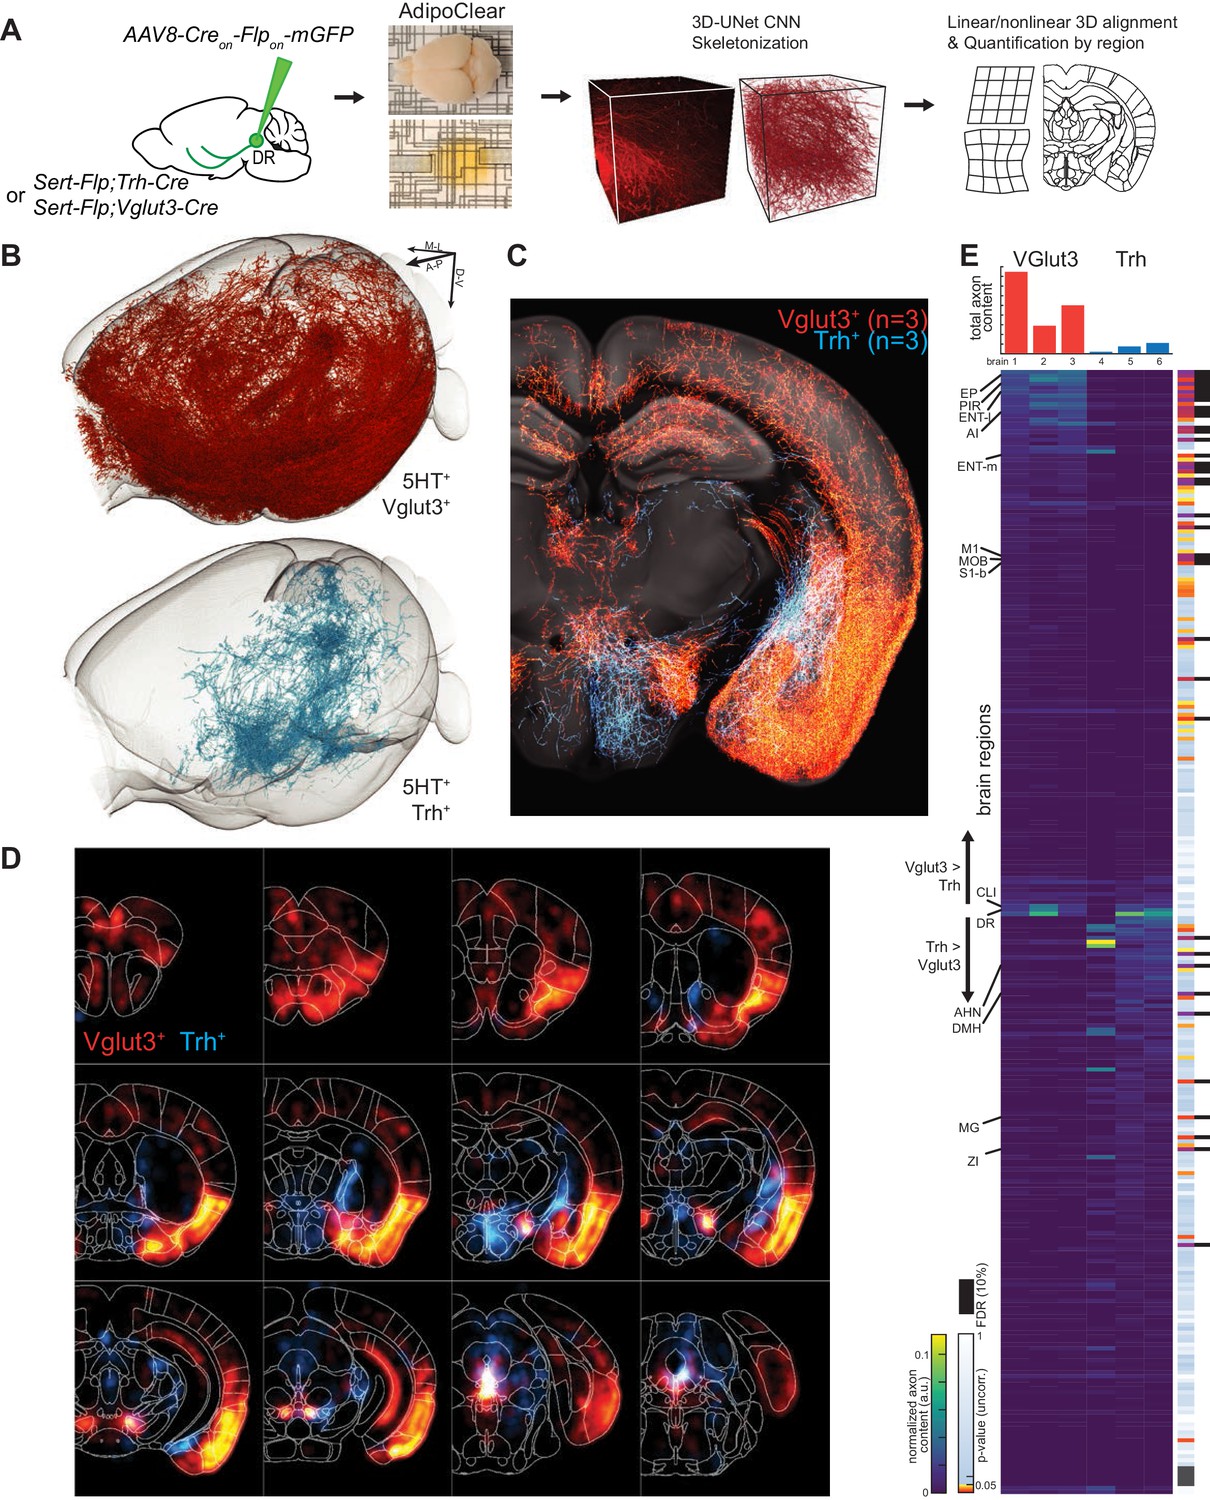
Whole-brain projectome of Trh+ and Vglut3+ serotonin neuron populations.
(A) Experimental schematic outlining the intersectional viral strategy, brain clearing, automated 3D axon segmentation, and alignment to the Allen Brain Institute Common Coordinate Framework. (B) Axonal innervation in a 3D view of the left hemisphere of one representative brain each from the intersection of Sert-Flp and either Vglut3-Cre or Trh-Cre. (C) Coronal Z-projection (500 µm of depth) showing axonal innervation patterns of 6 aligned brains. The schematic reference image is one 5 µm thick plane in the middle of the 500 µm stack. (D) Coronal heatmaps of axonal innervation patterns at 12 positions along the rostral–caudal axis for the same six brains as seen in (C). Weightings for individual voxels represent axonal content within a radius of 225 µm. (E) Top, bar plot shows the quantification of total axonal content in each of 6 brains prior to normalization. Bottom, heatmap breaks out the total content into each of 282 individual brain regions using boundaries from the Allen Institute CCF. Values are normalized to both target region volume and total axon content per brain. Display order is grouped by mean normalized prevalence of axons in each genotype and ordered by the second principal component. P-values for individual t-tests are uncorrected; those that survive FDR-testing at 10% are indicated with a black bar. See Supplementary file 5 for full list of regions. EP, Endopiriform nucleus; M1, Primary motor area; S1-B, Primary somatosensory area, barrel field; CLI, Central linear nucleus raphe; AHN, Anterior hypothalamic nucleus; DMH, Dorsomedial nucleus of the hypothalamus; MG, Medial geniculate nucleus; ZI, Zona incerta.
Figure 7—figure supplement 1
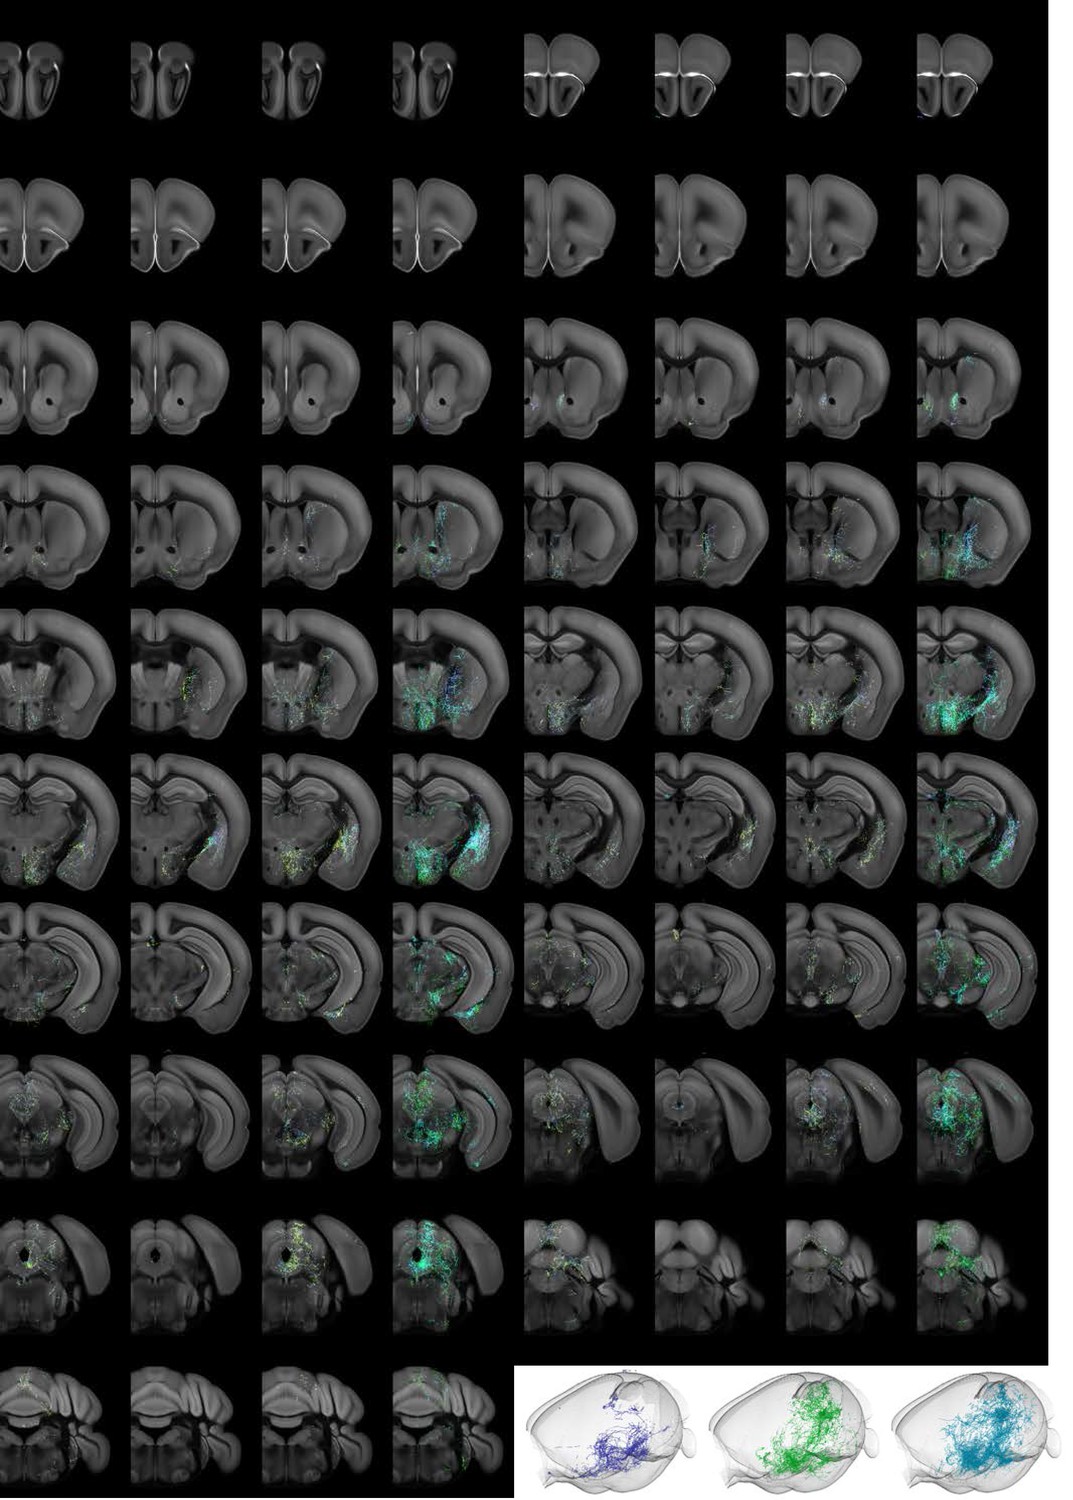
Individual projectome variability of the Trh+ serotonin population.
Coronal slices of data along the rostral–caudal axis, at spacing of 500 µm. The three left panels are 500 µm Z-projections of individual brains, color-coded by Z-depth. Merge image shows the same volume of the three slices overlaid and colored individually by brain. Lower right, 3D view of axonal content for each of the three brains.
Figure 7—figure supplement 2
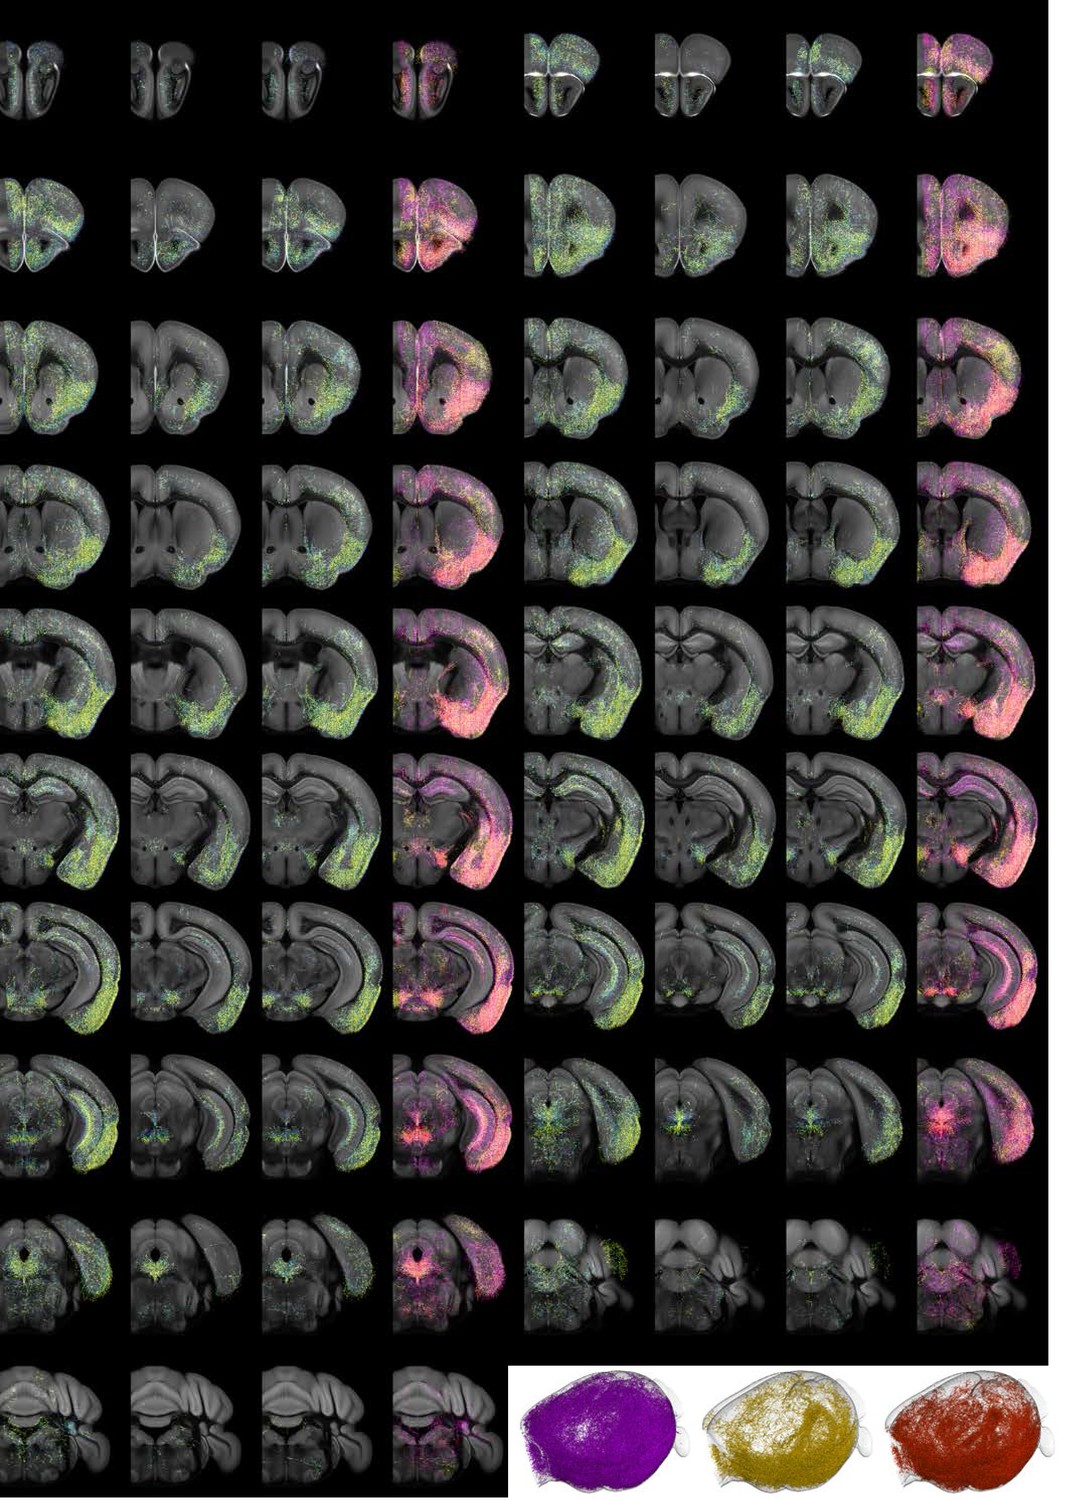
Individual projectome variability of the Vglut3+ serotonin population.
Coronal slices of data along the rostral–caudal axis, at spacing of 500 µm. The three left panels are 500 µm Z-projections of individual brains, color-coded by Z-depth. Merge image shows the same volume of the three slices overlaid and colored individually by brain. Lower right, 3D view of axonal content for each of the three brains.
Figure 7—figure supplement 3
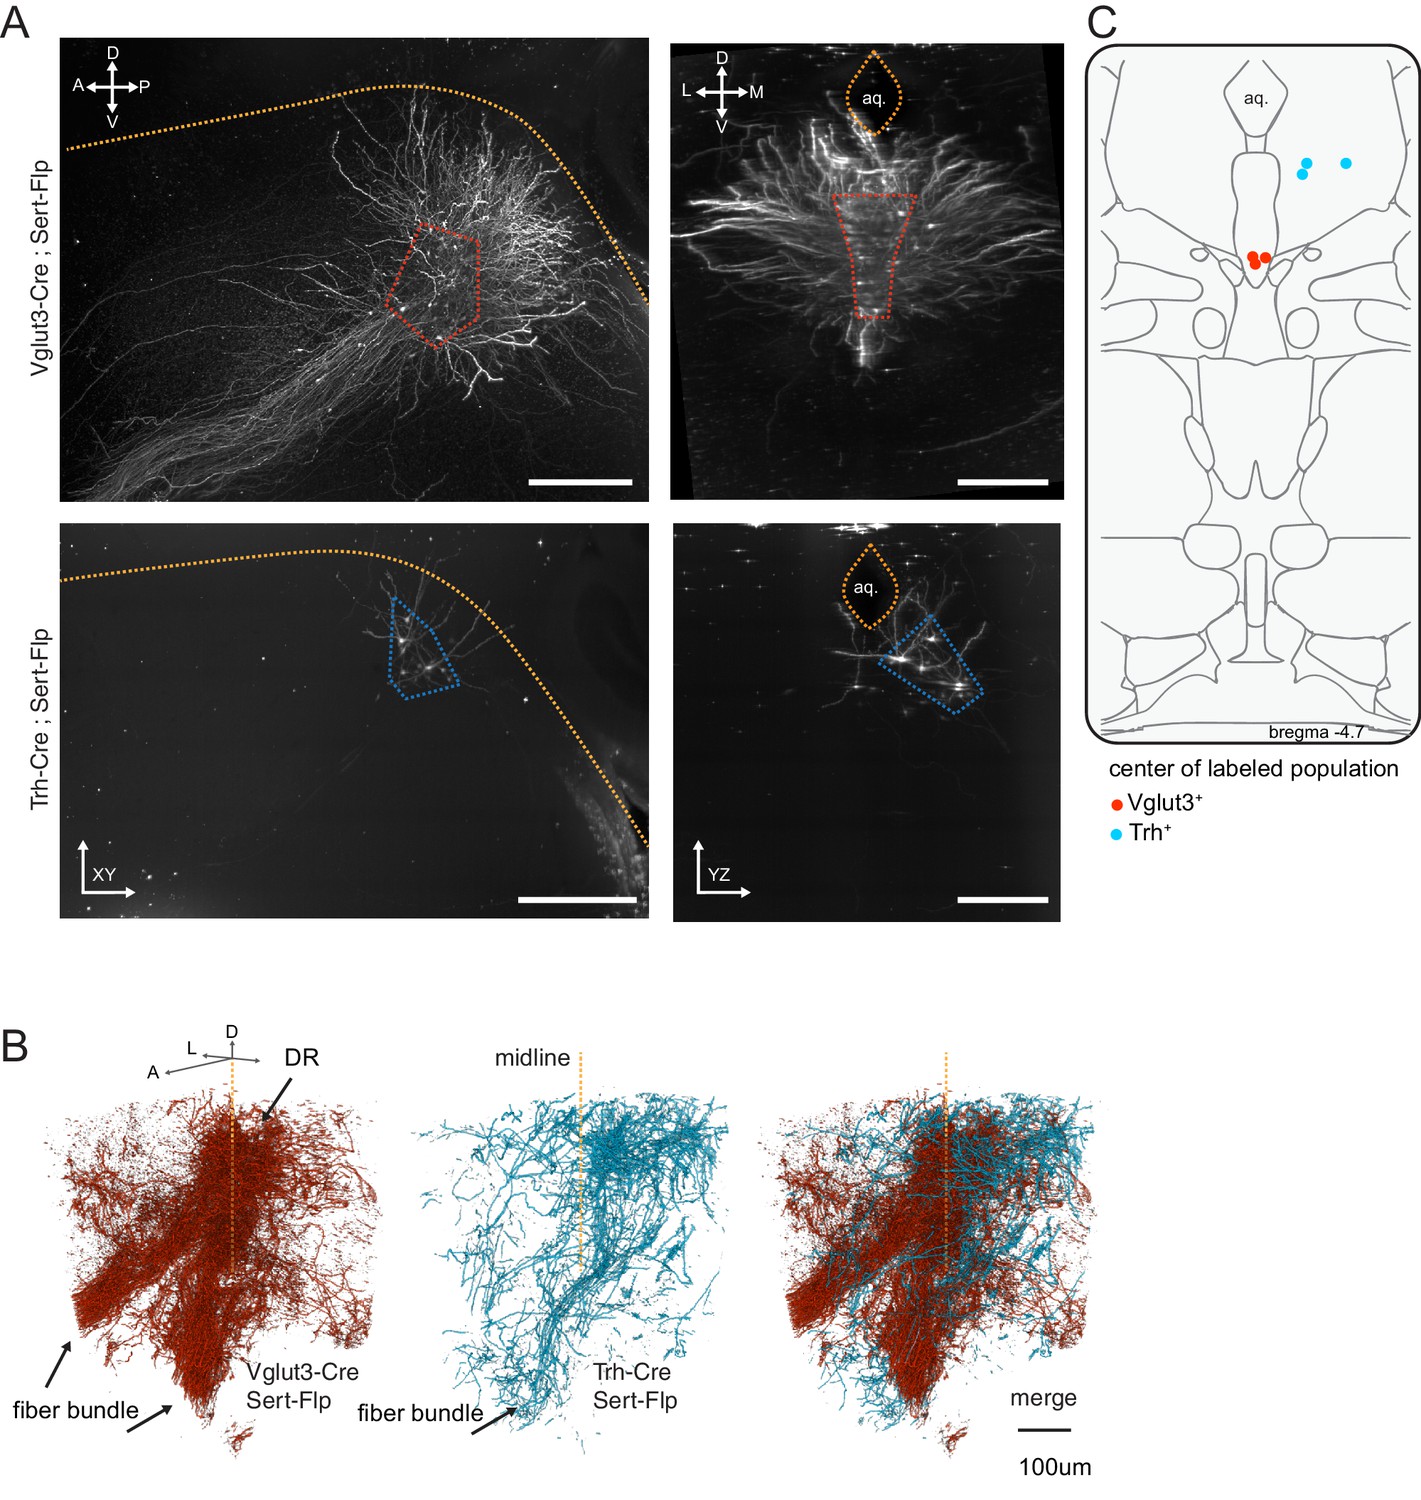
The cell body location and initial axonal segments of the Trh+ and Vglut3+ serotonin neuron subpopulations.
(A) Representative Z projections covering the extent of labeled cell bodies located at the injection site in DR for brains used in iDISCO-based whole brain imaging of axons. Dashed lines mark the ventral boundary of the aqueduct in the sagittal view and the ventral (Vglut3-Cre) and lateral wing (Trh-Cre) locations of labeled Sert-Flp neurons. Scale bars 500 µm. (B) 3D volumes of DR and initial axon branches projecting anterior and ventral into the median forebrain bundle. Volumes are from one brain each representing either Vglut3-Cre or Trh-Cre labeled Sert-Flp neurons. Merge at right highlights overlap. (C) Dots represent the central location of cells labeled by viral injection for each of the six brains. Axis labels: A, anterior; P, posterior, D, dorsal; V, ventral; M, medial; L, lateral.
Figure 7—video 1
Fly-through of aligned axonal projections and heatmaps of the Trh+ and Vglut3+ serotonin subpopulations.
Left, individual slice Z projection represent 125 um depth; Right, heat map of axonal densities calculated as described in Figure 7.
Figure 8 with 5 supplements
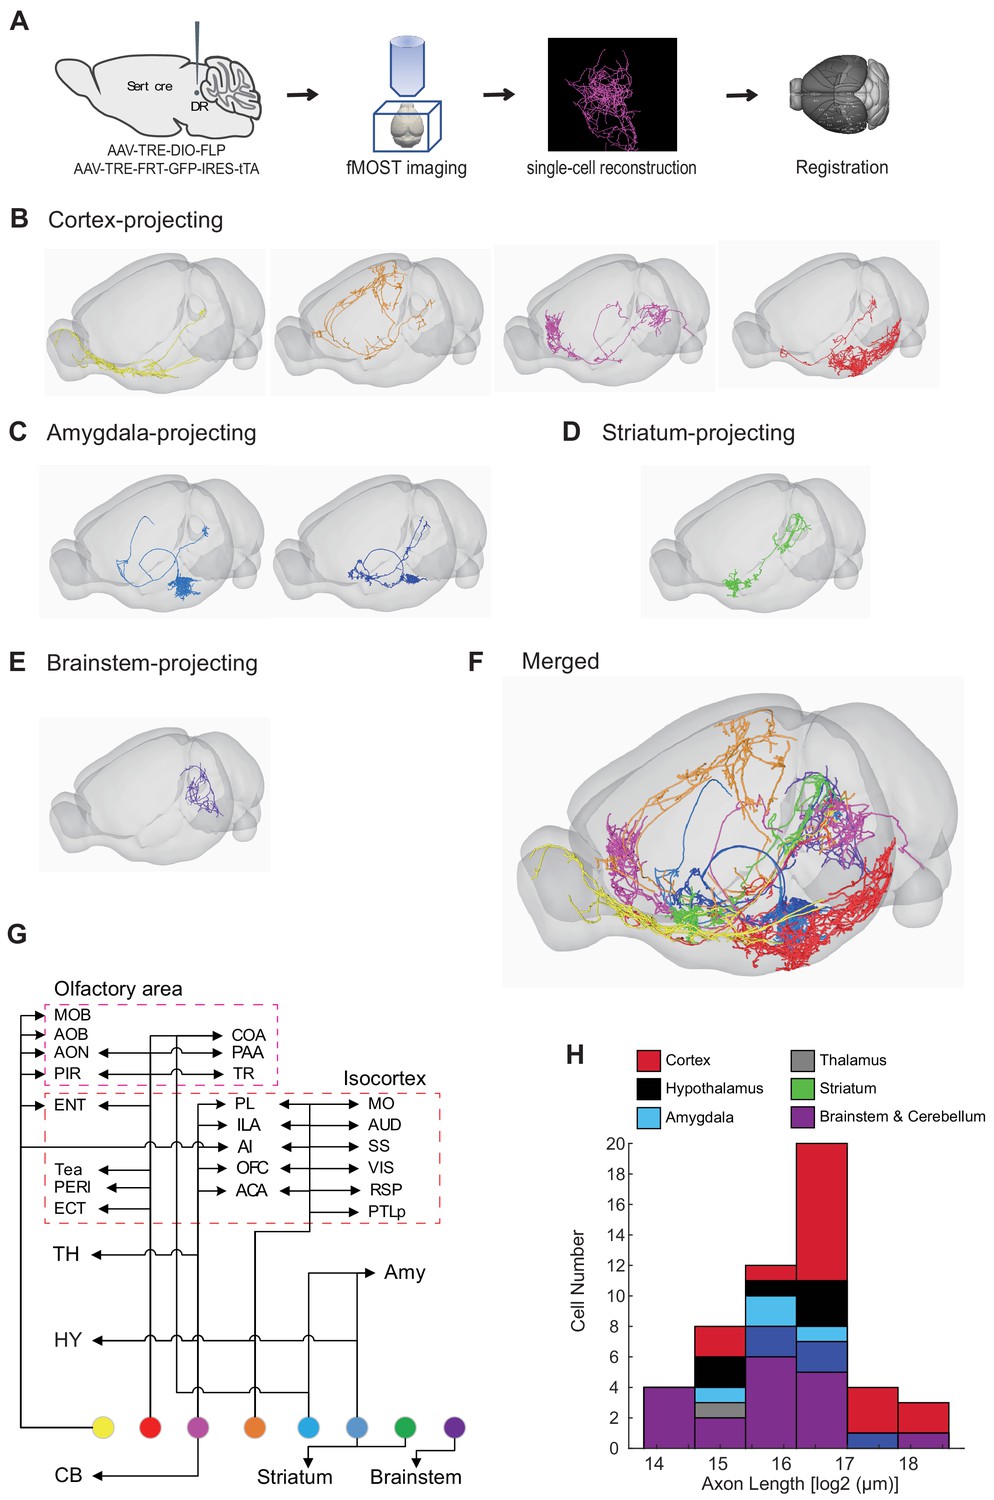
Whole-brain axonal arborization patterns of individual serotonin neurons.
(A) Schematic of single-neuron reconstruction pipeline. (B) Four examples of cortex-projecting DR serotonin neurons, projecting primarily to olfactory cortex and olfactory bulb (1st), dorsal cortex (2nd), prefrontal cortex (3rd), and entorhinal cortex (4th). (C) Two examples of amygdala-projecting DR serotonin neurons. (D) A striatum-projecting DR serotonin neuron. (E) A brainstem-projecting DR serotonin neuron. (F) Merged example neurons from panels B–E. (G) Schematic diagram illustrating the major projection targets of 8 sample neurons in panel F. (H) Histogram showing the distribution of cell numbers according to the total axon length.
Figure 8—figure supplement 1
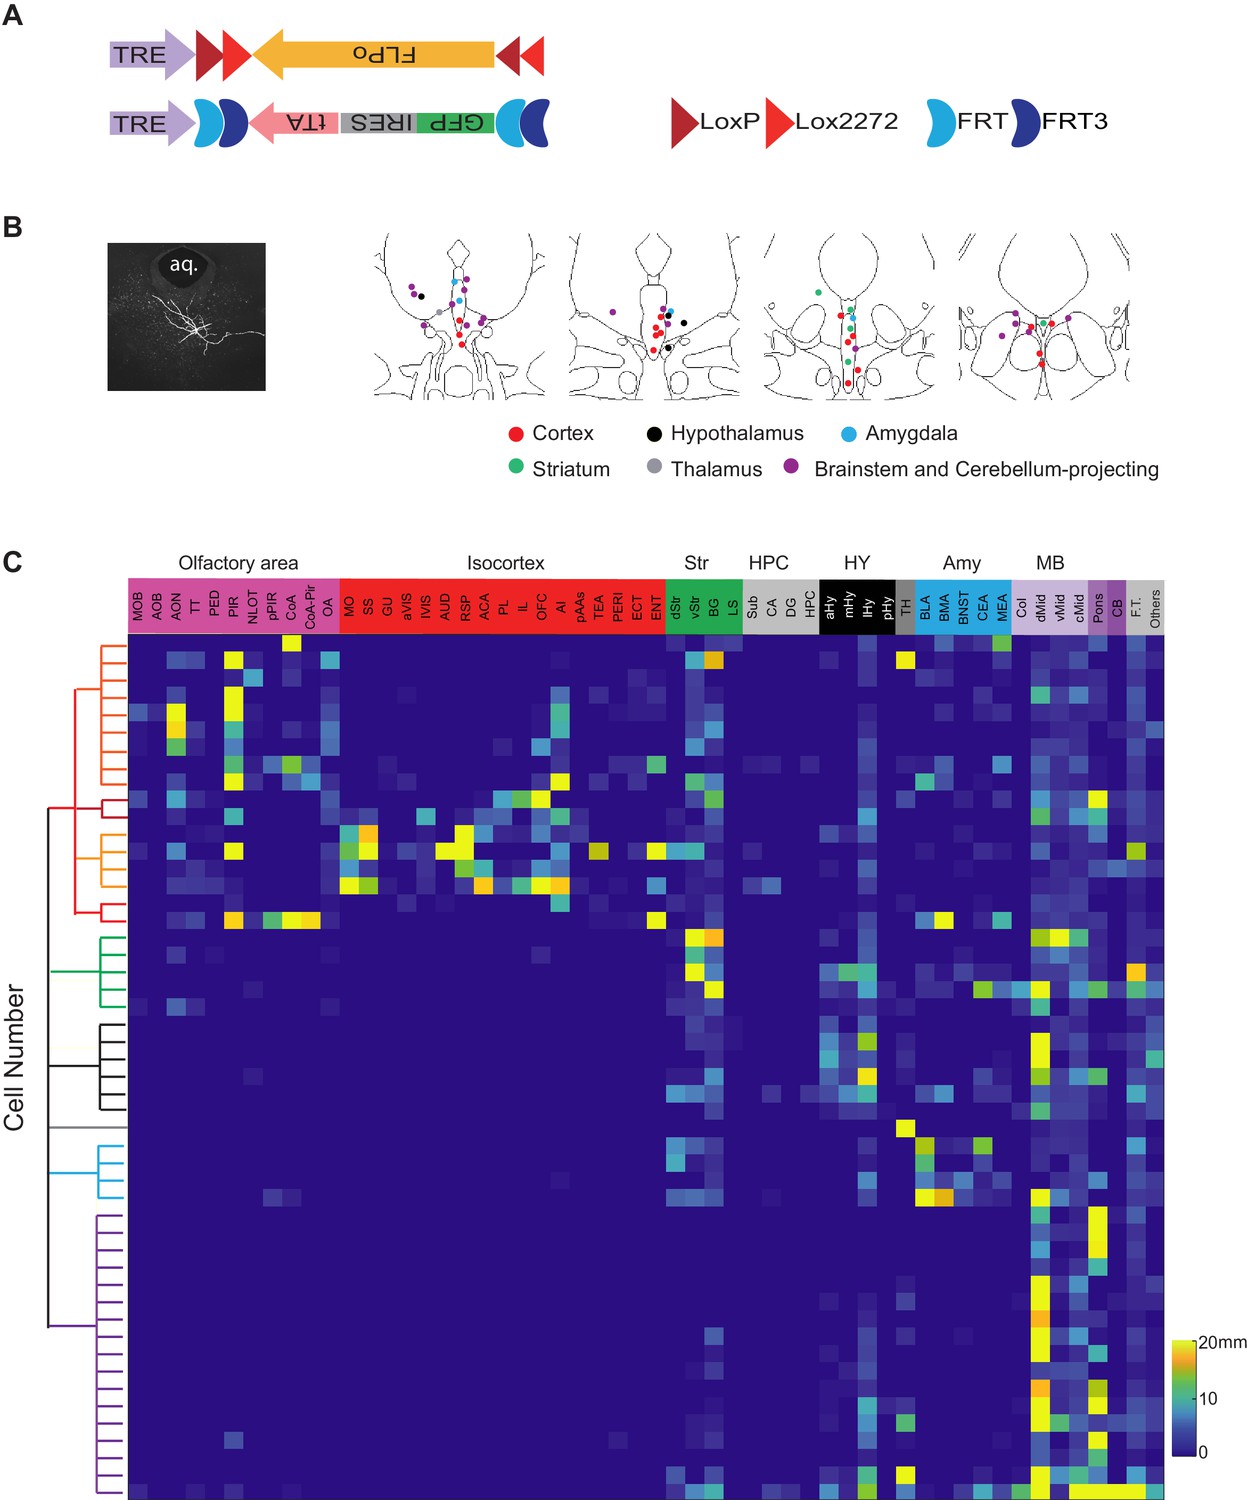
Single-cell reconstruction of DR serotonin neurons.
(A) Design of dual-AAV sparse labeling system. (B) Left, an example neuron labeled by the sparse labeling system. Right, summary of the cell body position of 50 reconstructed neurons color-coded by their projection types. (C) Whole-brain quantification of the axon process length of the 50 reconstructed DR serotonin neurons. The 50 brains are ordered (from top to bottom) according to their projection patterns described in the text, and are the same as the numbers in . F.T., fiber tracts; Others refer to projections in regions unannotated by Allen Reference Atlas, or in ventricles due to errors in registration; for other abbreviations, see Materials and methods.
Figure 8—figure supplement 2
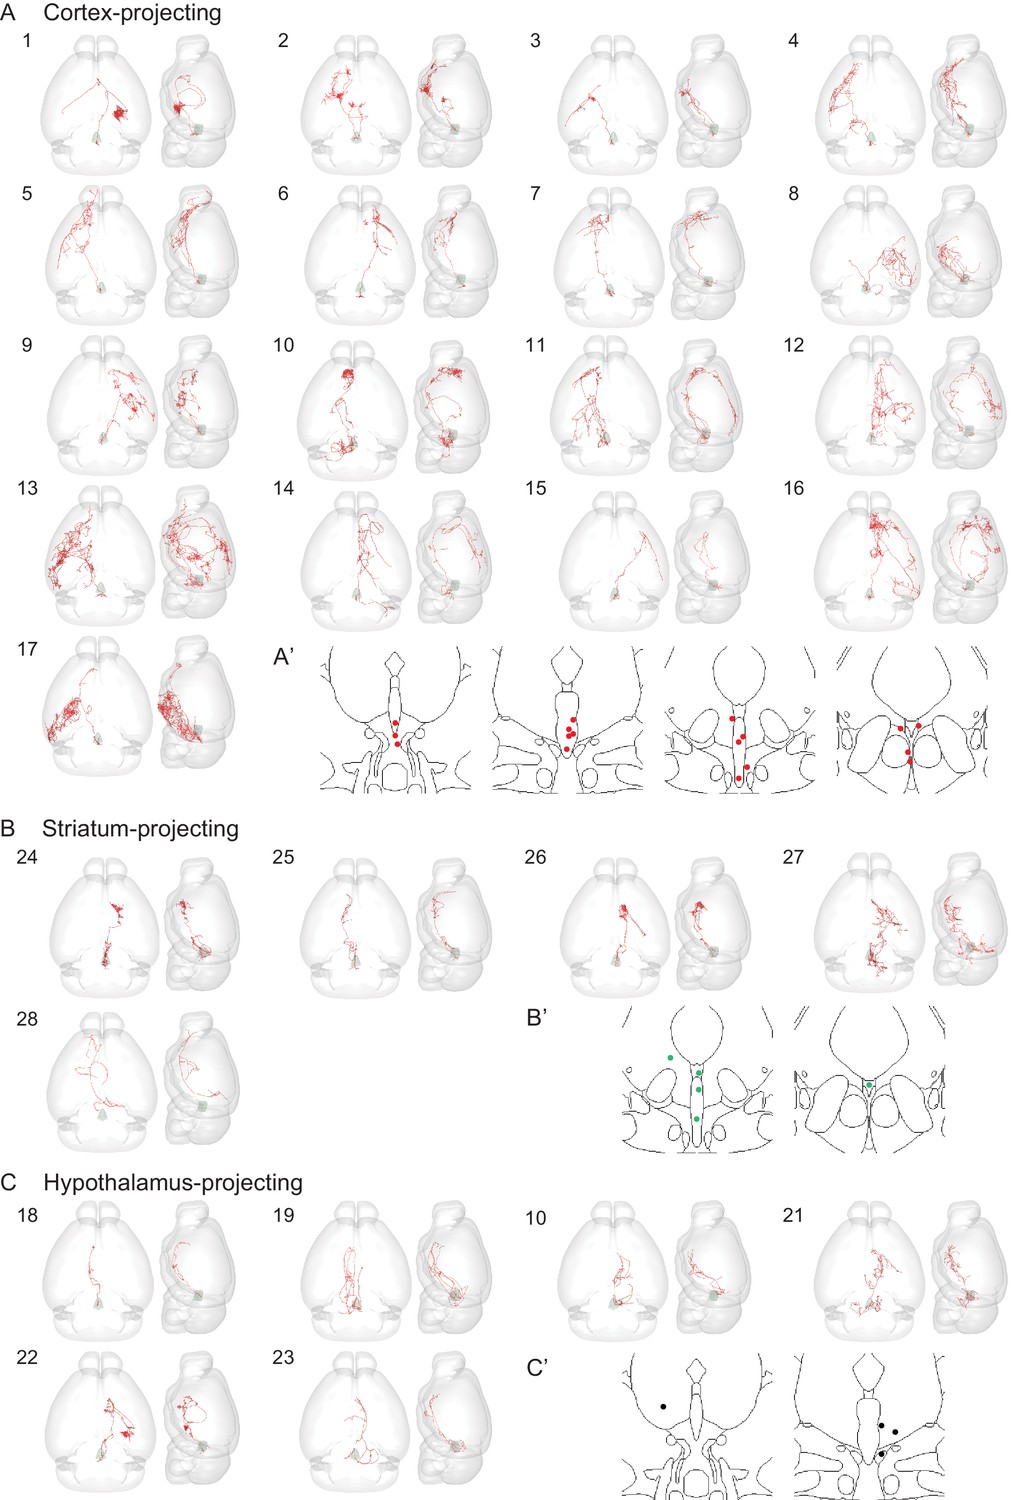
Individually reconstructed DR serotonin neurons (part I).
(A, A’) Whole brain projection pattern and the cell body locations of 17 cortex-projection DR serotonin neurons. (B, B’) Whole brain projection pattern and the cell body locations of 5 striatum-projecting serotonin neurons. (C, C’) Whole brain projection pattern and the cell body locations of 6 hypothalamus-projection DR serotonin neurons. For each neuron, the left image is a horizonal view, whereas the right image is a sagittal view (ventral to the left, dorsal to the right).
Figure 8—figure supplement 3
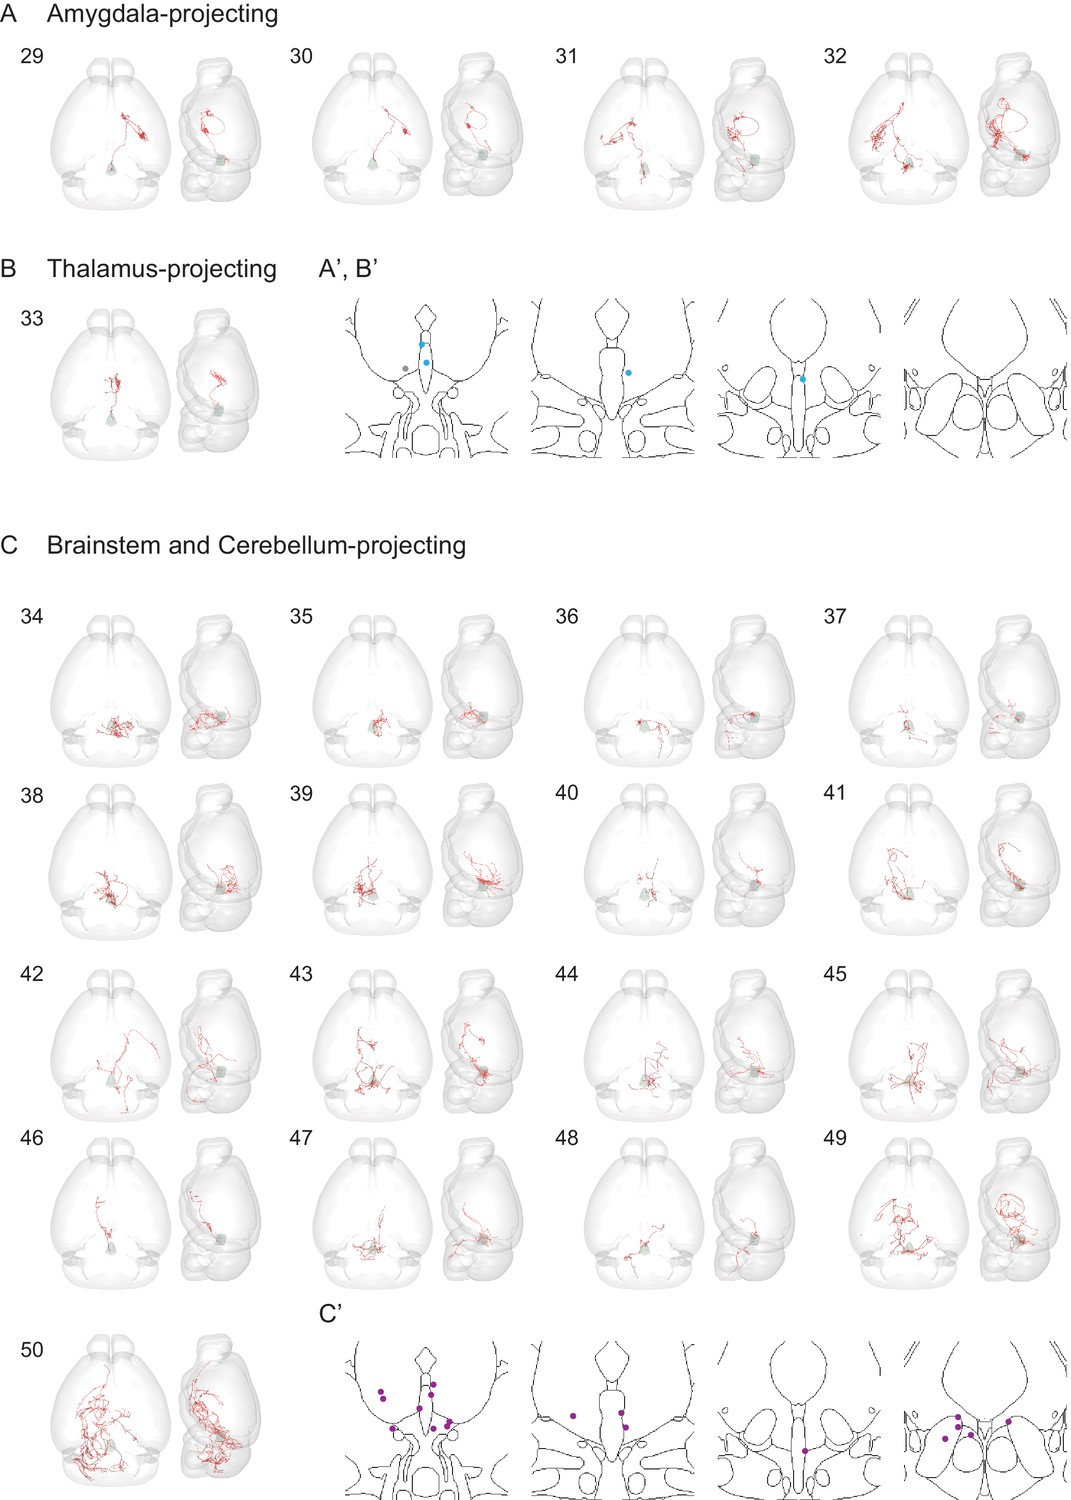
Individual reconstructed DR serotonin neurons (part II).
Horizontal (left), sagittal (right) view and the cell body locations of 4 amygdala-projecting (A, A'), one thalamus-projecting (B, B’), and 17 caudal brainstem and cerebellum-projecting (D, D’) DR serotonin neurons.
Figure 8—figure supplement 4
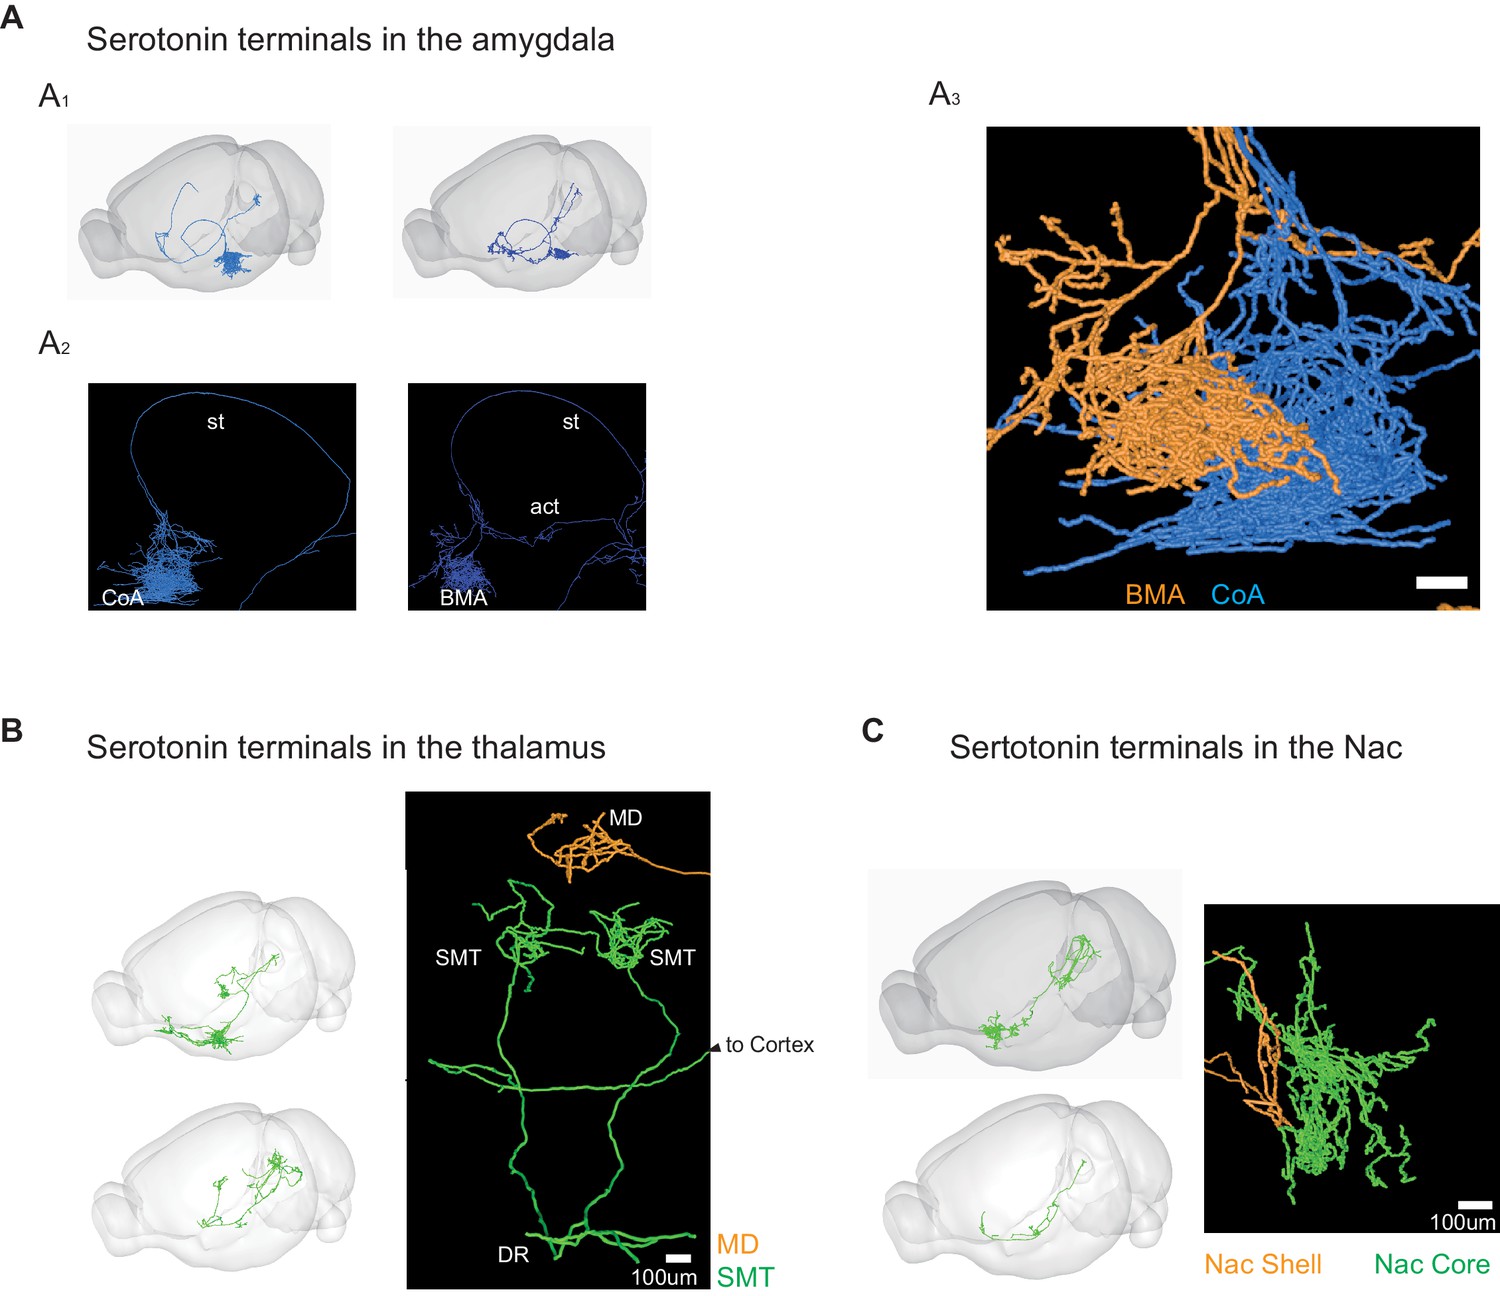
Detailed projection patterns of example DR serotonin neurons.
(A) Serotonin terminal arborization in the CoA (A1) and basal medial amygdala (BMA; A2). (A3) Examples of axon arbors of an amygdala-projecting serotonin neuron (yellow) that terminates in the BMA (yellow) and another one (blue) that terminates in the nearby CoA. (B) Two examples of serotonin terminal arborization in the thalamus. Top, one neuron projects to the medial dorsal nucleus of the thalamus (MD) without branches in the cortex. Bottom, one neuron has bilateral projections to the submedial nucleus of the thalamus (SMT) and also project to the cortex (not shown). (C) Two examples of striatum-projecting neurons differentially arborize at the core and shell of the nucleus accumbens (NAc).
Figure 8—video 1
Whole-brain axonal projection patterns of 6 reconstructed dorsal raphe serotonin neurons.
Reconstructed serotonin neurons shown in Figure 8A–E were merged and presented in the standard brain, corresponding to Figure 8F.
Tables
Key resources table
| Reagent type (species) or resource | Designation | Source or reference | Identifiers | Additional information |
|---|---|---|---|---|
| Antibody | anti-TPH2 (rabbit polyclonal) | Novus | Cat# NB100-74555 | IF (1:1000) |
| Antibody | anti-GFP (chicken polyclonal) | Aves Labs Inc | Cat# GFP-1020 | IF (1:2000); iDISCO (1:1000) |
| Antibody | anti-rabbit donkey antibody conjugated with Cy3 | Jackson ImmunoResearch | Cat# 711-165-152 | 1:500 |
| Antibody | anti-rabbit donkey antibody conjugated with Cy5 | Jackson ImmunoResearch | Cat# 711-496-152 | 1:500 |
| Antibody | anti-chicken donkey antibody conjugated with Cy2 | Jackson ImmunoResearch | Cat# 703-605-155 | 1:500 |
| Recombinant DNA reagent | pAAV-Ef1a-fDIO-EYFP (plasmid) | Addgene | Cat# 27437 | |
| Recombinant DNA reagent | STOPx3 (plasmid) | Addgene | Cat# 22799 | |
| Recombinant DNA reagent | Membrane tag (plasmid) | Addgene | Cat # 71760 | |
| Commercial assay or kit | Gibson Assembly Master Mix | New England Biolabs | Cat# E2611S | |
| Commercial assay, kit | Papain Dissociation System | Worthington | Cat# LK003150 | |
| Commercial assay, kit | C1ql2 | Molecular Instruments | NM_207233.1 | B1 amplifierv3.0 probe |
| Commercial assay, kit | Crhr2 | Molecular Instruments | NM_001288620.1 | B1 amplifierv3.0 probe |
| Commercial assay, kit | Dlk1 | Molecular Instruments | NM_001190703.1 | B2 amplifierv3.0 probe |
| Commercial assay, kit | Ret | Molecular Instruments | NM_009050.2 | B4 amplifierv3.0 probe |
| Commercial assay, kit | Gad1 | Molecular Instruments | NM_008077.5 | B1 amplifierv3.0 probe |
| Commercial assay, kit | Gad2 | Molecular Instruments | NM_008078.2 | B1 amplifierv3.0 probe |
| Commercial assay, kit | Spp1 | Molecular Instruments | NM_001204202.1 | B4 amplifierv3.0 probe |
| Commercial assay, kit | Syt2 | Molecular Instruments | NM_001355726.1 | B1 amplifierv3.0 probe |
| Commercial assay, kit | Tacr3 | Molecular Instruments | NM_021382.6 | B1 amplifierv3.0 probe |
| Commercial assay, kit | Irx2 | Molecular Instruments | NM_010574.4 | B1 amplifierv3.0 probe |
| Commercial assay, kit | Npas1 | Molecular Instruments | NM_008718.2 | B4 amplifierv3.0 probe |
| Commercial assay, kit | Piezo2 | Molecular Instruments | NM_001039485.4 | B1 amplifierv3.0 probe |
| Commercial assay, kit | Tpbg | Molecular Instruments | NM_001164792.1 | B4 amplifierv3.0 probe |
| Commercial assay, kit | Met | Molecular Instruments | NM_008591.2 | B4 amplifierv3.0 probe |
| Commercial assay, kit | Trh | Molecular Instruments | NM_009426.3 | B2 amplifierv3.0 probe |
| Commercial assay, kit | Vglut3 | Molecular Instruments | NM_001310710.1 | B4 amplifierv3.0 probe |
| Commercial assay, kit | TPH2 | Molecular Instruments | NM_173391 | B3 amplifierv3.0 probe |
| Chemical compound, drug | Tetrodotoxin | Tocris Bioscience | Cat# 1069 | 1 μM |
| Chemical compound, drug | Kynurenic acid | Millipore Sigma | Cat# K3375 | 500 μM |
| Chemical compound, drug | D-AP5 | Tocris Bioscience | Cat# 0106 | 50 μM |
| Chemical compound, drug | Actinomycin D | Sigma | Cat# A1410 | 50 μM |
| Software, algorithm | IMARIS | Bitplane | RRID:SCR_007370 | Bitplane.com |
| Software, algorithm | Ilastik | GNU General Public License | RRID:SCR_015246 | https://ilastik.org/ |
| Software, algorithm | Elastix | Image Sciences Institute | RRID:SCR_009619 | https://elastix.isi.uu.nl/ |
| Software, algorithm | MATLAB | Mathworks | RRID:SCR_001622 | Mathworks.com |
| Software, algorithm | Fiji | PMID: 22743772 | RRID:SCR_002285 | https://imagej.net/Fiji |
| Software, algorithm | Allen Institute’sCommon Coordinate Framework (CCF) | Allen Institute for Brain Science (https://www.alleninstitute.org/) | https://download.alleninstitute.org/informatics-archive/current-release/mouse_ccf/ | |
| Software | R v3.5.3 | R-project | RRID:SCR_001905 | |
| Software | Seurat v3.0 | https://github.com/satijalab/seurat | RRID: SCR_016341 | Butler et al., 2018; Stuart et al., 2019 |
| Software | STAR 2.6.1a | https://github.com/alexdobin/STAR | RRID:SCR_015899 | Dobin et al., 2013 |
| Software | HTseq 0.11.2 | European Molecular Biology Laboratory | RRID:SCR_005514 | Anders et al., 2015 |
| Other | Normal donkey serum | Jackson ImmunoResearch | Cat# 017-000-121 | |
| Other | DAPI stain | Invitrogen | Cat# D1306 | (1 µg/mL) |
| Other | SH800S FACS sorter | SONY | ||
| Other | NextSeq500 | Illumina | https://www.illumina.com |
Additional files
-
Supplementary file 1
Raw data for single-cell gene expression.
Column names denote cell index, row names denote gene names.
- https://doi.org/10.7554/eLife.49424.033
-
Supplementary file 2
Functional gene categories, used to generate Figure 4 and Supplementary file 4.
- https://doi.org/10.7554/eLife.49424.034
-
Supplementary file 3
Pearson correlation coefficient (rp) of pairwise correlation of gene expression across 999 cells.
Contains gene pairs with rp >0.3, rp<–0.3. Contains gene pairs with rp >0.3, rp<–0.3.
- https://doi.org/10.7554/eLife.49424.035
-
Supplementary file 4
Co-expression networks.
Networks were constructed based on Pearson correlation coefficient (rp) of gene expression across all cells. Genes appear connected if rp >0.4. Edge width represents rp. Nodes are colored according to functional gene categories (Materials and methods).
- https://doi.org/10.7554/eLife.49424.036
-
Supplementary file 5
Allen Brain Atlas IDs and Their Corresponding Names as Identified by the 2017 Common Coordinate Framework, Related to Figure 7.
Regions were selected prior to analysis such that areas defined by individual layers (e.g., cortical layers I–VI), cell identity, and anatomical cardinal directions are collapsed into their parent region. Individual normalized regional densities for each brain are aligned to the heat maps from Figure 7E.
- https://doi.org/10.7554/eLife.49424.037
-
Transparent reporting form
- https://doi.org/10.7554/eLife.49424.038
Download links
A two-part list of links to download the article, or parts of the article, in various formats.
Downloads (link to download the article as PDF)
Open citations (links to open the citations from this article in various online reference manager services)
Cite this article (links to download the citations from this article in formats compatible with various reference manager tools)
Single-cell transcriptomes and whole-brain projections of serotonin neurons in the mouse dorsal and median raphe nuclei
eLife 8:e49424.
https://doi.org/10.7554/eLife.49424


