β-blockers augment L-type Ca2+ channel activity by targeting spatially restricted β2AR signaling in neurons
- Guangzhou Medical University, China
- University of California Davis, United States
- VA Northern California Health Care System, United States
Figures
Figure 1 with 1 supplement

Carvedilol and alprenolol selectively promote phosphorylation of β2AR at PKA sites.
HEK293 cells stably expressing FLAG-tagged β2AR were either directly stimulated for 5 min with the βAR agonist ISO or different β-blockers at indicated concentrations (A) n = 4), or pretreated for 15 min with 1 μM β1AR antagonist CGP20712A (B) n = 5) or 10 μM β2AR antagonist ICI118551 (C) n = 4) before the treatment. The phosphorylation of β2AR on its PKA and GRK sites were determined with phospho-specific antibodies, and signals were normalized to total β2AR detected with anti-FLAG antibody. NT, no treatment; ISO, isoproterenol; TIM, timolol; ALP, alprenolol; CAR, carvedilol; ICI, ICI118551; PRO, propranolol; MET, metoprolol; 177, CGP12177; CGP, CGP20712A. Error bars denote s.e.m., P values are computed by one-way ANOVA followed by Tukey’s test between NT and other groups.
-
Figure 1—source data 1
Excel spreadsheet containing the individual numeric values of phosphorylated β2AR / total β2AR relative density analyzed in Figure 1.
- https://cdn.elifesciences.org/articles/49464/elife-49464-fig1-data1-v3.xlsx
Figure 1—figure supplement 1
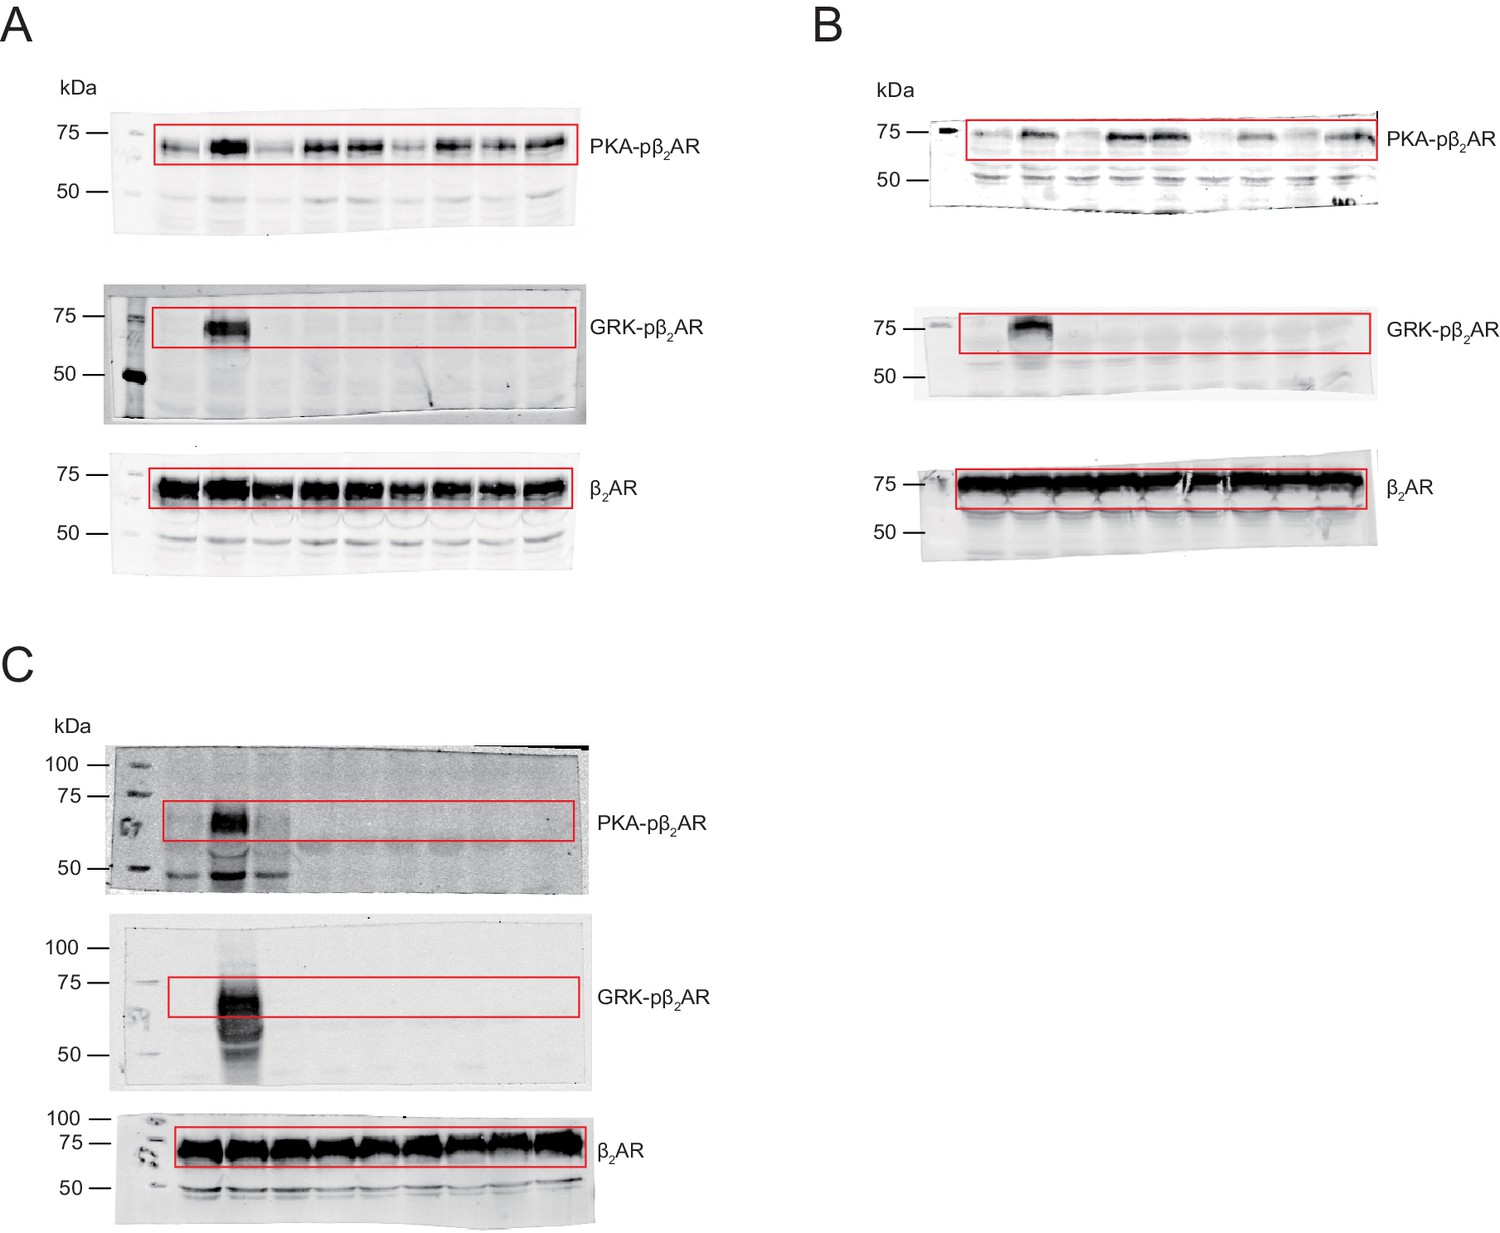
Uncropped blots for Figure 1.
Figure 2 with 3 supplements
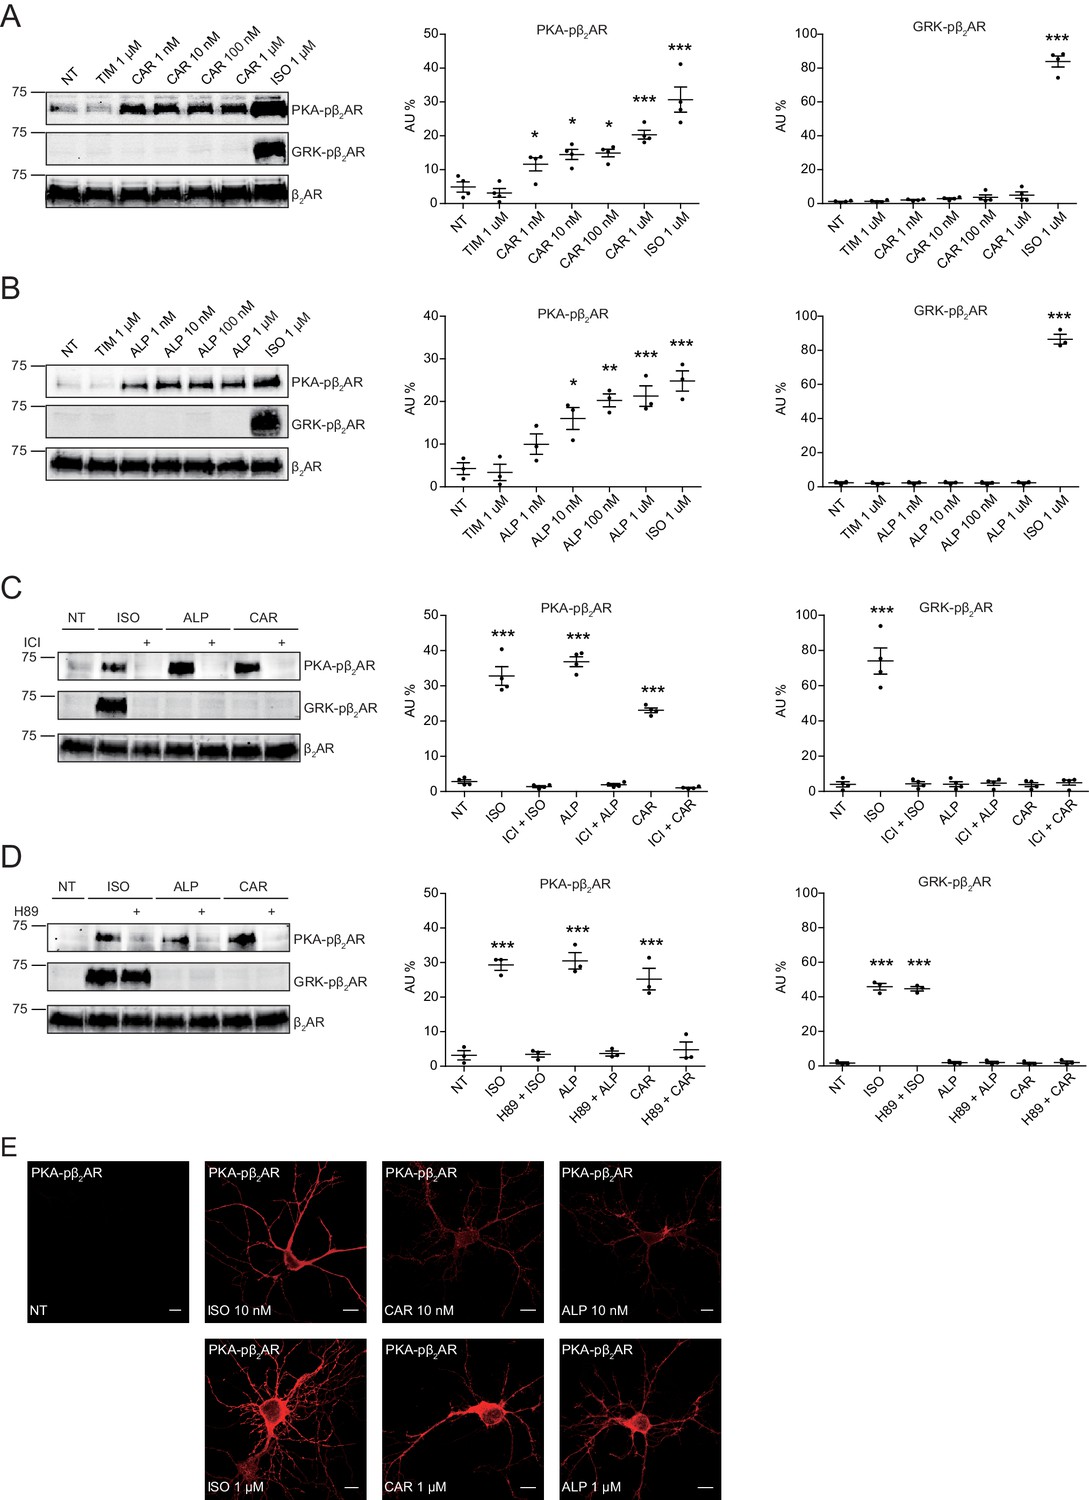
Carvedilol and alprenolol induce concentration-dependent PKA phosphorylation of β2AR in HEK293 and hippocampal neurons.
HEK293 cells stably expressing FLAG-tagged β2AR were treated with increasing concentrations of CAR (A) n = 4) and ALP (B) n = 3), or pretreated for 15 min with 10 μM β2AR antagonist ICI118551 (C) n = 4) and PKA inhibitor H89 (D) n = 3) before stimulated with 1 μM indicated drugs for 5 min. The phosphorylation of β2AR on its PKA and GRK sites were determined with phospho-specific antibodies, and signals were normalized to total β2AR detected with anti-FLAG antibody. Experiments were performed in the presence of 1 μM β1AR-selective antagonist CGP20712A to block endogenous β1AR signaling. NT, no treatment; ISO, isoproterenol; ALP, alprenolol; CAR, carvedilol; ICI, ICI118551. Error bars denote s.e.m., P values are computed by one-way ANOVA followed by Tukey’s test between NT and other groups. (E) Rat hippocampal neurons expressing β2AR were treated for 5 min with 10 nM or 1 μM indicated drugs on 12 days in vitro (DIV), and immuno-stained for PKA-phosphorylated β2AR. Confocal images show PKA-phosphorylated β2AR in agonist- or β-blocker-stimulated neurons have similar distribution. Scale bar, 10 μm. Representative of 6 images for each condition, three experiments.
-
Figure 2—source data 1
Excel spreadsheet containing the individual numeric values of phosphorylated β2AR / total β2AR relative density analyzed in Figure 2A-D.
- https://cdn.elifesciences.org/articles/49464/elife-49464-fig2-data1-v3.xlsx
Figure 2—figure supplement 1
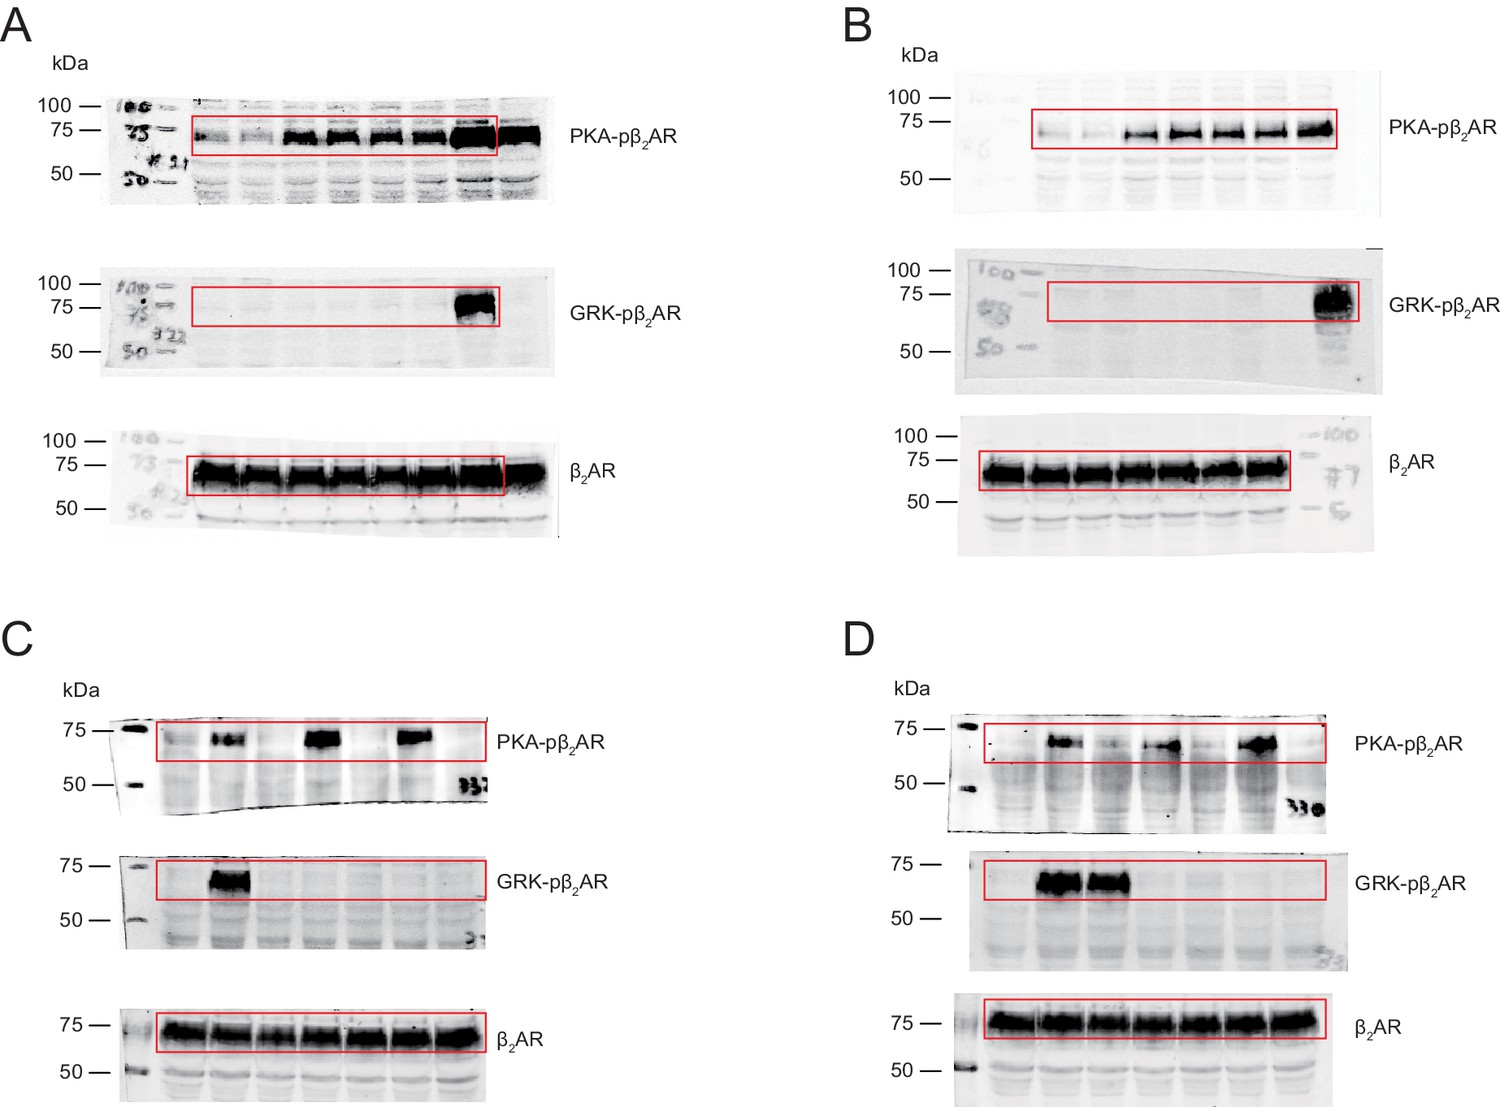
Uncropped blots for Figure 2.
Figure 2—figure supplement 2
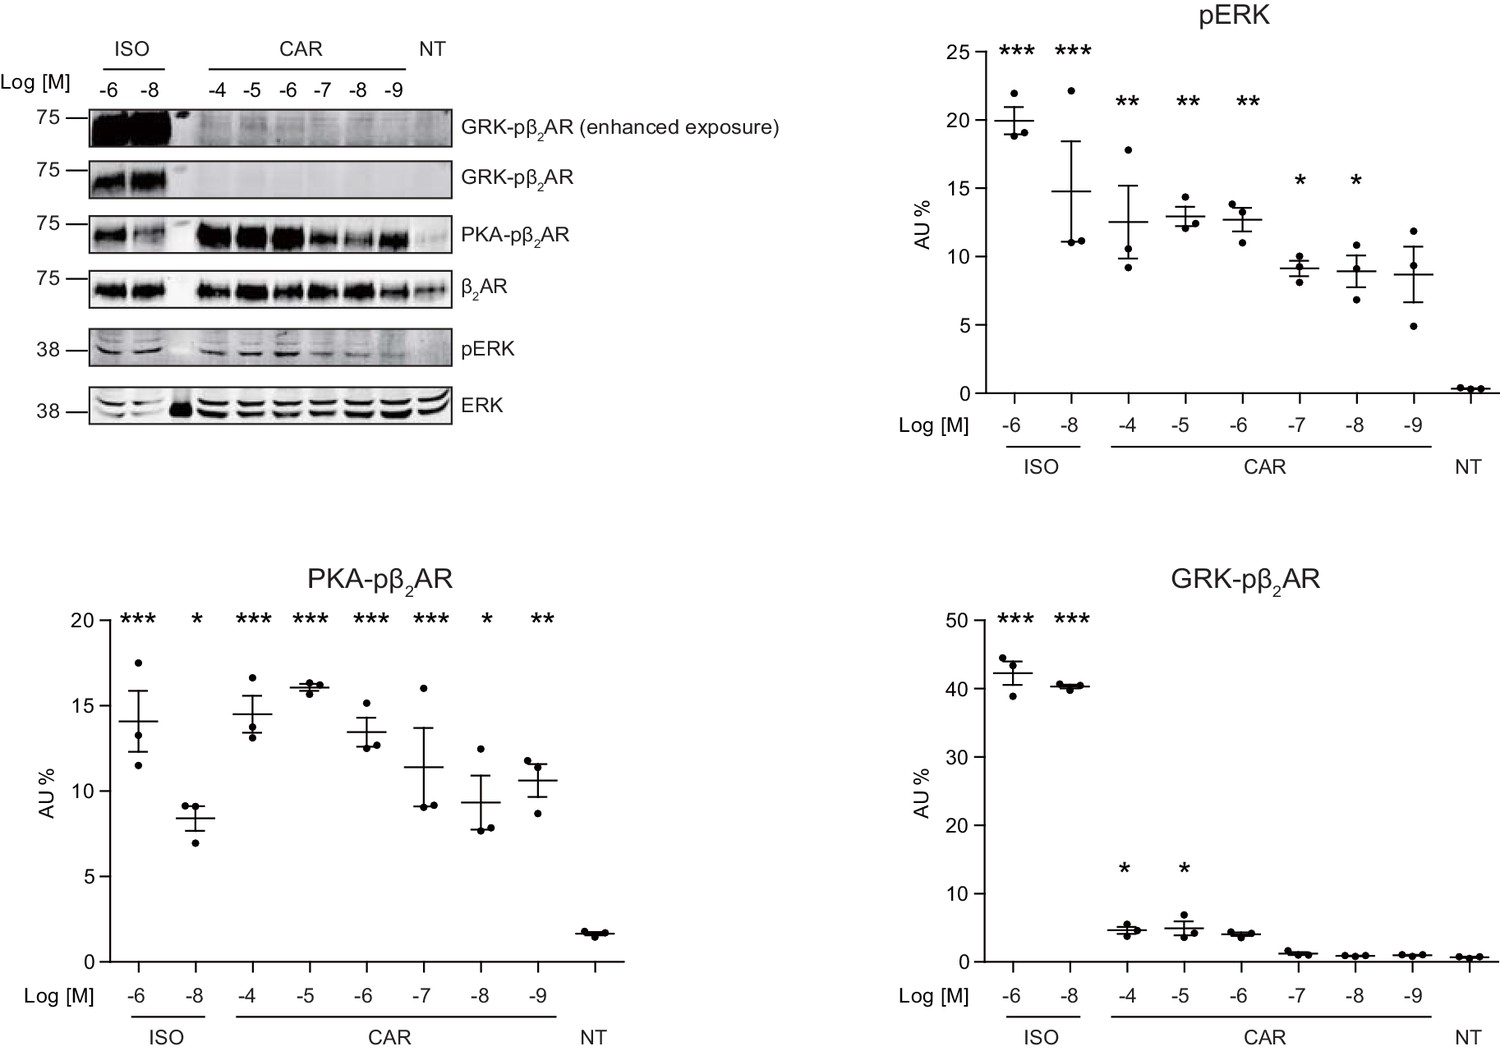
Phosphorylation of ERK and β2AR at different drug concentrations.
HEK293 cells stably expressing FLAG-tagged β2AR were stimulated by isoproterenol (ISO) or carvedilol (CAR) for 30 min with indicated concentrations. Cell lysates were analyzed for PKA-phosphorylated β2AR, GRK-phosphorylated β2AR, total β2AR, pERK, and total ERK by western blot. P values are computed by one-way ANOVA followed by Tukey’s test between NT and other groups. Data are the mean ± s.e.m. of three experiments.
Figure 2—figure supplement 3

GRK-phosphorylation of β2AR at different carvedilol treated times.
HEK293 cells stably expressing FLAG-tagged β2AR were stimulated by 1 μM isoproterenol (ISO) or carvedilol (CAR) for indicated times. Cell lysates were analyzed for PKA-phosphorylated β2AR, GRK-phosphorylated β2AR, total β2AR by western blot. P values are computed by one-way ANOVA followed by Tukey’s test between NT and other groups. Data are the mean ± s.e.m. of four experiments.
Figure 3 with 3 supplements
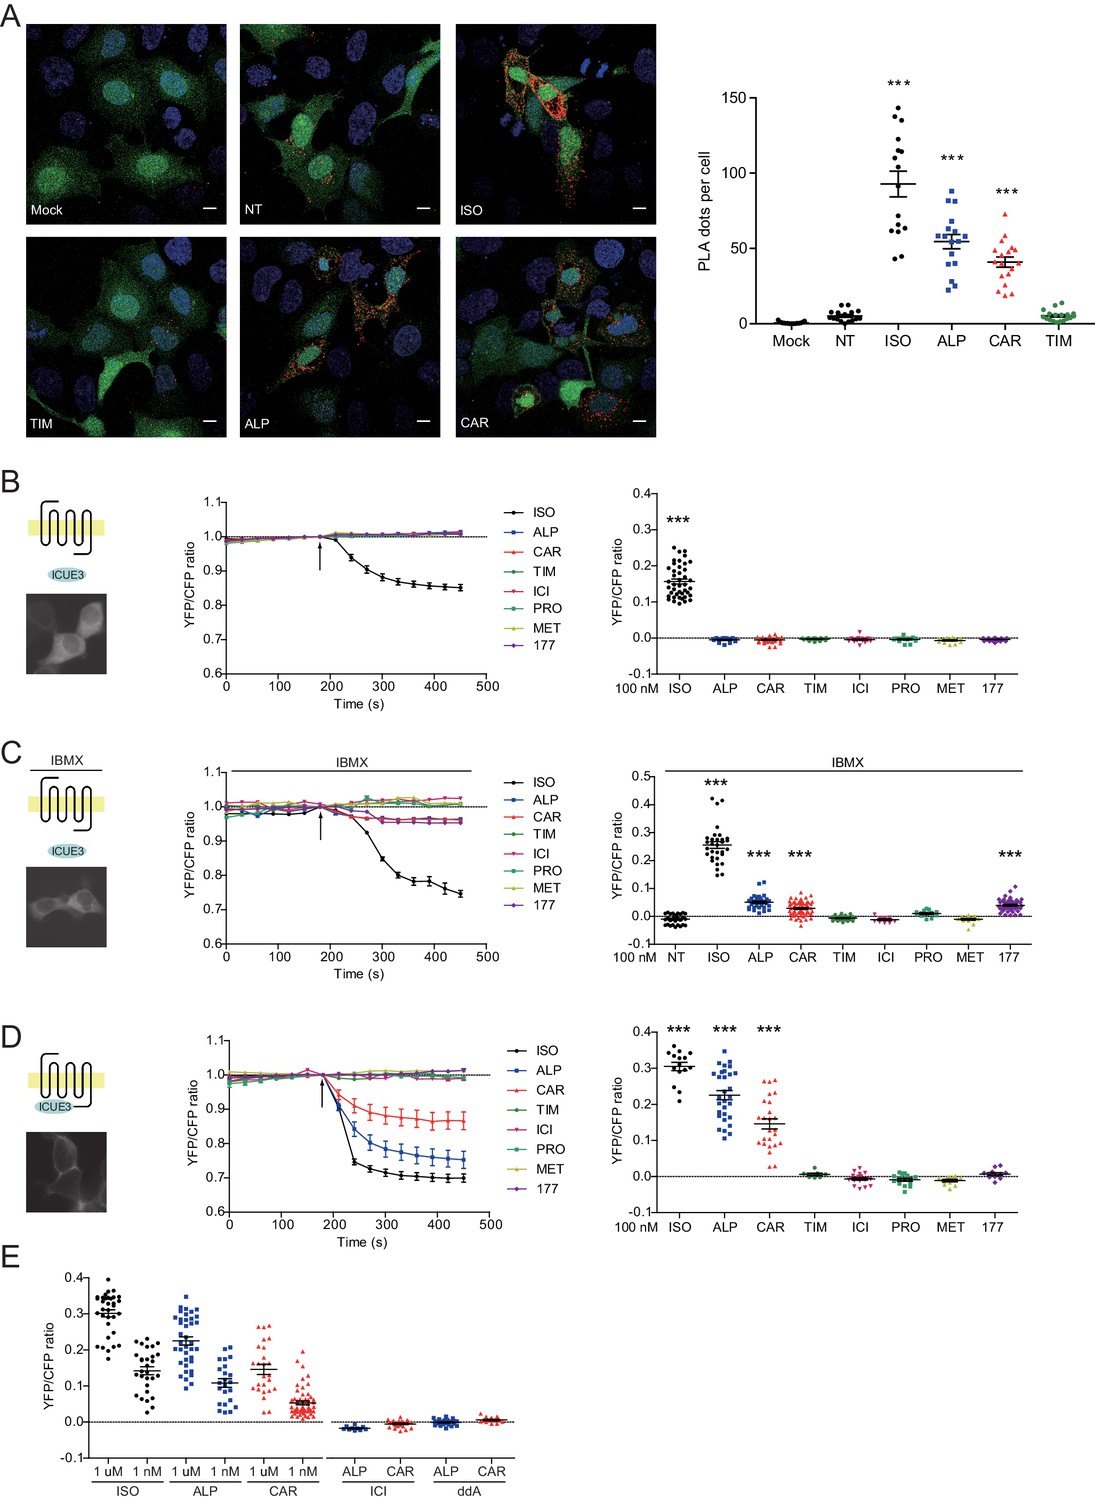
Carvedilol and alprenolol promote Gsα recruitment to β2AR and increase spatially restricted cAMP signal.
(A) HEK293 cells co-expressing FLAG-tagged β2AR, HA-tagged Gsα and EGFP were stimulated with 100 nM ISO or indicated β-blockers for 5 min. In proximity ligation assay (PLA), cells were immuno-stained with HA and β2AR antibody, nuclei were counterstained with DAPI. The green EGFP signal represents transfected cells, and red PLA signal represents Gsα and β2AR interactions. Carvedilol and alprenolol promoted Gsα recruitment to β2AR, but timolol could not. Scale bar, 10 μm. Representative of n = 15, 16, 16, 17, 18 and 18 images respectively, three experiments. (B–C) HEK293 cells expressing ICUE3 biosensor were treated with 1 μM ISO or indicated β-blockers (B), or together with 100 μM phosphodiesterase inhibitor IBMX (C). (D–E) HEK293 cells expressing β2AR-ICUE3 biosensor were treated with indicated concentration of ISO or β-blockers. In some cases, cells were pretreated for 30 min with the β2AR antagonist ICI (10 μM) or the adenylate cyclase inhibitor ddA (50 μM) before adding β-blockers. Changes in ICUE3 FRET ratio (an indication of cAMP activity) were measured. Experiments were performed in the presence of 1 μM β1AR-selective antagonist CGP20712A to block endogenous β1AR signaling. Mock, no primary antibody; NT, no treatment; ISO, isoproterenol; TIM, timolol; ALP, alprenolol; CAR, carvedilol; ICI, ICI118551; PRO, propranolol; MET, metoprolol; 177, CGP12177, IBMX, 3-isobutyl-1-methylxanthine; ddA, 2',5'-dideoxyadenosine. Each dot in the scatter dot plot in B–E represents a value from an individual tested cell. Error bars denote s.e.m., P values are computed by one-way ANOVA followed by Tukey’s test between NT (A) or TIM (B–E) and other groups.
-
Figure 3—source data 1
Excel spreadsheet containing the individual numeric values of PLA dots / cell number in each raw image analyzed in Figure 3A, and the individual numeric values for maximum FRET responses in Figure 3B-E.
- https://cdn.elifesciences.org/articles/49464/elife-49464-fig3-data1-v3.xlsx
Figure 3—figure supplement 1

Carvedilol-induced β2AR phosphorylation is AC-dependent.
HEK293 cells stably expressing FLAG-tagged β2AR were pretreated with the Gi inhibitor pertussis toxin (PTX, 200 ng/ml, 16 hr) or the adenylate cyclase inhibitor 2',5'-dideoxyadenosine (ddA, 50 μM, 30 min) and then stimulated with 100 nM isoproterenol (ISO) or carvedilol (CAR) for 5 min. The phosphorylation levels of β2AR on its PKA and GRK sites were determined with phospho-specific antibodies, and signals were normalized to total β2AR detected with anti-FLAG antibody. Experiments were performed in the presence of 1 μM β1AR-selective antagonist CGP20712A to block endogenous β1AR signaling. P values are computed by one-way ANOVA followed by Tukey’s test between no drug (ND) and other drugs within the same group. Data are the mean ± s.e.m. of three experiments.
Figure 3—figure supplement 2
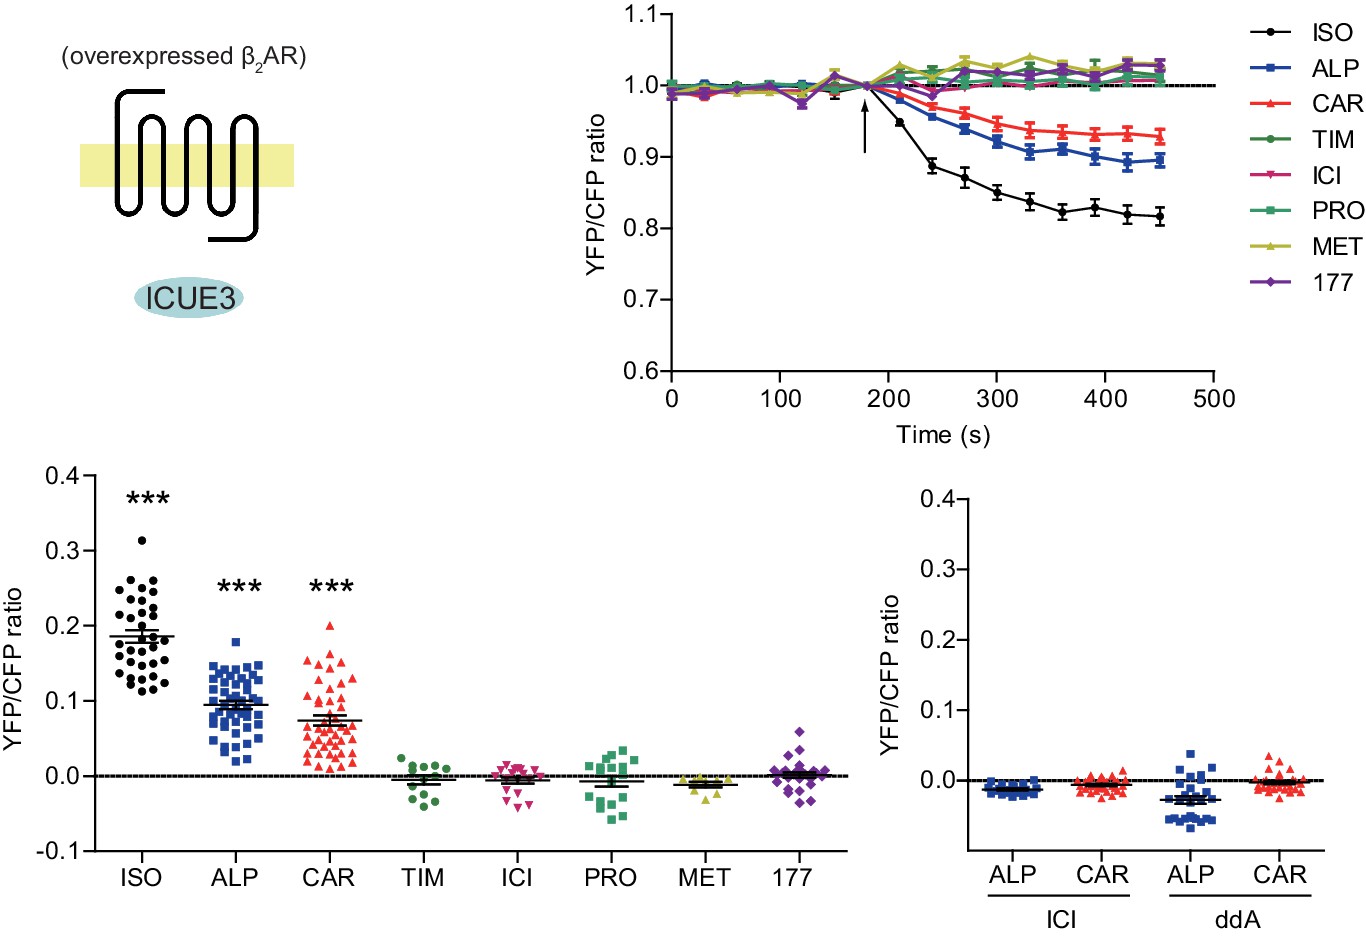
Carvedilol- and alprenolol-induced cAMP can be abolished by β2AR or AC inhibition.
The cAMP biosensor ICUE3 and FLAG-β2AR were co-expressed in HEK293 cells. Cells were treated with 100 nM βAR agonist ISO or different β-blockers, and changes in cAMP FRET ratio were measured. In some cases, cells were pretreated for 30 min with the β2AR antagonist ICI (10 μM) or the adenylate cyclase inhibitor ddA (50 μM) before adding β-blockers. Experiments were performed in the presence of 1 μM β1AR-selective antagonist CGP20712A to block endogenous β1AR signaling. ISO, isoproterenol; TIM, timolol; ALP, alprenolol; CAR, carvedilol; ICI, ICI118551; PRO, propranolol; MET, metoprolol; 177, CGP12177; ddA, 2',5'-dideoxyadenosine. Each dot in the scatter dot plot represents a value from an individual tested cell. Error bars denote s.e.m. P values are computed by one-way ANOVA followed by Tukey’s test between TIM and other groups.
Figure 3—figure supplement 3
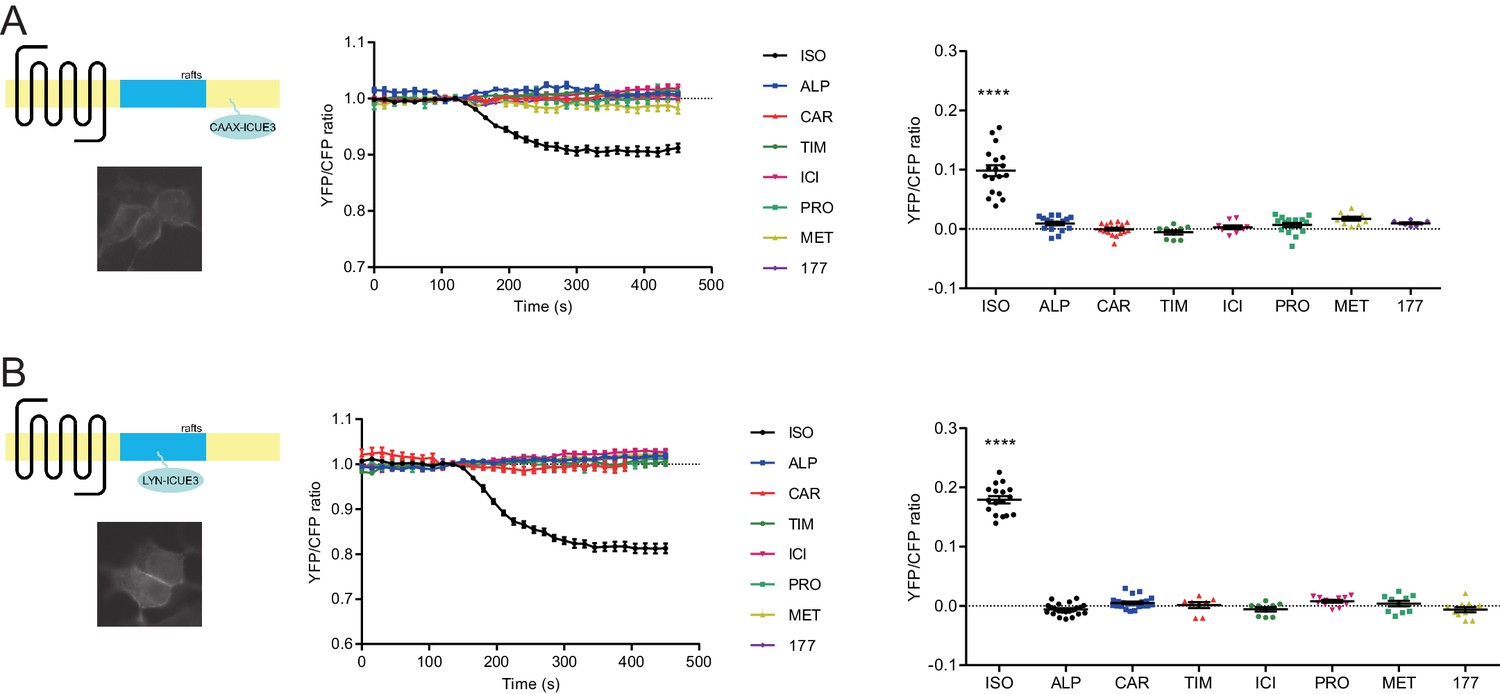
Carvedilol- and alprenolol-induced cAMP are highly restricted.
HEK293 cells expressing either CAAX-ICUE3 targeted to non-rafts regions of the plasma membrane (A) or LYN-ICUE3 targeted to rafts regions of the plasma membrane (B) were treated with 1 μM ISO or indicated β-blockers. Changes in ICUE3 FRET ratio (an indication of cAMP activity) were measured. Carvedilol- and alprenolol-induced cAMP could be detected neither by CAAX-ICUE3 nor LYN-ICUE3. ISO, isoproterenol; TIM, timolol; ALP, alprenolol; CAR, carvedilol; ICI, ICI118551; PRO, propranolol; MET, metoprolol; 177, CGP12177. Each dot in the scatter dot plot represents a value from an individual tested cell. Error bars denote s.e.m., P values are computed by one-way ANOVA followed by Tukey’s test between TIM and other groups.
Figure 4 with 1 supplement
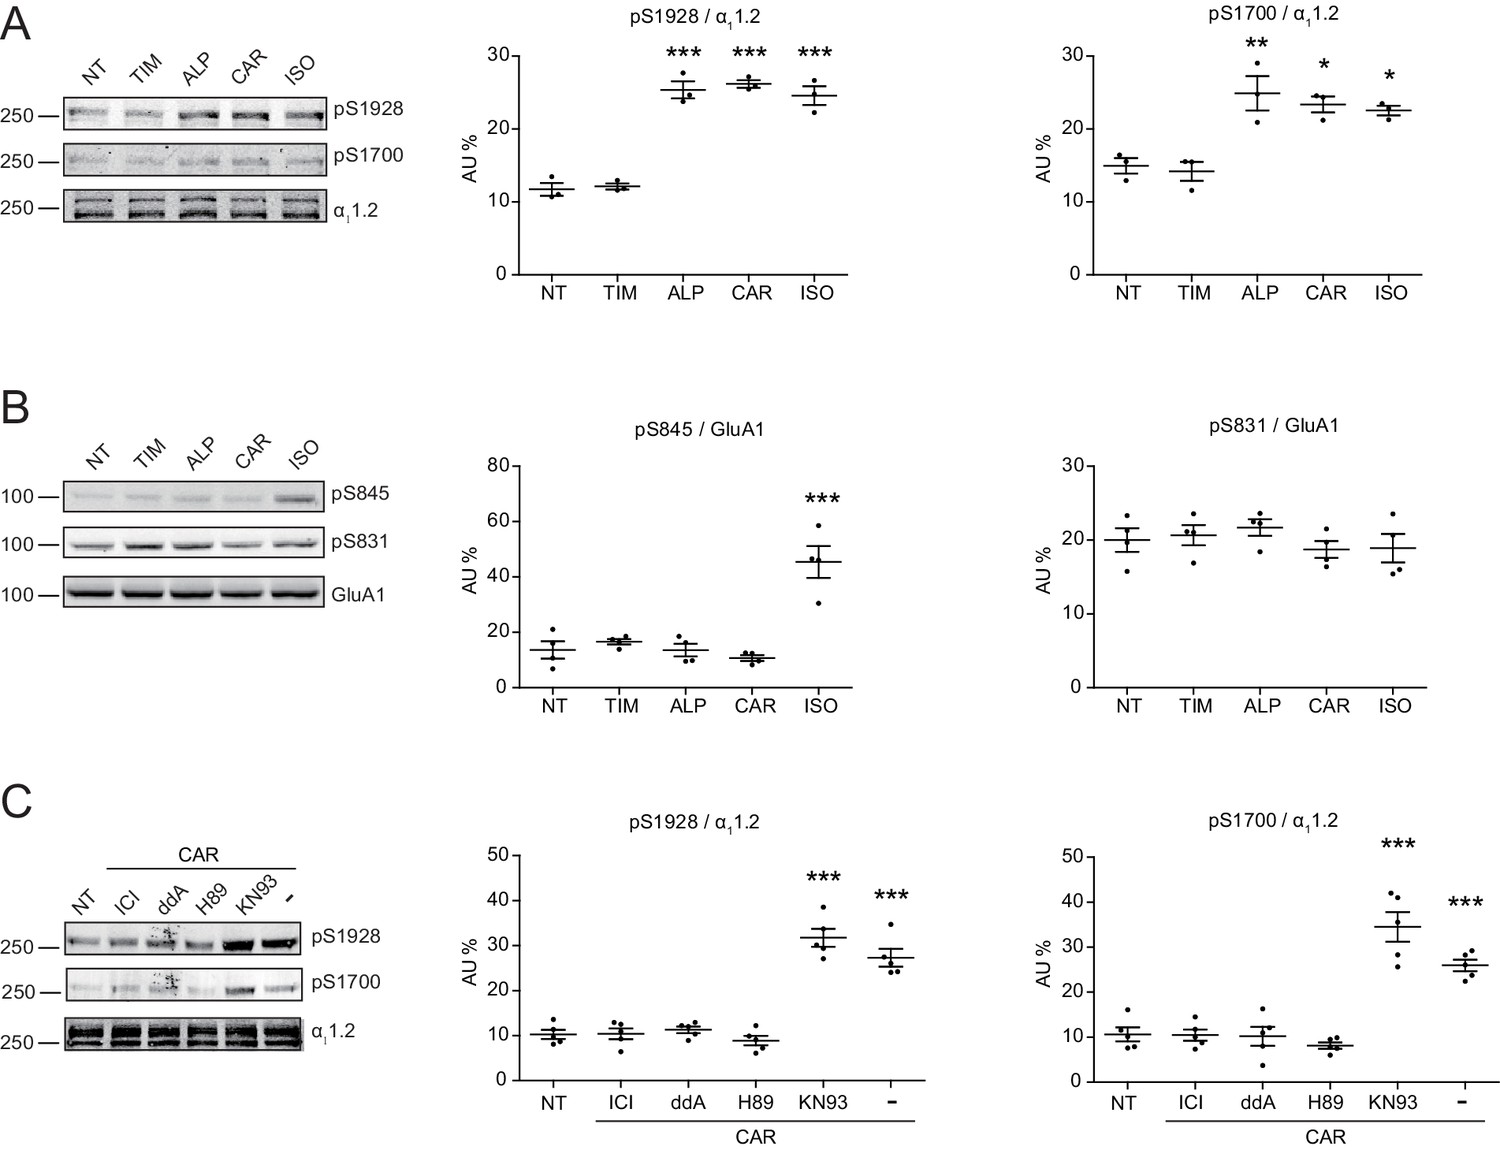
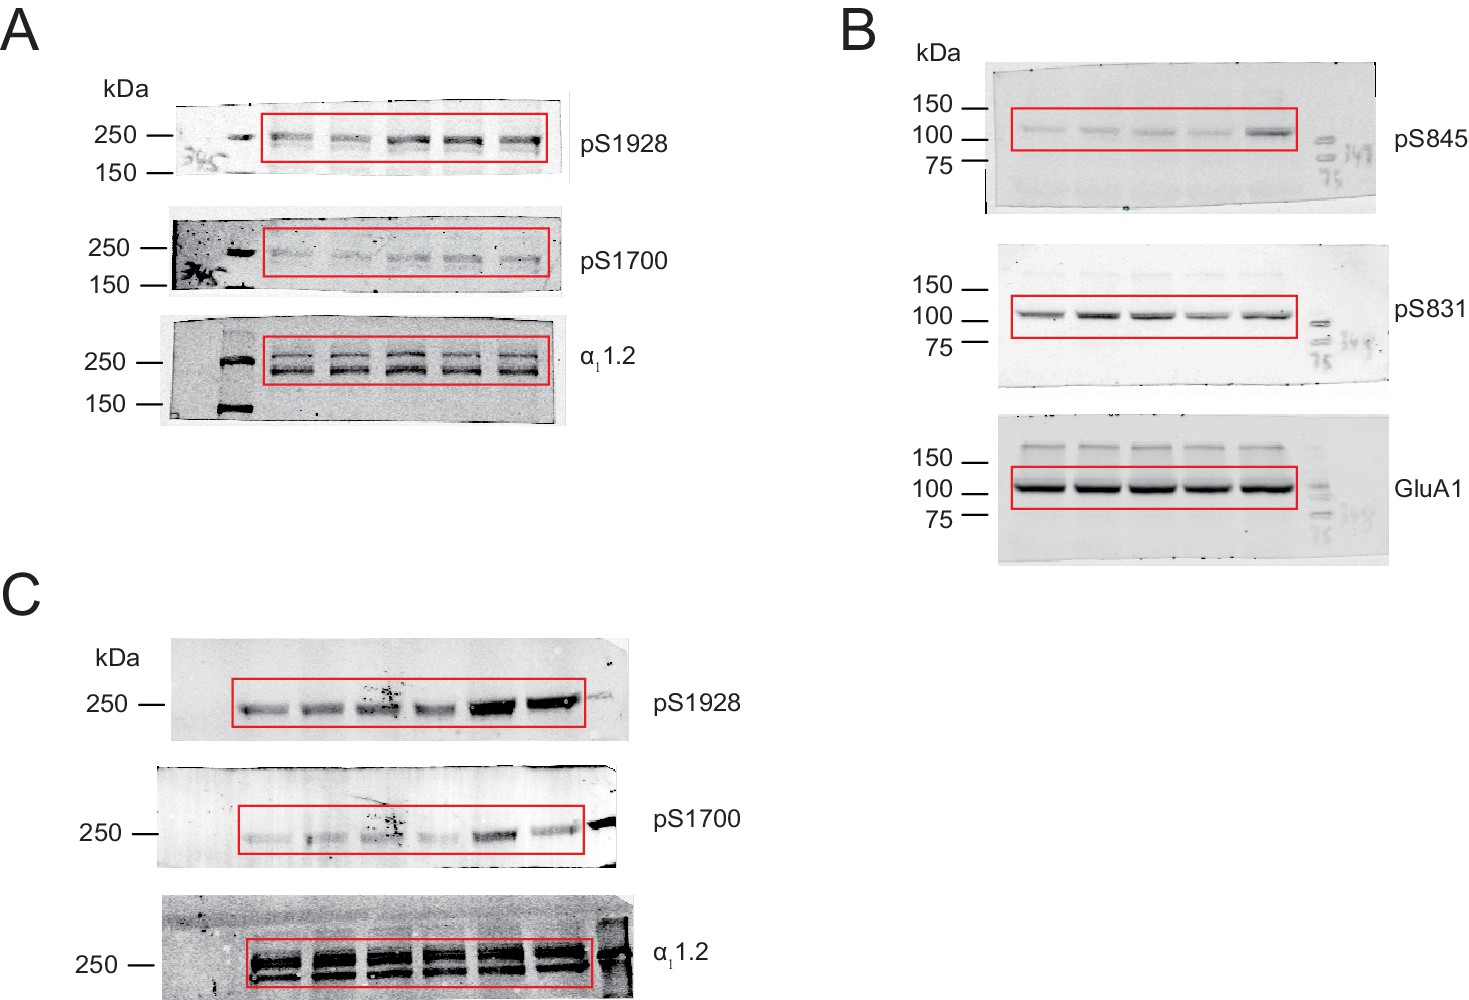
Carvedilol promotes endogenous β2AR-dependent phosphorylation of LTCC α11.2 by PKA in neurons.
(A) Rat neurons on 10–14 days in vitro (DIV) were treated for 5 min with 1 μM indicated drugs. The phosphorylation of endogenous LTCC α11.2 subunit was determined with phospho-specific antibodies, and normalized to total α11.2, n = 3. (B) Rat neurons on 10–14 DIV were treated for 5 min with 1 μM indicated drugs. The phosphorylation of endogenous AMPAR GluA1 subunit was determined with phospho-specific antibodies, and signals were normalized to total GluA1, n = 4. (C) Neurons were pretreated for 30 min with 10 μM β2AR inhibitor ICI, 50 μM AC inhibitor ddA, 10 μM PKA inhibitor H89 or 10 μM CaMKII inhibitor KN93 and then stimulated with 1 μM CAR for 5 min. Carvedilol-induced LTCC phosphorylation depends on endogenous β2AR, AC and PKA, but not CaMKII, n = 5. NT, no treatment; ISO, isoproterenol; TIM, timolol; ALP, alprenolol; CAR, carvedilol. Error bars denote s.e.m., P values are computed by one-way ANOVA followed by Tukey’s test between NT and other groups.
-
Figure 4—source data 1
Excel spreadsheet containing the individual numeric values of phosphorylated a11.2 or GluA1 / total a11.2 or GluA1 relative density analyzed in Figure 4.
- https://cdn.elifesciences.org/articles/49464/elife-49464-fig4-data1-v3.xlsx
Figure 4—figure supplement 1
Uncropped blots for Figure 4.
Figure 5 with 2 supplements
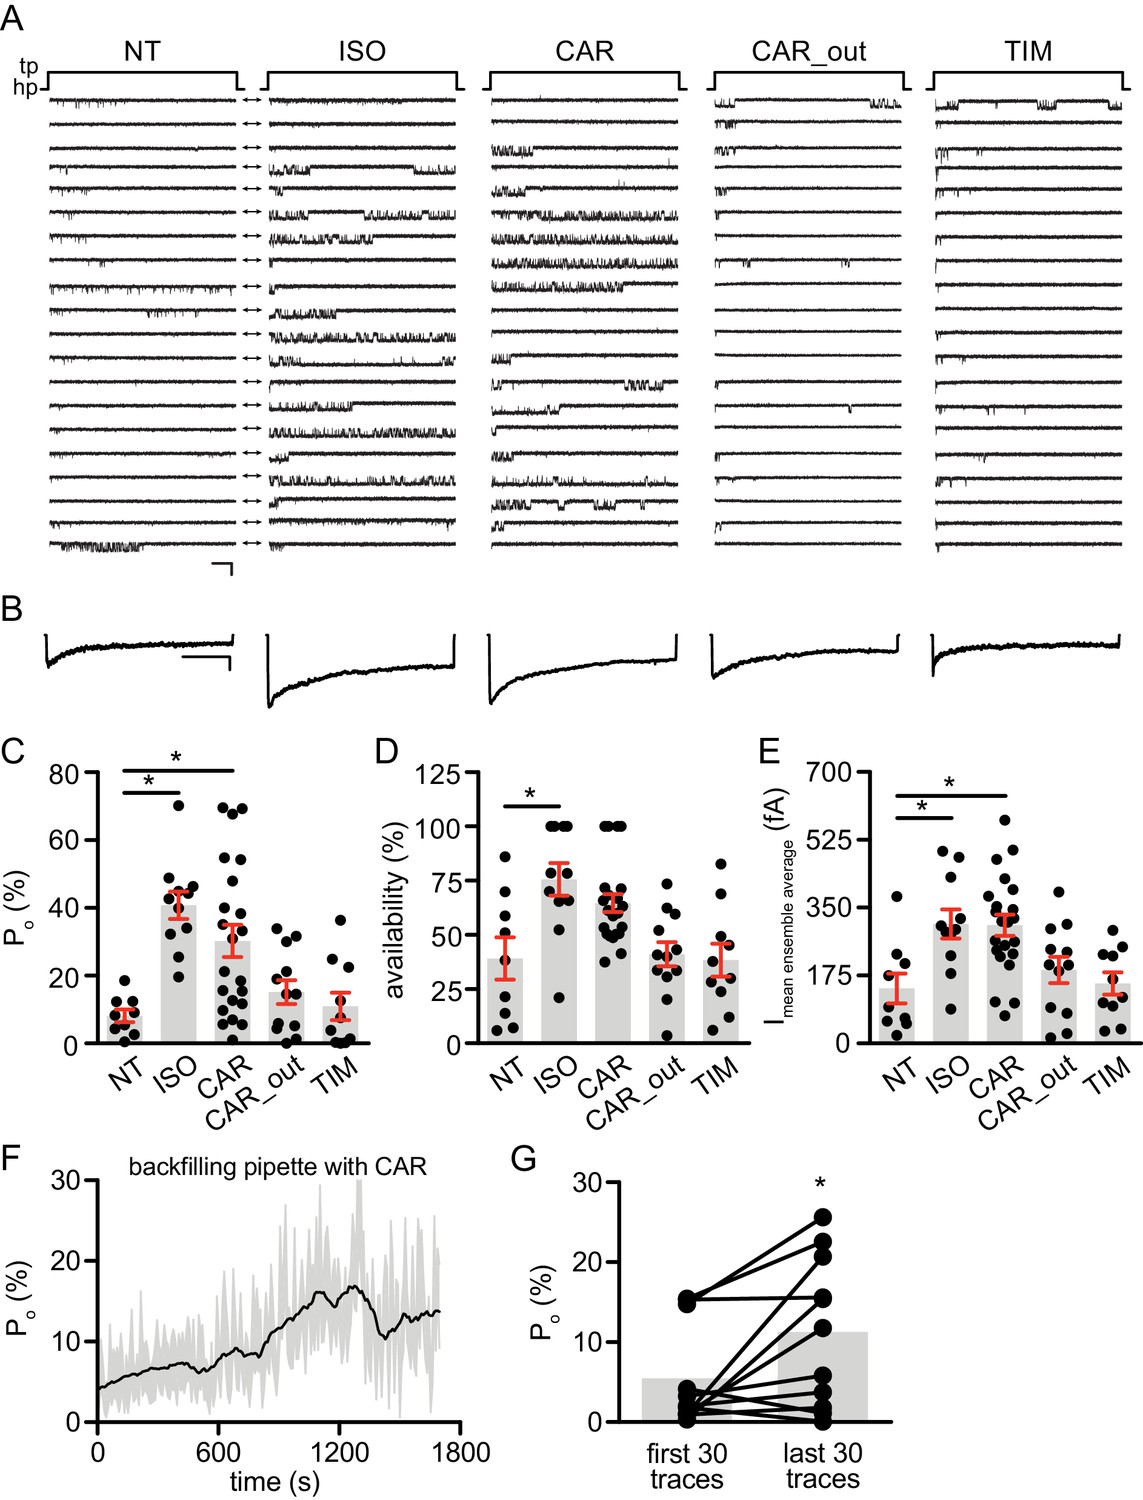
Carvedilol augments LTCC CaV1.2 channel activity in neurons.
(A) Representative single channel recordings of LTCC CaV1.2 currents using 110 mM Ba2+ as charge carrier in rat hippocampal neurons on 7–10 days in vitro (DIV) after depolarization from −80 (hp) to 0 mV (tp) in control patches (NT), patches containing 1 μM isoproterenol (ISO), 1 μM carvedilol (CAR) or 1 μM timolol (TIM) in the patch pipette or after addition of 1 μM CAR to the bath while the patch pipette contained a control pipette solution (CAR_out). Shown are 20 consecutive sweeps from representative experiments. Arrows throughout the figure indicate the 0-current level (closed channel). Scale bar denotes 2 pA and 200 ms. (B) Ensemble average currents as determined from all sweeps recorded for all the experimental conditions. Scale bar denotes 50 fA and 400 ms. (C–E) Mean ± s.e.m. for (C) Po (%), (D) availability (i.e. likelihood that a sweep had at least one event) (%) and (E) the mean ensemble average current (fA) for each experimental condition. *p<0.05 with Kruskal Wallis – Dunn’s multiple comparison test. Sweep and n numbers as well as summary statistics are in Supplementary file 1. (F) Ensemble Po versus time measurements obtained with a pipette backfilled with 1 μM CAR. The solid dark line represents the mean Po over time and the gray area is the s.e.m. at each time point. The mean line was smoothed to 15 neighbors on each size with a second order polynomial smoothing in PRISM for representation purposes only. (G) Mean Po of the first 30 traces versus the last 30 traces obtained with a pipette backfilled with 1 μM CAR. The gray boxes highlight the mean on each group. n = 11 patches. *p<0.05 with Mann-Whitney test.
-
Figure 5—source data 1
Excel spreadsheet containing the individual numeric values of Po, availability and current analyzed in Figure 5C-G.
- https://cdn.elifesciences.org/articles/49464/elife-49464-fig5-data1-v3.xlsx
Figure 5—figure supplement 1
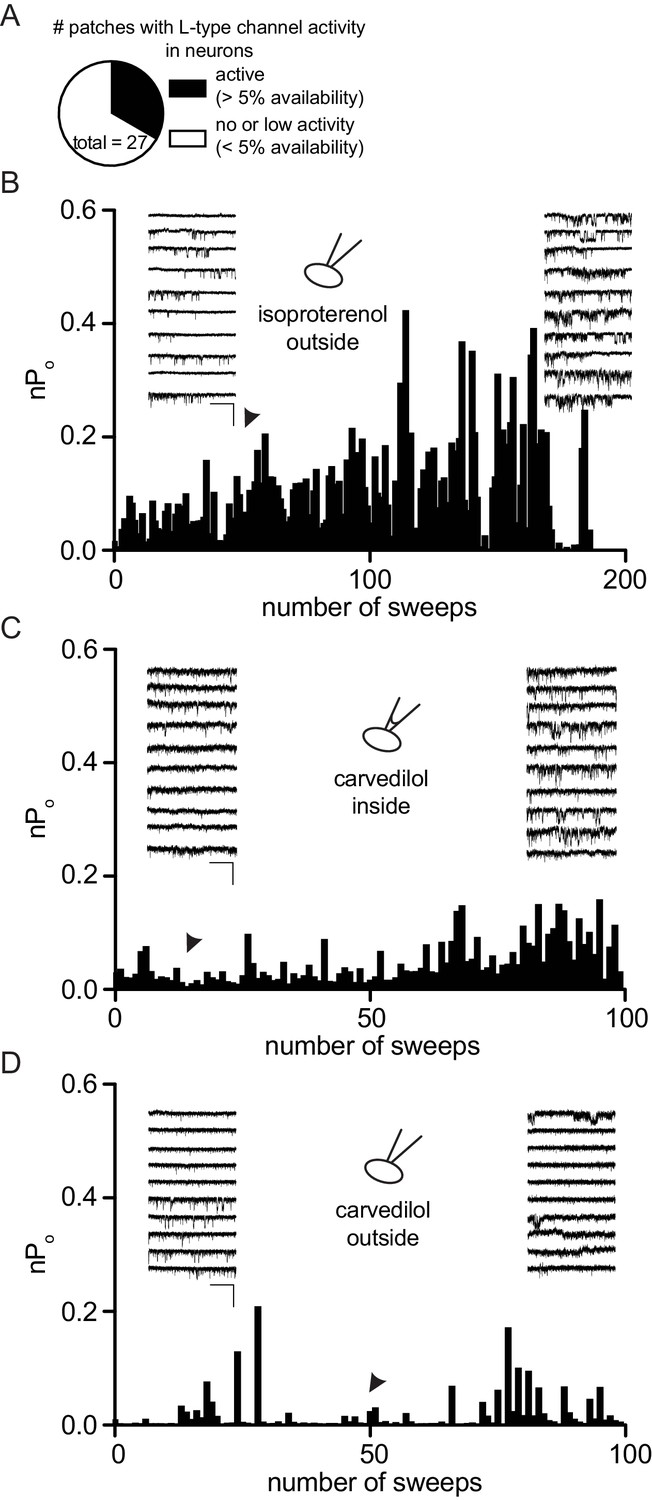
Over-time effect of carvedilol on LTCC of neurons recorded in the cell attached configuration without using BayK.
Cells were depolarized with 110 mM Ba2+ for 2 s from a holding potential of −80 mV to 0 mV and the NPopen was determined over time. (A) Diagram reflecting our patch statistics without using BayK in the recording pipette. Only about 30% of our patches showed channel activity. Cells with >5% channel availability within the first 50 sweeps were considered for our analysis. Cells with <5% availability were consequently excluded for pharmacological testing. (B) Control experiment demonstrating the effect of 1 µM isoproterenol applied through bath perfusion (n = 11 cells). (C) Over-time effect of 1 µM carvedilol applied through backfilling of the recording pipette (n = 8 cells). Tip filling was performed with pipette solution containing no carvedilol. (D) Experiment showing the effect of 1 µM carvedilol perfused into the bath solution (n = 8 cells).
Figure 5—figure supplement 2
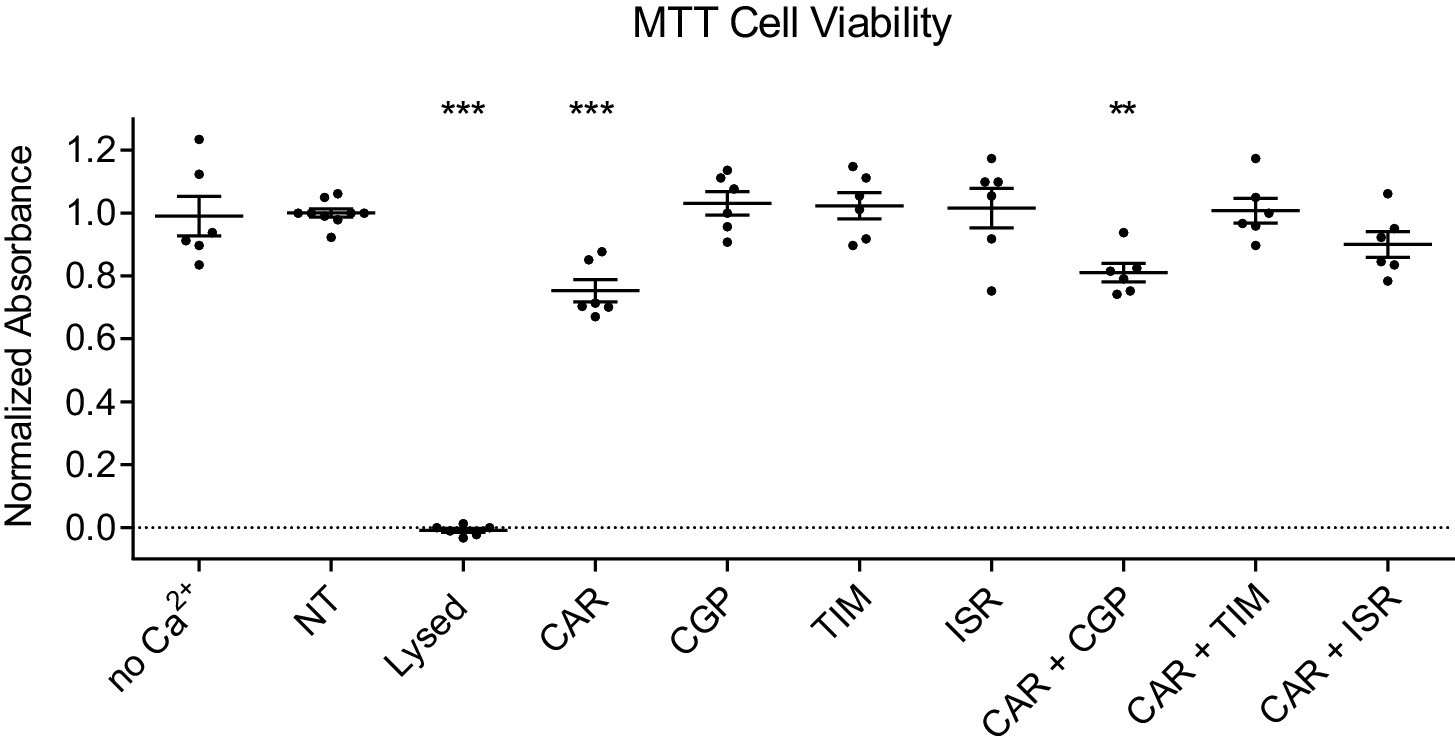
Inhibition of β2AR or LTCC counteracts carvedilol-induced cell death of cultured cortical neurons.
Rat cortical neurons on 7 days in vitro (DIV) were incubated overnight in fresh medium with or without 2 mM Ca2+ (no Ca2+), cells were then either mock treated (NT), or treated with 1 μM indicated drugs. CAR, carvedilol; CGP, CGP20712A; TIM, timolol; ISR, isradipine. MTT assay was carried out at 48 hr post drug treatment and absorbance at 540 nM was measured. The first NT well in each plate was set as basal and all the other groups were normalized to that well. The lysed group had medium removed to represent nearly 100% cell death condition. CAR show decreased cell viability, β1AR antagonist CGP does not prevent the carvedilol-induced reduction of cell viability but β1AR/β2AR antagonist TIM or LTCC blocker ISR does. Data are the mean ± s.e.m. of three individual plates. P values are computed by one-way ANOVA followed by Tukey’s test between NT and other groups.
Figure 6 with 1 supplement
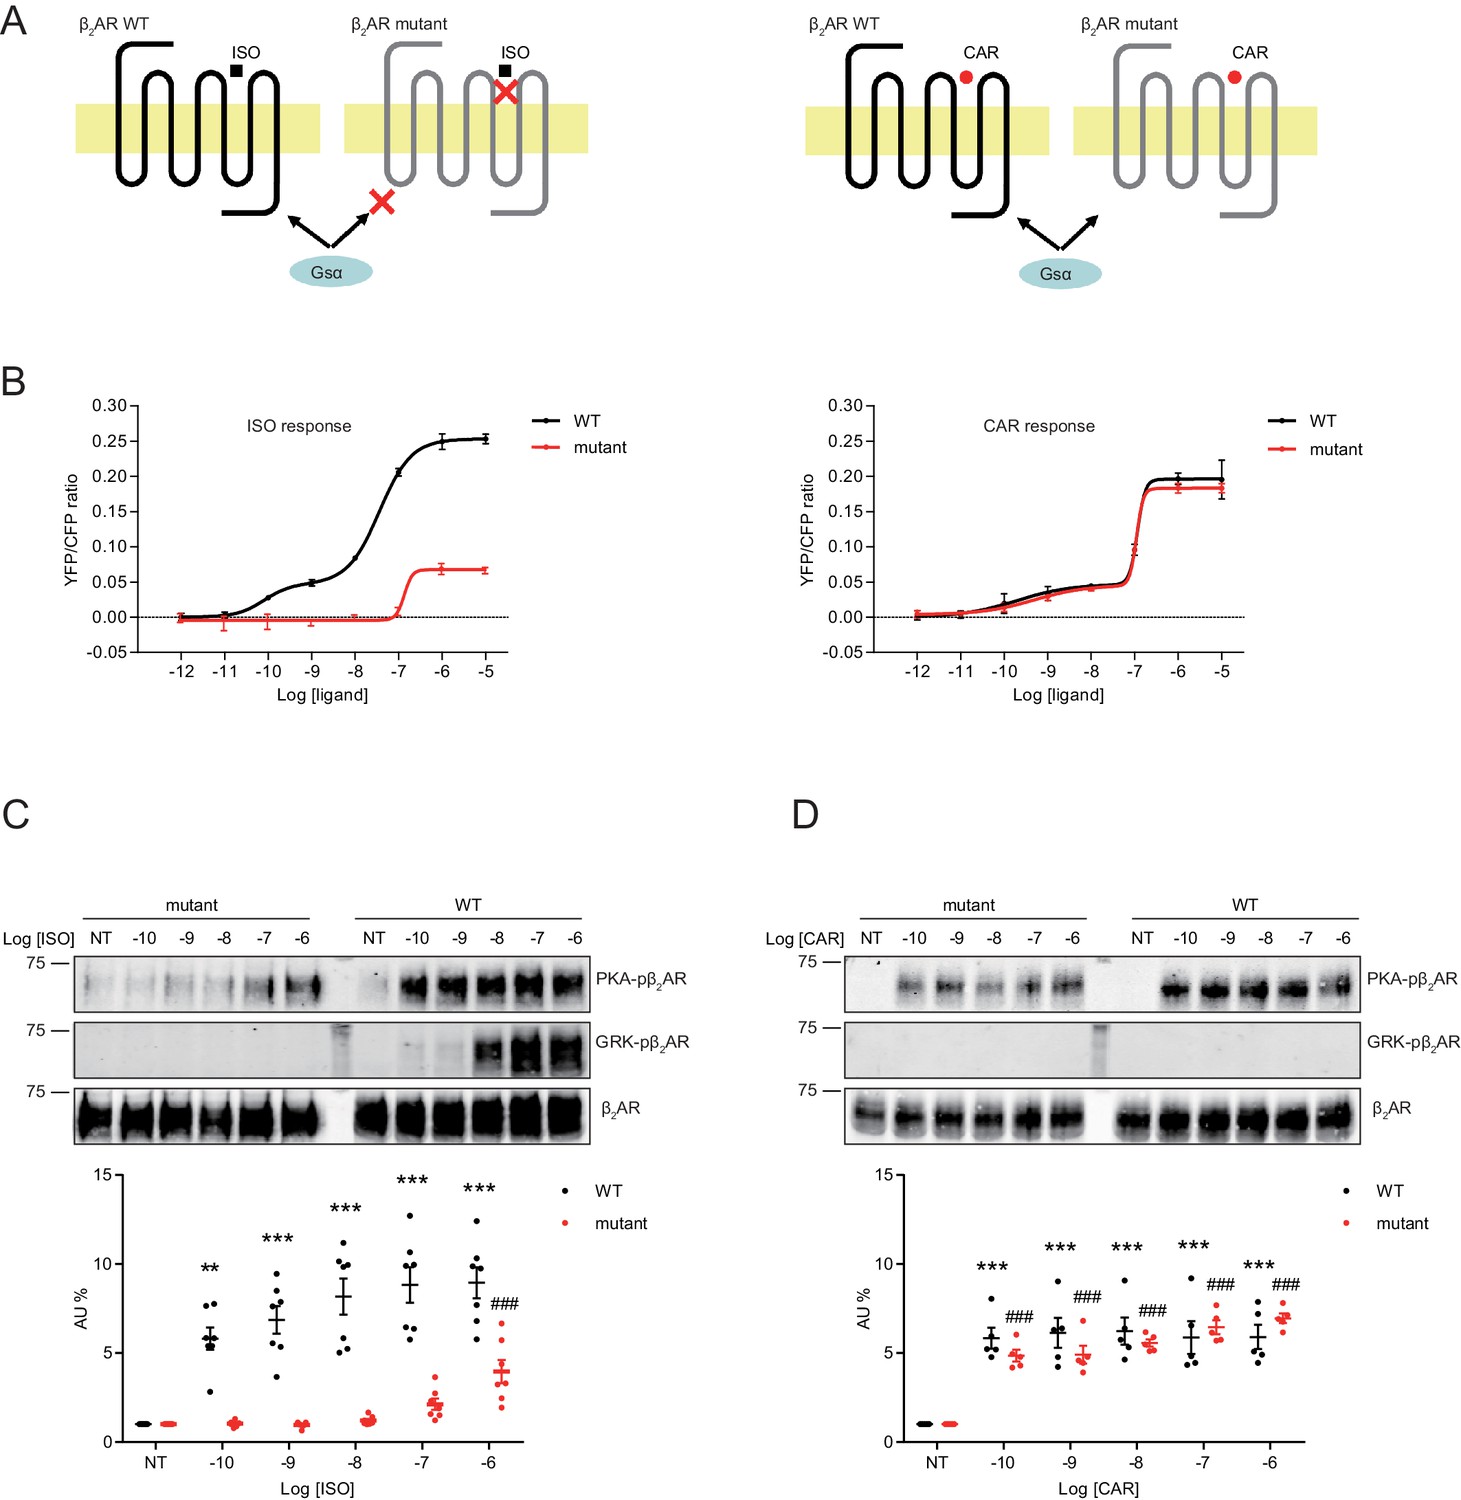
A mutant β2AR is selectively activated by carvedilol but not isoproterenol.
(A) Schematic of an engineered β2AR with S204/207A double serine mutations that loses high affinity binding to ISO but not CAR at nanomolar range. (B) cAMP biosensor ICUE3 and β2AR wild-type (WT) or mutant were co-expressed in MEF cells lacking both β1AR and β2AR. Changes of cAMP FRET ratio by increasing concentrations of ISO or CAR were measured. n = 5–29 cells. (C–D) HEK293 cells stably expressing FLAG-tagged β2AR WT or mutant were stimulated for 5 min with increasing concentrations of ISO (C), n = 7) or CAR (D), n = 5). The phosphorylation of β2AR on its PKA and GRK sites were determined with phospho-specific antibodies, and signals were normalized to total β2AR detected with anti-FLAG antibody. Experiments were performed in the presence of 1 μM β1AR-selective antagonist CGP20712A to block endogenous β1AR signaling. NT, no treatment; ISO, isoproterenol; CAR, carvedilol. Error bars denote s.e.m., P values are computed by one-way ANOVA followed by Tukey’s test between NT and other concentrations.
-
Figure 6—source data 1
Excel spreadsheet containing the individual numeric values for maximum FRET responses in Figure 6B, and the individual numeric values of phosphorylated β2AR / total β2AR relative density analyzed in Figure 6C-D.
- https://cdn.elifesciences.org/articles/49464/elife-49464-fig6-data1-v3.xlsx
Figure 6—figure supplement 1
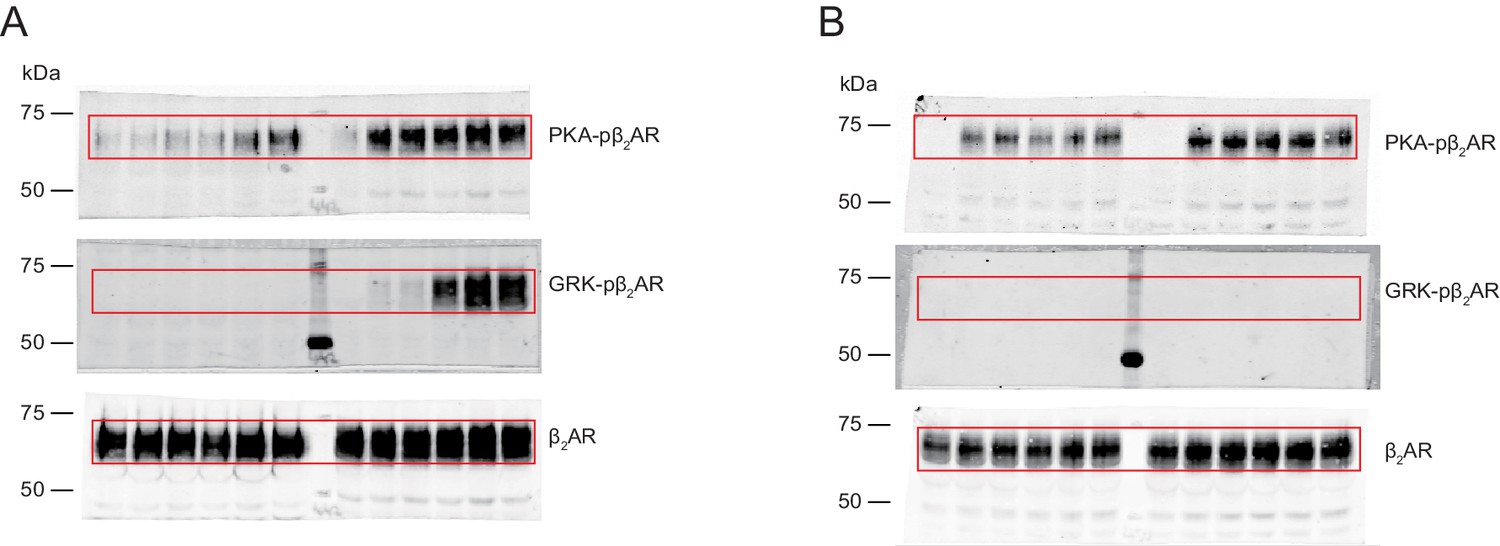
Uncropped blots for Figure 6C and D.
Figure 7 with 1 supplement
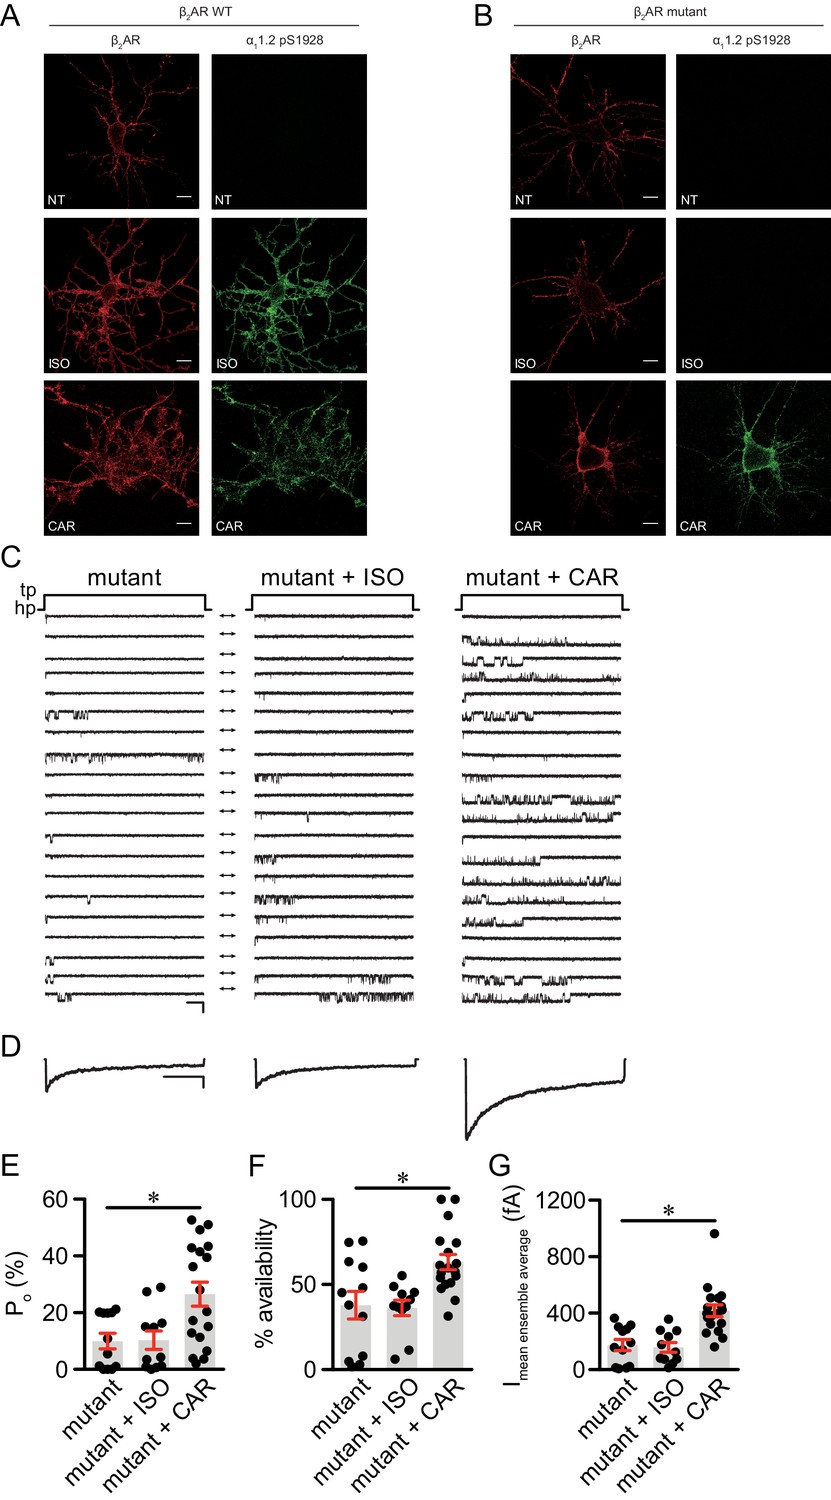
The β2AR mutant selectively supports carvedilol-induced augmentation of LTCC activity in neurons.
(A–B) β1AR/β2AR double knockout (DKO) mouse hippocampal neurons on 7–10 days in vitro (DIV) were cotransfected with FLAG-tagged β2AR WT (A) or mutant (B) and HA-tagged LTCC α11.2 subunit, 24 hr later cells were either mock treated (NT), or treated for 5 min with 10 nM isoproterenol (ISO) or carvedilol (CAR), fixed and labeled with anti-FLAG and a phospho-specific antibody for S1928 phosphorylated α11.2. Confocal images show mutant β2AR losts the ability of promoting LTCC phosphorylation upon ISO stimulation but remained the ability upon CAR stimulation in neurons. Scale bar, 10 μm. Representative of 6 images for each condition, three experiments. (C) Representative single channel recordings of LTCC CaV1.2 currents using 110 mM Ba2+ as charge carrier in DKO neurons on 7–10.days DIV expressing mutant β2AR after depolarization from −80 to 0 mV in in control patches (mutant) and patches containing 1 μM isoproterenol (ISO) or 1 μM carvedilol (CAR) in the patch pipette. Shown are 20 consecutive sweeps from representative experiments. Arrows throughout the figure indicate the 0-current level (closed channel). Scale bar denotes 2 pA and 200 ms. (D) Ensemble average currents as determined from all sweeps recorded for all the experimental conditions. Scale bar denotes 50 fA and 400 ms. (E–G) Mean ± s.e.m. for (E) Po (%), (F) availability (i.e. likelihood that a sweep had at least one event) (%) and (G) the mean ensemble average current (fA) for each experimental condition. *p<0.05 with Kruskal Wallis – Dunn’s multiple comparison test. Sweep and n numbers as well as summary statistics are in Supplementary file 2.
-
Figure 7—source data 1
Excel spreadsheet containing the individual numeric values of Po, availability and current analyzed in Figure 7E-G.
- https://cdn.elifesciences.org/articles/49464/elife-49464-fig7-data1-v3.xlsx
Figure 7—figure supplement 1
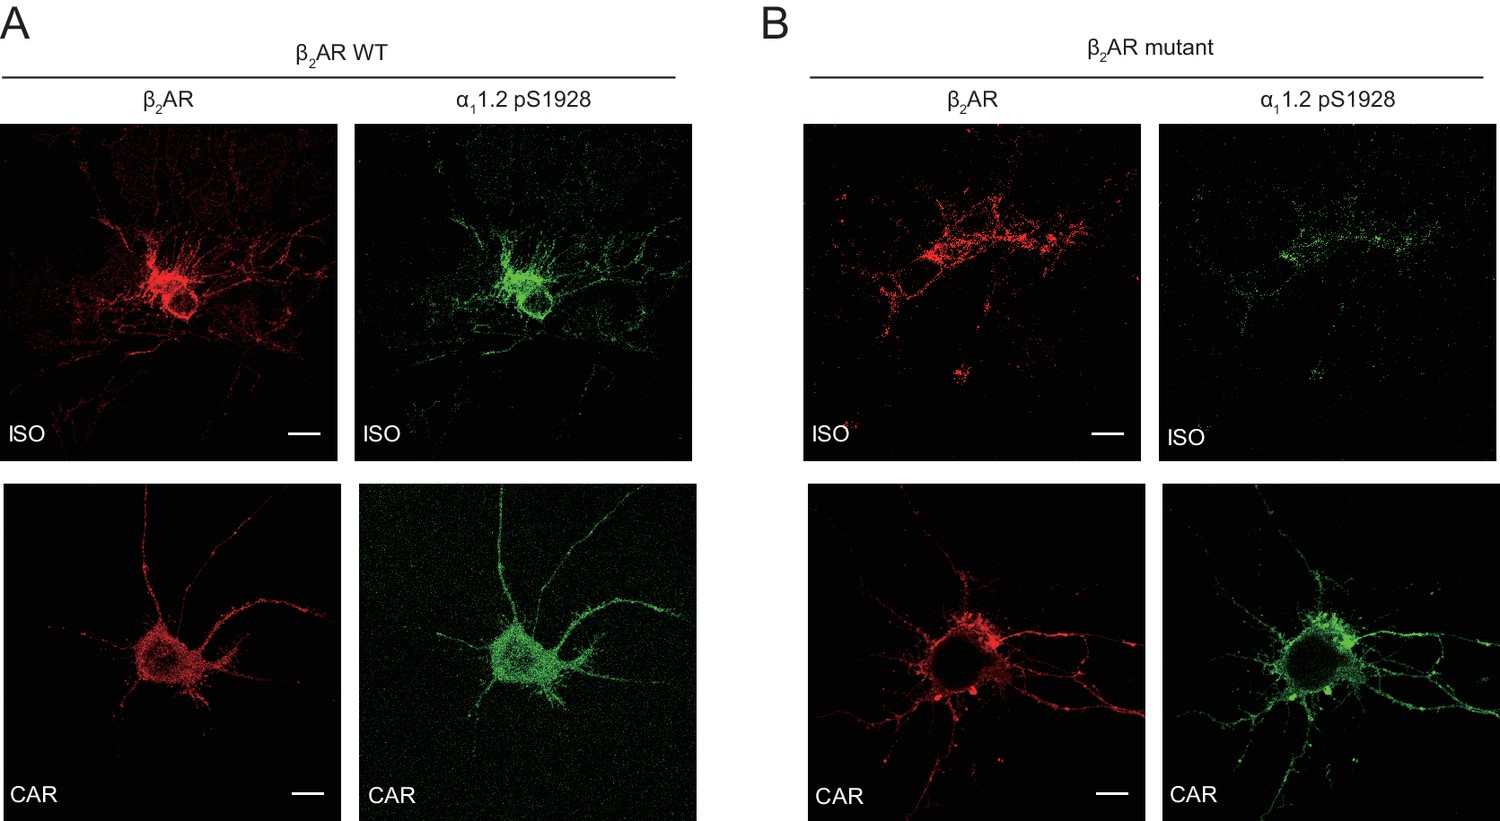
The mutant β2AR is selectively activated by carvedilol and promotes LTCC phosphorylation in neurons.
β1AR/β2AR double knockout (DKO) hippocampal mouse neurons at 7–10 days in vitro (DIV) were cotransfected with FLAG-tagged β2AR WT (A) or mutant (B) and HA-tagged LTCC α11.2 subunit, 24 hr later cells were treated for 5 min with 1 μM ISO or CAR, fixed and labeled with anti-FLAG and a phospho-specific antibody for S1928 phosphorylated α11.2. Confocal images show mutant β2AR lost the ability of promoting LTCC phosphorylation upon ISO stimulation but remained the ability upon CAR stimulation in mouse neurons. Scale bar, 10 μm. Representative of n = 4, 6, 5 and 6 cells, respectively, three experiments.
Tables
Key resources table
| Reagent type (species) or resource | Designation | Source or reference | Identifiers | Additional information |
|---|---|---|---|---|
| Strain (Mus musculus) | β1AR/β2AR double knockout | Jackson Laboratories | Stock # 003810 | |
| Strain (Rattus norvegicus) | Sprague Dawley | Charles River Laboratories | ||
| Cell line (Homo sapiens) | HEK293/β2AR-WT | De Arcangelis et al., 2009 | HEK293 cells stably expressing FLAG-β2AR | |
| Cell line (Homo sapiens) | HEK293/β2AR-S204/207A | This paper | HEK293 cells stably expressing FLAG-β2AR-S204/207A | |
| Antibody | Phospho-β2AR (Ser261/262) (mouse monoclonal) | Dr. Richard Clark (UT Huston) | Clone 2G3 | IF (1 μg/ml), WB (1:1000) |
| Antibody | Phospho-β2AR (Ser355/356) (mouse monoclonal) | Dr. Richard Clark (UT Huston) | Clone 10A5 | WB (1:1000) |
| Antibody | β2AR (rabbit polyclonal) | Santa Cruz Biotechnology | sc-570 RRID:AB_2225412 | PLA (1:100), WB (1:1000) |
| Antibody | Phospho-β2AR (Ser355/356) (rabbit polyclonal) | Santa Cruz Biotechnology | sc-16719R RRID:AB_781609 | WB (1:1000) |
| Antibody | α11.2 (rabbit polyclonal) | Patriarchi et al., 2016 | FP1 | WB (1:1000) |
| Antibody | Phospho-α11.2 (Ser1928) (rabbit polyclonal) | Patriarchi et al., 2016 | CH3P | IF (1 μg/ml), WB (1:1000) |
| Antibody | Phospho-α11.2 (Ser1700) (rabbit polyclonal) | Patriarchi et al., 2016, Originally from Dr. William Catterall (U of Washington) | WB (1:1000) | |
| Antibody | GluA1 (rabbit polyclonal) | Patriarchi et al., 2016 | WB (1:1000) | |
| Antibody | Phospho-GluA1 (Ser831) (rabbit polyclonal) | Patriarchi et al., 2016 | WB (1:1000) | |
| Antibody | Phospho-GluA1 (Ser845) (rabbit polyclonal) | Patriarchi et al., 2016 | WB (1:1000) | |
| Antibody | FLAG-M1 | Sigma-Aldrich | F3040 RRID:AB_439712 | IF (1 μg/ml), WB (1:1000) |
| Antibody | HA | Covance | MMS-101R RRID:AB_291262 | PLA (1:1000) |
| Recombinant DNA reagent | β2AR-mutant | This paper | FLAG-tagged human β2AR with S204/207A double mutations | |
| Recombinant DNA reagent | β2AR-ICUE3 | This paper | ICUE3 fused to the C-terminal of human β2AR | |
| Commercial assay or kit | Duolink in situ detection reagents | Sigma-Aldrich | DUO92007 | PLA |
| Software, algorithm | pCLAMP10 | Molecular Devices | electrophysiology | |
| Software, algorithm | MetaFluor | Molecular Devices | FRET |
Additional files
-
Supplementary file 1
Biophysical properties of L-type Ca2+ currents in the neurons recorded in Figure 5A–5E.
Values are mean ± SEM. *p<0.05 with Kruskal Wallis – Dunn’s multiple comparison test.
- https://cdn.elifesciences.org/articles/49464/elife-49464-supp1-v3.docx
-
Supplementary file 2
Biophysical properties of L-type Ca2+ currents in the neurons recorded in Figure 7C–7G.
Values are mean ± SEM. *p<0.05 with Kruskal Wallis – Dunn’s multiple comparison test.
- https://cdn.elifesciences.org/articles/49464/elife-49464-supp2-v3.docx
-
Transparent reporting form
- https://cdn.elifesciences.org/articles/49464/elife-49464-transrepform-v3.docx
Download links
A two-part list of links to download the article, or parts of the article, in various formats.
Downloads (link to download the article as PDF)
Open citations (links to open the citations from this article in various online reference manager services)
Cite this article (links to download the citations from this article in formats compatible with various reference manager tools)
β-blockers augment L-type Ca2+ channel activity by targeting spatially restricted β2AR signaling in neurons
eLife 8:e49464.
https://doi.org/10.7554/eLife.49464


