Single cell analysis reveals immune cell–adipocyte crosstalk regulating the transcription of thermogenic adipocytes
- University of California, Los Angeles, United States
- Icahn School of Medicine at Mount Sinai, United States
Figures
Figure 1 with 1 supplement

Ablation of IL10Rα in adipocytes increases energy expenditure and protects mice from diet-induced obesity.
(A) Immunoblot analysis of IL10Rα expression in SVF and adipocyte fractions of iWAT from chow-fed 10 week-old mice. (B) Oxygen consumption (VO2, ml/hr), energy expenditure (EE, kCal/hr), and carbon dioxide production (VCO2, ml/hr) of chow-fed 10-week-old IL10RαF/F and AdIL10Rα KO mice were analyzed in Columbus Oxymax metabolic chambers (12 hr light/dark cycles, 72 hr total duration, each light/dark bar represents 12 hr duration). N = 9,7. Statistical analysis was performed using ANCOVA. (C) External appearance of representative 9 week HFD-fed mice. (D) Body weight of mice fed chow diet for 10 weeks and then 60% high-fat diet (HFD) for 9 weeks. N = 13, 7. (E) Fat and lean mass of mice in D fed HFD for 6 weeks. (F) Internal and gross appearance of iWAT from representative IL10RαF/F and AdIL10RαKO mice. *, p<0.05.
Figure 1—figure supplement 1
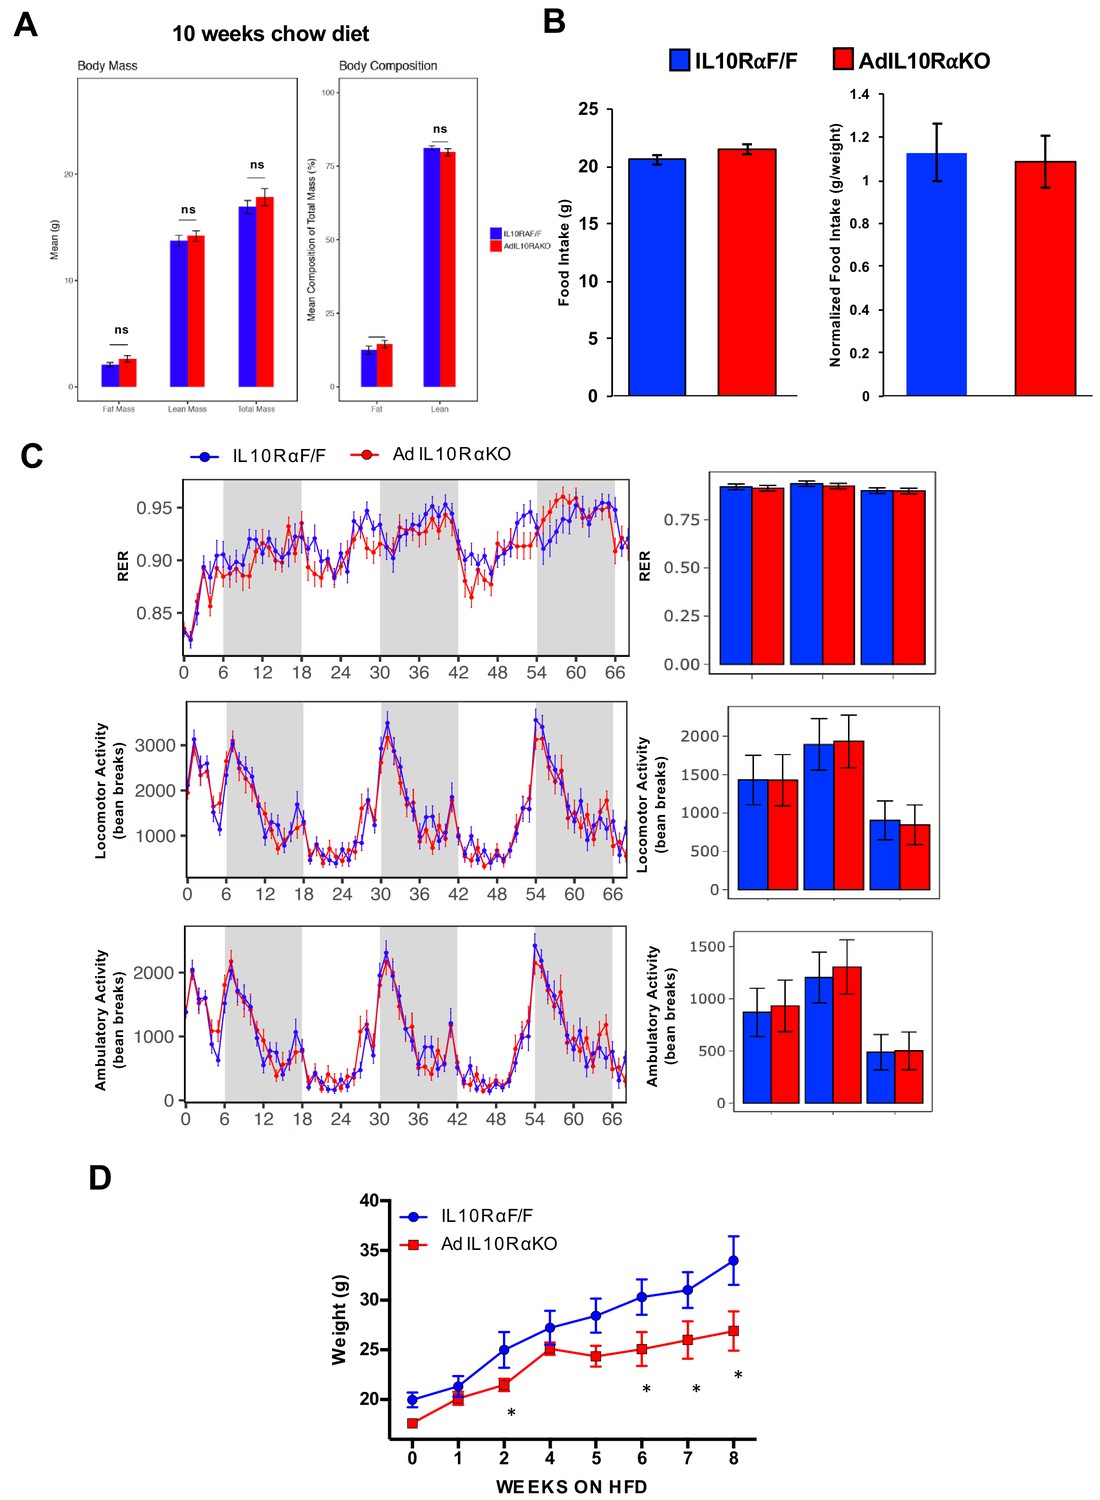
AdIL10Rα KO mice are protected against diet-induced obesity.
(A) Body mass and composition of 10 week-old chow-fed mice. (B) Food intake of chow-fed mice. (C) RER, locomotion and ambulatory activity of chow-fed 10-week-old IL10Rα F/F and AdIL10Rα KO mice analyzed by Columbus Oxymax metabolic chambers (12 hr light/dark cycles, 72 hr total duration, each light/dark bar represents 12 hr duration; N = 9,7). (D) Body weight of mice fed chow diet for 10 weeks and then 60% high-fat diet (HFD) for 9 weeks. N = 7,5.
Figure 2
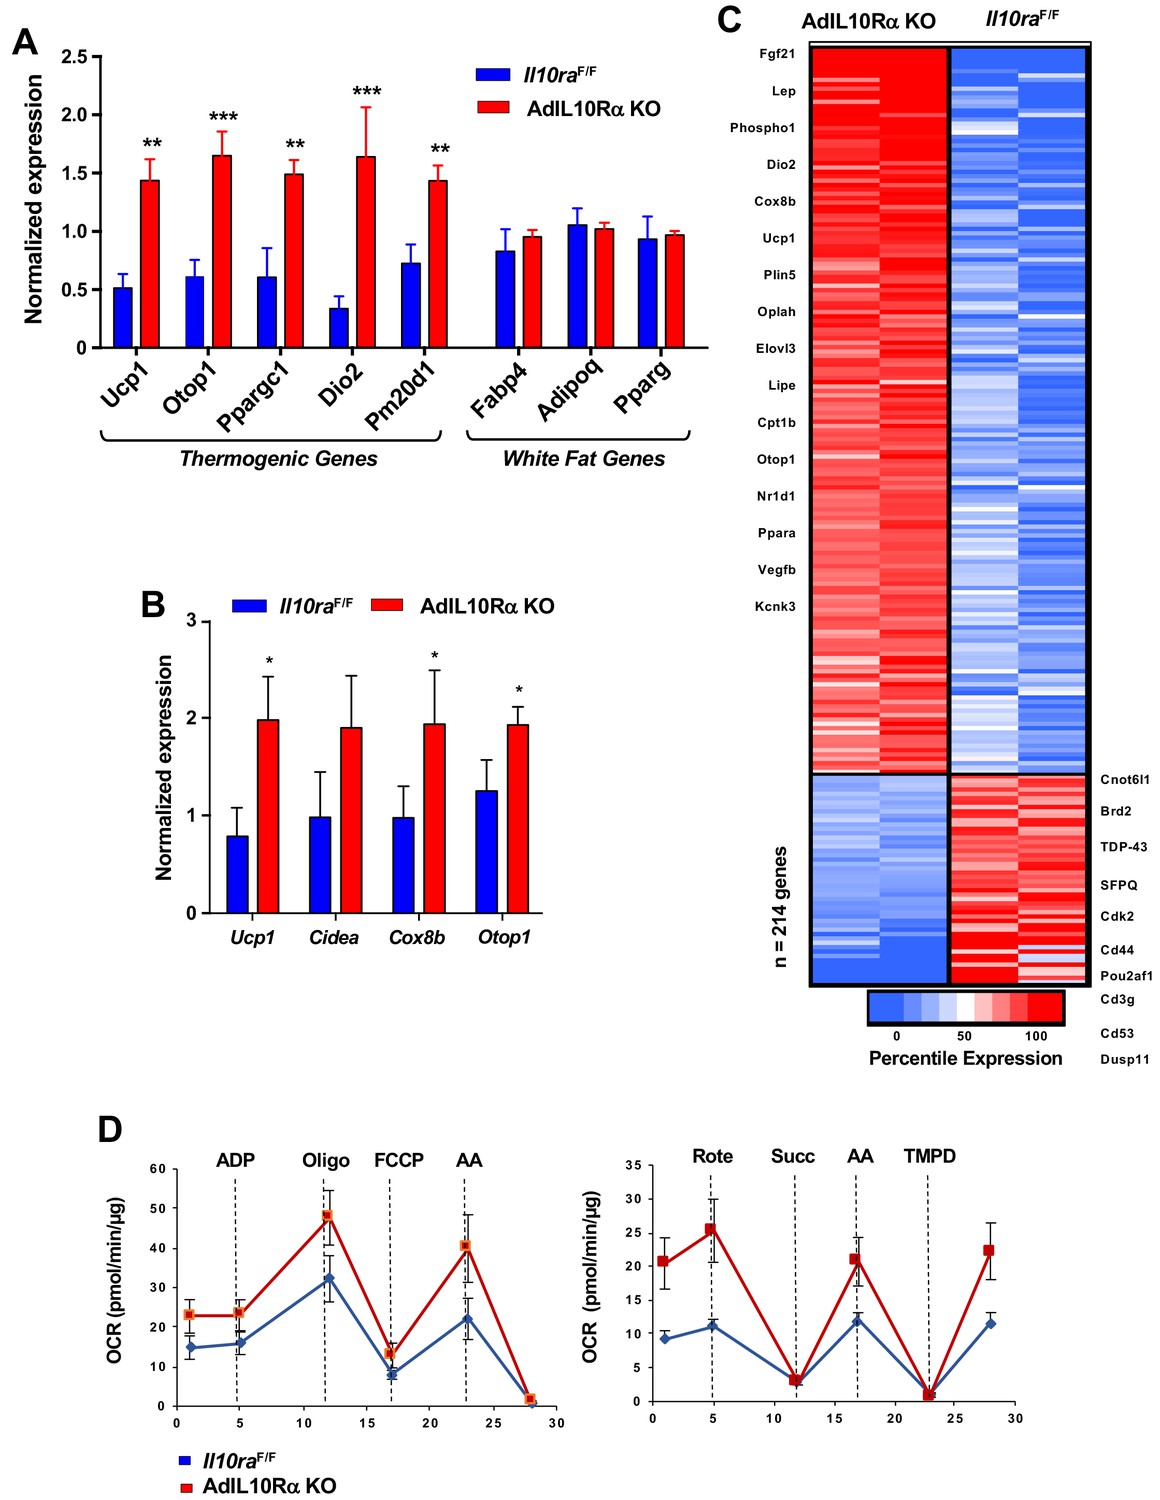
IL10R deficiency promotes adipose tissue browning.
(A and B) Real-time PCR analysis of gene expression in iWAT from 10 week 24 hr cold-exposed (A) or CL 1 mg/kg/day for 4 days; B) IL10RαF/F and AdIL10RαKO mice. N = 5,5. *, p<0.05; **, p<0.01; ***, p<0.0001. (C) Heatmap representation of genes that changed >1.5 fold (p-value<0.01) as a function of percentile expression by RNA-Seq of iWAT from 10 week-old 24 hr cold-exposed IL10Rα and AdIL10Rα KO mice. Genes are grouped as upregulated (Red) or downregulated (Blue). (D) Average oxygen consumption rate (OCR) in coupling (left) and electron flow (right) assays of mitochondria isolated from iWAT of mice in (A).
Figure 3 with 1 supplement
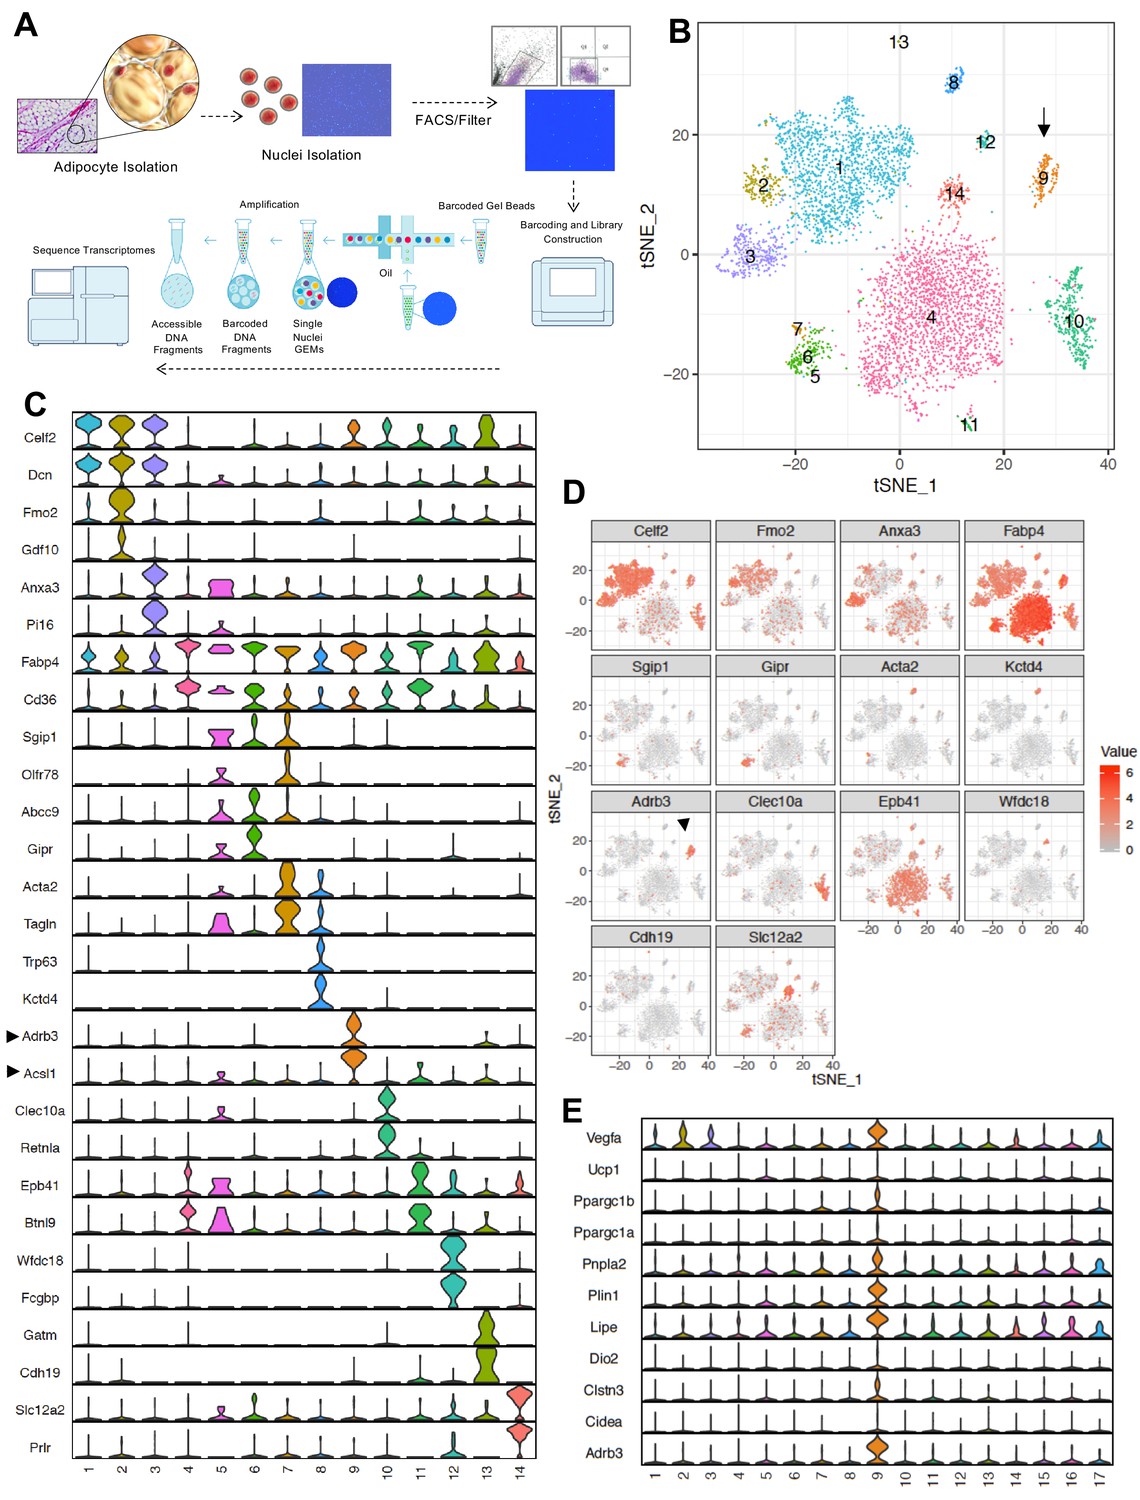
SNAP-seq reveals heterogeneity of tissue adipocytes from iWAT.
(A) Workflow showing DAPI-stained nuclei pre- and post-FACS/filtration that underwent microfluidic partitioning and library preparation in the 10X genomics platform followed by sequencing using an Illumina HiSeq 4000. (B) tSNE-plot showing 14 clusters from ~6000 adipocytes derived from iWAT of mice exposed to cold for 24 hr. Each colored dot is an adipocyte assigned to a cluster based on transcriptomic signature. (C) Normalized expression values of the top two adipocyte subtype-specific cluster genes from (B) plotted as violin plots with clusters as rows and genes as columns. (D) tSNE-plot showing cluster-specific expression of selected marker genes from (C). (E) Normalized expression values of indicated genes in subtype-specific clusters plotted as violin plots with clusters as rows and genes as columns. Black arrow is pointing toward metabolically active Type nine adipocyte cluster and enriched gene.
Figure 3—figure supplement 1
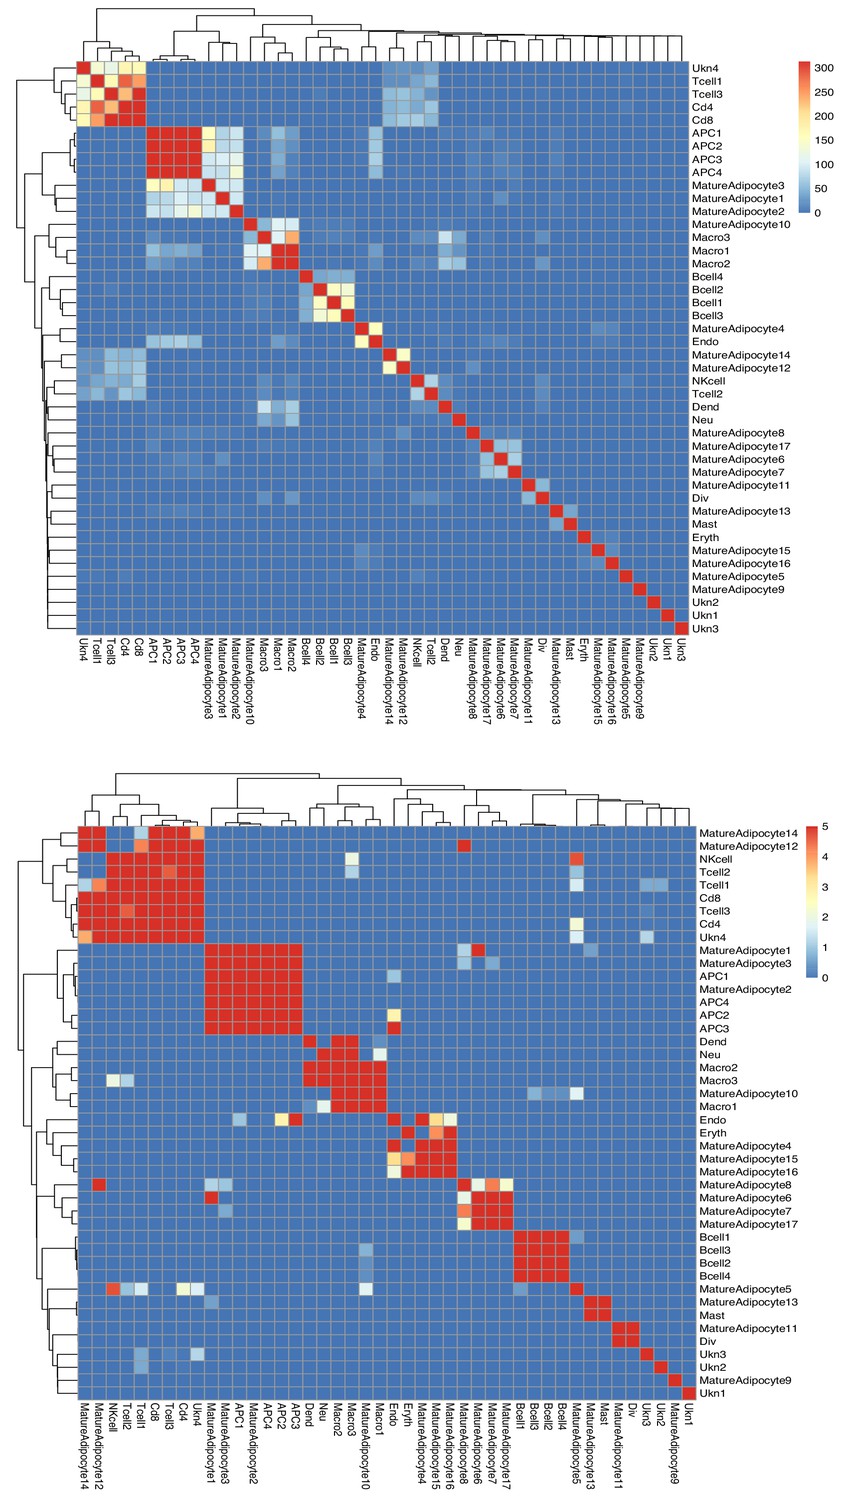
Multimodal analysis of SVF and adipocyte single-cell sequencing data.
Hierarchical plot showing correlation of single cell/nuclei gene expression between SVF and adipocyte clusters. Cell types from both mature adipocyte nuclei and SVF single cells were used in this analysis. They were grouped using hierarchical clustering with tiles colored by unadjusted (top) -Log10 Bonferroni adjusted p-values (bottom). Unadjusted (top) and adjusted (bottom) p-values were thresholded to aid in visualization with values less than 10−5 set to 10−5.
Figure 4 with 2 supplements
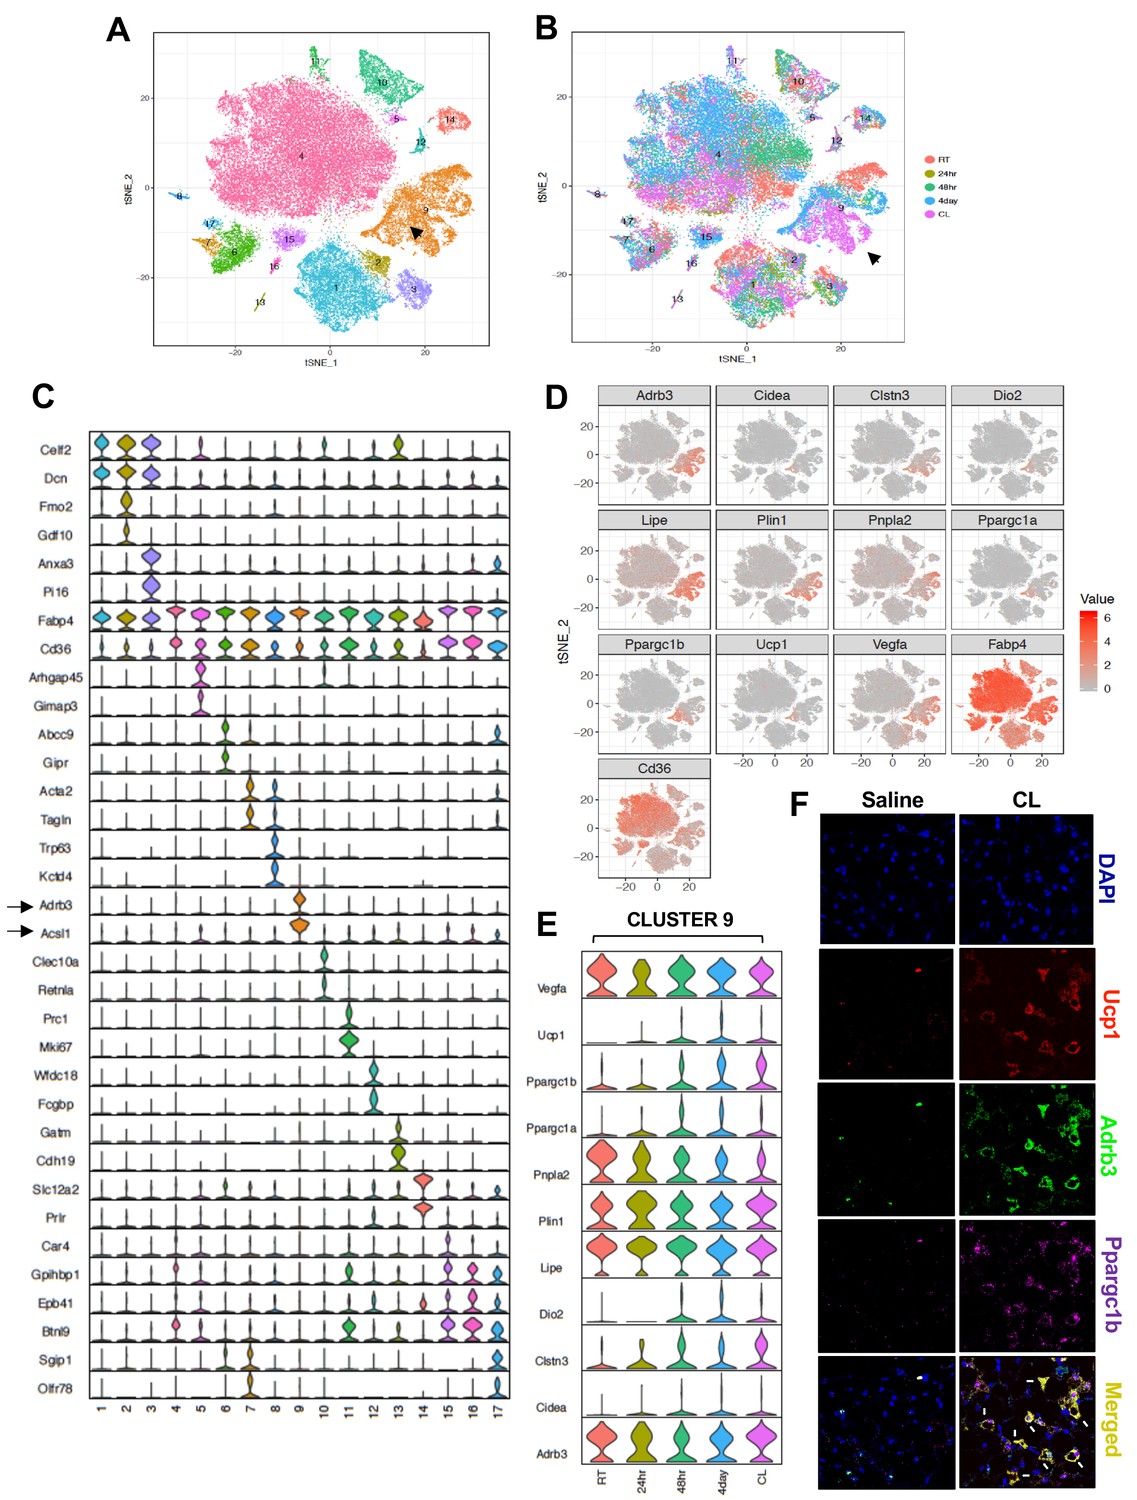
Transcriptomic visualization of thermogenic adipocytes in iWAT.
(A) Aggregated tSNE-plot showing 17 clusters from ~54,000 adipocytes derived from iWAT of mice at RT, cold-exposed (24 hr, 48 hr, and 4 days), or treated with CL for 4 days at 1 mg/kg/day. Each colored dot is an adipocyte that falls into a cluster based on transcriptomic signature. (B) tSNE-plot showing indicated treatment-dependent sub-clustering of aggregated clusters shown in (A). Black arrow indicates the Type nine adipocyte cluster. (C) Normalized expression values of the top two adipocyte subtype-specific cluster genes from (A and B) plotted as violin plots with clusters as rows and genes as columns. (D) tSNE-plot showing distribution of indicated genes from adipocytes from (A). (E) Normalized expression values of indicated genes in the Type nine adipocyte cluster under different treatment condition plotted as violin plots with treatment conditions as rows and genes as columns. (F) RNAScope FISH (see Materials and methods) of indicated probes from iWAT of mice treated with saline or CL for 4 days at 1 mg/kg/day.
Figure 4—figure supplement 1

Enrichment of cells involved in lipid mobilization in Cluster nine adipocytes.
(A and B) Gene set pathways obtained from GO Biological Processes and KEGG were used to find the functions of the different cell types. The top five enriched pathways determined by FDR from each cell type cluster were selected (from Supplementary file 1) and only unique pathways were kept (some top enriched pathways were shared across cell type clusters). Enriched pathways (rows) were clustered with hierarchical clustering. The size of each dot represents the -log10 FDR of the pathway enrichment and the color of each dot corresponds to the fold enrichment of each pathway (red- higher enrichment, gray- lower enrichment). Dotted blue squares highlight pathways enriched in cluster 9.
Figure 4—figure supplement 2
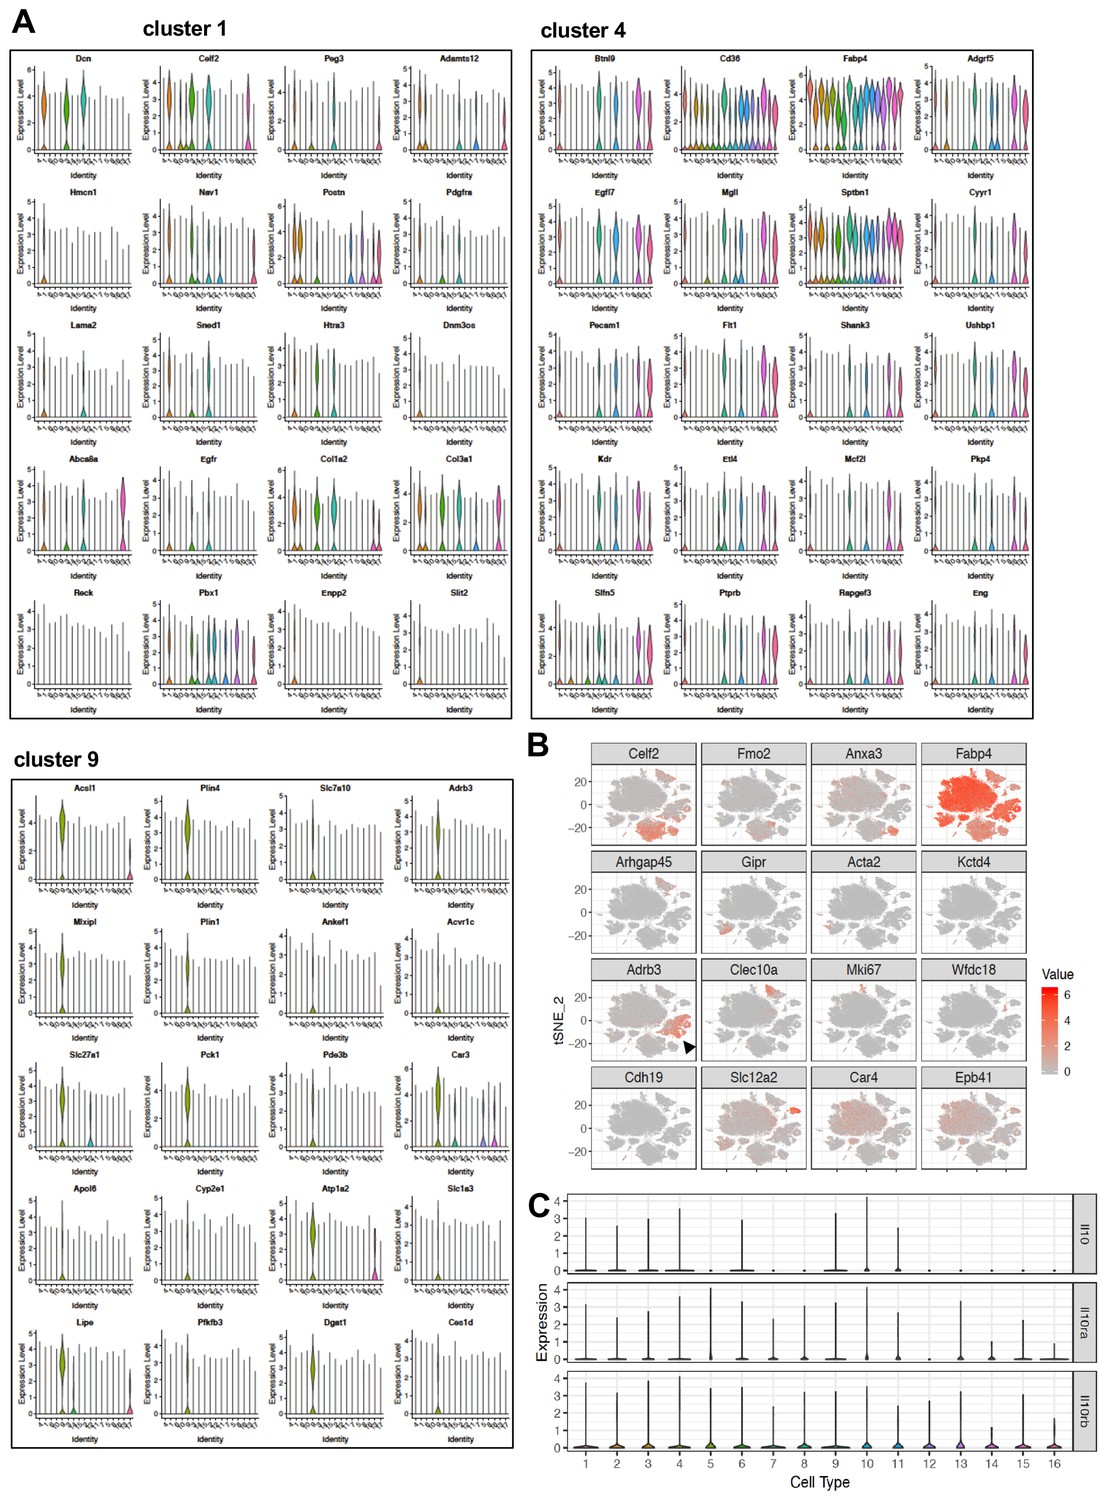
Type nine cluster constitute of thermogenic adipocytes.
(A) Normalized expression values of top adipocyte subtype-specific major clusters (1, 4, and 9) genes from Figure 4A plotted as violin plots with clusters as rows and expression levels of genes as columns. (B) tSNE-plot showing cluster-specific expression of selected marker genes from aggregated tSNE-plot in Figure 4A. Black arrow indicates Type nine cluster. (C) Normalized expression values of indicated genes plotted as violin plots with clusters as rows and expression levels of genes as columns.
Figure 5 with 1 supplement
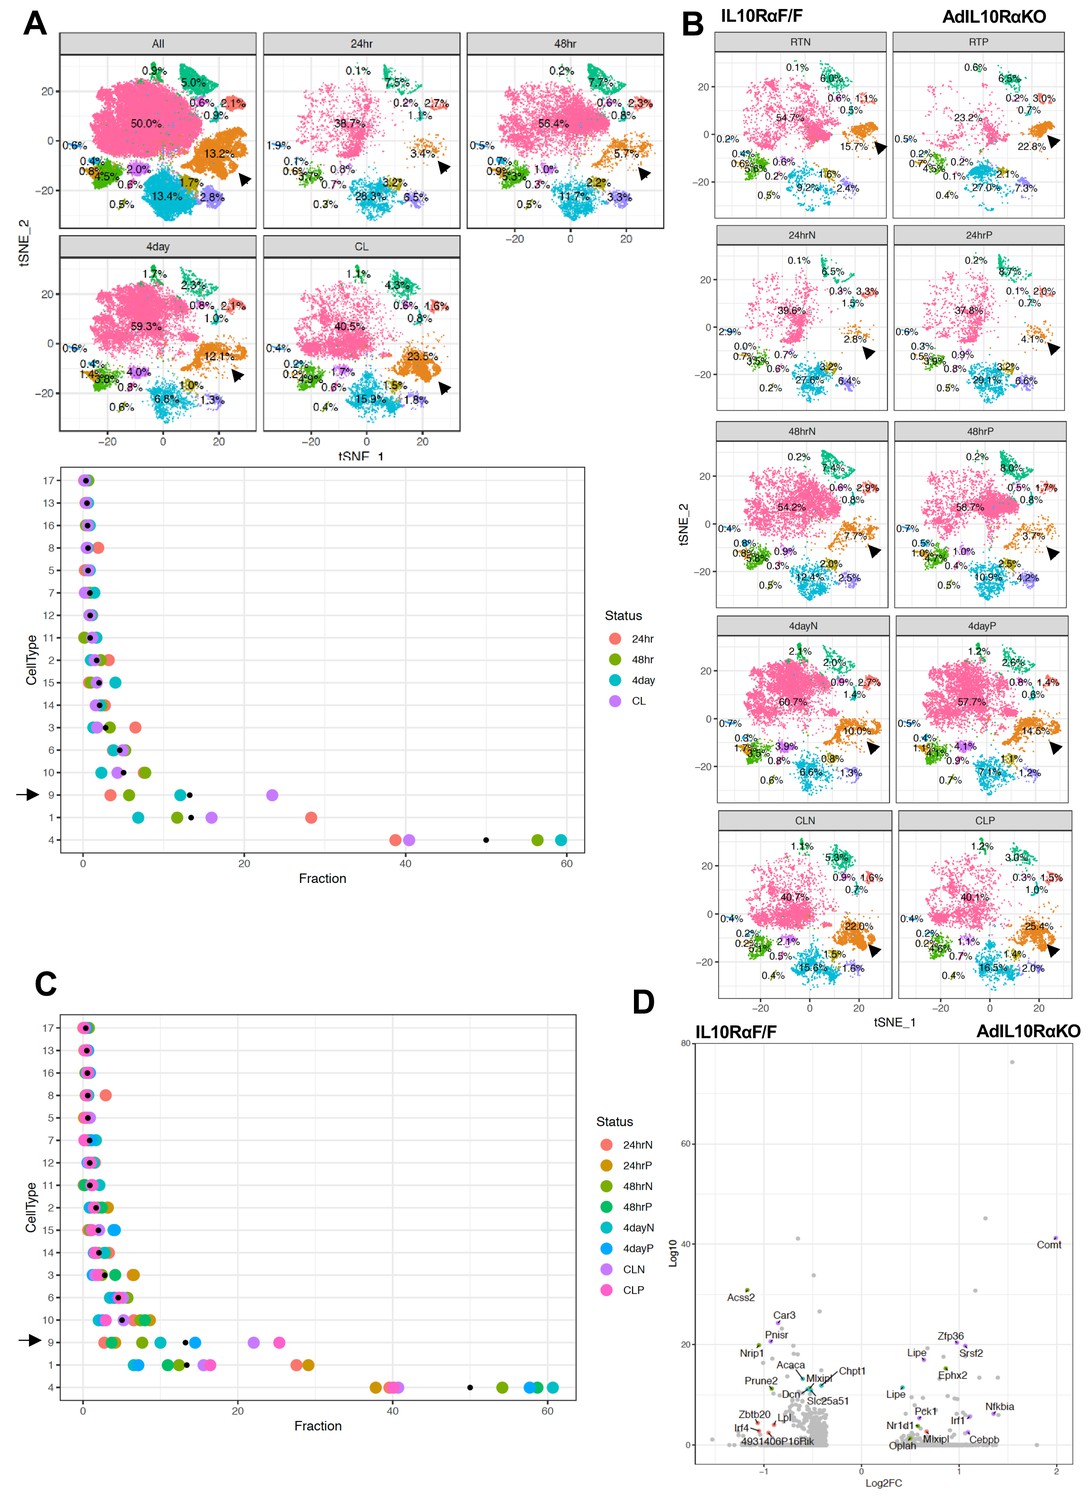
Enrichment of the thermogenic adipocyte cluster in IL10Rα-depleted mice.
(A) Top: tSNE-plot showing percentage of clusters from aggregated (All) or from indicated treatments. Bottom: Colored dot plot showing percentage of fractions plotted in y-axis and cell types in x-axis under indicated conditions. (B) tSNE-plot showing differences in percentage of clusters between adipocytes from iWAT from control and AdIL10Rα KO mice under RT, 24 hr, 48 hr or 4 days cold exposure, or CL treated conditions. (C) Colored dot plot showing percentage of fractions plotted in y-axis and cell types in x-axis under indicated conditions and genotype. N deonotes Adipoq-Cre-Negative IL10RαF/F (IL10RαF/F) and P denotes Adipoq-Cre-Positive (AdIL10Rα KO) mice. (D) Volcano plot showing adipocyte gene expression differences between indicated mice from cluster 9. The Log2Fold Change (FC) ratio of floxed control vs. AdIL10Rα KO was plotted as a function of log10 p-value, with select genes indicated with text. Black arrow indicates the Type nine adipocyte cluster.
Figure 5—figure supplement 1
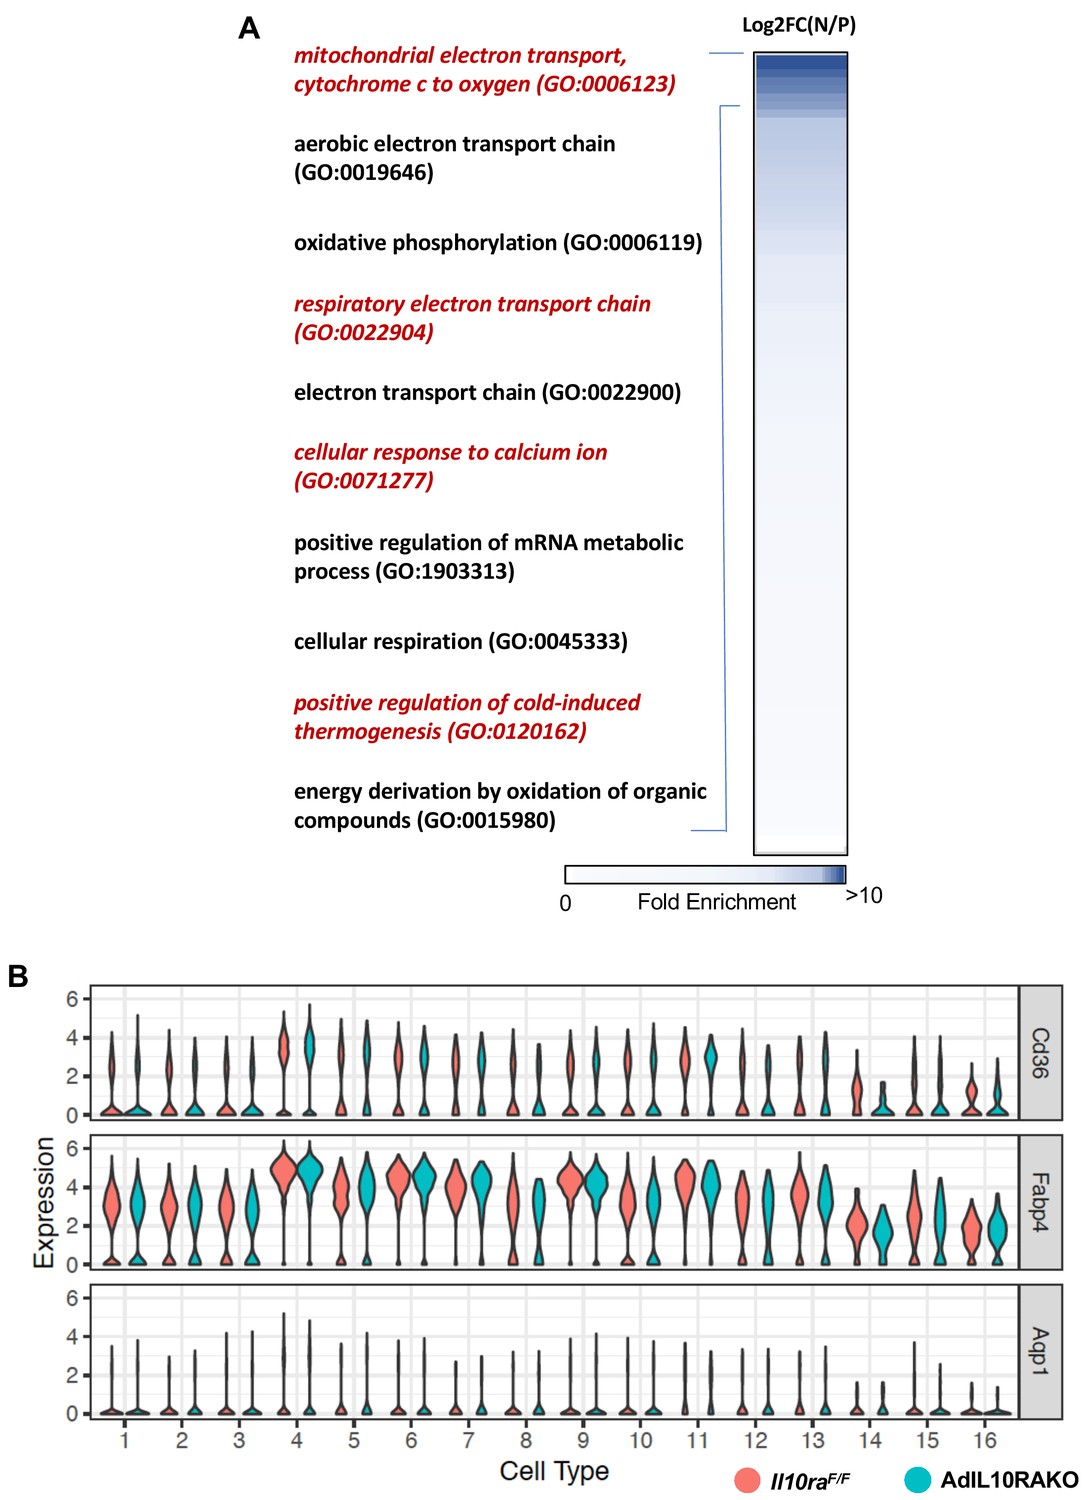
Thermogenic pathway is enriched in the Type 9 cluster of IL10Rα-deficient adipocytes.
(A) Heatmap showing fold enrichment of pathways abundant in the adipocytes of AdIL10Rα KO mice compared to controls. DEG analysis of N represent Adipq-CRE Negative IL10RαF/F (IL10RαF/F) and P represent Adipoq-Cre Positive (AdIL10Rα KO) mice was performed and fold-change was calculated as Log2FC(N/P) and gene ontology analysis was performed for genes enriched in P over N and plotted as a heatmap as fold-enrichment (0 to >10) and p<0.001. Shades of blue indicate highly enriched pathway in P with fold-enrichment >10. (B) Violin plot showing expression levels of indicated genes in iWAT adipocytes of AdIL10Rα KO mice and controls from SNAP-seq data (Figure 4).
Figure 6
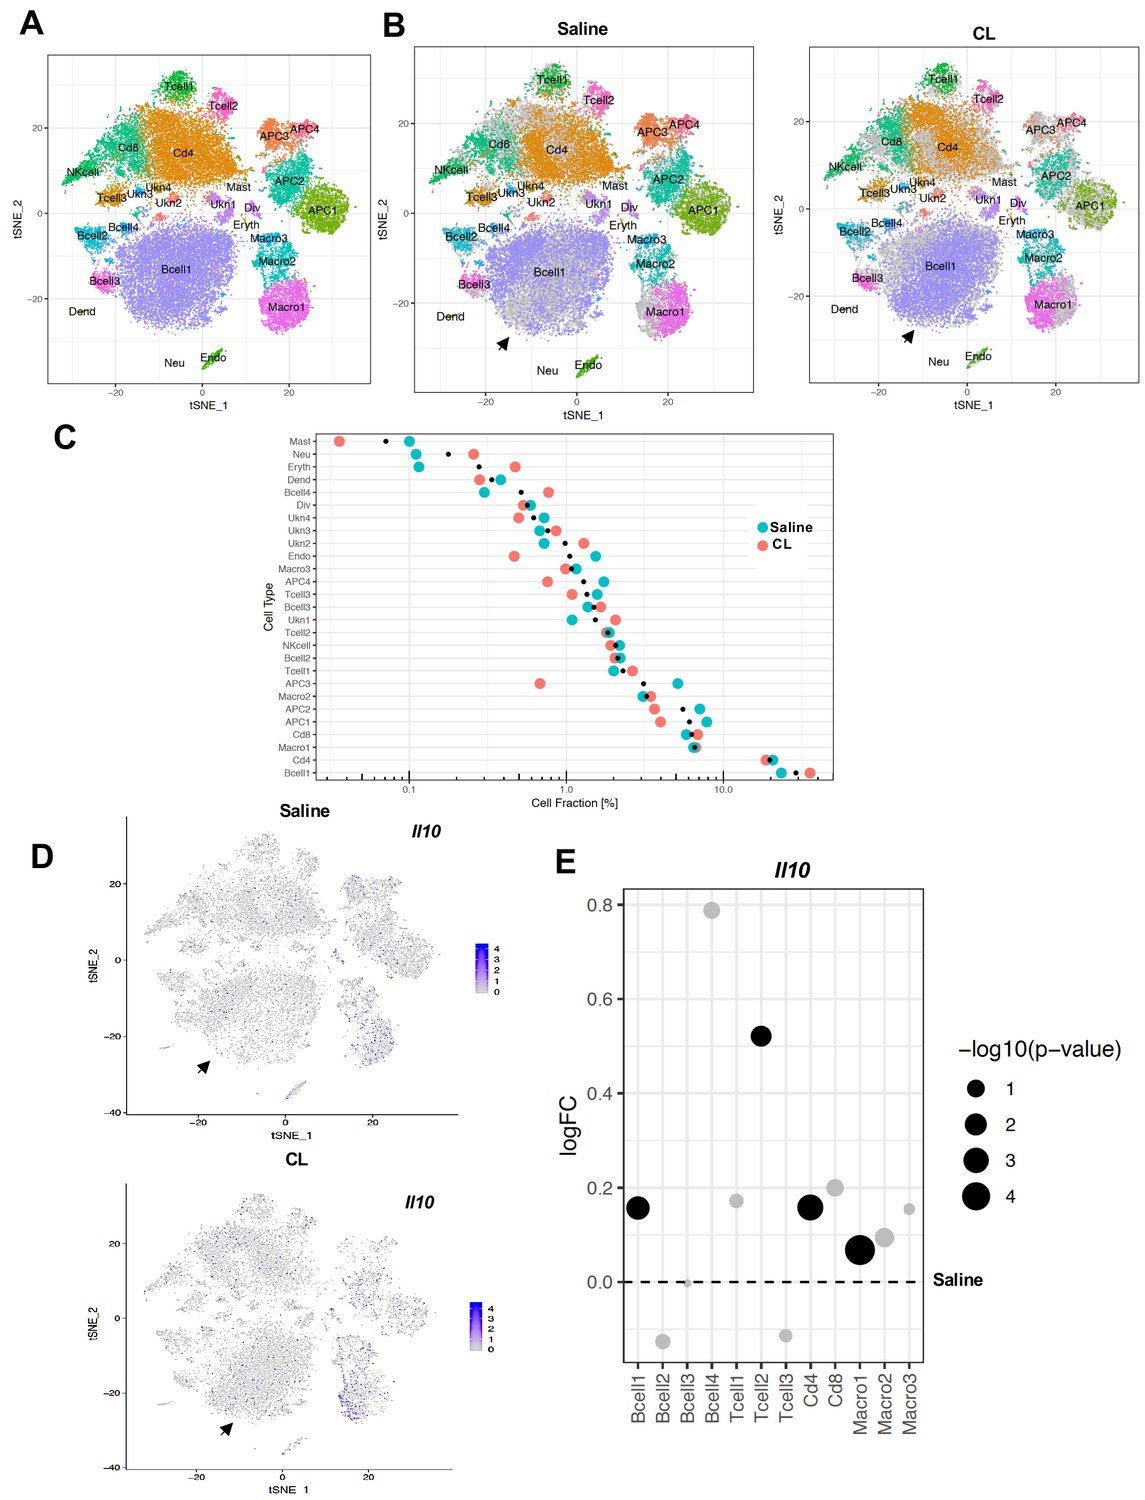
scRNA-Seq reveals an increase in adaptive immune cells under adrenergic stress.
(A) Aggregated tSNE-plot of combined ~10,000 SVF cells isolated from iWAT of mice treated with CL or saline for 4 days. Colored dots are cells assigned to clusters based on similar transcriptomic signatures and these clusters correspond to specific cell-types. (B) Segregated tSNE-plot from (A) showing percentage of cell-types between control (Saline) and β3-agonist CL-treated mice. The tSNE-plot also shows differences in percentage of clusters between control and CL-treated mice. Black arrows indicate major B-cell population. (C) Colored dot plot showing percentage of fractions plotted in y-axis and cell types in x-axis under indicated conditions. (D) tSNE-plot showing cells expressing Il10 in control and CL-treated mice. Black arrows indicate major cell clusters with Il10 expression. (E) Dot plot showing expression levels of Il10 in indicated cells comparing control and CL-treated mice. The Log2Fold Change (FC) ratio of saline vs. CL was plotted as a function of log10 p-value and indicated as different sizes of dots. Fold-change and p-value was compared with saline condition represents as a dotted line.
Figure 7
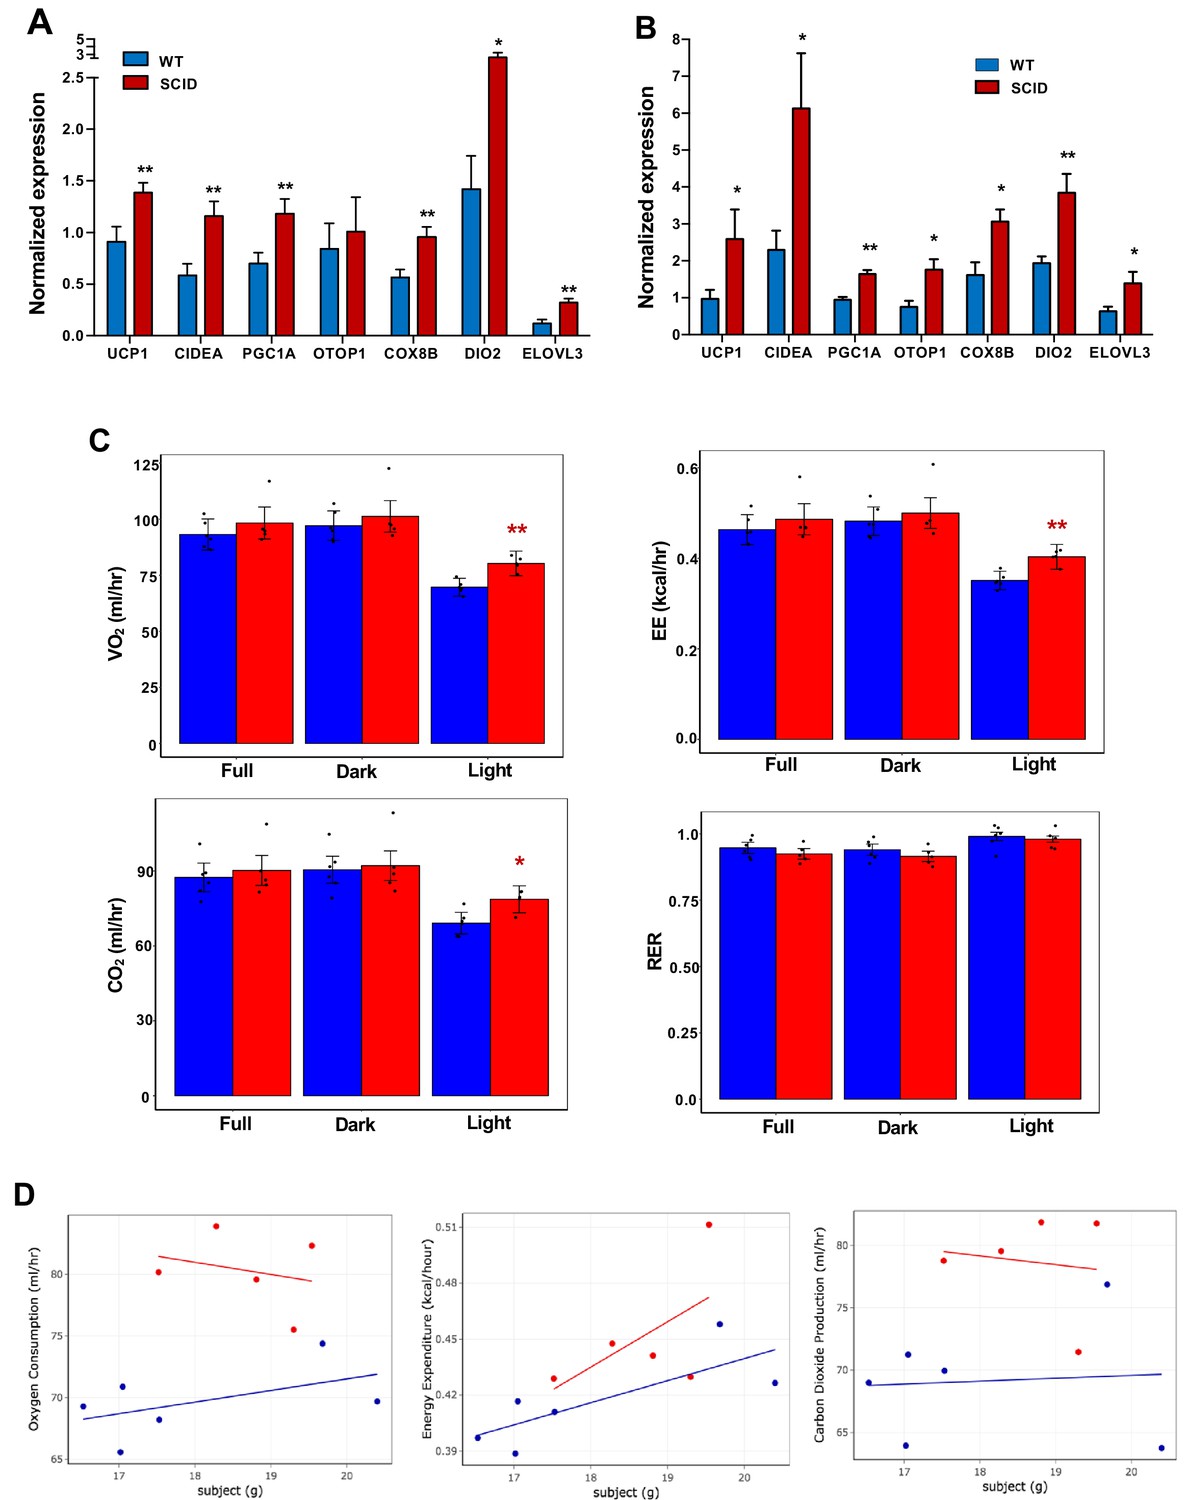
Increased adipose thermogenesis and EE in lymphocyte-deficient mice.
(A and B) Real-time PCR analysis of gene expression in iWAT from chow-fed 10 week 24 hr cold-exposed (A) or CL (1 mg/kg/day for 4 days (B) mice. (C, D) Bar graphs (C) and scatter plot (D) (Light cycle) showing oxygen consumption, energy expenditure, carbon dioxide production, and RER in CL-treated mice with body mass as covariate. N = 6,5. *, p<0.05, **, p<0.01.
Tables
Key resources table
| Reagent type (species) or resource | Designation | Source or reference | Identifiers | Additional information |
|---|---|---|---|---|
| Genetic reagent sample (M. musculus) | Il10raflox | Jackson Laboratory | Stock No. 028146 RRID:MGI:189797 | PMID: 22711892 |
| Genetic reagent sample (M. musculus) | C57BL/6J | Jackson Laboratory | Stock No. 000664 | |
| Genetic reagent sample (M. musculus) | C57BL/6J SCID | Jackson Laboratory | Stock No. 001913 RRID:MGI:14443 | PMID: 8339285 |
| Genetic reagent sample (M. musculus) | Adipoq-Cre | Jackson Laboratory | Stock No. 010803 RRID:MGI:168971 | PMID: 21356515 |
| Chemical compound | β3-adrenergic receptor agonist (CL 316, 243; CL) | Sigma | C5976 | 1 mg/kg/day |
| Chemical compound | Collagenase II | Worthington Biochemical | LS004176 | 3 mg/ml |
| Chemical compound | Collagenase D | Sigma | 11088882001 | 9.8 mg/ml |
| Commercial kit | EvaGreen droplet generation oil | BIO-RAD | 1864005 | |
| Commercial kit | ChemGenes barcoded microparticles | ChemGenes | N/A | |
| Commercial kit | FlowJEM aquapel-treated microfluidic device | FlowJEM | N/A | |
| Commercial kit | Nextera DNA Library Preparation kit | Illumina | 2001874 | |
| Commercial kit | Minute nuclei and cytosol isolation kit for Adipose | Invent Biotech | AN-029 | |
| Commercial kit | 40 μm cell strainer | Bel-Art FlowMI | H13680-0040 | |
| Commercial kit | Single Cell 3’ Chip | 10X Genomics | 1000127 | |
| Commercial kit | Chromium Single Cell 3’ library and Cell Bead kit | 10X Genomics | 1000128 | |
| Commercial kit | TruSeq Stranded Total RNA Library Prep Kit | Illumina | RS-122–2102 | |
| Commercial kit | RNAscope Multiplex Flurorescent Reagent kit v2 | Advanced Cell Diagnostics | 323316 | |
| Commercial kit | Opal 520 | Akoya Biosciences | FP1487001KT | 1:1000 |
| Commercial kit | Opal 570 | Akoya Biosciences | FP1488001KT | 1:1000 |
| Commercial kit | Opal 620 | Akoya Biosciences | FP1495001KT | 1:1000 |
| Commercial kit | mm-Adrb3 | Advanced Cell Diagnostics | 495521 | |
| Commercial kit | mm-UCP1 | Advanced Cell Diagnostics | 455411 | |
| Commercial kit | mm-Ppargc1b | Advanced Cell Diagnostics | 402131 | |
| Commercial kit | TRIzol | Thermo Fischer | 15596026 | |
| Commercial kit | iScript cDNA synthesis kit | Bio-Rad | 1708890 | |
| Commercial kit | SYBER Green Master mix | Diagenode | DMSG-2X-A300 | |
| Commercial kit | RIPA Lysis buffer | Boston Bioproducts | BP-115 | |
| Antibody | IL10Rα | R and D System | AF-474-SP | |
| Antibody | α-Tubulin | Calbiochem | CP06 RRID:AB_2617116 | |
| Antibody | Actin | Sigma | A2066 RRID:AB_476693 | |
| Software | Drop-seq tools version 1.13 | https://github.com/broadinstitute/Drop-seq | ||
| Software | dropSeqPipe | https://github.com/darneson/dropSeqPipeDropEST | ||
| Software | Mouse Genome Allignment mm10 | STAR-2.5.0c | https://github.com/ alexdobin/STAR | |
| Software | Seurat R package version 3.0.0.9000 | https://github.com/satijalab/seurat | ||
| Software | Cell Ranger V3.0.2 | 10X Genomics | ||
| Other | Prolong Diamond Antifade Mountant with DAPI | Thermo Fischer | P36966 | |
| Other | HFD; 60% kcal fat | Research Diets | D12492 |
Additional files
-
Supplementary file 1
Top enriched pathways among DEGs of major cell types (FDR < 5%).
- https://doi.org/10.7554/eLife.49501.014
-
Supplementary file 2
QPCR primers used in this study.
- https://doi.org/10.7554/eLife.49501.015
-
Transparent reporting form
- https://doi.org/10.7554/eLife.49501.016
Download links
A two-part list of links to download the article, or parts of the article, in various formats.
Downloads (link to download the article as PDF)
Open citations (links to open the citations from this article in various online reference manager services)
Cite this article (links to download the citations from this article in formats compatible with various reference manager tools)
Single cell analysis reveals immune cell–adipocyte crosstalk regulating the transcription of thermogenic adipocytes
eLife 8:e49501.
https://doi.org/10.7554/eLife.49501


