Hemozoin produced by mammals confers heme tolerance
- University of Maryland, United States
- University of Utah School of Medicine, United States
- University of Tsukuba, Japan
- University of Tsukaba, Japan
- National Human Genome Research Institute, National Institutes of Health, United States
- Sayo, Japan
- Perelman School of Medicine at the University of Pennsylvania, United States
- Oregon Health and Science University, United States
Figures
Figure 1 with 1 supplement
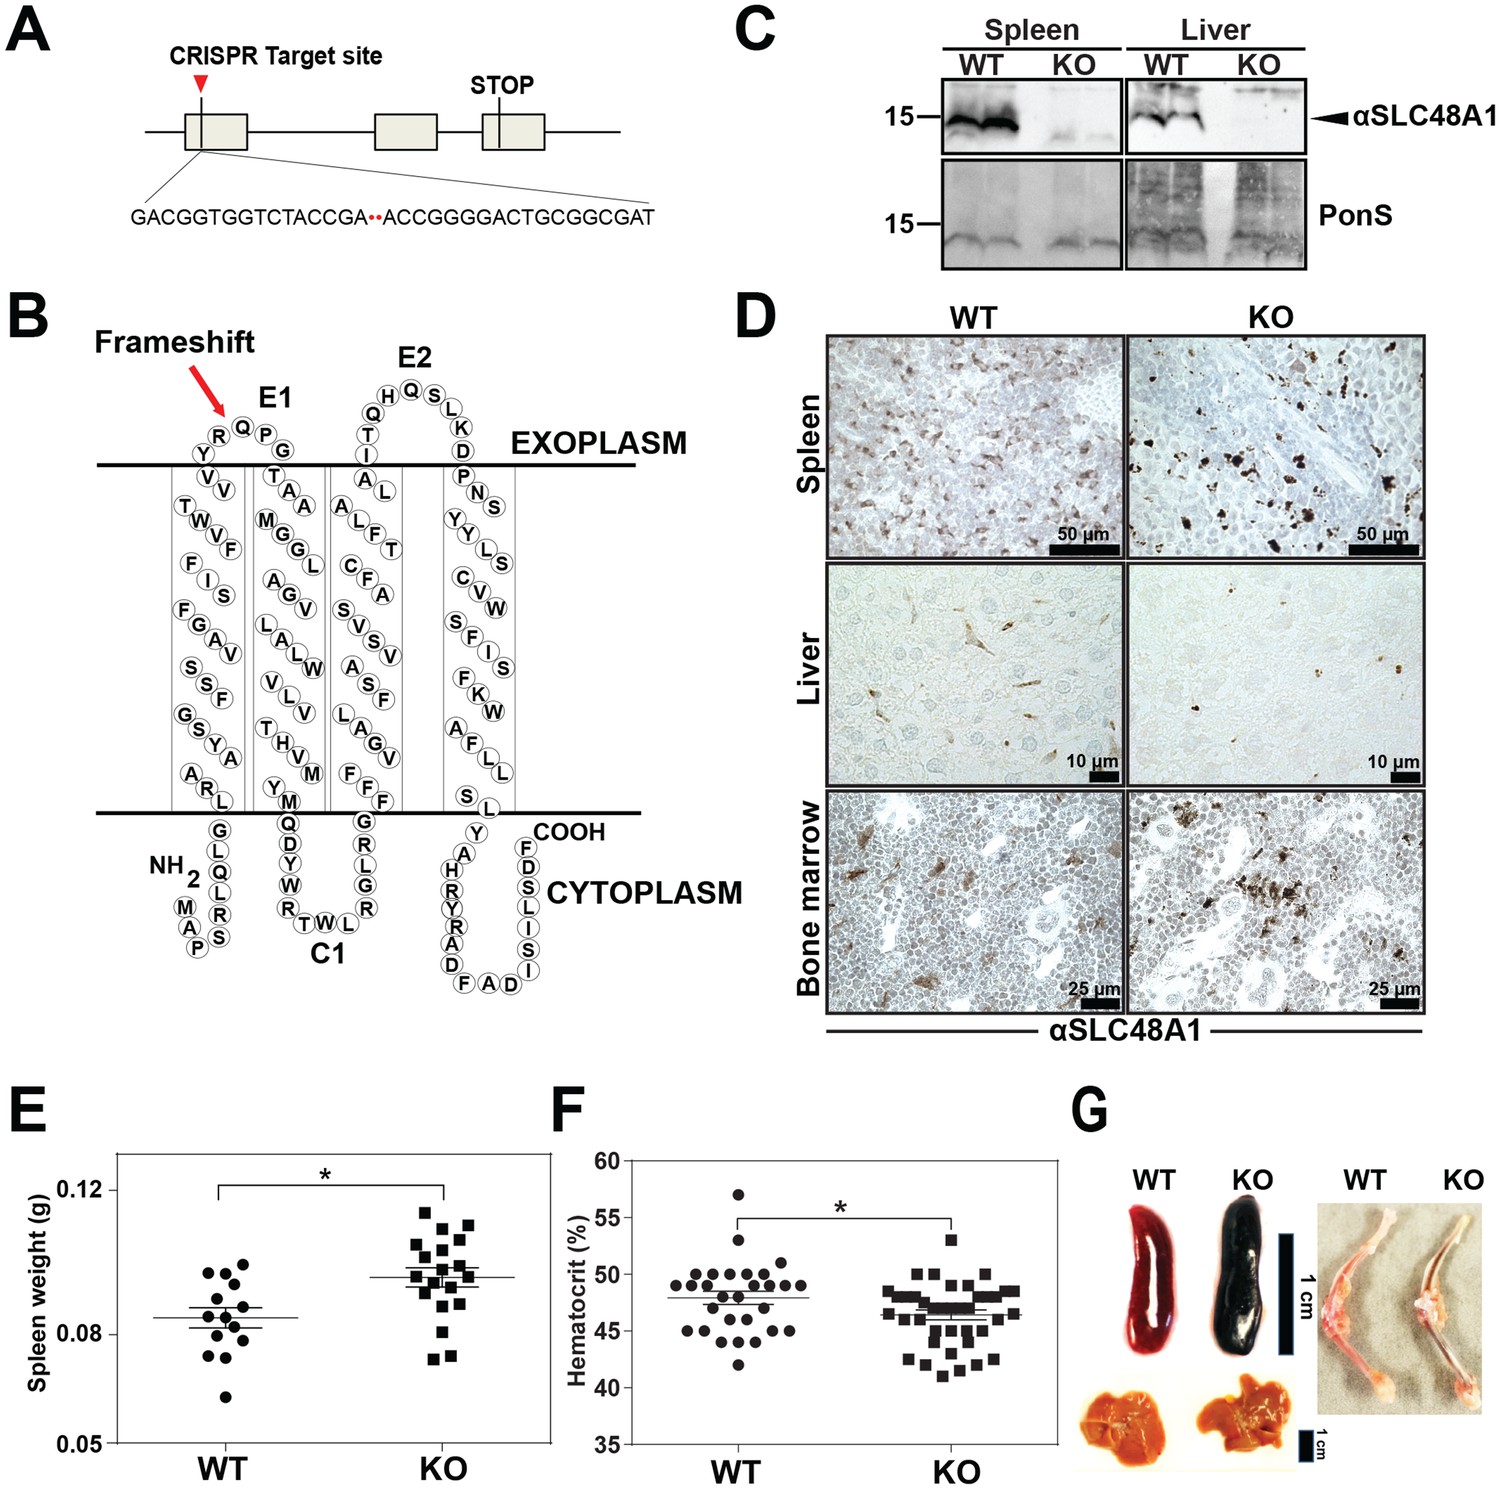
Reticuloendothelial tissues accumulate dark pigments in the absence of SLC48A1.
(A) Structure of the SLC48A1 gene (which encodes SLC48A1) indicating the CRISPR target site in exon 1. (B) Predicted topology of SLC48A1 protein; arrow indicates the site of the two basepair deletion resulting in frameshift mutation. (C) Immunoblot analysis of membrane lysates prepared from spleens and livers of mice. Membranes were probed with anti-SLC48A1 antibody and then incubated with HRP-conjugated anti-rabbit secondary antibody. Each lane represents one animal. (D) SLC48A1 immunohistochemistry analysis of paraffin-embedded tissue sections of mice. Tissue sections were probed with affinity-purified anti-SLC48A1 antibody and then incubated with HRP-conjugated anti-rabbit secondary antibody. Images shown are representative of at least three mice. (E–F) Spleen wet weights and whole blood hematocrit from WT and KO mice. Each dot represents one mouse; mice were age (6 weeks) and sex-matched. (G) Representative images of spleens, livers and bone marrows of age and sex-matched mice. *p<0.05.
Figure 1—figure supplement 1
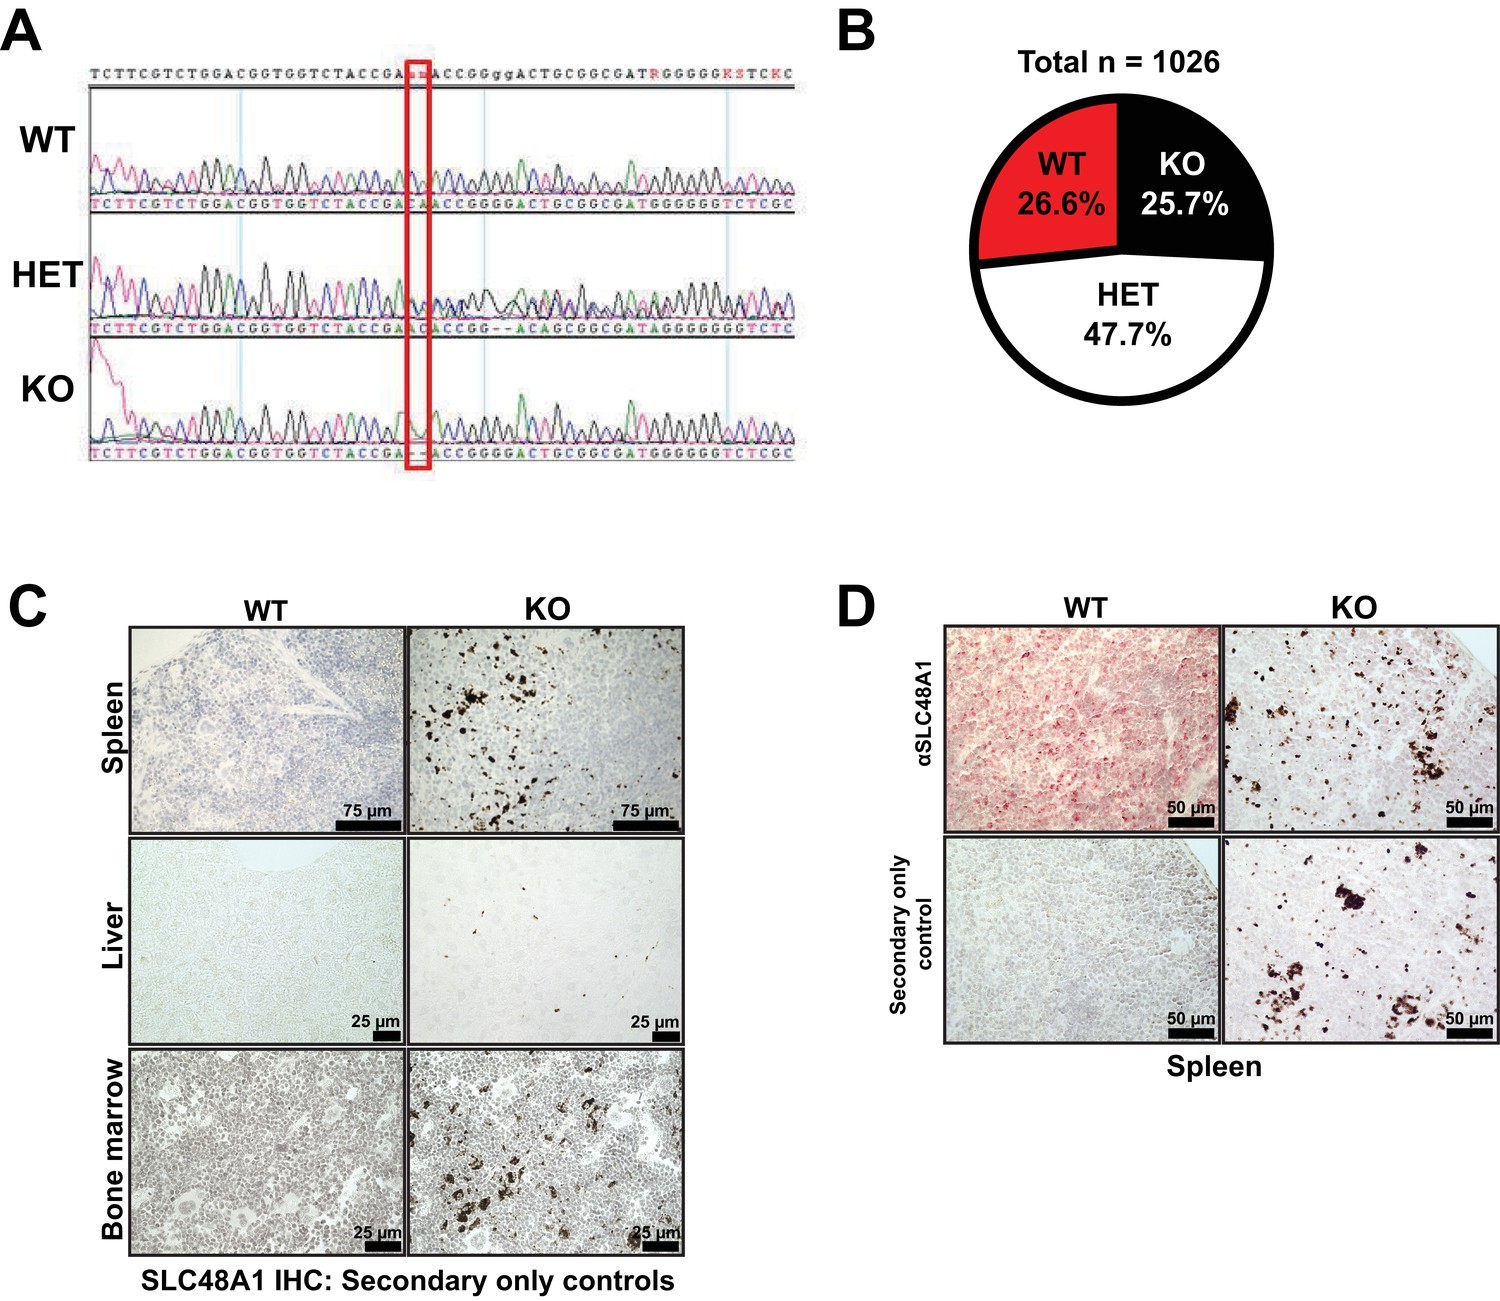
Genetic lesion in SLC48A1, genotypic segregation and loss of SLC48A1 IHC by alkaline-phosphatase.
(A) Chromatogram of genomic DNA sequencing from mice indicating two basepair deletion. (B) Mendelian distribution of P21 pups derived from SLC48A1 HET intercrosses. (C) SLC48A1 immunohistochemistry staining of secondary only controls on spleen, liver and bone marrow sections. (D) Immunohistochemistry staining of SLC48A1 on spleen sections using alkaline-phosphatase-Red.
Figure 2 with 1 supplement
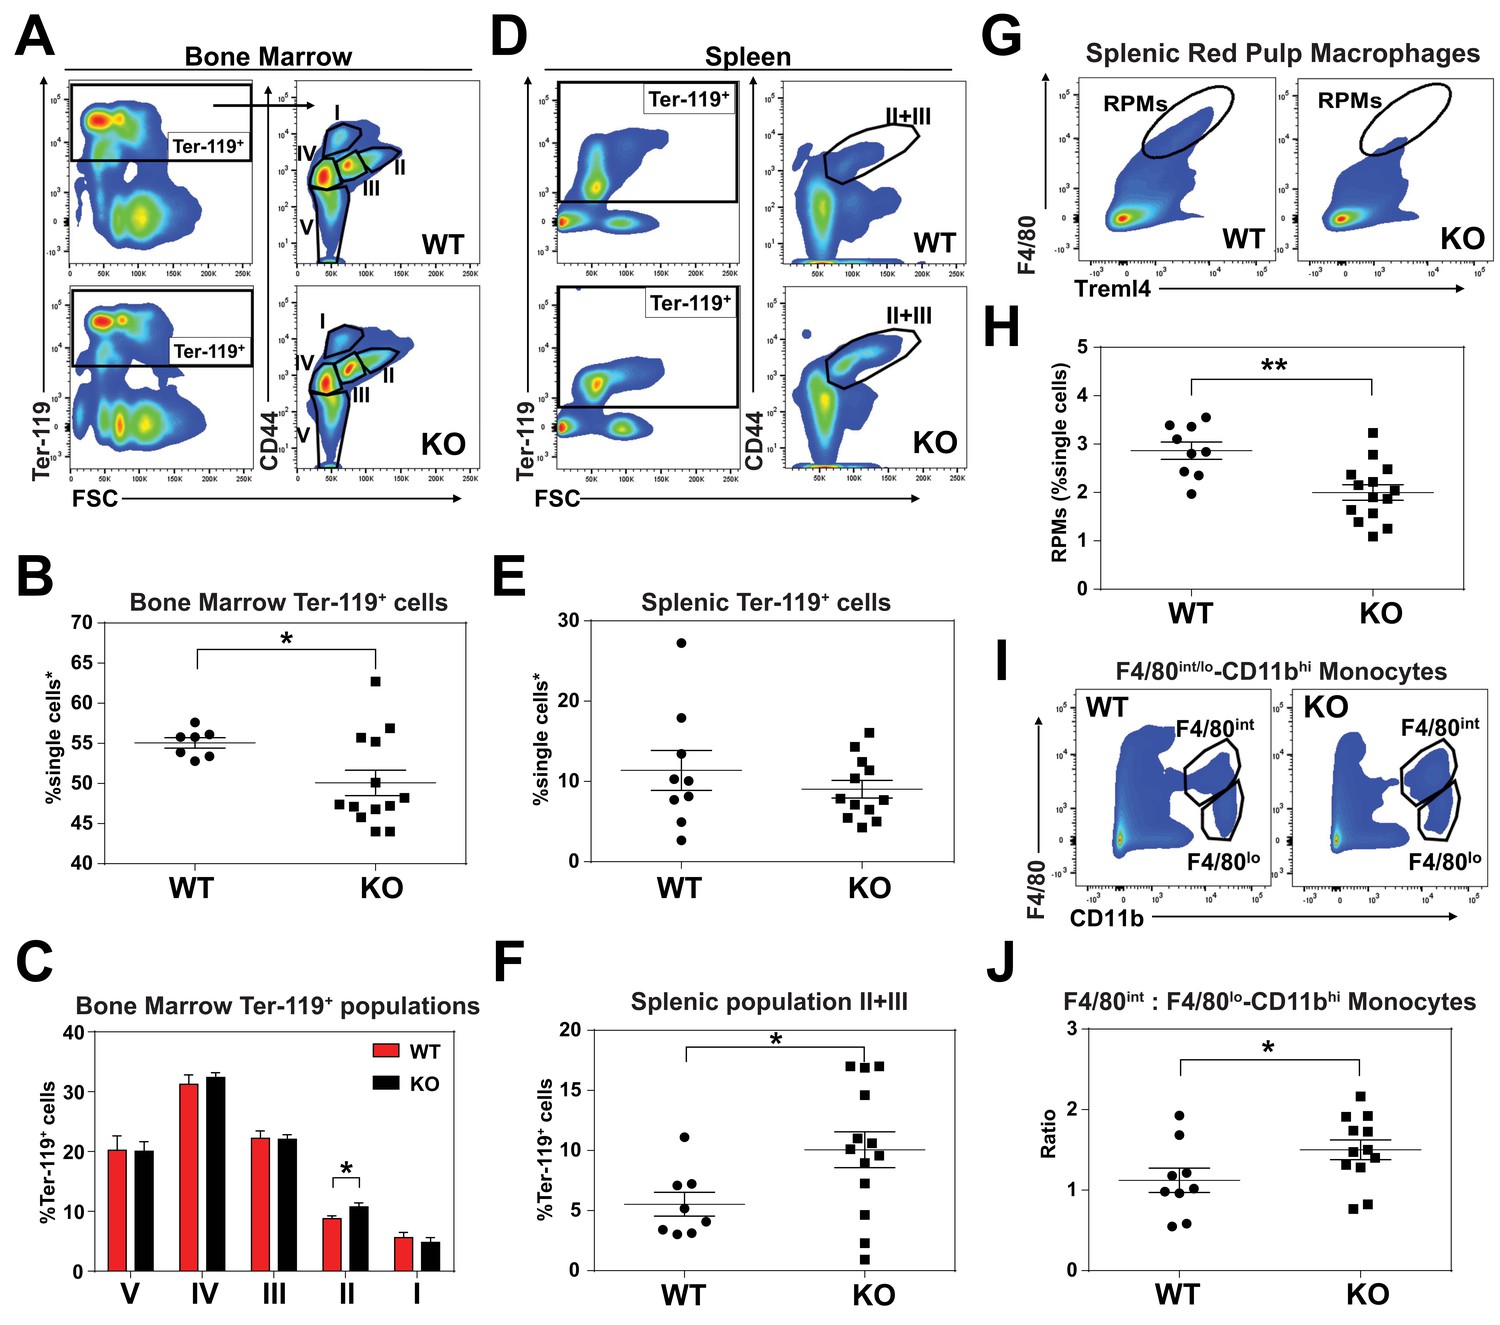
KO mice exhibit extramedullary erythropoiesis with fewer mature RPMs Gating strategy of Ter-119+ cells in the (A) bone marrow and (D) spleen.
Quantifications of total Ter-119+ cells in the (B) bone marrow and (E) spleen. The %single cells* on the y-axis denote single cells that are negative for CD4/8/41, B220 and Gr-1. (C) Quantification of subpopulations of Ter-119+ cells represented as a percentage of total Ter-119+ cells in the bone marrow (n = 7–12). (F) Quantification of populations II and III of Ter-119+ cells represented as a percentage of total Ter-119+ cells in the spleen. Gating strategy (G, I) and quantification (H, J) of (G, H) splenic F4/80hiTreml4+red pulp macrophages (RPMs) and (I, J) F4/80hi and F4/80lo-CD11bhi splenic monocytes. At least 100,000 single cells were analyzed per sample. Each dot represents one mouse. **p<0.05; **p<0.01.
Figure 2—figure supplement 1
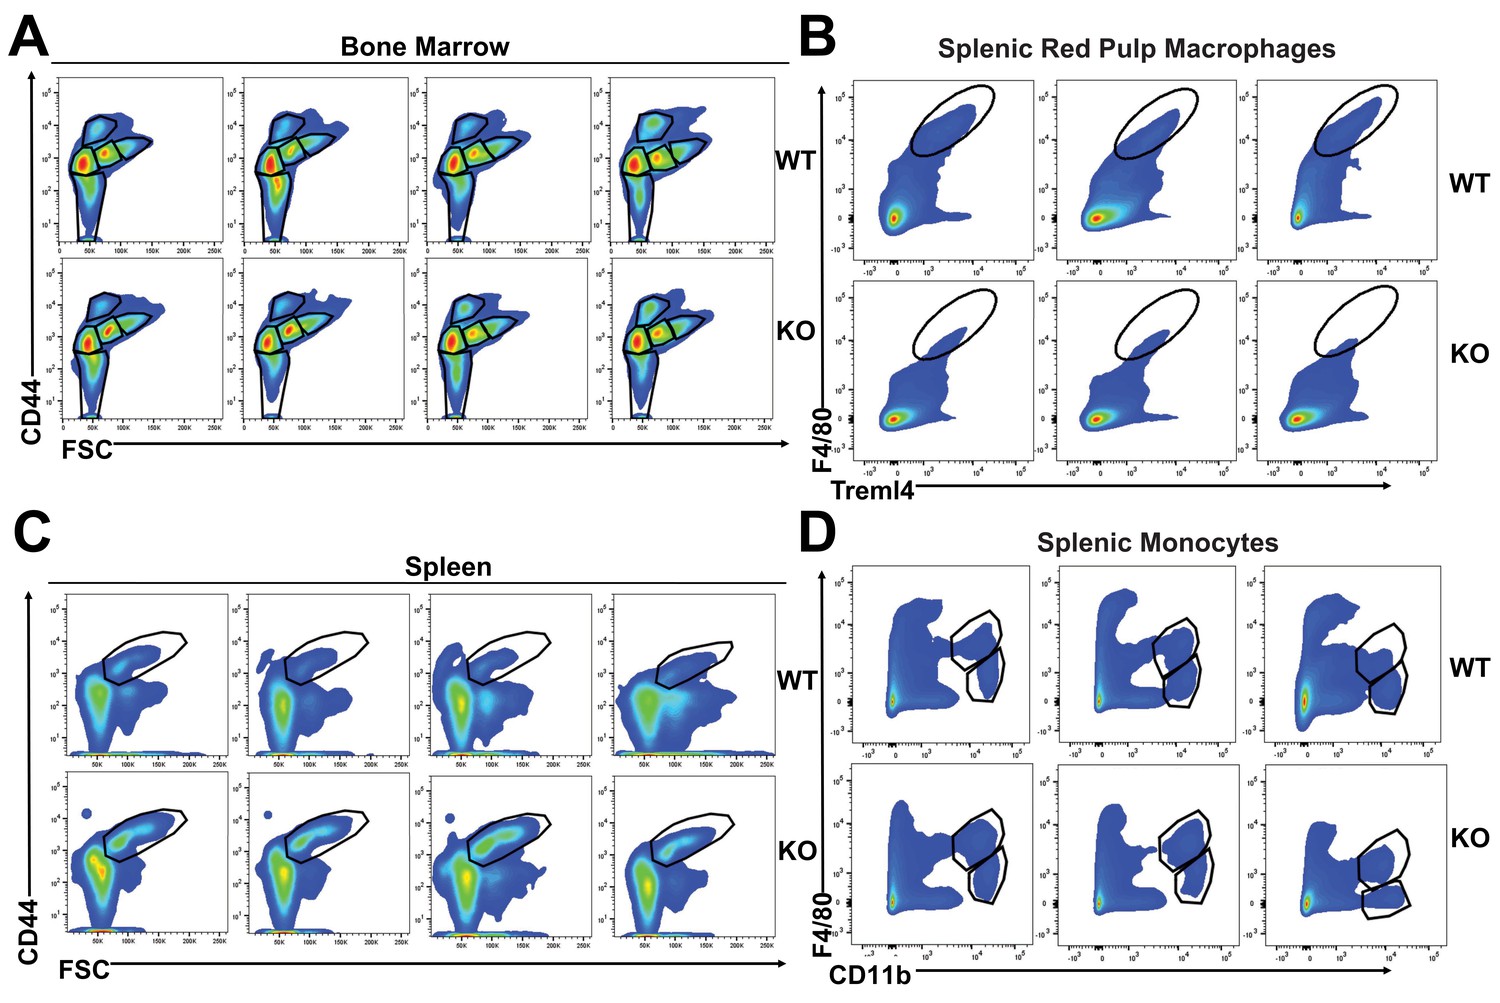
Representative flow cytometry plots of bone marrow and splenic cells.
(A) Gating of bone marrow Ter-119+ subpopulations. (B) Gating of splenic Ter-119+ population II+III. (C–D) Gating of splenic RPMs and monocytes. Individual plots shown are representative of all mice analyzed per group.
Figure 3 with 1 supplement

Heme accumulates within RES macrophages of KO mice Histochemical staining of spleen, liver and bone marrow tissue sections of WT and KO mice with H and E (A) or Perl’s Prussian blue (B).
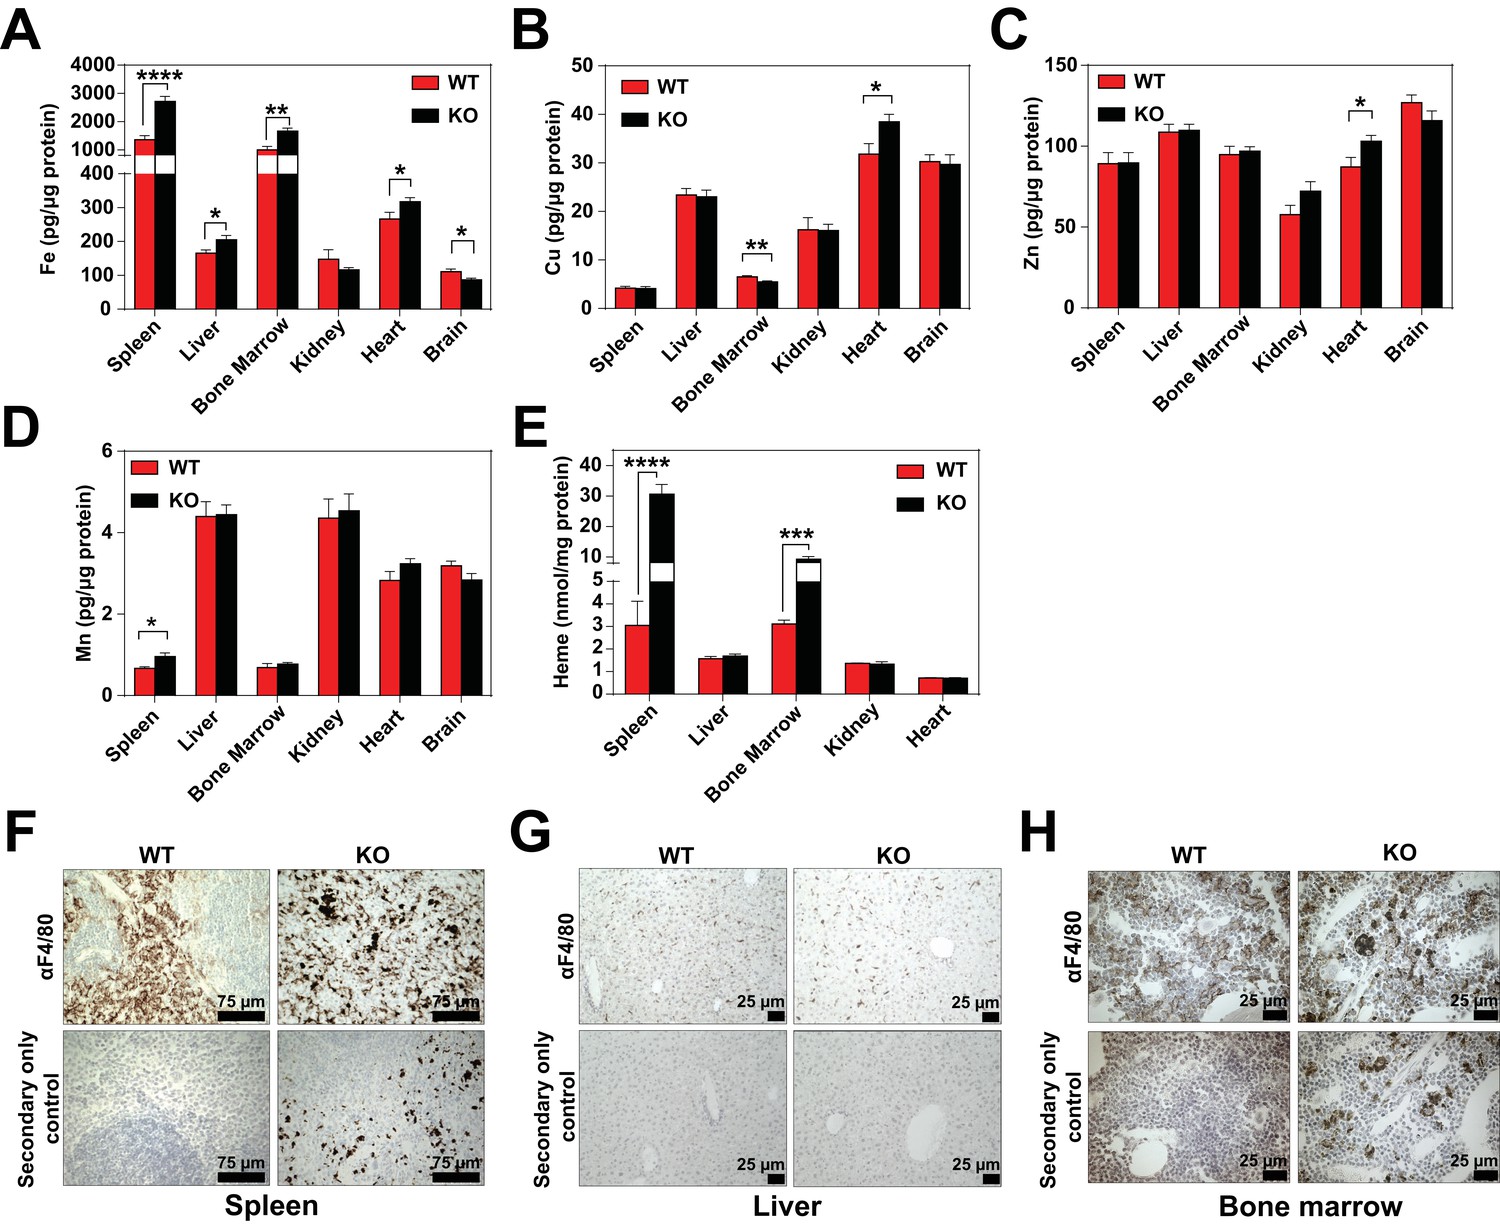
Arrows indicate dark pigments in KO tissues. Images shown are representative of at least three mice. Quantification of tissue iron (C) and heme (D) by ICP-MS and UPLC, respectively in tissues of mice fed a standard diet (n = 6–17). (E) F4/80 immunohistochemistry analysis of paraffin-embedded tissue sections of mice. Yellow arrows indicate dark pigments within F4/80-positive cells. At least three mice were analyzed per genotype. (F) XFM of F4/80-positive bone marrow macrophages from WT and KO mice. (G) Quantification of total cellular concentrations of indicated elements, organized by cellular abundance. (H) ROI concentration within dark aggregates in KO BMMs. Quantifications were measured for n = 5 cells per genotype. *p<0.05; **p<0.01; ***p<0.001; ****p<0.0001.
Figure 3—figure supplement 1
Quantification of tissue metals and F4/80 IHC controls.
(A–E) Quantification of tissue iron (Fe), copper (Cu), zinc (Zn), manganese (Mn) and heme (n = 6–17). Heme was undetectable in brain tissue. F4/80 immunohistochemistry of spleen (F), liver (G) and bone marrow (H) sections. *p<0.05; **p<0.01; ***p<0.001; ****p<0.0001.
Figure 4 with 1 supplement
Dietary iron deficiency disrupts iron metabolism gene expression in KO mice and results in lethality.
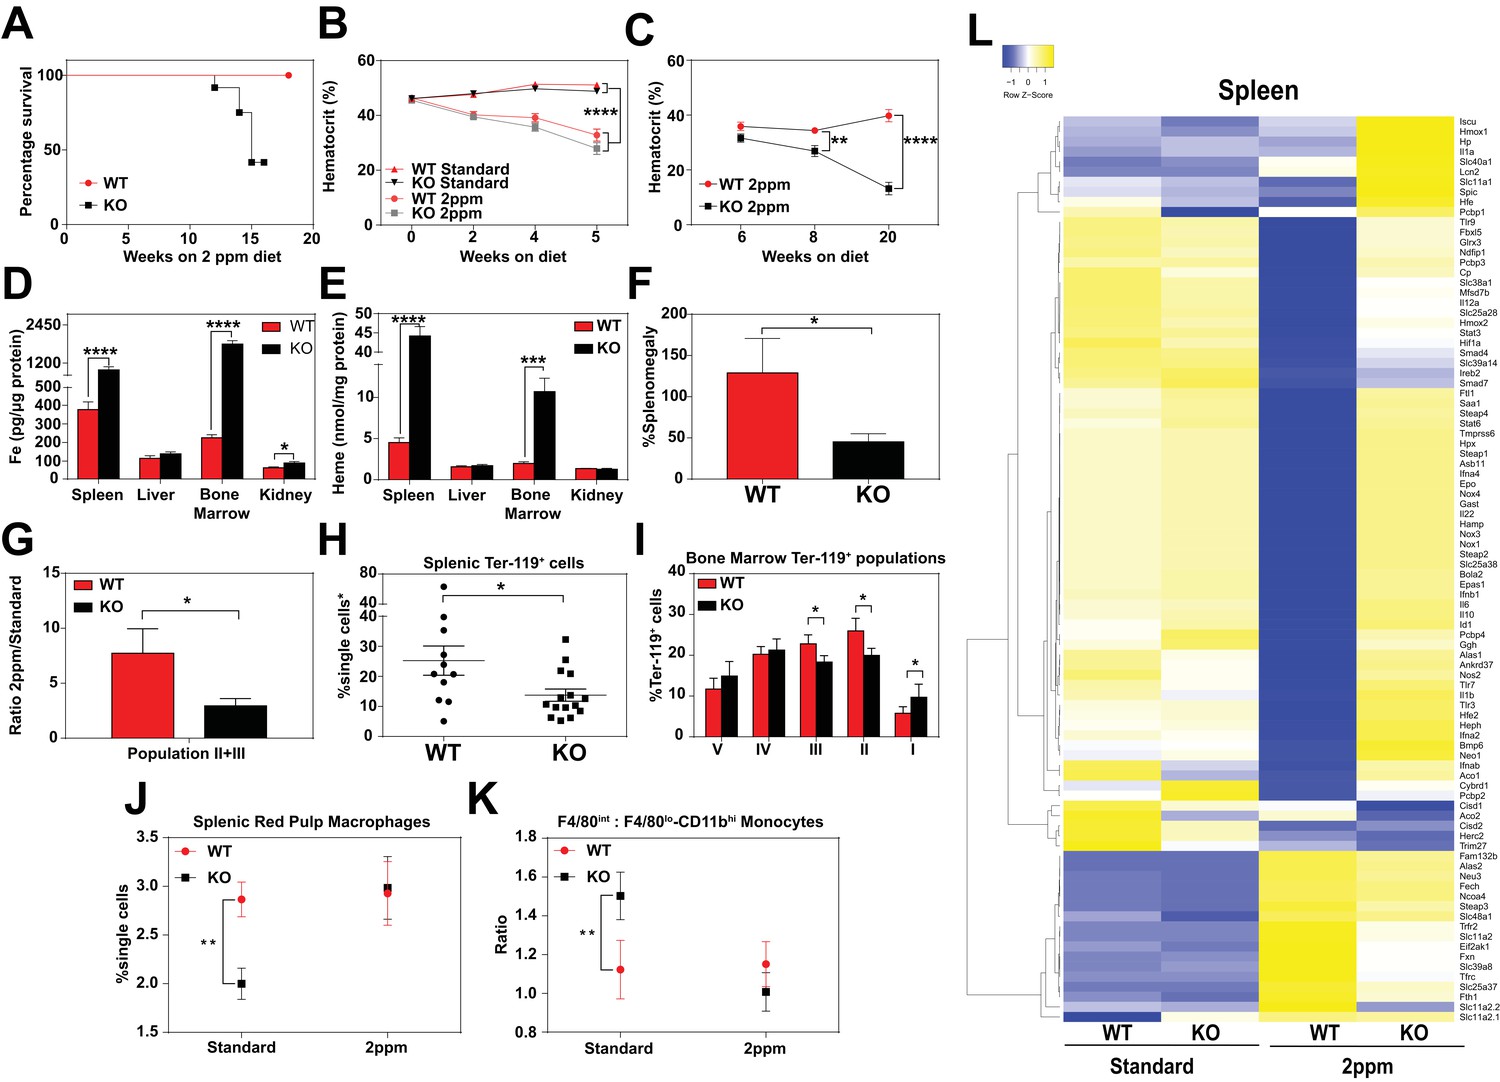
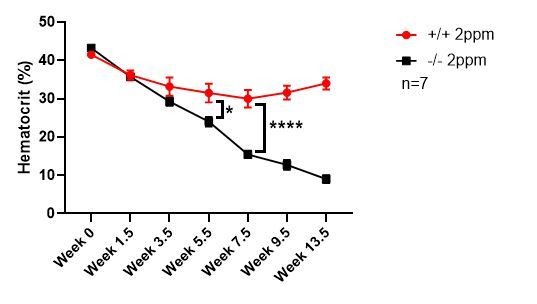
(A) Kaplan-Meier survival curve of WT and KO mice placed on a low-iron (2ppm) diet (n = 15–17, both males and females). (B–C) Hematocrits of WT and KO mice placed on a standard or low-iron (2ppm) diet. Mice were placed on respective diets supplemented with deionized water starting at 21 days of age (week 0) (n = 9–15 for 5 week data set; n = 7–11 for 20 week data set). Quantification of tissue iron (D) and heme (E) by ICP-MS and UPLC, respectively, in tissues of mice fed a low-iron (2ppm) diet (n = 6–17). (F) %Splenomegaly of WT and KO mice calculated by the percentage of increase in average wet weight of spleens between mice on low-iron versus standard iron diets (n = 9–15); (G) Ratio of 2ppm splenic Ter-119+ population II+III cells to that of standard diet mice (n = 8–12); (H) Quantification of total Ter-119+ cells in the spleen. The %single cells* on the y-axis denote single cells that are negative for CD4/8/41, B220 and Gr-1. Each point represents one mouse. (I) Quantification of subpopulations of Ter-119+ cells represented as a percentage of total Ter-119+ cells in the bone marrow (n = 7–8); (J) Quantifications of splenic RPMs in mice on a standard or low-iron (2ppm) diet, represented as a percentage of single cells analyzed (n = 9–14). (K) Quantification of the ratio of F4/80hi to F4/80loCD11bhi splenic monocytes from mice on a standard or low-iron (2ppm) diet (n = 9–15). At least 100,000 single cells were analyzed per sample. (L) Gene expression heat map of 90 iron metabolism genes in spleens from mice on standard or low-iron (2ppm) diet. Pearson correlation was used for comparison; average linkage (n = 9 per group, per genotype). *p<0.05; **p<0.01; ***p<0.001; ****p<0.0001.
Figure 4—figure supplement 1
Representative flow cytometry plots and iron metabolism gene expression levels.
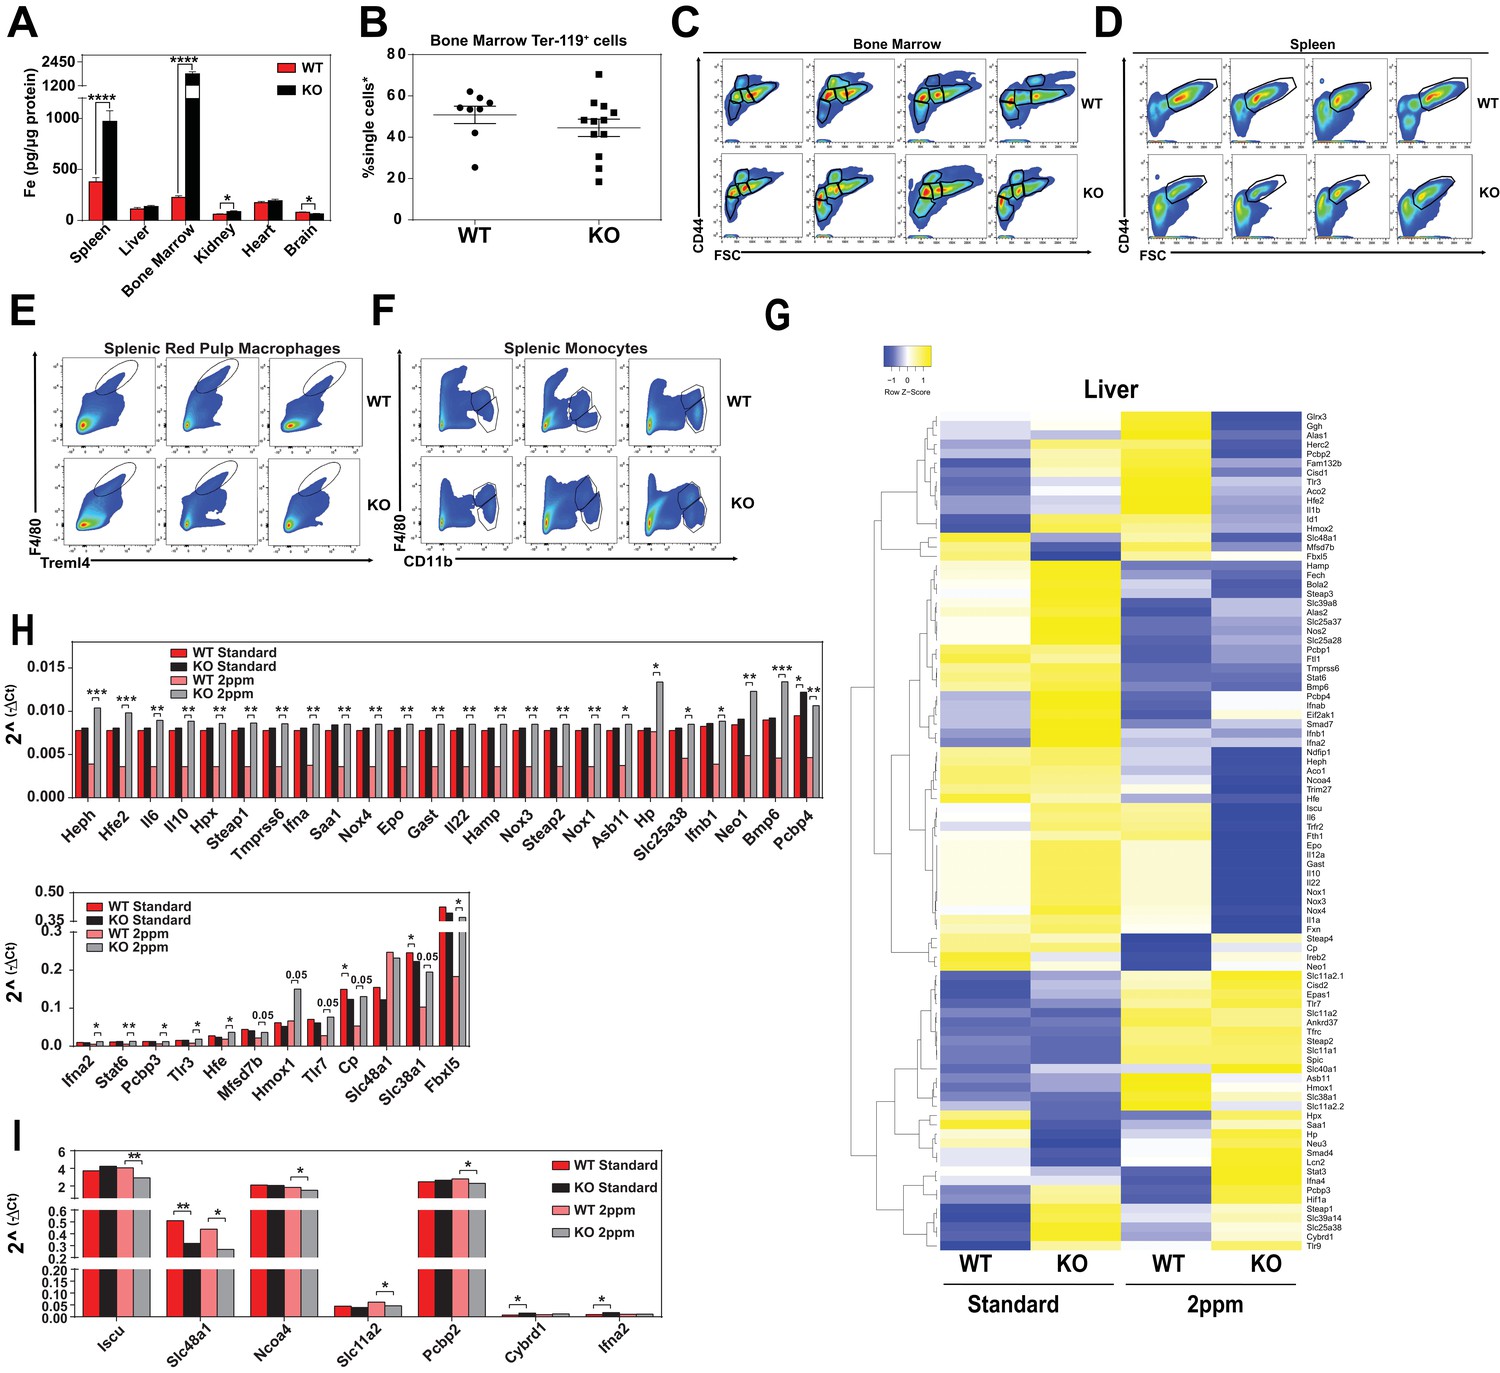
(A) Quantification of tissue iron (Fe) (n = 6–17). (B) Quantification of total Ter-119+ cells represented as a percentage of all single cells analyzed in the bone marrow. The %single cells* on the y-axis denote single cells that are negative for CD4/8/41, B220 and Gr-1. At least 100,000 single cells were analyzed per sample. Gating of (C) bone marrow Ter-119+ populations II+III and (D) splenic Ter-119+ subpopulations. (E, F) Gating of splenic RPMs and monocytes. Individual plots shown are representative of all mice analyzed per group. (G) Gene expression heat map of 90 iron metabolism genes in livers from mice on standard or low iron (two ppm) diet. Pearson correlation was used for comparison; average linkage (n = 9 per group, per genotype). Gene expression by qPCR of iron metabolism genes in spleens (H) top and bottom panel separated by expression level) and livers (I) of WT and KO mice on indicated diets (n = 9 mice per group). Gene expression was calculated as described in the Materials and methods section. *p<0.05; **p<0.01; ***p<0.001; ****p<0.0001.
Figure 5 with 1 supplement
Loss of SLC48A1 produces hemozoin biocrystals within enlarged lysosomes due to impaired erythrophagocytosis.
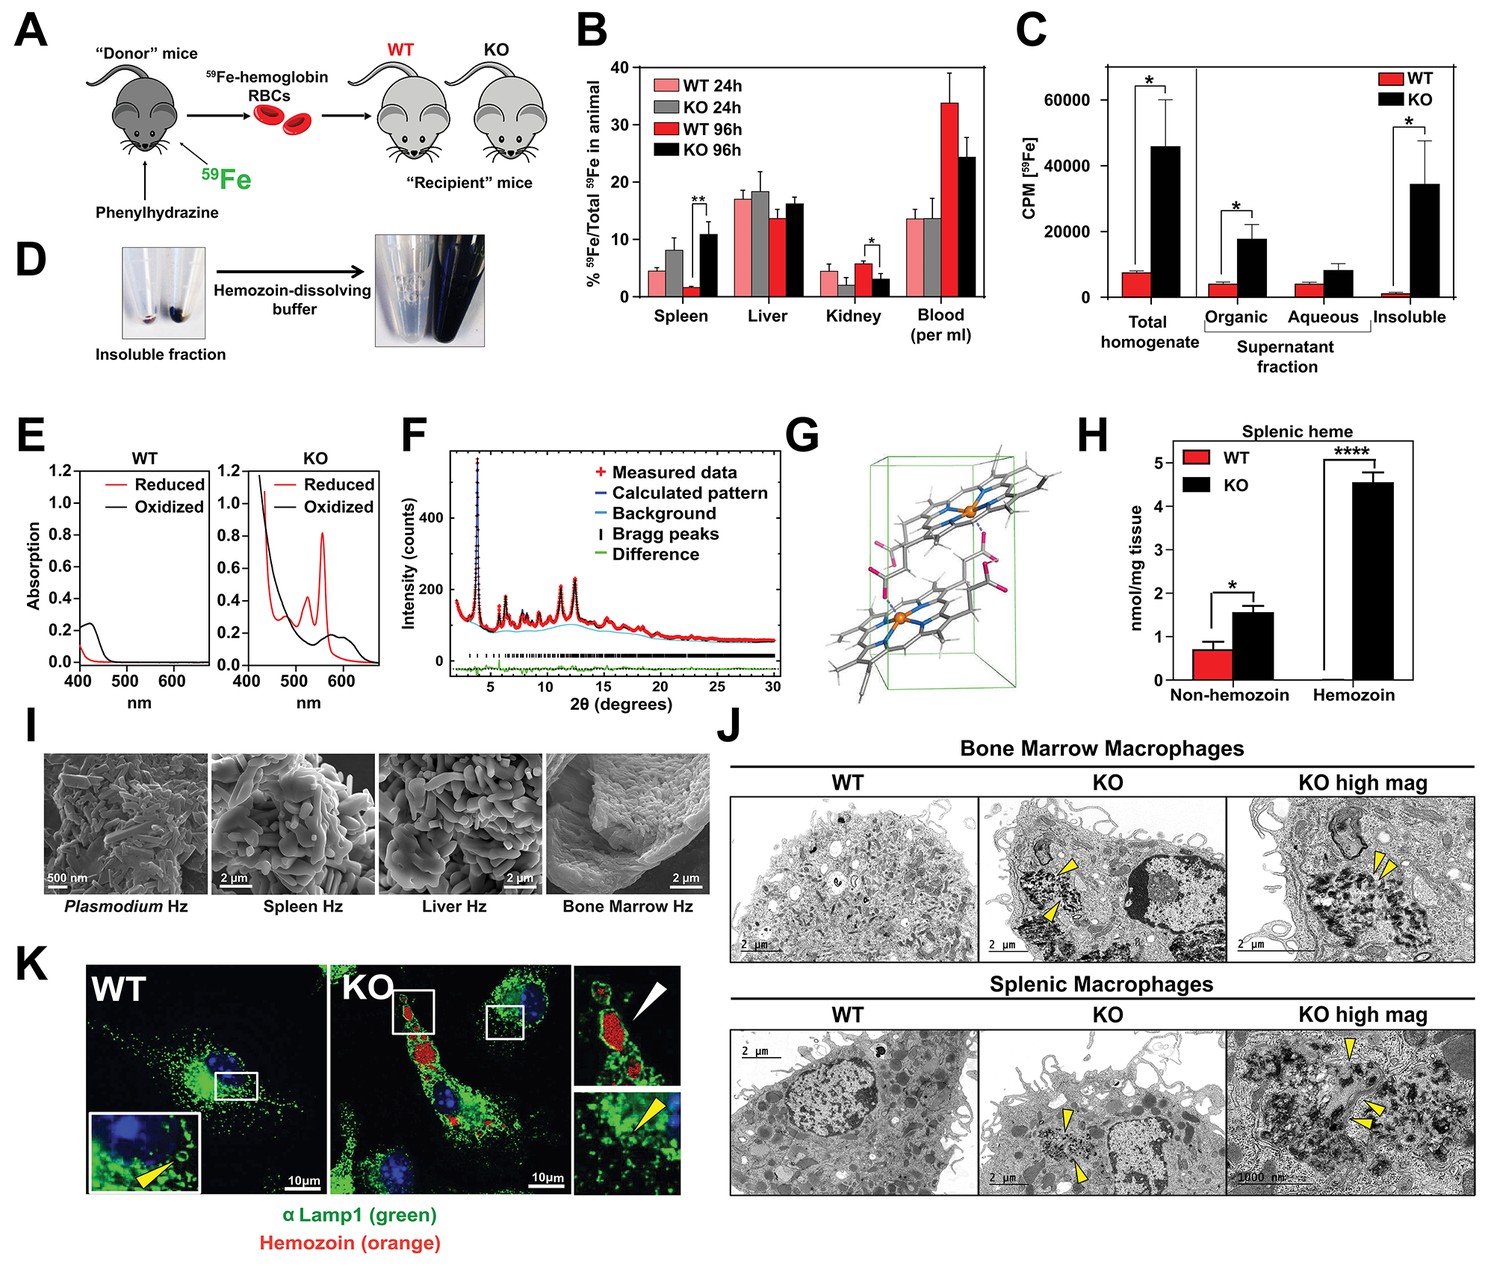
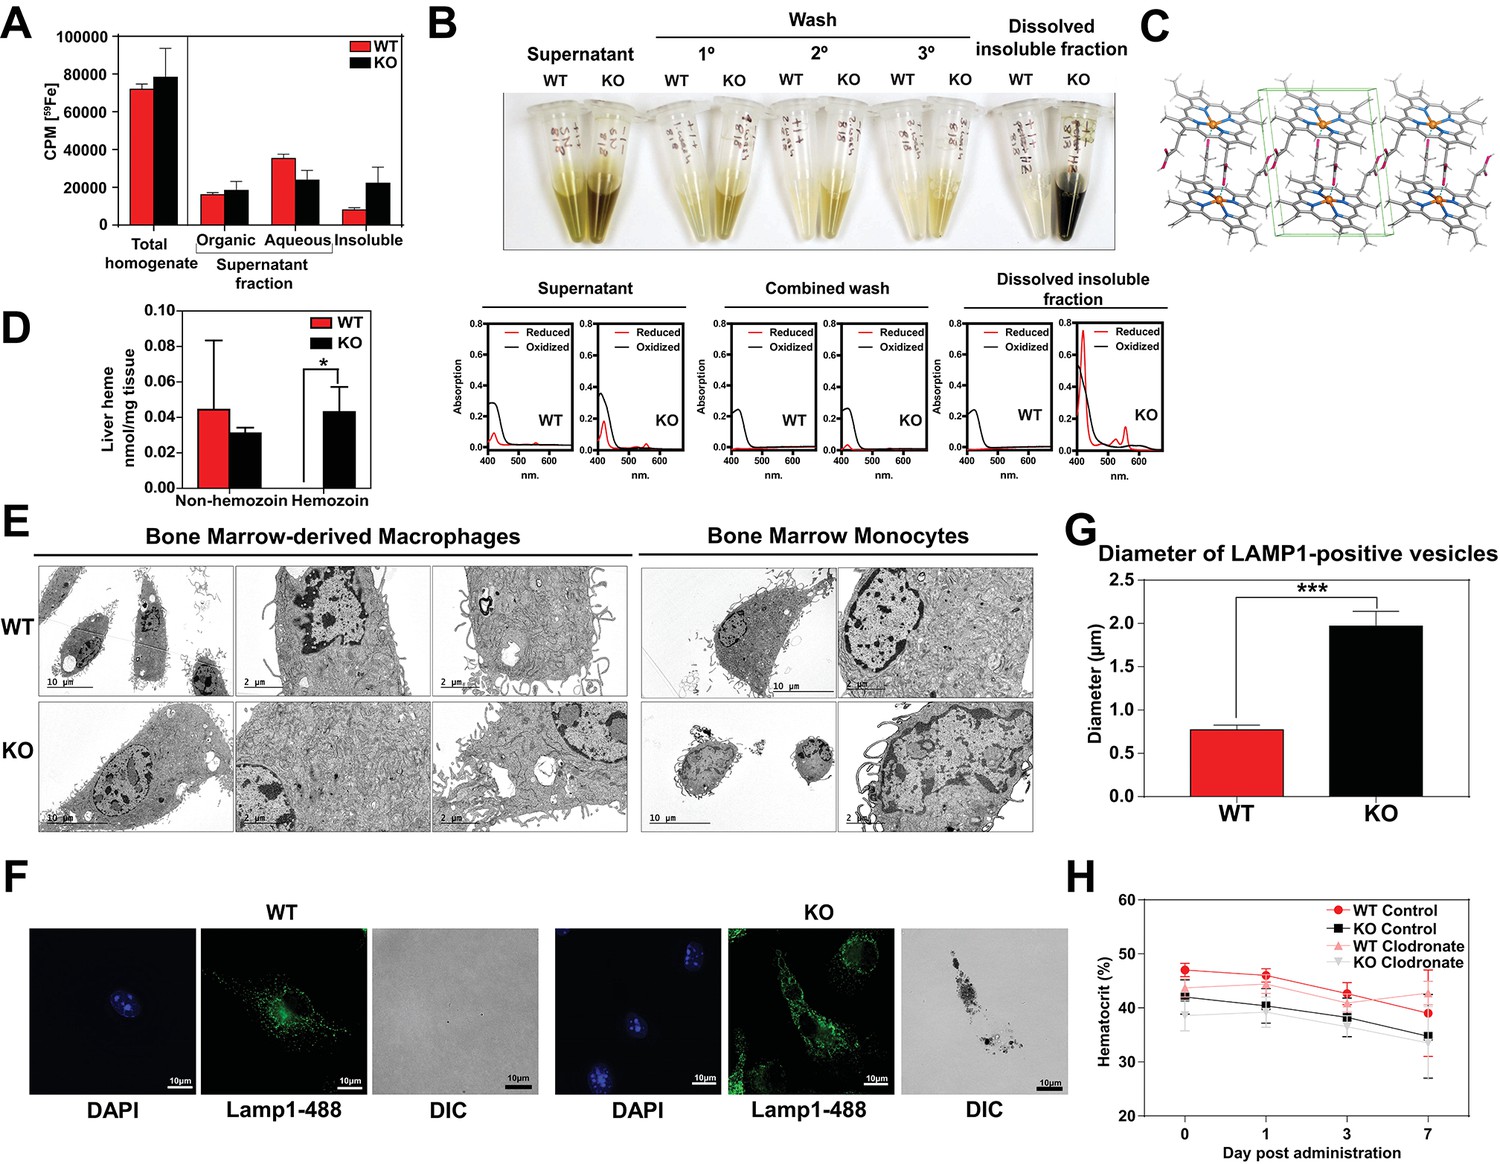
(A) Experimental design of 59Fe labeling and in vivo recycling. (B) Quantification of 59Fe retained in tissues, represented as the ratio of the amount of radioactivity within an organ to that of the entire animal. (C) 59Fe retained in differentially extracted fractions of the spleen at 96 hr, represented as counts per min. Total homogenate: homogenized and proteinase-treated whole spleen; Organic: ethyl acetate extractable [59Fe]heme; Aqueous: ethyl acetate non-extractable 59Fe; Insoluble fraction: proteinase-insoluble fraction containing 59Fe (n = 4–6 across all groups and timepoints). (D) Image of insoluble fractions before and after dissolving in buffer containing 100 mM NaOH, 2% SDS and 3 mM EDTA. (E) Visible spectra of dissolved insoluble fractions. (F) Powder x-ray diffraction of purified insoluble fraction from KO spleens (red: measured data; dark blue: calculated pattern; light blue: background; green: structural plot) (G) Chemical structure of hemozoin from KO mice. (H) Quantification of splenic heme by spectrophotometric measurements (n = 3). (I) Scanning electron microscopy of hemozoin isolated from Plasmodium falciparum, KO spleen, liver, and bone marrow. (J) Transmission electron microscopy of F4/80+ bone marrow and splenic macrophages from WT and KO mice. At least 3 cells were imaged per genotype. (K) Confocal microscopy of bone marrow macrophages from WT and KO mice probed with anti-LAMP1 antibody and secondary alexa-488 antibody. Hemozoin is pseudocolored as orange. White arrow points to hemozoin-laden vesicle, yellow arrow points to non hemozoin-laden vesicle. At least 20 cells were analyzed per genotype. *p<0.05; **p<0.01.
Figure 5—figure supplement 1
Supporting data for hemozoin in WT and KO mice.
(A) 59Fe retained in differentially extracted fractions of the liver at 96 hr, represented as counts per min. Total homogenate: homogenized and proteinase-treated whole spleen; Organic: ethyl acetate extractable [59Fe]heme; Aqueous: ethyl acetate non-extractable 59Fe; Insoluble fraction: proteinase-insoluble fraction containing 59Fe. n = 4–6. (B) Images of different fractions of spleen homogenates, accompanied by spectrophotometric measurements of each fraction (lower panel). (C) Chemical structure (rotated view) of hemozoin from KO mice. (D) Quantification of liver heme by spectrophotometric measurements (n = 3). (E) TEM of in vitro-differentiated bone marrow macrophages and isolated bone marrow monocytes. At least 3 cells were imaged per genotype. (F) LAMP1 immunofluorescence on F4/80+bone marrow macrophages from WT and KO mice. (G) Diameter of LAMP1-positive vesicles observed in F4/80+bone marrow macrophages. In both WT and KO cells, the diameters of LAMP1-positive structures with distinguishable boundaries were quantified manually by ImageJ software analysis. WT: 4 cells, 3–5 structures per cell; KO: 11 cells, 3–12 structures per cell. (H) Hematocrits of iron-deficient WT and KO mice treated with control or clodronate liposomes (n = 6–14). *p<0.05, ***p<0.001.
Figure 6 with 1 supplement
SLC48A1 deficiency confers cellular heme tolerance during erythrophagocytosis and haploinsufficiency of HMOX1 in SLC48A1-deficient animals causes perinatal lethality.
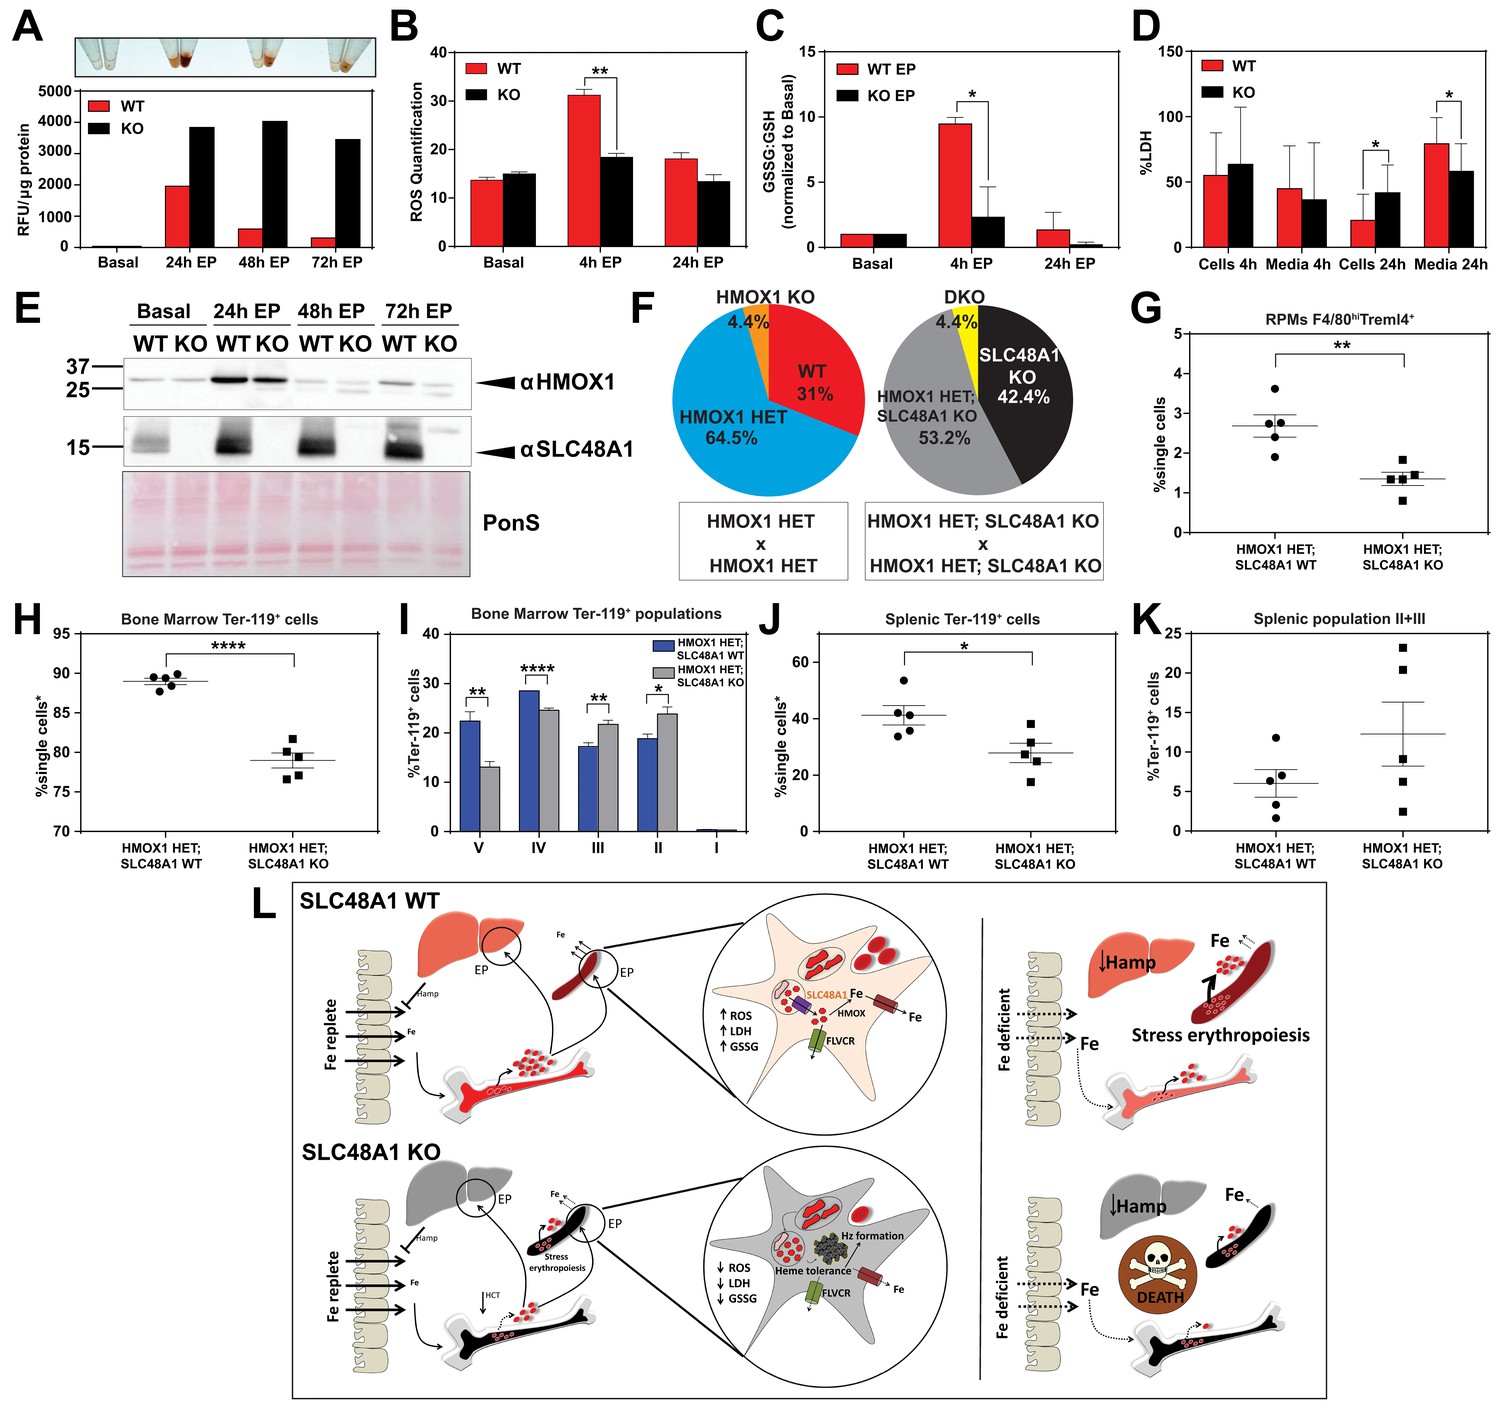
(A) Images of cell lysates and quantification of heme content in WT and KO BMDMs at basal (no treatment), 24 hr, 48 hr and 72 hr post-EP (erythrophagocytosis). Results are representative of at least two experiments. (B) Quantification of intracellular reactive oxygen species (ROS) in WT and KO BMDMs at basal, 4 hr and 24 hr post-EP. (C) Ratio of cellular GSSG:GSH in WT and KO BMDMs at basal, 4 hr and 24 hr post-EP. Values for 4 hr and 24 hr are normalized to basal values. The values shown are a combination of two representative biological replicates. (D) LDH content in cells and media of WT and KO BMDMs at 4 hr and 24 hr post-EP, represented as percentage of total LDH in cells and media. (E) Immunoblots of HMOX1 and SLC48A1 protein of BMDM lysates shown in (A). (F) Percentages of pups born of the indicated genotypes for HMOX1 HET intercrosses, either on a WT or KO background. (G) Quantification of splenic RPMs in HMOX1 HET and HMOX1 HET; SLC48A1 KO mice by flow cytometry. (H) Quantification of total Ter-119+ cells in the bone marrow. The %single cells* on the y-axis denote single cells that are negative for CD4/8/41, B220 and Gr-1. (I) Quantification of subpopulations of Ter-119+ cells represented as a percentage of total Ter-119+ cells in the bone marrow. (J) Quantification of total Ter-119+ cells in the spleen. The %single cells* on the y-axis denote single cells that are negative for CD4/8/41, B220 and Gr-1. (K) Quantification of populations II and III of Ter-119+ cells represented as a percentage of total Ter-119+ cells in the spleen. At least 100,000 single cells were analyzed per sample. Each dot represents one mouse. Both male and female mice were analyzed in the experiments conducted in Figure 6. (L) Proposed model for the in vivo and in vitro function of SLC48A1 in heme-iron recycling of RBCs under systemic iron replete and deficient conditions. *p<0.05; **p<0.01; ****p<0.0001.
Figure 6—figure supplement 1
Extended characterization of HMOX1; SLC48A1 mice.
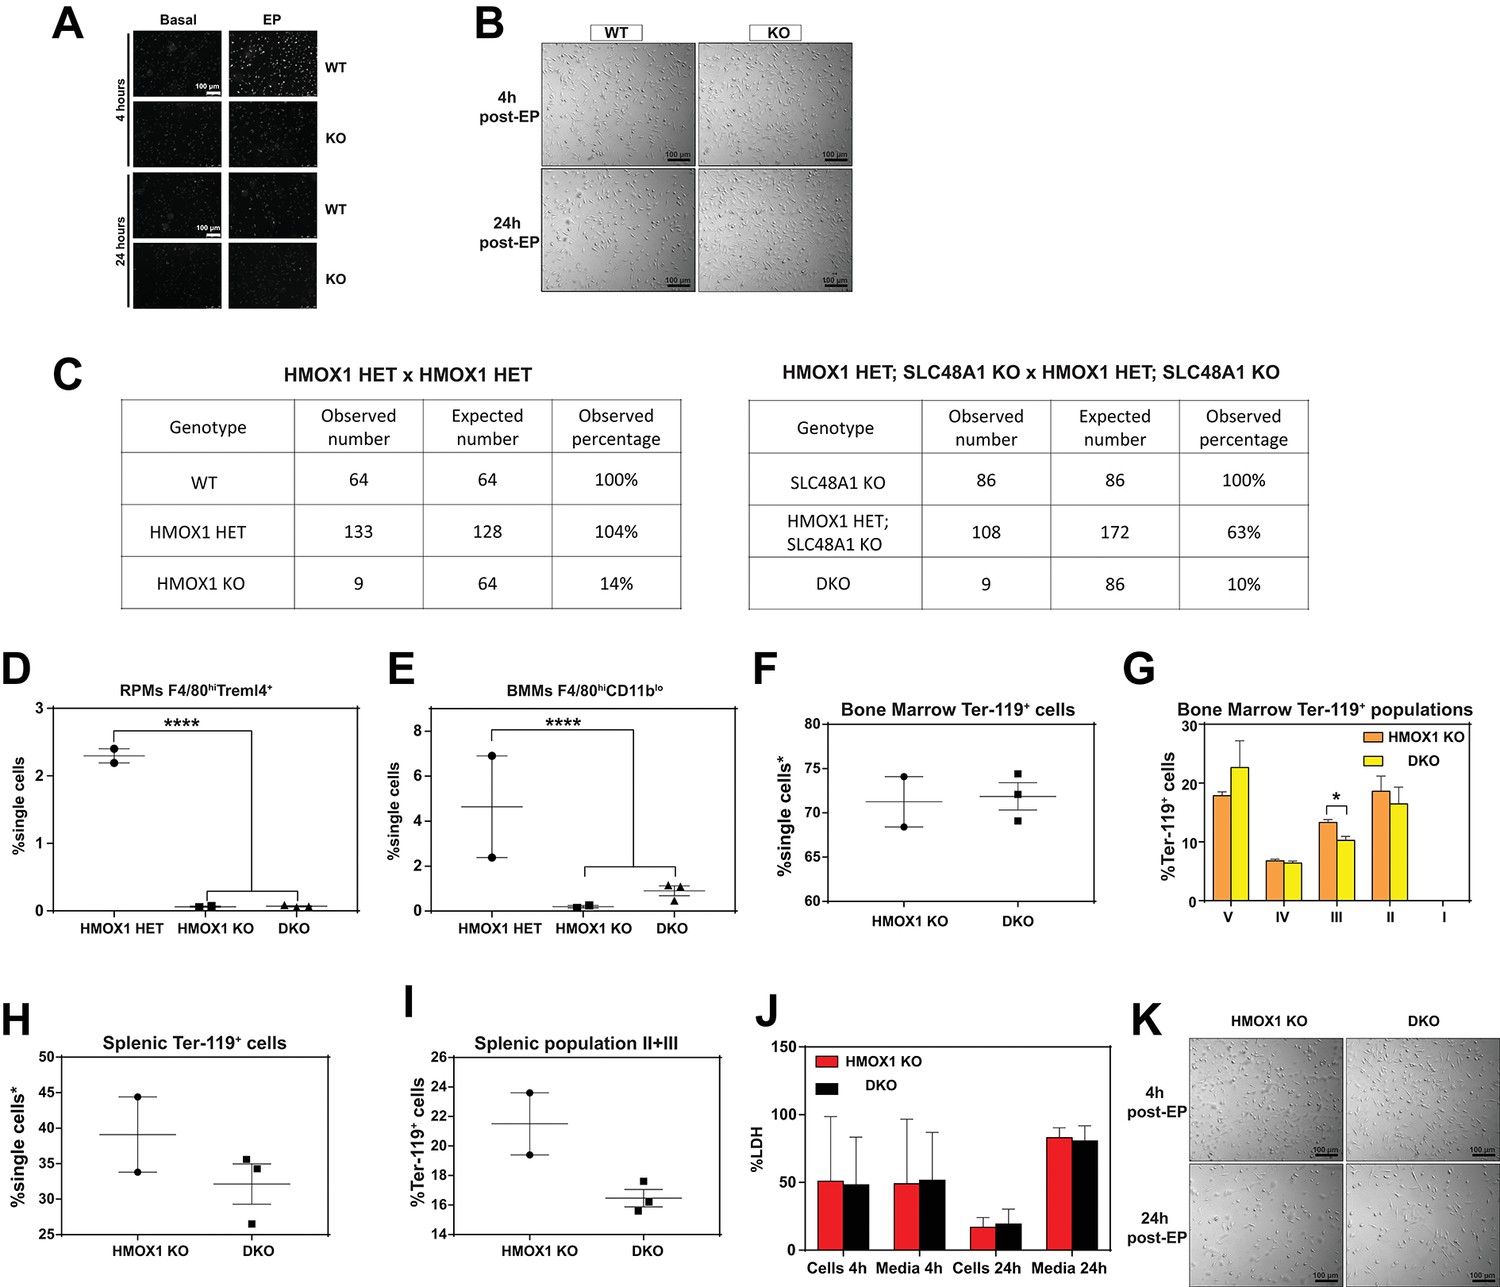
(A) Representative images of intracellular reactive oxygen species (ROS) in WT and KO BMDMs at the indicated timepoints post-treatments. (B) Representative images of WT and KO BMDMs post-EP. (C) Observed and expected numbers of pups born of the indicated genotypes for HMOX1 HET intercrosses, either on a WT or KO background. Quantification of splenic RPMs (D) and bone marrow macrophages (BMMs) (E) in HMOX1 KO and DKO mice by flow cytometry. (F) Quantification of total Ter-119+ cells in the bone marrows of HMOX1 KO and DKO mice. (G) Quantification of subpopulations of Ter-119+ cells represented as a percentage of total Ter-119+ cells in the bone marrow. (H) Quantification of total Ter-119+ cells in the spleen. The %single cells* on the y-axis denote single cells that are negative for CD4/8/41, B220 and Gr-1. (I) Quantification of populations II and III of Ter-119+ cells represented as a percentage of total Ter-119+ cells in the spleen. At least 100,000 single cells were analyzed per sample. Each dot represents one mouse. (J) LDH content in cells and media of HMOX1 KO and DKO BMDMs post-erythrophagocytosis (EP), represented as percentage of total LDH in cells and media. (K) Representative images of HMOX1 KO and DKO BMDMs post-EP.
Author response image 1
Tables
Key resources table
| Reagent type (species) or resource | Designation | Source or reference | Identifiers | Additional information |
|---|---|---|---|---|
| Strain, strain background (Mus musculus, 129/SvJ/C57BL/6J) | SLC48A1, HMOX1 | This paper, Materials and methods subsection animals | Mouse strain | |
| Biological sample (Mus musculus) | Primary bone marrow-derived macrophages | SLC48A1/HMOX1 mice | ||
| Biological sample (Plasmodium falciparum) | Hemozoin | Plasmodium falciparum | Gift from Dr. Paul Sigala | |
| Antibody | SLC48A1 (Rabbit, polyclonal) | PMID: 30248094 | 1:500 | |
| Antibody | F4/80 (Rat, polyclonal) | Invitrogen | MF48000 RRID:AB_10376289 | 1:1000 |
| Antibody | HMOX1 (rabbit, polyclonal) | Enzo | ADI-SPA-896 RRID:AB_10614948 | 1:1000 |
| Antibody | LAMP1 (rat, polyclonal) | Developmental Studies Hybridoma Bank | 1D4B RRID:AB_2134500 | 1:100 |
| Antibody | Anti-F4/80 microbeads | Miltenyi Biotech | 130-110-443 | Beads |
| Recombinant DNA reagent | guide RNA | Sage Laboratories | TAGGGACGGTGGTCTACCGACAACCGG | |
| Recombinant DNA reagent | Cas9 RNA | Trilink Biotechnologies | ||
| Sequence-based reagent | HMOX1 KO F | PMID: 24963040 | GCTTGGGTGGAGAGGCTATTC | |
| Sequence-based reagent | HMOX1 KO R | PMID: 24963040 | CAAGGTGAGATGACAGGAGATC | |
| Sequence-based reagent | HMOX1 WT F | PMID: 24963040 | GTACACTGACTGTGGGTGGGGGAG | |
| Sequence-based reagent | HMOX1 WT R | PMID: 24963040 | AGGGCCGAGTAGATATGGTAC | |
| Sequence-based reagent | Custom qPCR array | Qiagen; this paper | CLAM25204D | |
| Commercial assay or kit | Stanbio Iron and TIBC kit | VWR | 10152–550 | |
| Commercial assay or kit | mouse ferritin ELISA kit | Abcam | ab157713 | |
| Commercial assay or kit | LDH kit | Sigma | TOX7 | |
| Commercial assay or kit | ROS kit | Sigma | MAK142 | |
| Commercial assay or kit | GSH assay kit | Abcam | ab138881 | |
| Chemical compound, drug | Clodronate liposomes | Clodronate liposomes | C-005 | |
| Software, algorithm | Heatmapper software | PMID: 27190236 | ||
| Software, algorithm | PRISM seven software | Graphpad | ||
| Other | 59FeCl3 | Perkin Elmer | NEZ037001MC | Radioactive material |
Additional files
-
Supplementary file 1
Table 1: SLC48A1/HRG1 Mutant alleles produced by CRISPR/Cas9.
Table 2: Serum iron panel for WT and KO animals fed standard or 2ppm iron diet. Table 3: qRT-PCR analyses for iron/heme metabolism genes.
- https://cdn.elifesciences.org/articles/49503/elife-49503-supp1-v2.docx
-
Supplementary file 2
Contains tables of statistical analyses not included in the Transparent Reporting File.
- https://cdn.elifesciences.org/articles/49503/elife-49503-supp2-v2.xlsx
-
Transparent reporting form
- https://cdn.elifesciences.org/articles/49503/elife-49503-transrepform-v2.pdf
Download links
A two-part list of links to download the article, or parts of the article, in various formats.
Downloads (link to download the article as PDF)
Open citations (links to open the citations from this article in various online reference manager services)
Cite this article (links to download the citations from this article in formats compatible with various reference manager tools)
Hemozoin produced by mammals confers heme tolerance
eLife 8:e49503.
https://doi.org/10.7554/eLife.49503


