Distinct recruitment of dorsomedial and dorsolateral striatum erodes with extended training
- Johns Hopkins University, United States
- University of Minnesota, United States
Figures
Figure 1
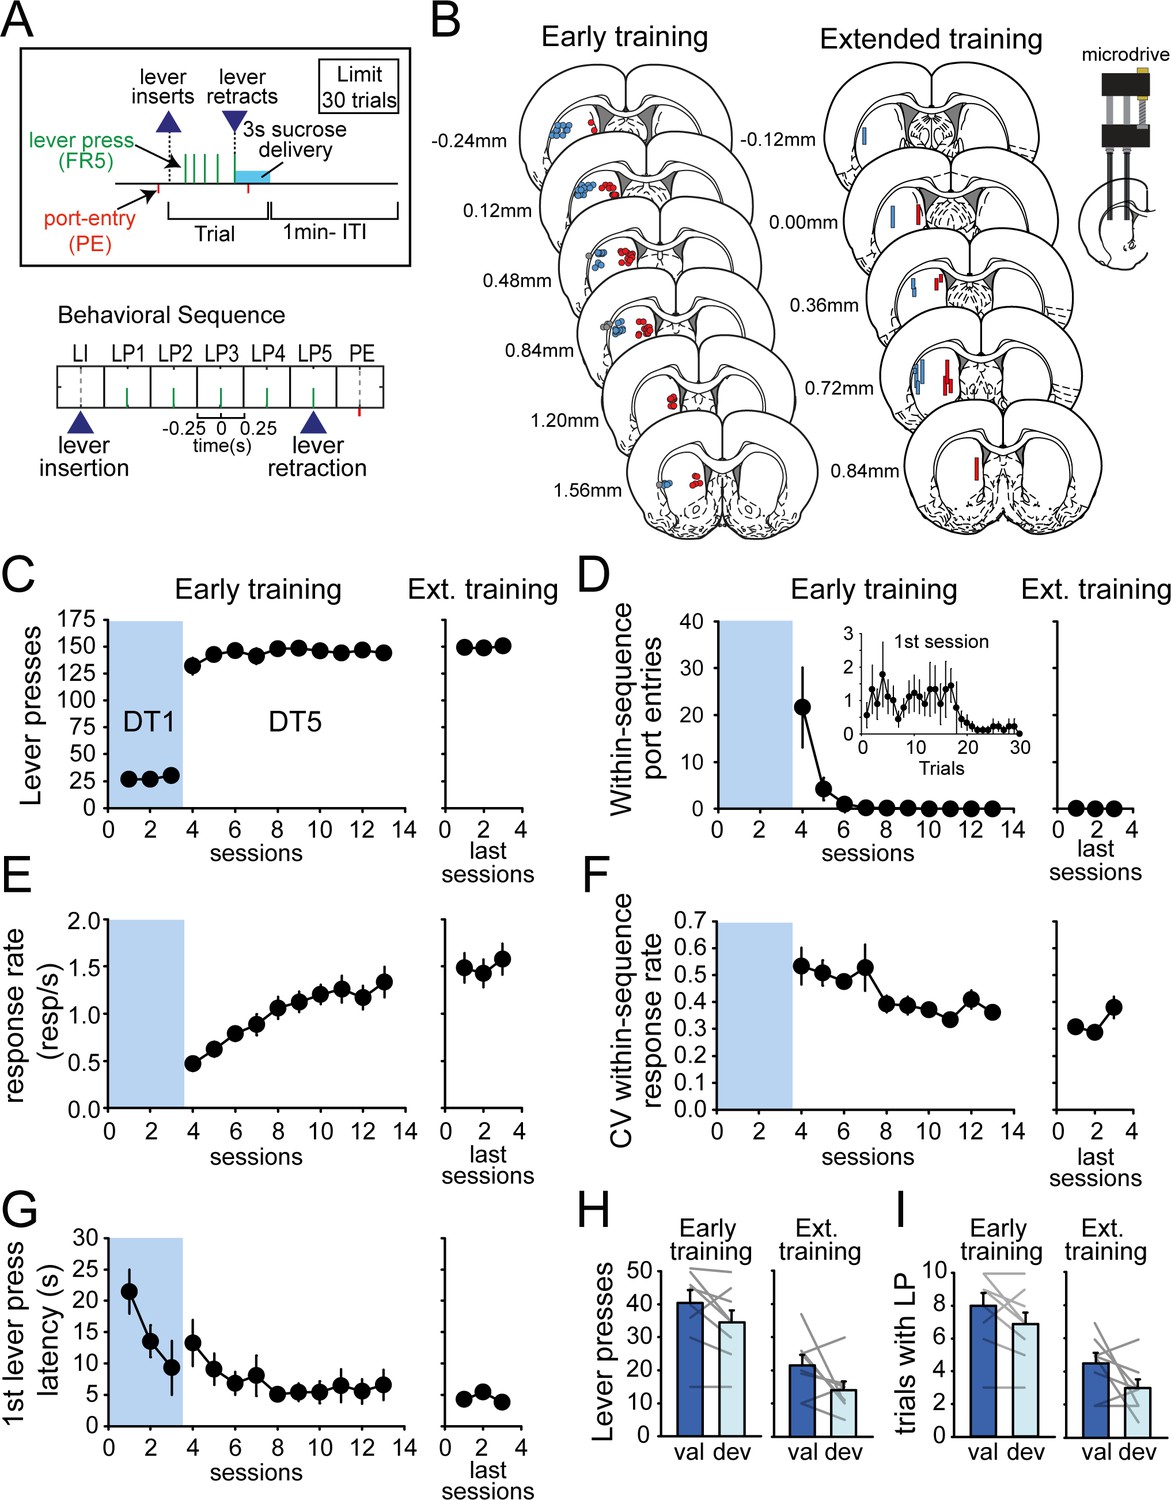
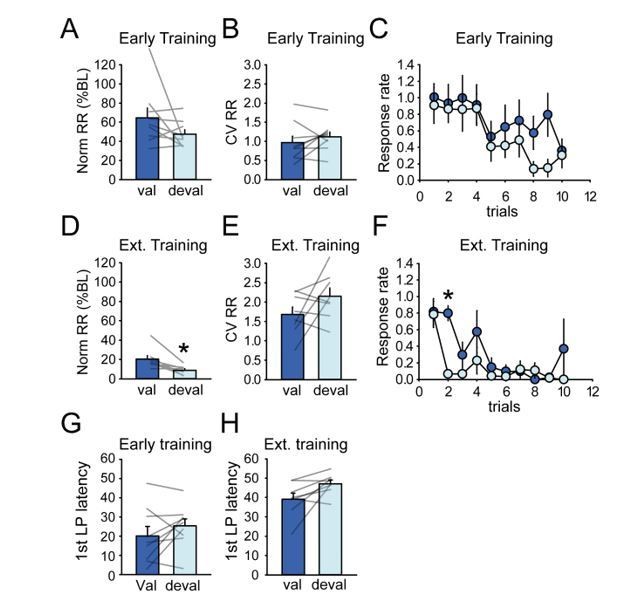
Rats rapidly develop habit and automaticity in the DT5 task.
(A) Schematic of the DT5 task and event-related time intervals considered for analyses. (B) Histological reconstruction of electrode placements in DLS and DMS. (C–G) Number of lever presses (C), within-sequence port entries (D), response rate (responses per second) (E), coefficient of variation of within-sequence response rate (F), and first lever press latency (G) across early training and recording sessions (3 DT1 sessions followed by 10 DT5 sessions) and during the last three recording sessions in the extended training group. Inset in D: Number of within-sequence port entries across trials during the first DT5 session. (H–I) Satiety-induced devaluation: number of lever presses (H) and number of initiated trials (I) in the valued (val) and devalued (deval) conditions under extinction after early training (left) and extended training (right). Error bars show SEM.
Figure 2 with 2 supplements
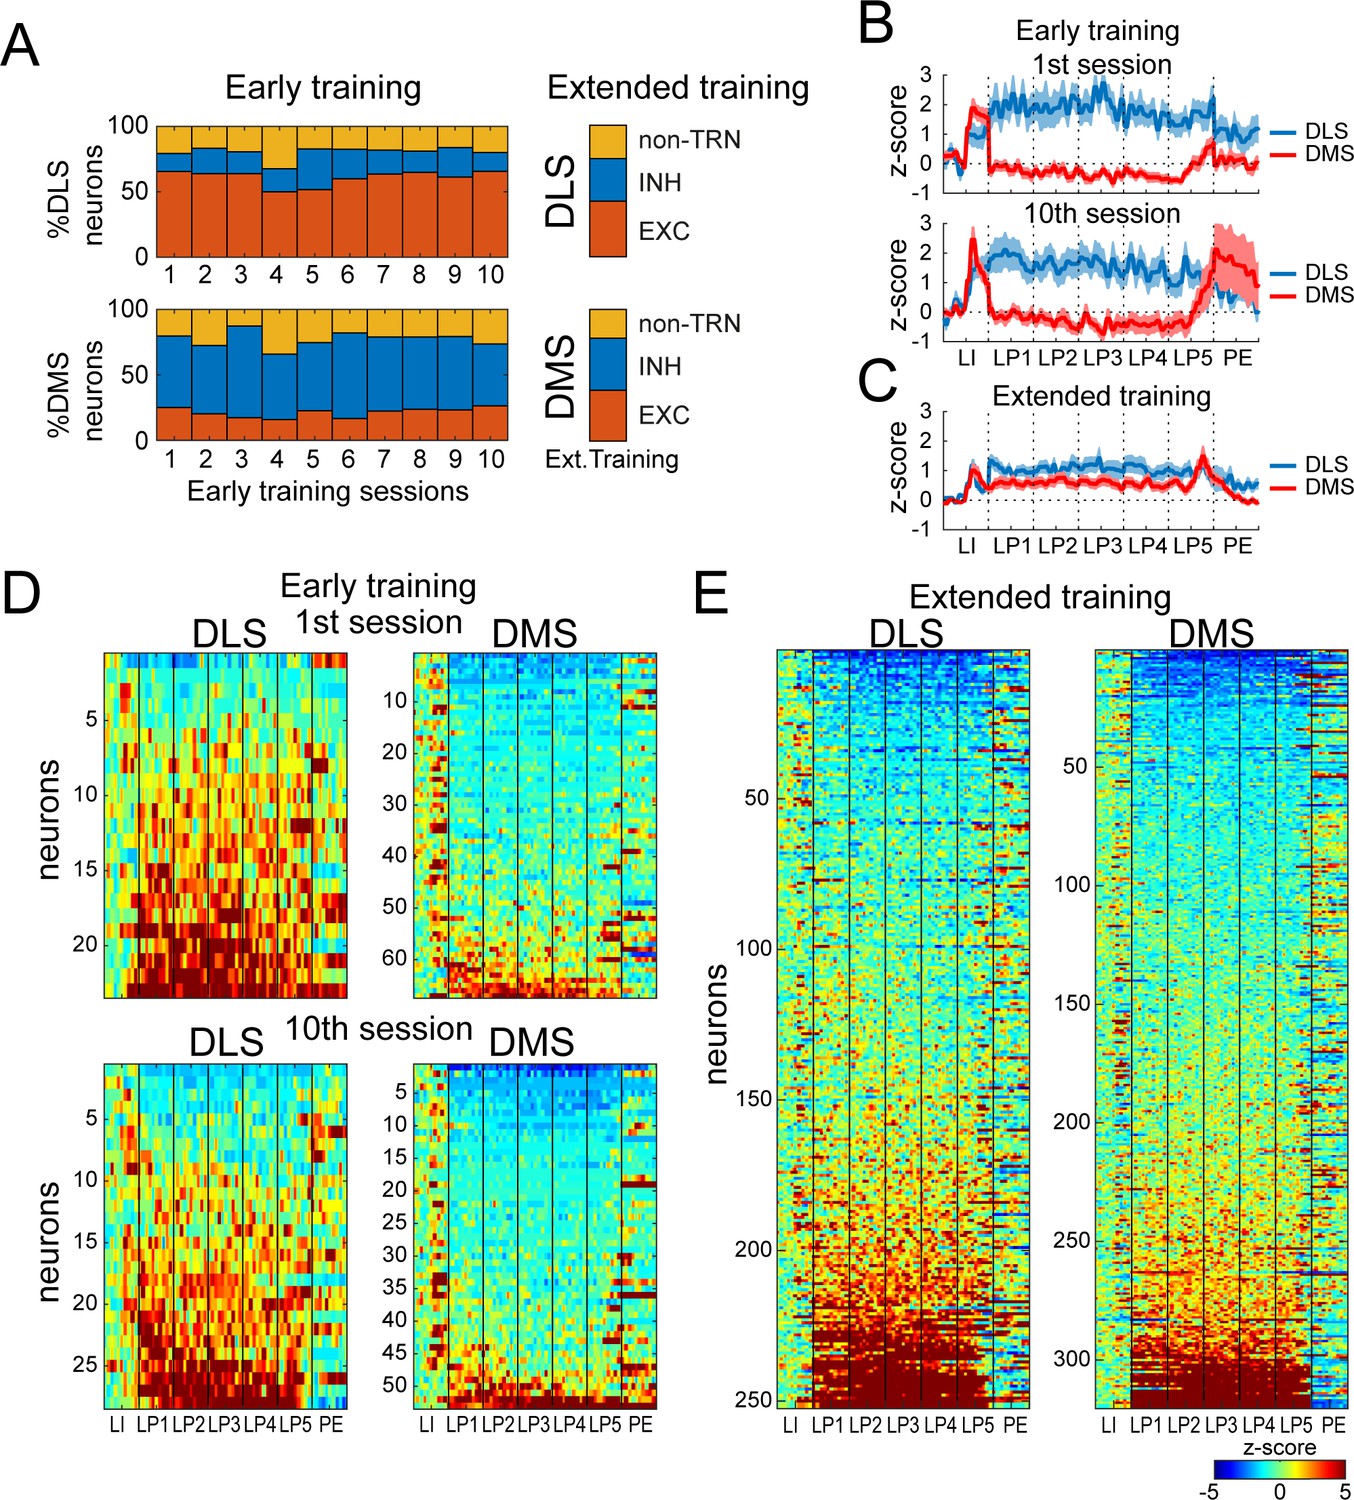
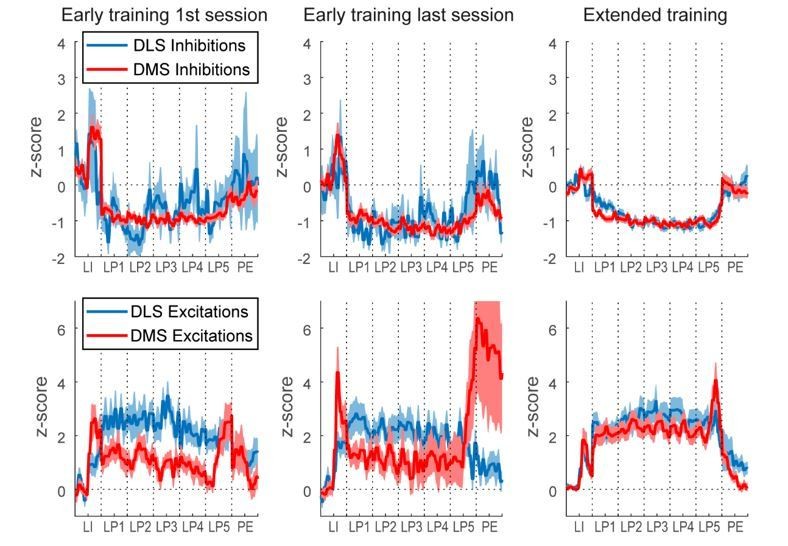
DMS and DLS neurons are differentially modulated in the DT5 task during early training but not extended training.
(A) Proportion of non-task-responsive neurons (non-TRN), and task-responsive neurons (TRN) excited (EXC) or inhibited (INH) during the sequence, across early training sessions (left) or after extended training (right) in DLS (up) and DMS (bottom). (B–C) Mean z-score (± SEM) of DLS (blue) and DMS (red) TRNs during (B) early training sessions day 1 (top) and 10 (bottom) (N = 9 animals) and (C) during extended training (N = 8 animals). (D–E) Heatmaps of DLS (left) and DMS (right) TRNs, sorted by mean sequence-related activity, during (D) early training session 1 (top) and 10 (bottom) and (E) extended training.
Figure 2—figure supplement 1
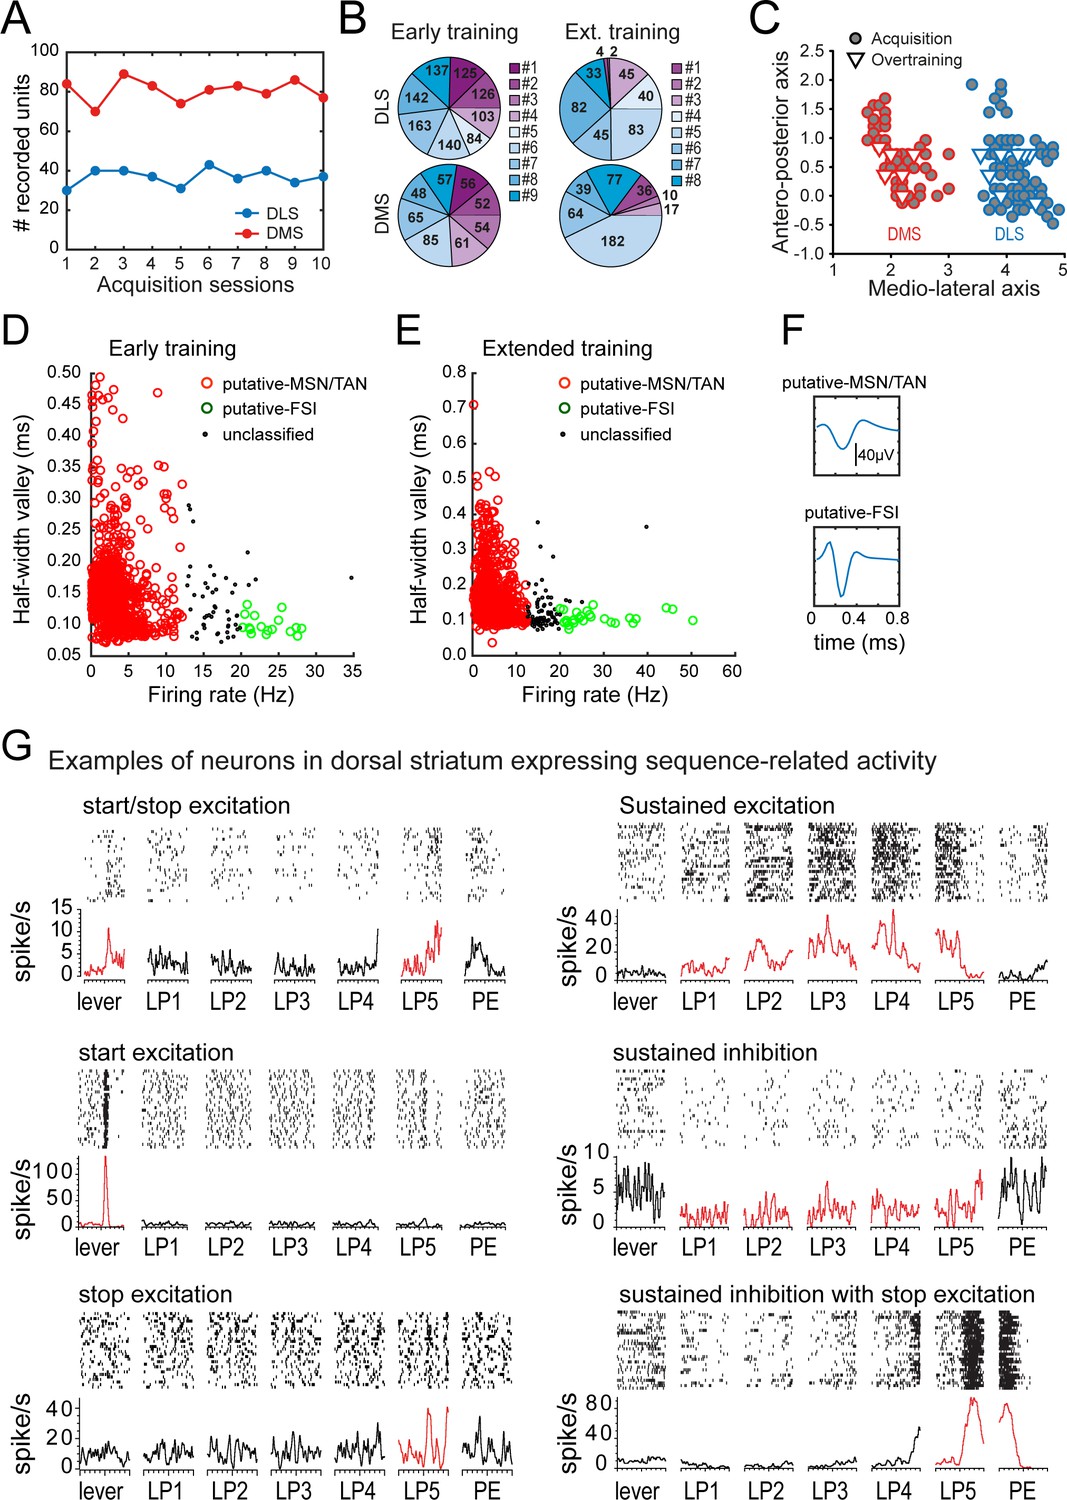
Recording results summary and isolation of medium spiny neurons.
(A) Number of recorded units per session in DLS (blue) and DMS (red). (B) Total number of recorded units (sum across sessions) per rats in DLS (top) and DMS (bottom), during early training (left) and extended training (right). (C) Antero-posterior and medio-lateral coordinates of electrode placements in the early training (circle) and extended training (triangle) groups. (D–E). Scatter plots of firing rate and half-valley width in the early training (D) and extended training (E) data sets. (F) Example of the average waveform of putative MSN/TAN, and putative-FSI. (G) Rasters and peri-event time histograms are presented for eight neurons in the extended training data set expressing distinct neural activity patterns during the behavioral sequence (±500 ms windows around each event of the sequence).
Figure 2—figure supplement 2
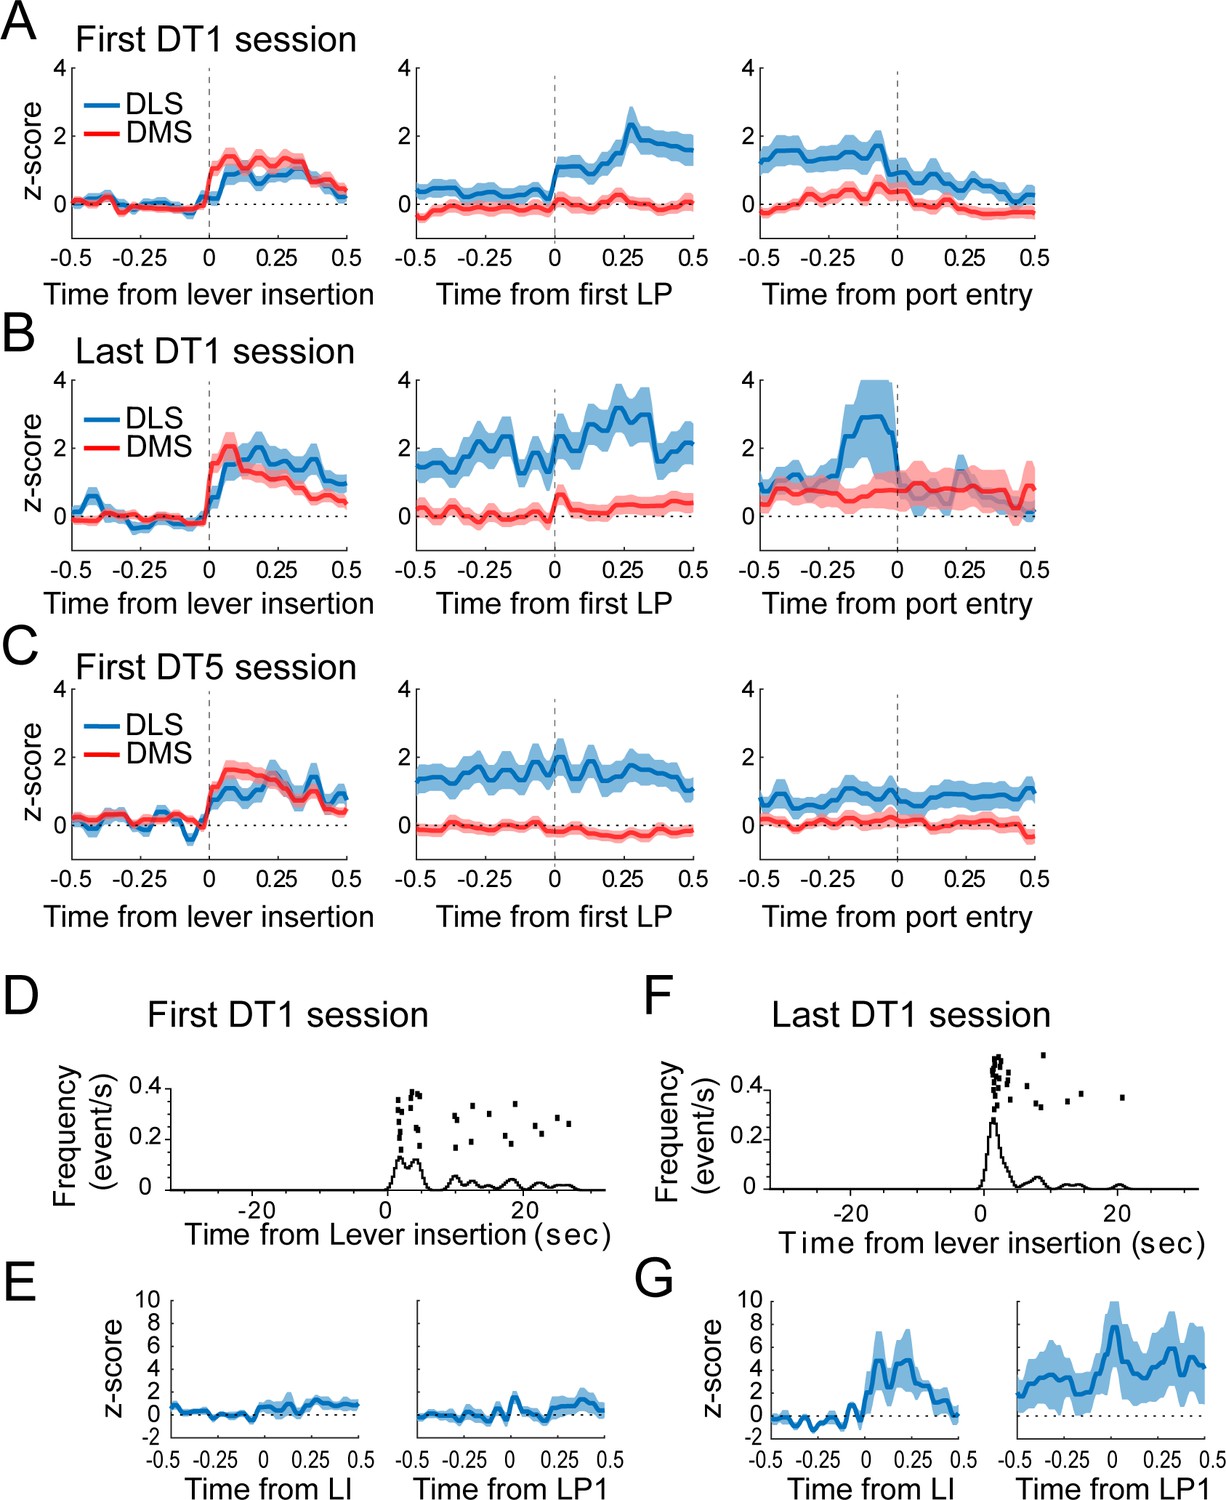
Moderate changes in DLS activity across the first DT1 early training sessions.
(A–C) Average z-score (± SEM) of putative-MSNs around the lever insertion (left), the first lever press (middle), and the port entry (right) in DMS and DLS neurons during the first DT1 session (A), the last DT1 session (B), and the first DT5 session (C). DLS activity before the first lever press differs during the first DT1 session compared to the last DT1 session (p<0.05) and the first DT5 session (p<0.05). (D and F) Peri-event raster and histogram of lever presses aligned to the lever insertion (upper part) in the first DT1 session (D) and the last DT1 session (F) of a representative rat. (E and G) Mean z-score (± SEM) around the lever insertion (left) and the first lever press (right) in DLS neurons during the first DT1 session (E) and the last DT1 session (G) depicted in D and F.
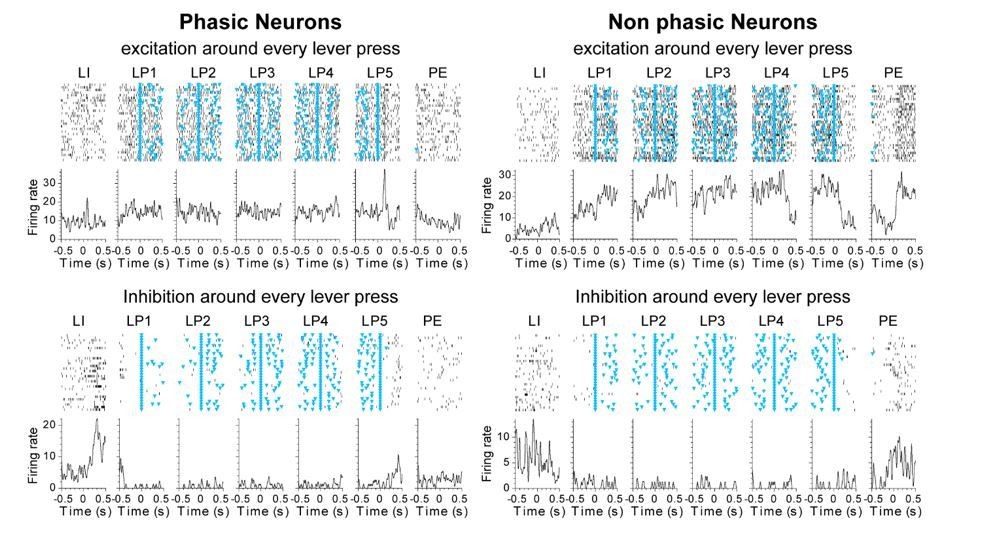
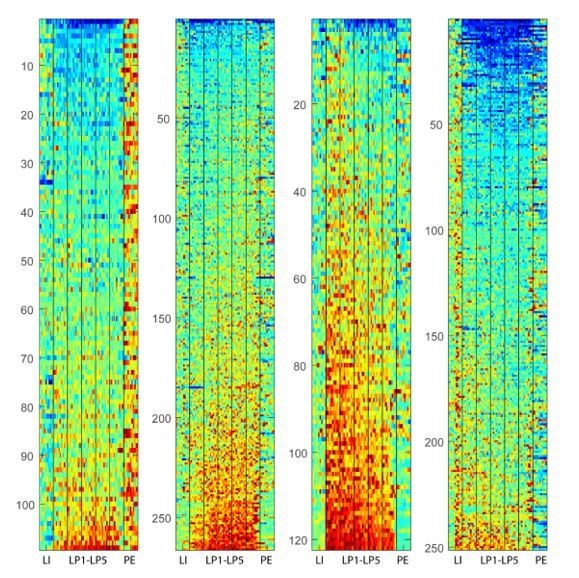
Figure 3 with 1 supplement
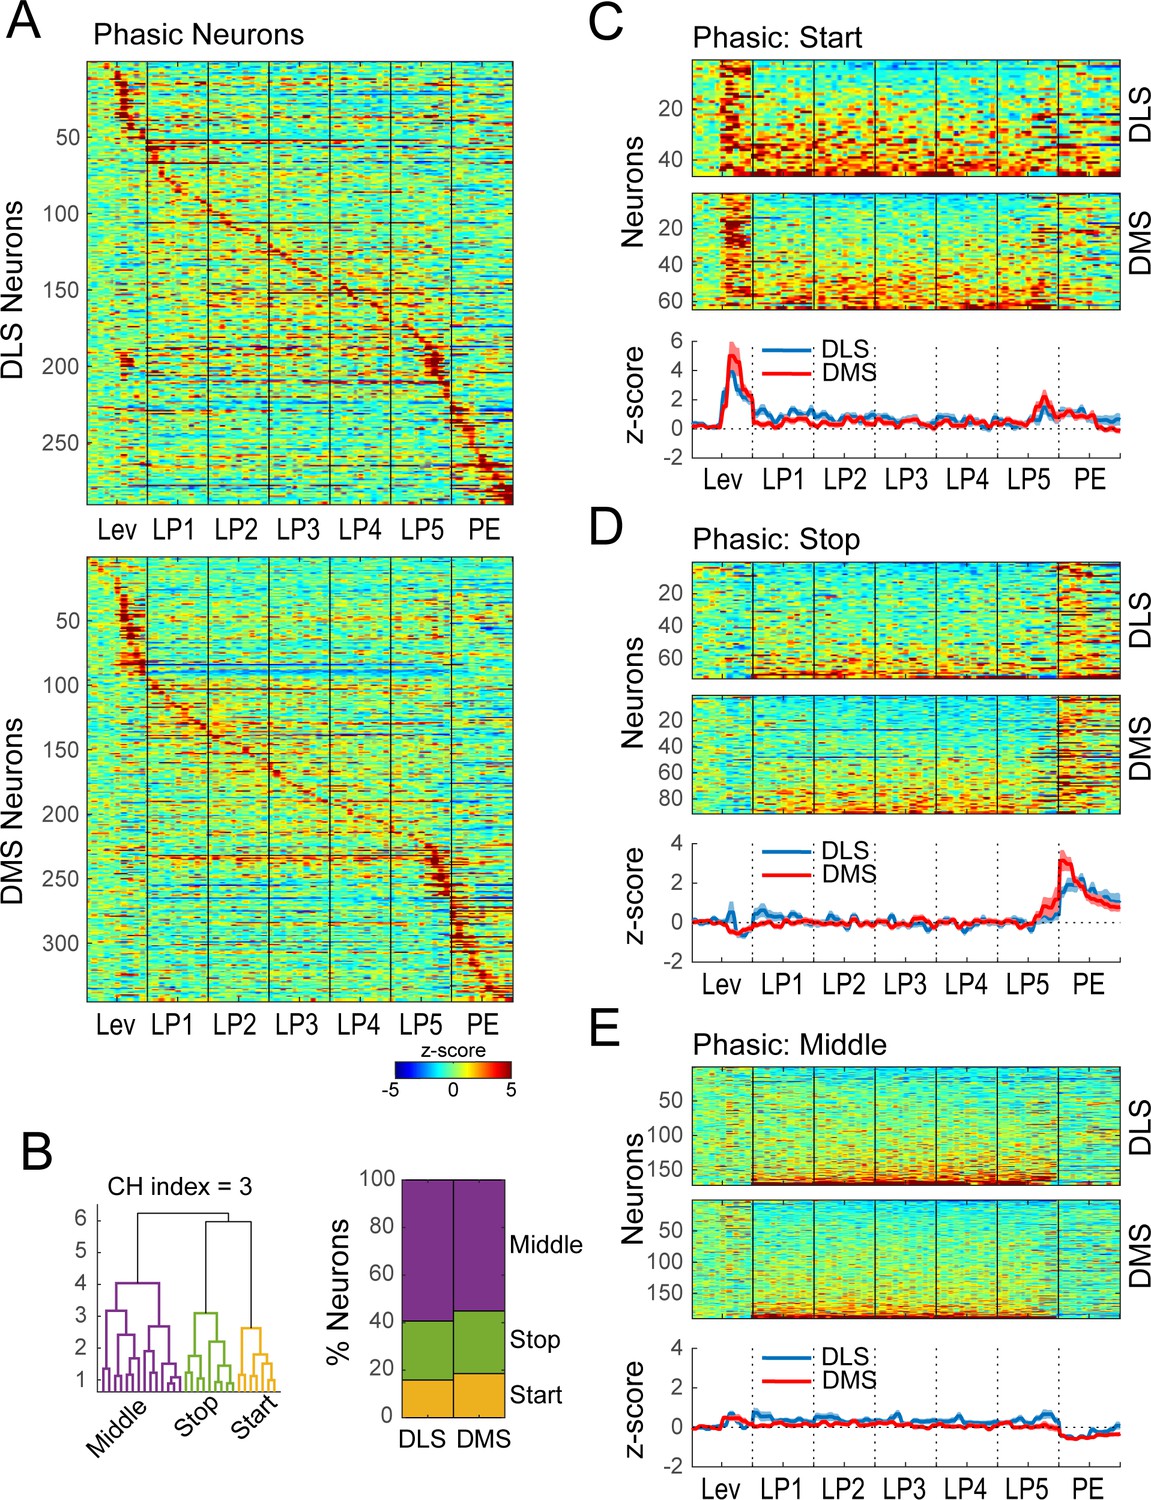
Hierarchical clustering on Phasic neurons during extended training.
(A) Heatmap of normalized activity of neurons identified as being Phasic (290/338 neurons in DLS and 345/410 in DMS) sorted by time of peak activity. (B) Hierarchical clustering on Phasic neurons (combined DMS and DLS): dendrogram (left) and proportion of DLS and DMS neurons in the Start, Stop and Middle classes (right). (C–E) Heatmaps (top) and average z-score (± SEM) (bottom) of Phasic Start neurons (C; 46/290 and 64/345), Phasic Stop neurons (D; 72/290 and 91/345) and Phasic Middle neurons (E; 172/290 and 190/345) separated by region; neurons are sorted by averaged normalized activity during the behavioral sequence.
Figure 3—figure supplement 1

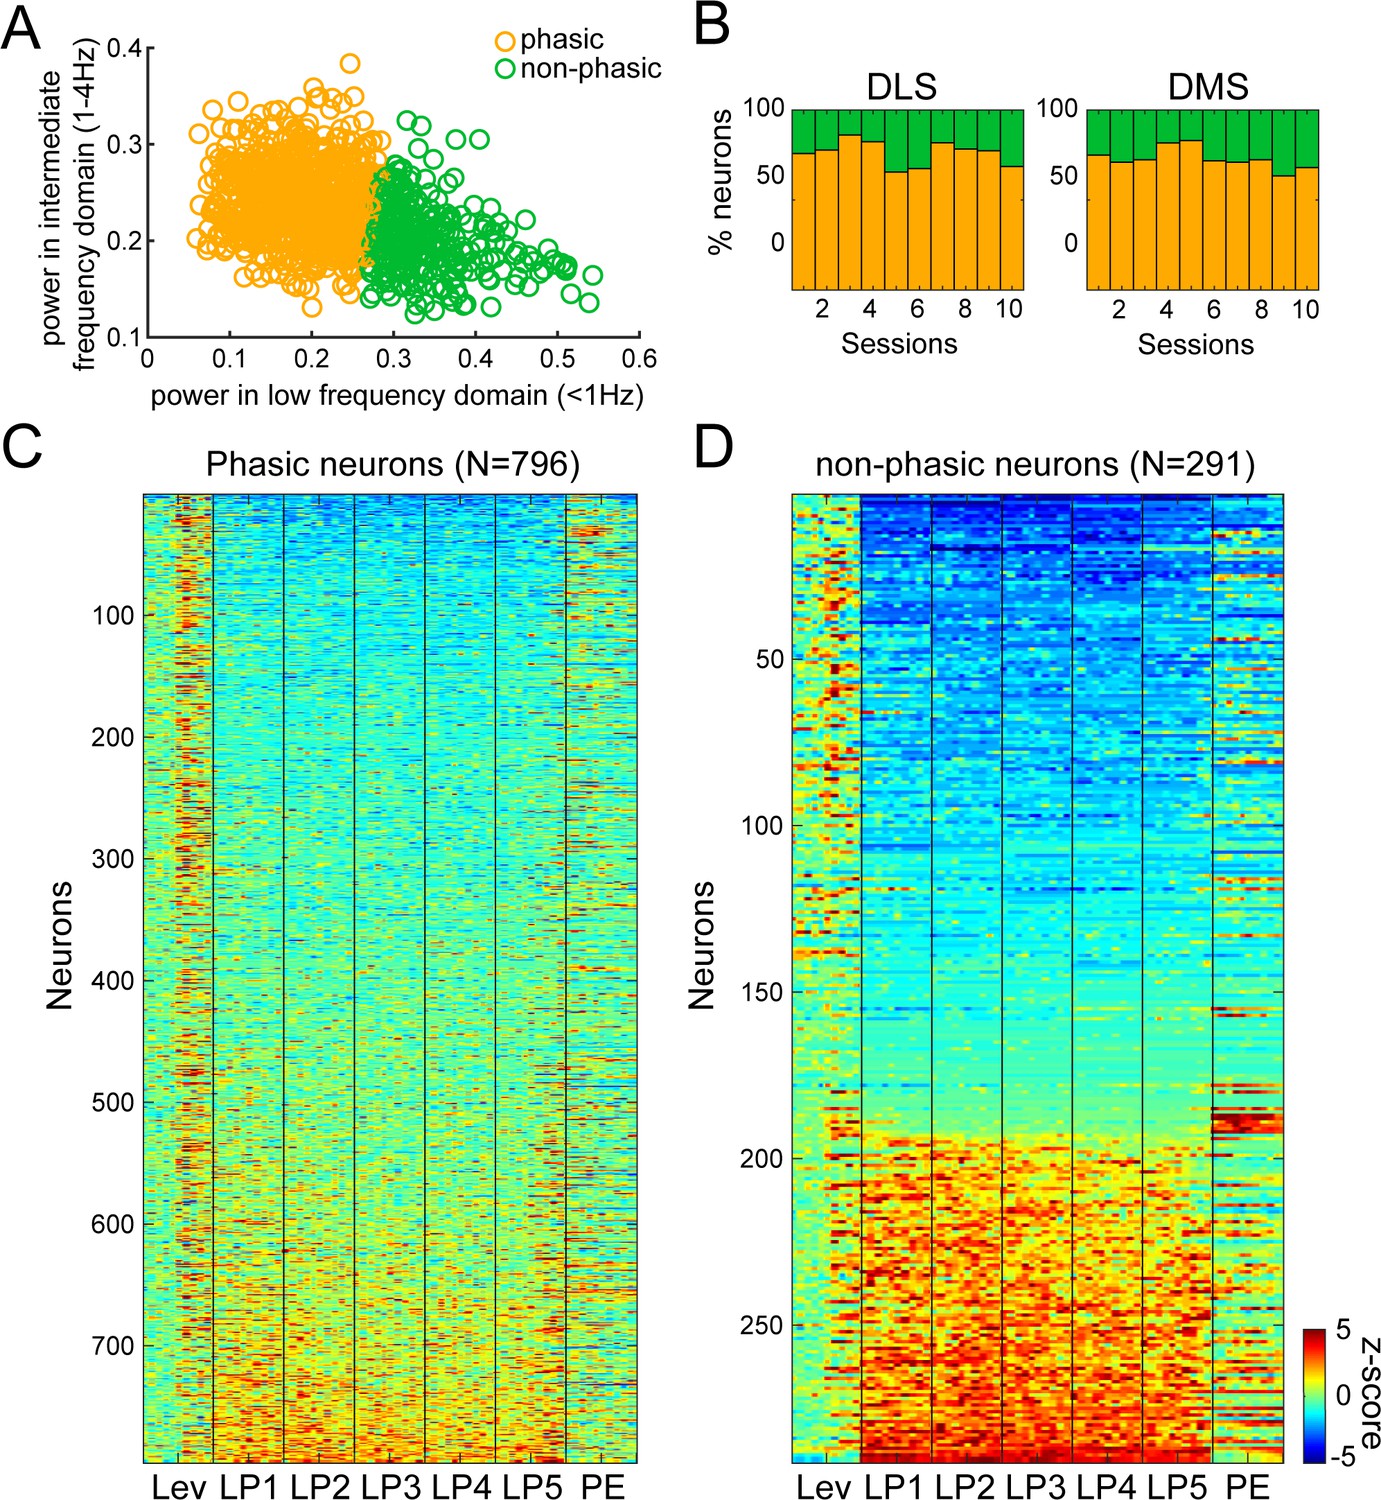
Fourier analysis and hierarchical clustering allowing separation of Phasic and Non-phasic neurons during extended training.
Power in low (<1 Hz) and intermediate (1–4 Hz) frequency domains were used as features for hierarchical clustering. (A) Scatter plot of normalized power in low (<1 Hz) and intermediate (1–4 Hz) frequency ranges illustrating the separation of Phasic neurons (orange circles), and Non-phasic neurons (green circles). (B–C) Dendrogram (B) and proportion of Phasic and Non-phasic neurons in DMS and DLS (C). (D) Heatmaps of neural activity of Phasic (left) and Non-phasic neurons (right). (E) Generalization of classification results across ranges of low and intermediate frequency domains. The colormap indicates the optimal number of clusters as indicated by the Calinski-Harabasz criterion for each combination of parameters. The optimal number of clusters was 2 (60%) or 3 (33%) in 93% of parameters combination. (F) Permutation test for distinctiveness of the two clusters. Dark blue bars: Distribution of distances between cluster means of when neurons were randomly assigned to either the Phasic or Non-phasic clusters (10000 iterations; the clusters’ proportion were maintained as found by the hierarchical clustering approach). Red line: Actual distance between cluster means for the two clusters identified by our hierarchical clustering approach using power in low (<1 Hz) and intermediate (1–4 Hz) frequency domains as features. Pink bars: Distribution of actual distances between cluster means obtained by our hierarchical clustering approach across all combinations of frequency parameters in E that yielded two significant classes.
Figure 4
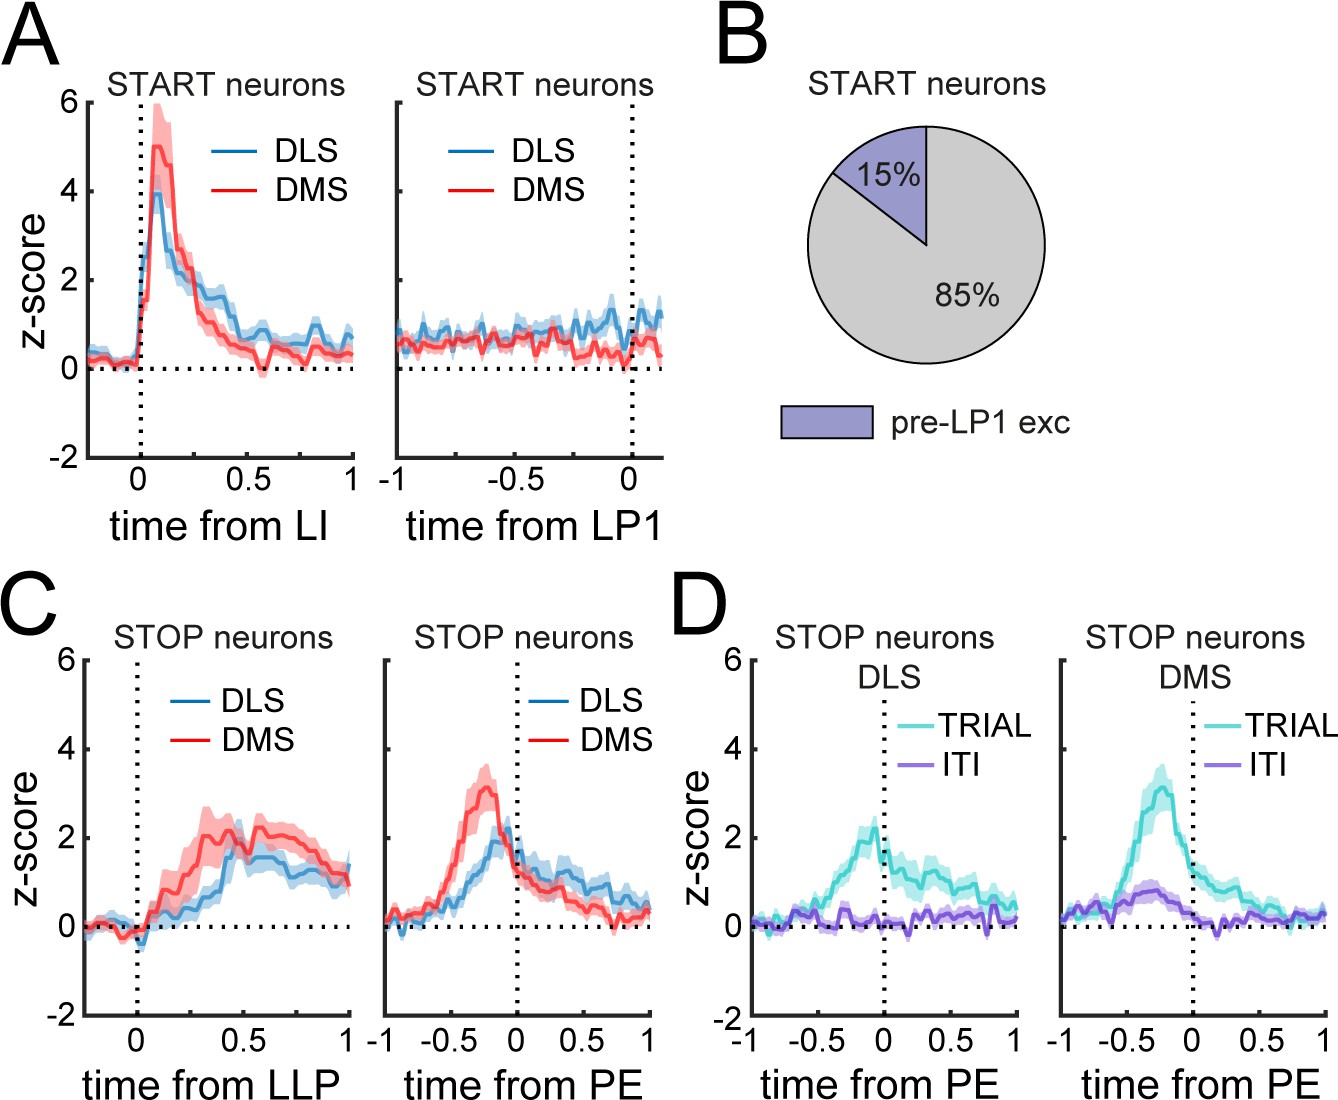
Phasic Start neurons do not encode the initiation of the sequence.
(A) Mean z-score (± SEM) around lever insertion (left, LI) and first lever press (right, LP1) in DMS and DLS Phasic Start neurons. (B) Proportion of Phasic Start neurons increasing spiking activity before the first lever press (pre-LP1 exc) compared to baseline. (C) Mean z-score (± SEM) aligned to the last lever press (left, LLP) and port entry (right, PE) in DMS and DLS Phasic Stop neurons. (D) Mean z-score (± SEM) aligned to port entry in DLS (left) and DMS (right) Phasic Stop neurons at the termination of rewarded trials (TRIAL) or during inter-trial intervals (ITI).
Figure 5

Hierarchical clustering on Non-phasic neurons during extended training.
(A) Heatmap of normalized activity of neurons identified as being Non-phasic (48/338 neurons in DLS and 65/410 in DMS) sorted by averaged activity during the behavioral sequence. (B) Hierarchical clustering on Non-phasic neurons: dendrogram (left) and proportion of DLS and DMS neurons in the INH and EXC classes (right). (C–D) Heatmaps (top) and average z-score (± SEM) (bottom) of Non-phasic INH neurons (C; 17/48 and 36/65) and Non-phasic EXC neurons (D; 31/48 and 29/65) separated by regions; neurons are sorted by averaged normalized activity during the behavioral sequence.
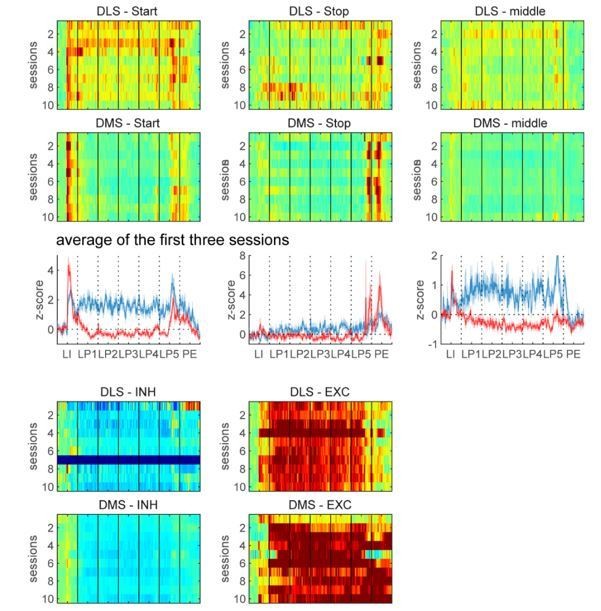
Figure 6 with 1 supplement
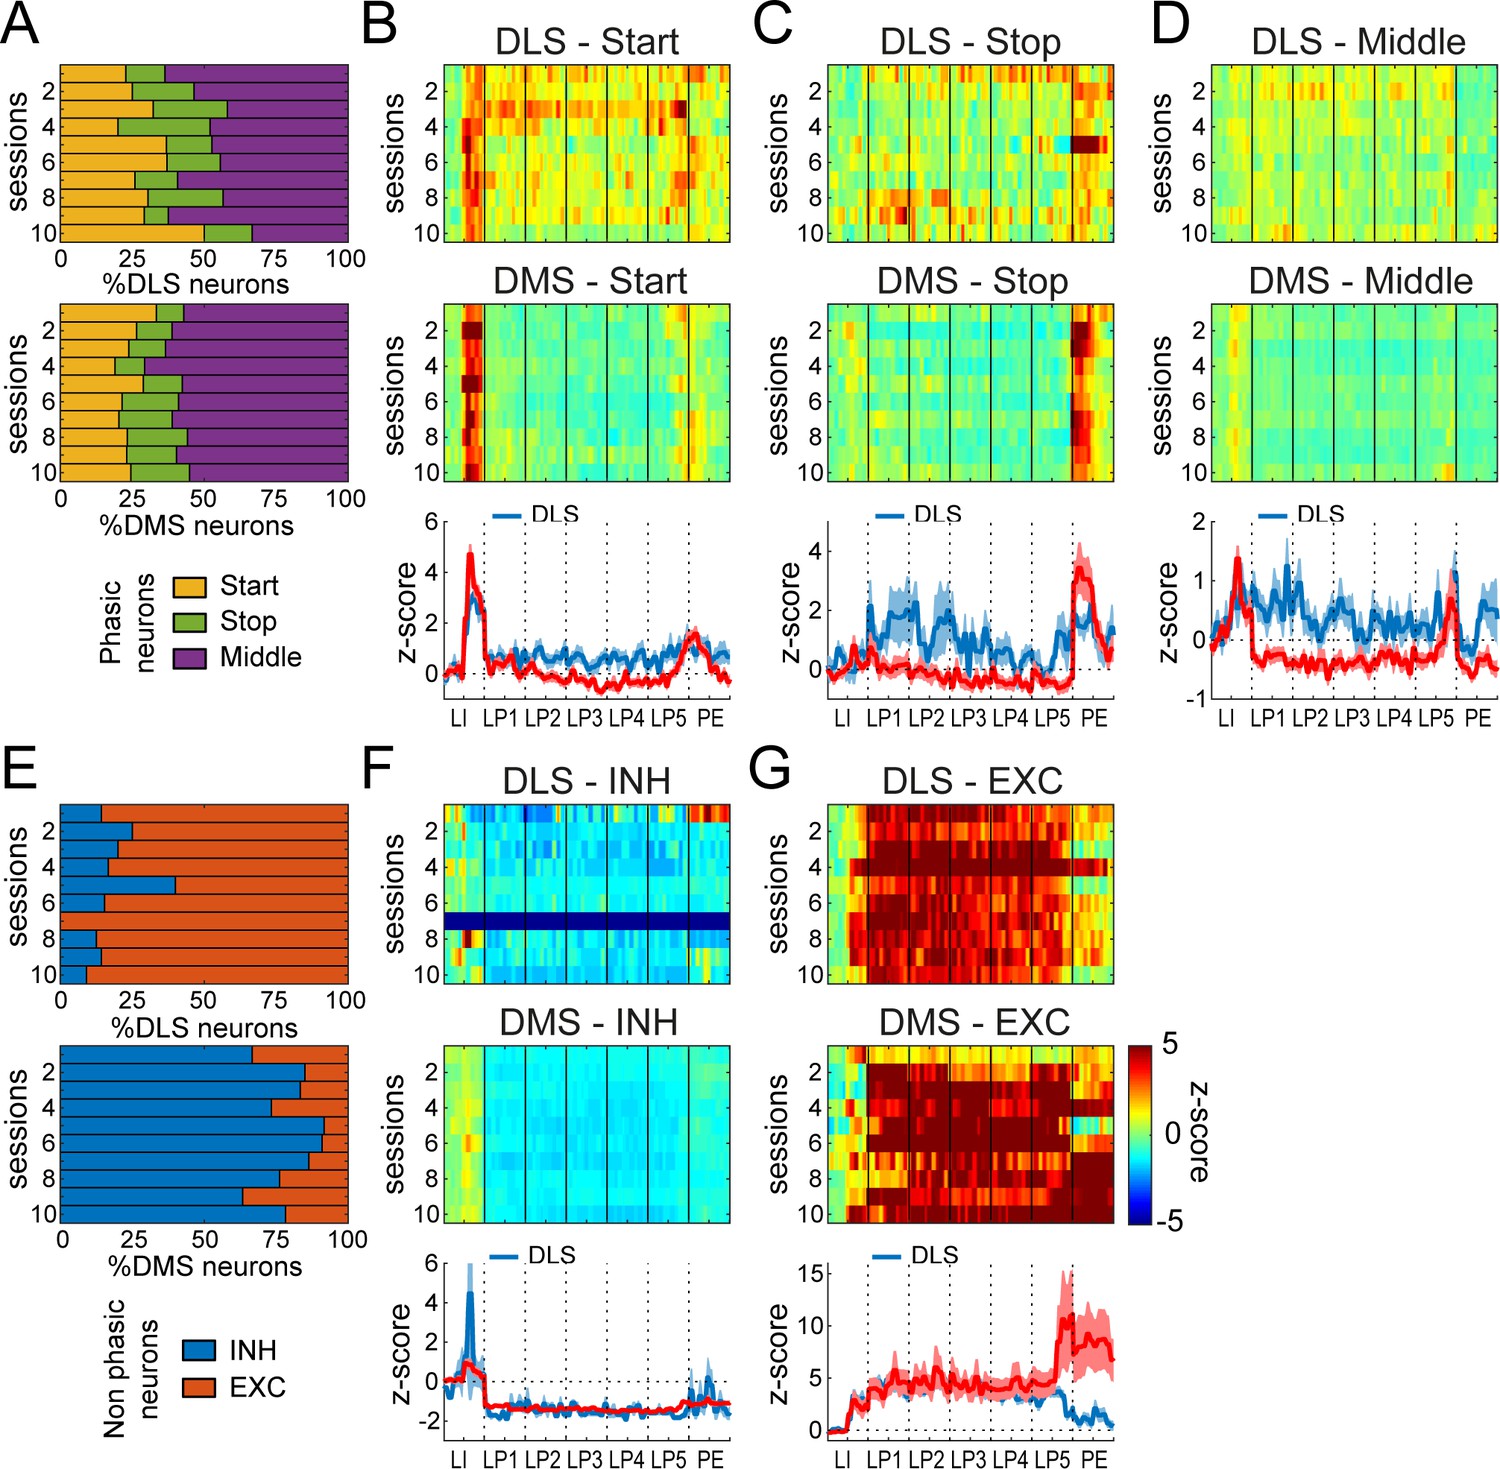
Differential neuronal responses in DMS and DLS during early training.
(A) Proportion of Phasic Start, Stop and Middle neurons across training sessions. (B–D) Heatmaps of ensemble activity of Start (B), Stop (C), and Middle (D) neurons across training sessions in DLS (top) and DMS (middle) and average z-score (± SEM) across the last three sessions in DLS and DMS neurons (bottom). (E) Proportion of INH and EXC neurons across training sessions in DLS (top) and DMS (bottom). (F–G) Heatmaps of ensemble activity of INH (F) and EXC (G) neurons across training sessions in DLS (top) and DMS (middle) and average z-score (± SEM) across the last three sessions in DLS and DMS neurons (bottom). The absence of INH neurons in DLS on session 7 (F) is illustrated with a gray bar throughout the sequence.
Figure 6—figure supplement 1
Fourier analysis and hierarchical clustering allowing separation of Phasic and Non-phasic neurons during early training.
(A) Scatter plot of normalized power in low (<1 Hz) and intermediate (1–4 Hz) frequency ranges illustrating the separation of Phasic neurons (orange circles), and Non-phasic neurons (green circles). (B) Proportion of Phasic and Non-phasic neurons across early training sessions in DLS (left) and DMS (right). (C–D) Heatmaps of neural activity of Phasic (C) and Non-phasic neurons (D).
Figure 7 with 1 supplement
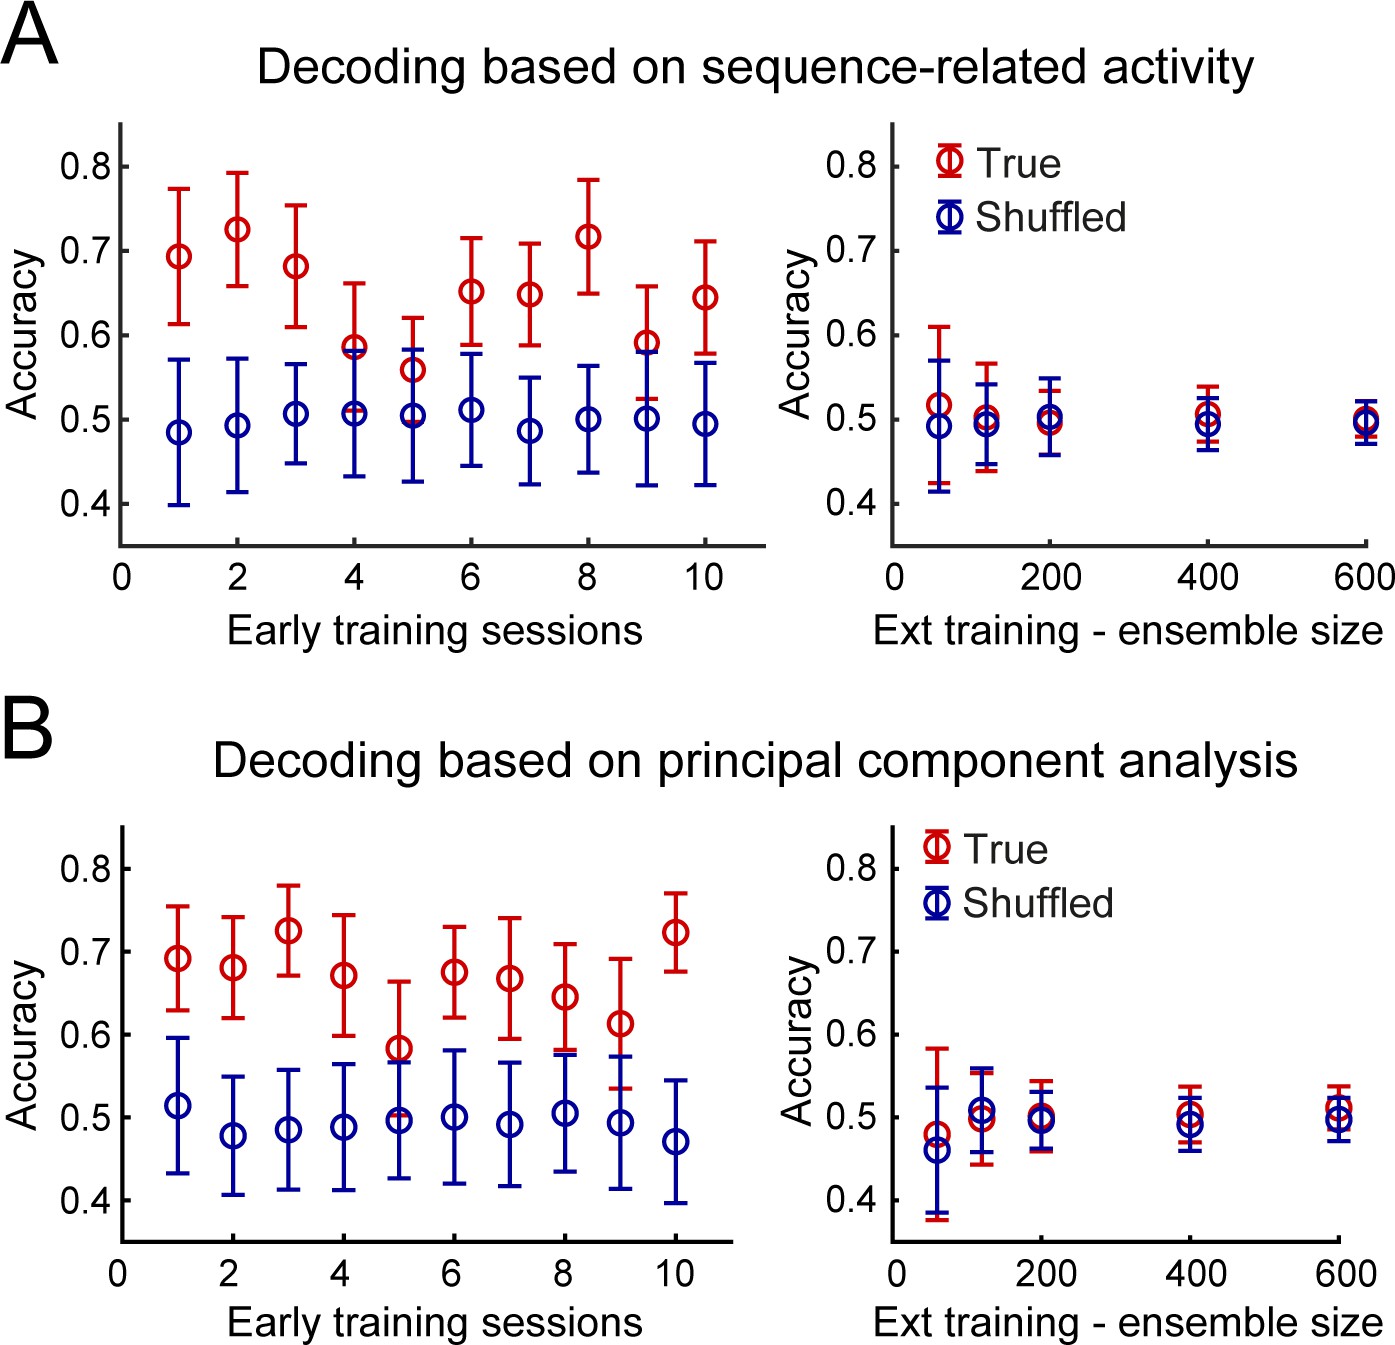
Accurate decoding of the dorsostriatal brain region identity in early training but not after extended training.
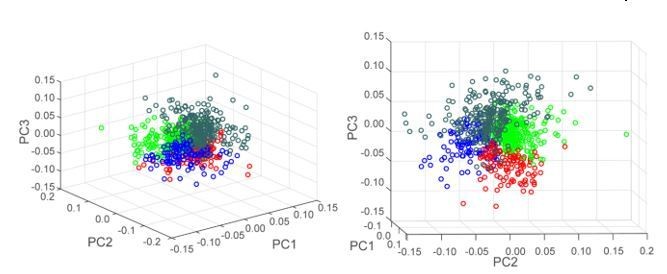
(A) Mean decoding accuracy (± standard deviation) of the dorsostriatal subregion identity, DLS or DMS, of individual neurons based on their sequence-related activity (True - red) is compared with the decoding accuracy expected from chance (Shuffled - dark blue) across early training sessions (left) or during extended training, as a function of ensemble size (right). (B) Decoding based on the first three principal components following principal component analysis. Average accuracy (± standard deviation) is presented as a function of early training sessions (left) or ensemble size during extended training (right).
Figure 7—figure supplement 1
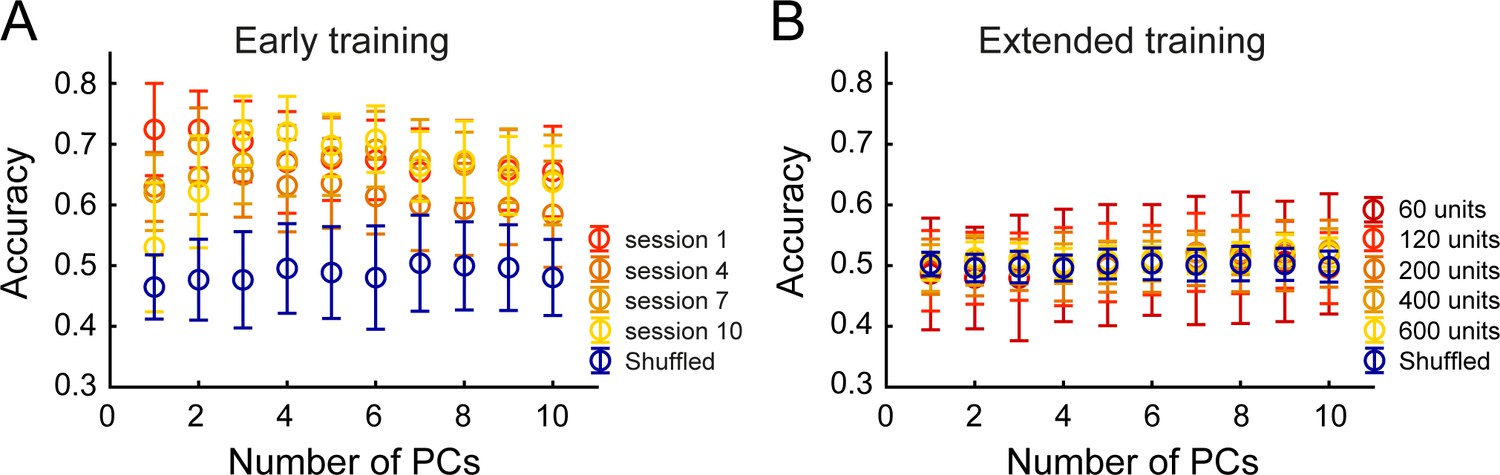
Principal Component Analysis (PCA) followed by Linear Discriminant Analysis (LDA) allows prediction of brain region identity in early training but not extended training.
(A) Decoding accuracy of brain region identity as a function of the number of principal components (PCs) included in the analysis, during four selected early training sessions. Mean accuracy (± s.d.) in each condition was compared to chance (blue – shuffled condition for session 10) (B) Decoding accuracy of brain region identity as a function of the number of principal components (PCs) included in the analysis, and across different ensemble sizes, during extended training. Mean accuracy (± standard deviation) in each condition was compared to chance (blue – shuffled condition for 600 units).
Figure 8 with 2 supplements
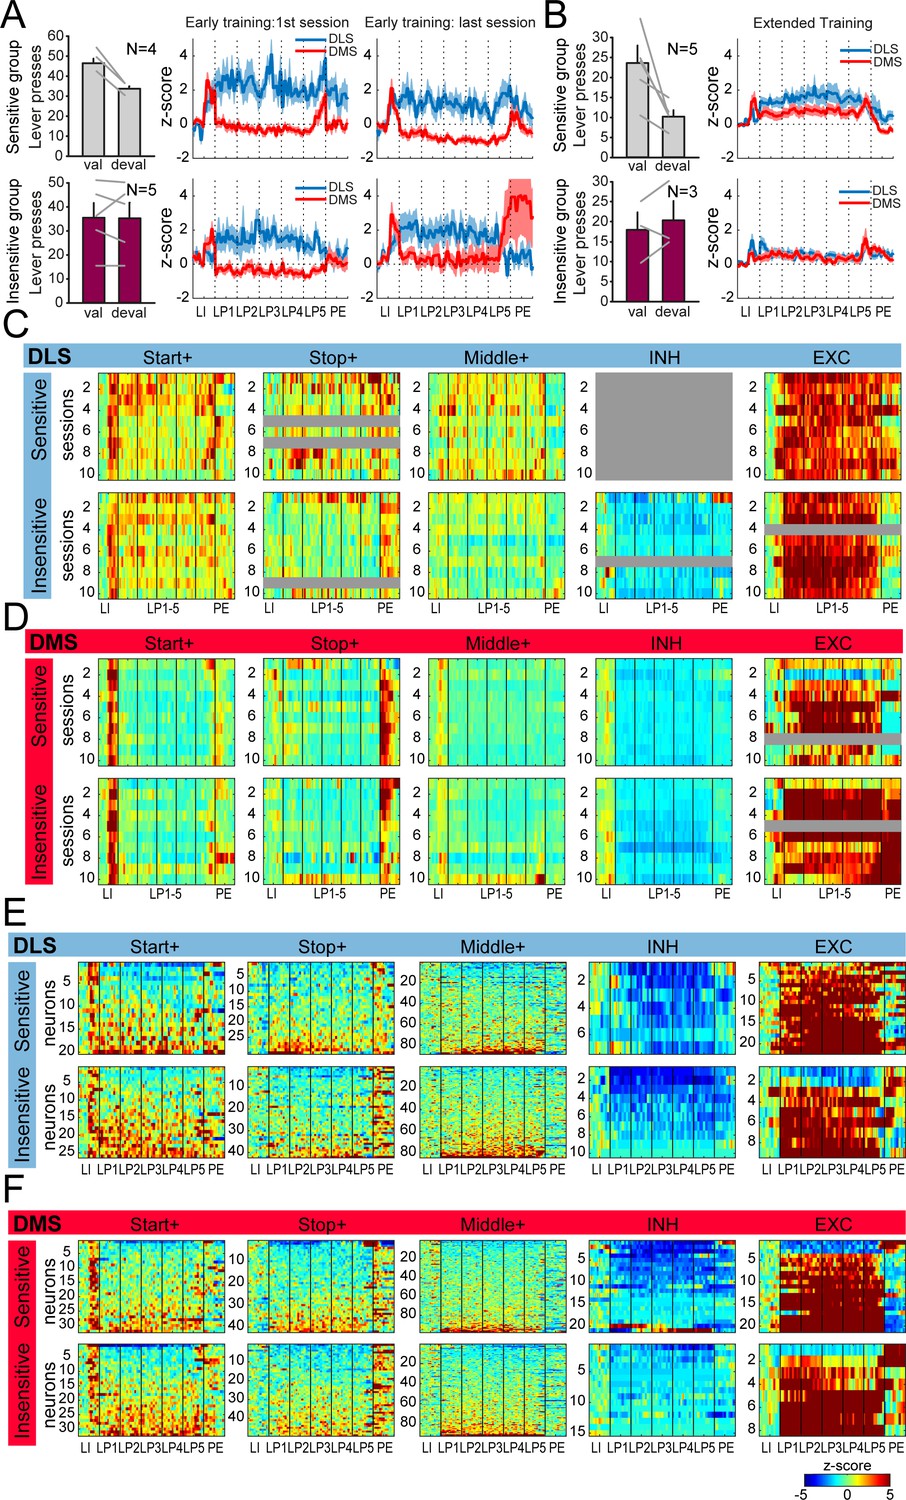
Similar dorsostriatal sequence-related activity in groups of rats differing in their sensitivity to satiety-induced devaluation.
(A) Number of lever presses in the valued (val) and devalued (deval) conditions in rats sensitive (devaluation ratio <0.45) (top) or insensitive (devaluation ratio >0.45) (bottom) to satiety induced devaluation after early training (left), and average z-score (± SEM) in DLS and DMS neurons during the first (middle) and last (right) early training sessions in these 2 subgroups of rats (top: sensitive group; bottom: insensitive group). (B) Number of lever presses in the valued (val) and devalued (deval) conditions in rats sensitive (devaluation ratio <0.45) (top) or insensitive (devaluation ratio >0.45) (bottom) to satiety induced devaluation after extended training (left), and average z-score (± SEM) in DLS and DMS neurons (right) in these 2 subgroups of rats (top: sensitive group; bottom: insensitive group). (C–D) Heatmaps of ensemble sequence-related activity in DLS (C) and DMS (D) across early training sessions, in each class of neuronal responses (from left to right) and as a function of sensitivity to outcome devaluation (top: sensitive group; bottom: insensitive group). (E–F) Heatmaps of sequence-related activity of DLS (E) and DMS neurons (F) during extended training, in each class of neuronal responses (from left to right) and as a function of sensitivity to outcome devaluation (top: sensitive group; bottom: insensitive group). The absence of neurons in some classes on a given early training session is illustrated with a gray bar throughout the sequence.
Figure 8—figure supplement 1

Distribution of DMS and DLS neural activity patterns in rats sensitive or insensitive to satiety induced devaluation.
(A–B) Distribution of DLS and DMS neurons in the five classes of neuronal response in sensitive and insensitive subgroups during early training (A) and extended training (B).
Figure 8—figure supplement 2
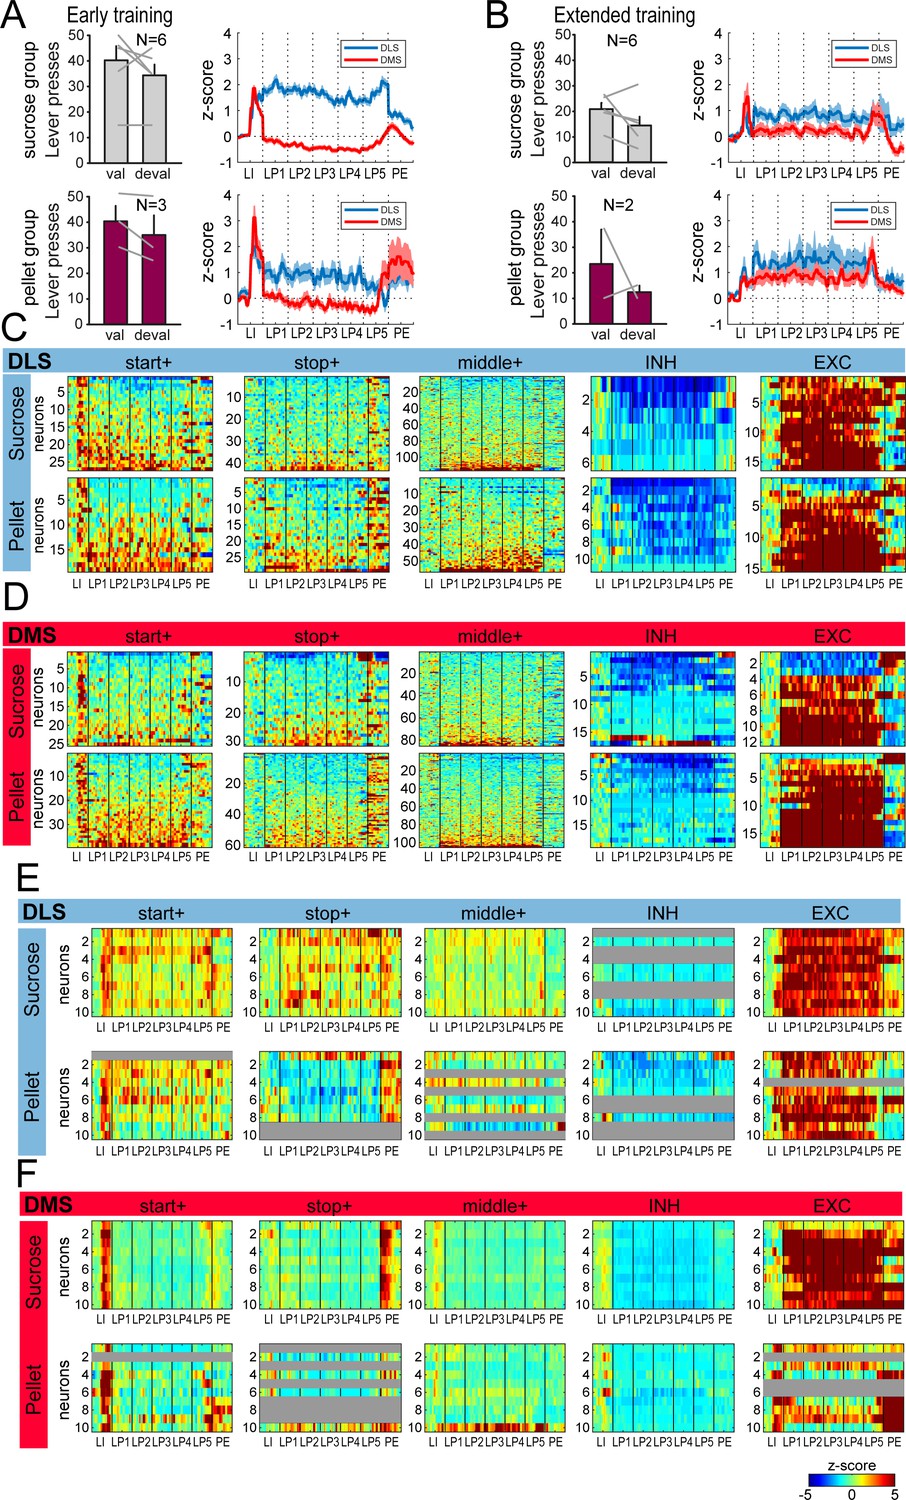
Similar behavior and dorsostriatal sequence-related activity in groups of rats trained with liquid sucrose and grain-based pellets.
(A) Number of lever presses in the valued (val) and devalued (deval) conditions in rats trained with sucrose (top: sucrose group) or grain-based pellets (bottom:pellet group) during satiety induced devaluation after early training (left), and average z-score (± SEM) in DLS and DMS neurons during the first (middle) and last (right) early training sessions in these 2 subgroups of rats (top: sucrose group; bottom: pellet group). (B) Number of lever presses in the valued (val) and devalued (deval) conditions in rats trained with sucrose (top) or grain-based pellets (bottom) during satiety induced devaluation after extended training (left), and average z-score (± SEM) in DLS and DMS neurons in these 2 subgroups of rats (right). (C–D) Heatmaps of sequence-related activity of DLS (C) and DMS neurons (D) during extended training, in each class of neuronal responses (from left to right) and as a function of training reward (top: sucrose; bottom: pellet). (E–F) Heatmaps of ensemble sequence-related activity in DLS (E) and DMS (F) across early training sessions, in each class of neuronal responses (from left to right) and as a function of training reward (top: sucrose; bottom: pellet). The absence of neurons in some classes on a given early training session is illustrated with a gray bar throughout the sequence.
Figure 9
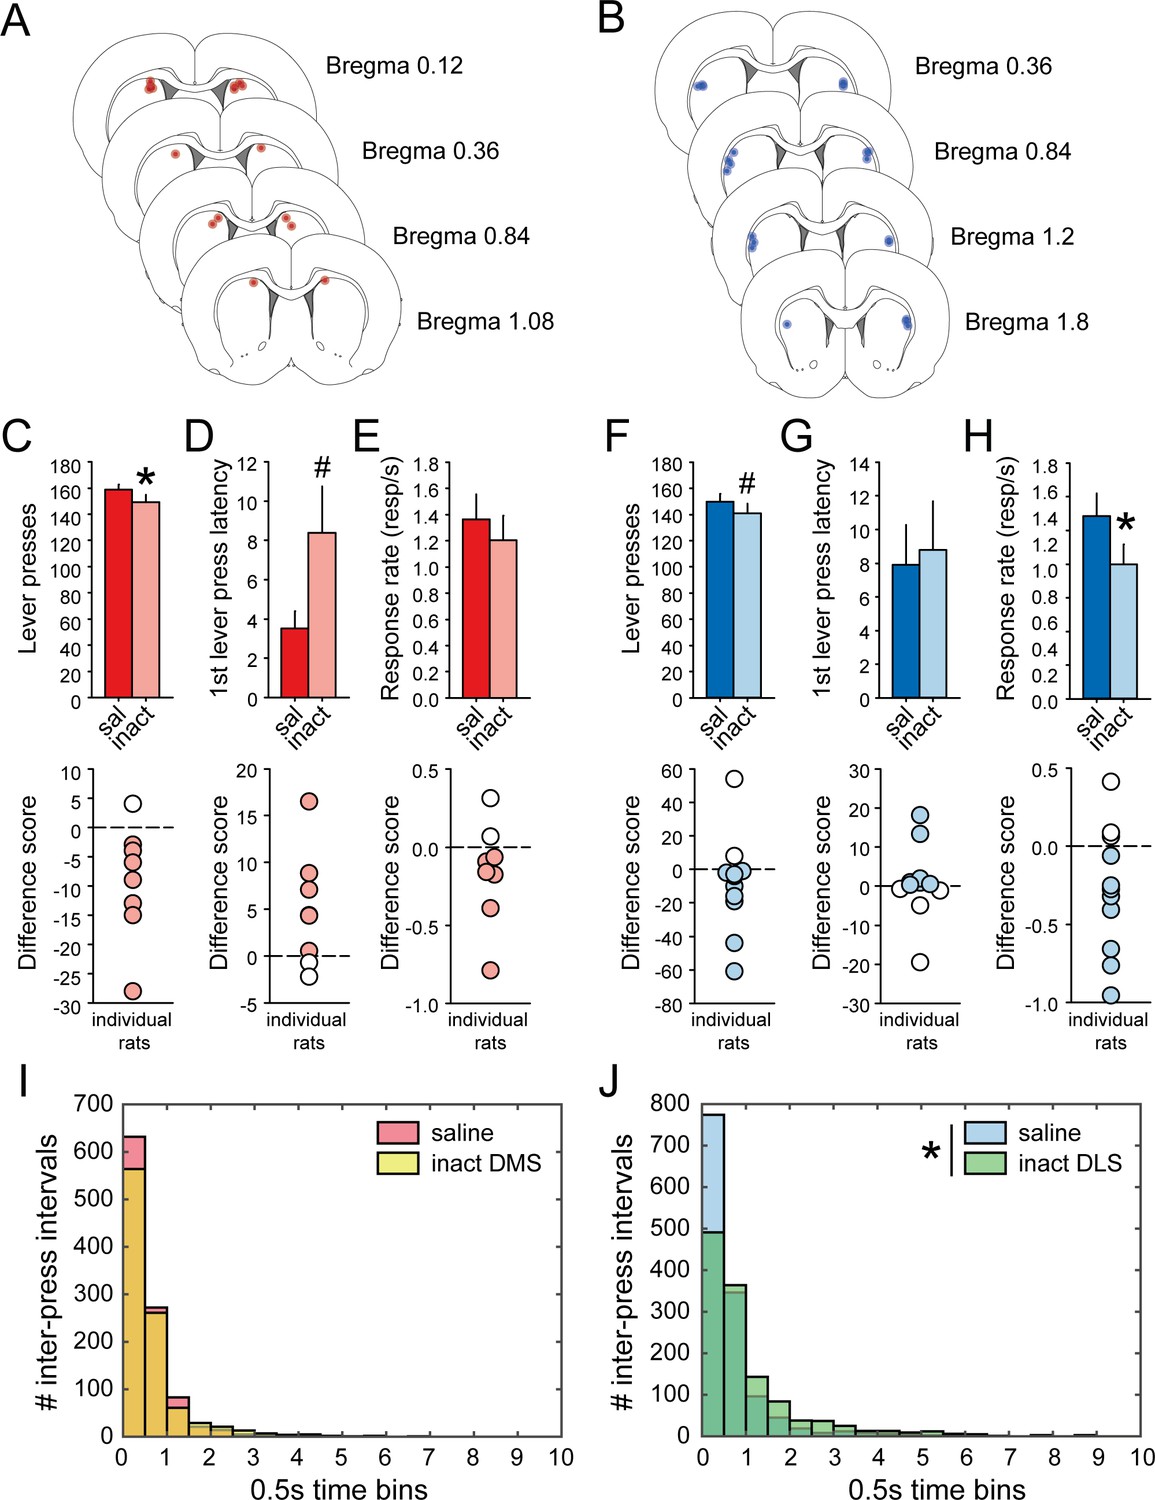
Pharmacological inactivation of DMS and DLS disrupts task-performance.
(A–B) Schematic representation of cannula placements in DMS (A) or DLS (B). (C–E) Mean number of lever presses (± SEM) (C) mean first lever press latency in seconds (± SEM) (D) and mean response rate (± SEM) (E) after infusion of saline or muscimol/baclofen in the DMS (top) and difference scores (inactivation – saline) of individual rats (bottom). (F–H) Mean number of lever presses (± SEM) (F), mean first lever press latency in seconds (± SEM) (G), and mean response rate (± SEM) (H) after infusion of saline or muscimol/baclofen in the DLS (top) and difference scores (inactivation – saline) of individual rats (bottom). (I–J) Distribution of inter-press intervals after infusion of saline (DMS, red; DLS, blue) or muscimol/baclofen (DMS, yellow; DLS, green) in the DMS (I) or in the DLS (J).
Figure 10 with 4 supplements

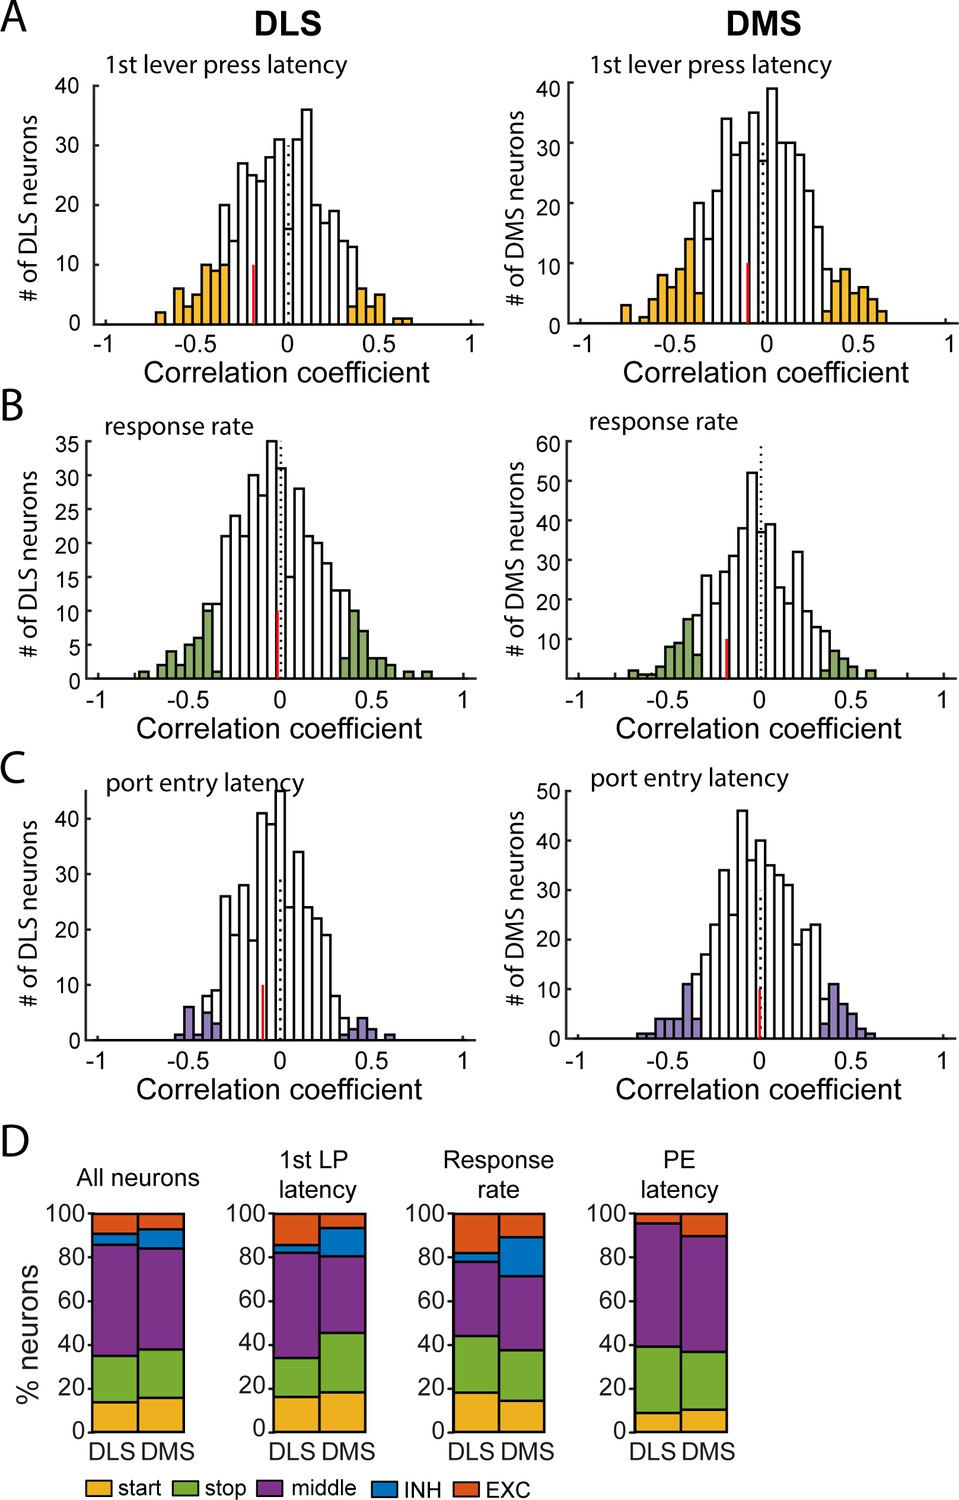
DLS and DMS neural activity correlates with over-trained task-performance during extended training.
(A) Left: Distribution of Spearman rank correlation coefficients relating firing rate after the lever insertion (0–500 ms) to the first lever press latency on a trial by trial basis. Example of neurons with a negative (middle) or positive correlation (right) between firing rate and latency. (B) Left: Distribution of Spearman rank correlation coefficients relating firing rate during the sequence (from first to last lever press) to the response rate on a trial by trial basis. Example of neurons with a negative (middle) or positive correlation (right) between firing rate and response rate. (C) Left: Distribution of Spearman rank correlation coefficients relating firing rate after the lever retraction (0–500 ms) to the port entry latency on a trial by trial basis. Example of neurons with a negative (middle) or positive correlation (right) between firing rate and port entry latency. Red lines on correlation coefficient histograms indicate the coefficient median of units significantly correlated. (D) Venn diagram illustrating the number of units with significant correlation between firing rate and 1st lever press latency (yellow), response rate (green) and port entry latency (blue). (E) Proportion of neurons in DMS and DLS expressing correlation with the 1st lever press latency (left), the response rate (middle), and the port entry latency (right).
Figure 10—figure supplement 1
Comparison of correlations relating neural firing rate and behavior in DMS and DLS.
(A) Distribution of Spearman rank correlation coefficients relating firing rate after lever insertion (0–500 ms) to the first lever press latency, in DLS (left) and DMS (right) neurons. (B) Distribution of Spearman rank correlation coefficients relating firing rate during lever presses to the response rate in DLS (left) and DMS (right) neurons. (C) Distribution of Spearman rank correlation coefficients relating firing rate after lever retraction (0–500 ms) to the port entry latency in DLS (left) and DMS (right) neurons. In each graph, the vertical red line indicates the median correlation coefficient of correlated units. (D) Proportion of neurons per class in DMS and DLS in the whole population of recorded neurons (left), and in populations of neurons correlated with the 1st lever press latency (middle left), the response rate (middle right), and the port entry latency (right).
Figure 10—figure supplement 2
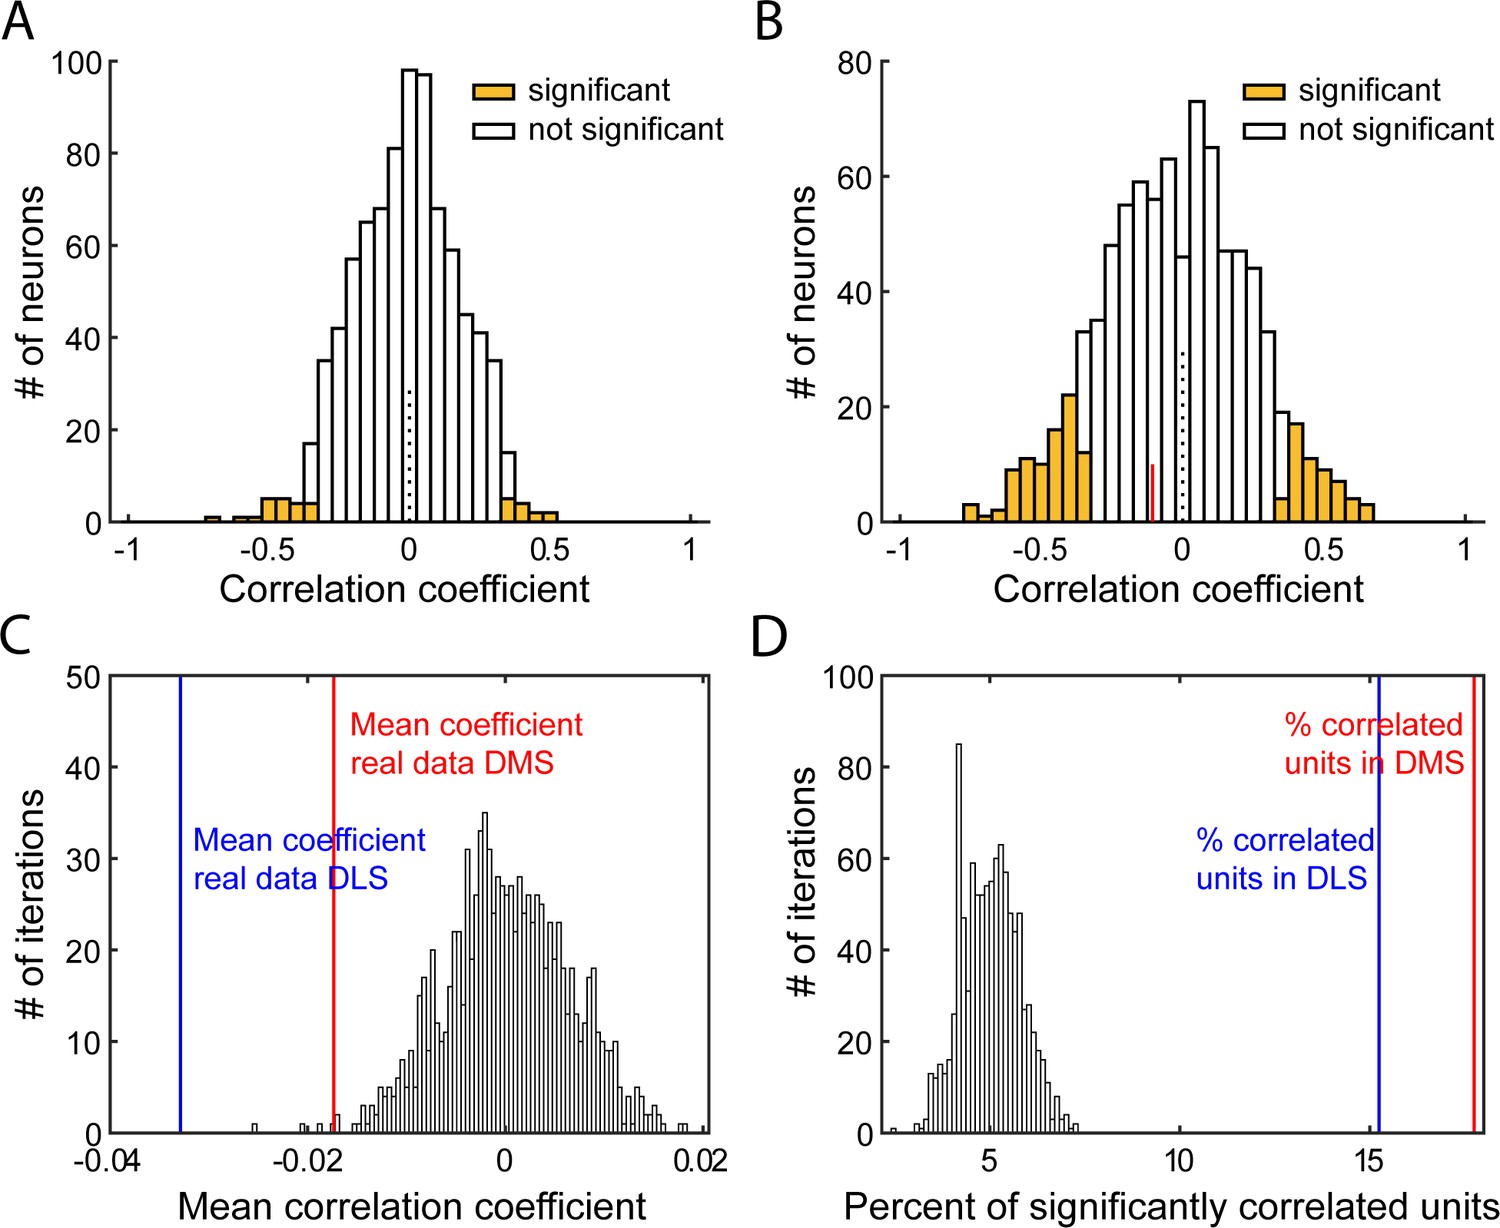
Characterization of correlations relating firing rate post-lever insertion and 1st lever press latency.
(A–B) Distribution of Spearman rank correlation coefficients from 1 iteration of the shuffled data (A) or from the real data (B), relating shuffled (A) or non-shuffled (B) firing in response to the lever insertion st–500 ms after lever insertion) to the animal’s latency to press the lever on a trial-by-trial basis. Bars shaded show significant correlations. In B, the red line indicates the median correlation coefficient of the correlated neurons. (C–D). Distribution of mean Spearman correlation coefficients (C) and percentage of significantly correlated units (D) from 1000 shuffled iterations of firing rate post lever insertion and the first lever press latency, on a trial-by-trial basis. On both graphs, vertical lines indicates values from real data in DLS (blue) or DMS (red).
Figure 10—figure supplement 3

Characterization of correlations relating within-sequence firing rate and response rate.
(A–B) Distribution of Spearman rank correlation coefficients from 1 iteration of the shuffled data (A) or from the real data (B), relating shuffled (A) or non-shuffled (B) within-sequence firing rate (from 1st to last lever press) to the animal’s response rate on a trial-by-trial basis. Bars shaded show significant correlations. In B, the red line indicates the median correlation coefficient of the correlated neurons. (C–D). Distribution of mean Spearman correlation coefficients (C) and percentage of significantly correlated units (D) from 1000 shuffled iterations of within-sequence firing rate and response rate, on a trial-by-trial basis. On both graphs, vertical lines indicates values from real data in DLS (blue) or DMS (red).
Figure 10—figure supplement 4
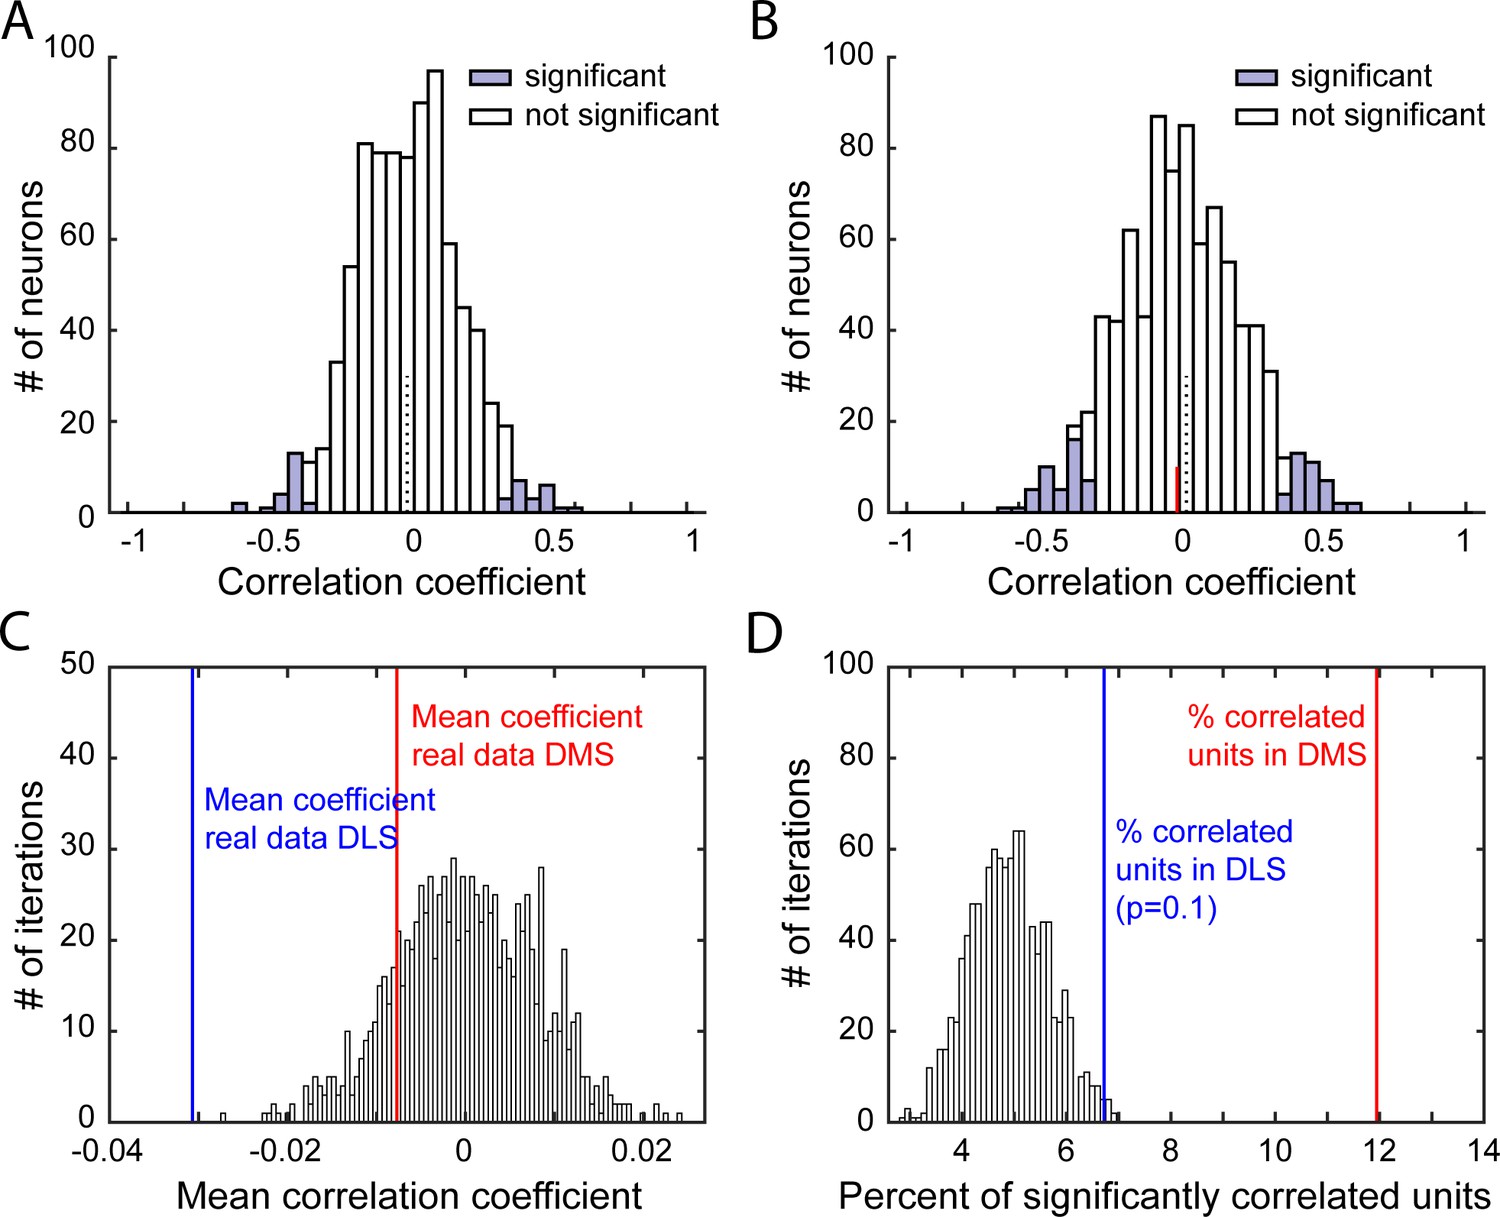
Characterization of correlations relating firing rate post-lever retraction and port entry latency.
(A–B) Distribution of Spearman rank correlation coefficients from 1 iteration of the shuffled data (A) or from the real data (B), relating shuffled (A) or non-shuffled (B) firing in response to the lever retraction (0–500 ms after lever retraction) and the animal’s latency to enter the port on a trial-by-trial basis. Bars shaded show significant correlations. In B, the red line indicates the median correlation coefficient of the correlated neurons. (C–D) Distribution of mean Spearman correlation coefficients (C) and percentage of significantly correlated units (D) from 1000 shuffled iterations of firing rate post lever retraction and the port entry latency, on a trial-by-trial basis. On both graphs, vertical lines indicates values from real data in DLS (blue) or DMS (red).
Author response image 1
Author response image 2
Author response image 3

Author response image 4
Author response image 5
Author response image 6
Author response image 7

Author response image 8

Author response image 9
Author response image 10

Additional files
-
Transparent reporting form
- https://doi.org/10.7554/eLife.49536.023
Download links
A two-part list of links to download the article, or parts of the article, in various formats.
Downloads (link to download the article as PDF)
Open citations (links to open the citations from this article in various online reference manager services)
Cite this article (links to download the citations from this article in formats compatible with various reference manager tools)
Distinct recruitment of dorsomedial and dorsolateral striatum erodes with extended training
eLife 8:e49536.
https://doi.org/10.7554/eLife.49536


