Origin of the mechanism of phenotypic plasticity in satyrid butterfly eyespots
- National University of Singapore, Singapore
- University of Arizona, United States
- Duke University, United States
- Yale-NUS College, Singapore
Figures
Figure 1 with 4 supplements

Eyespot/spot size plasticity is widespread across butterfly lineages but the response to rearing temperature has different norms of reaction across species.
(A) Size of hindwing ventral Cu1 eyespots (arrowheads). Thirteen species of butterflies were reared at two different rearing temperatures. Eyespot size corrected for wing size is plotted for two different temperatures (low temperature 17°C or 20°C is marked with blue symbols, while high temperature of 27°C or 30°C is marked with red symbols). Error bars represent 95% CI of means. (B) Mapping origins of eyespot size plasticity via maximum parsimony phylogenetic analysis suggests three independent origins for two different patterns of plasticity in the lineage with eyespots (eyespot size decreases with increasing temperatures: red lineages, and eyespot size increases with increasing temperature: blue lineage). The lineage leading to Satyrid butterflies gained a positive response to plasticity (blue arrowhead), whereas most other Nymphalids had either no response, or limited negative plasticity response (red arrowhead).
-
Figure 1—source data 1
Supporting details for Figure 1.
Table S1 - Species reared for comparative morphometrics, gene expression and hormonal measurements. Table S2 - F statistics, p-values from analysis of covariance for differences in Cu1 eyespot size between rearing temperatures (fixed factor) and assigned character state for phylogenetic analysis.
- https://cdn.elifesciences.org/articles/49544/elife-49544-fig1-data1-v1.docx
Figure 1—figure supplement 1
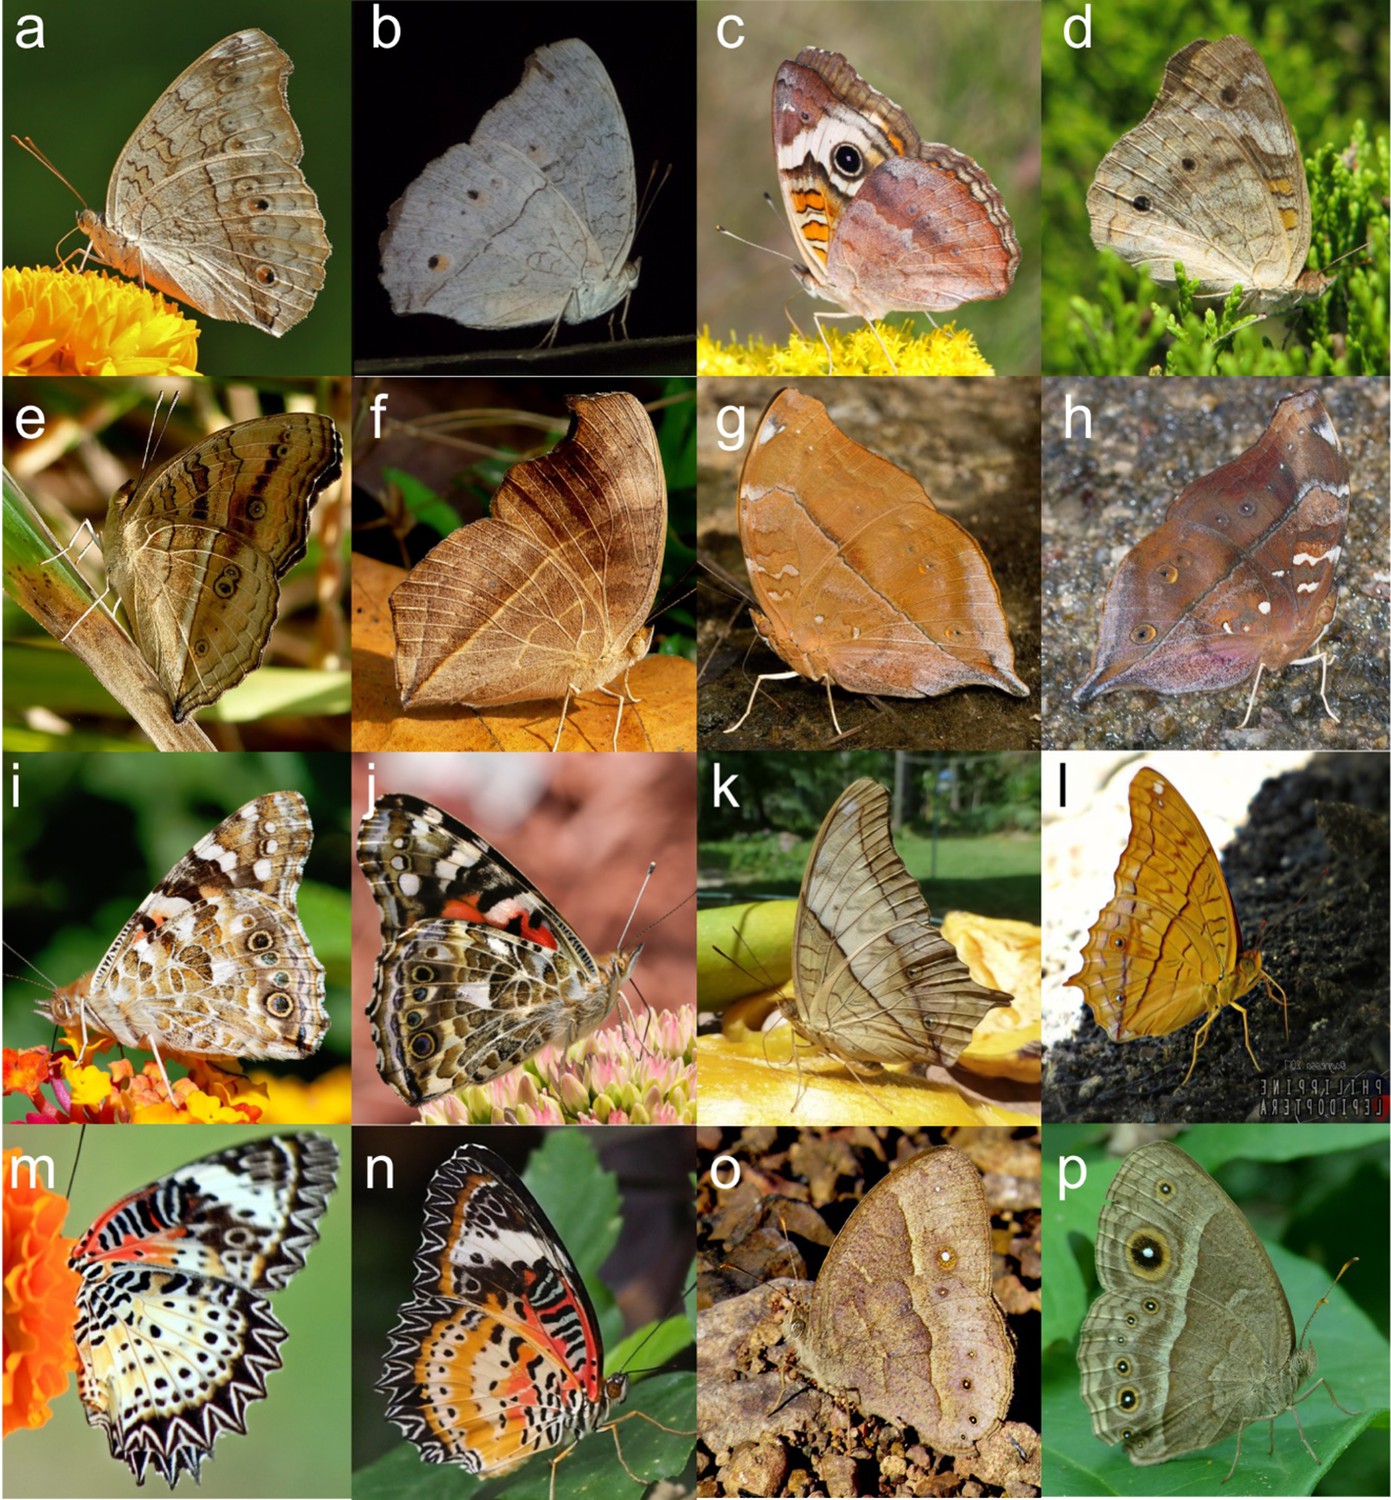
Phenotypic plasticity in wing patterns is observed across a wide variety of species in wild.
Figure 1—figure supplement 2
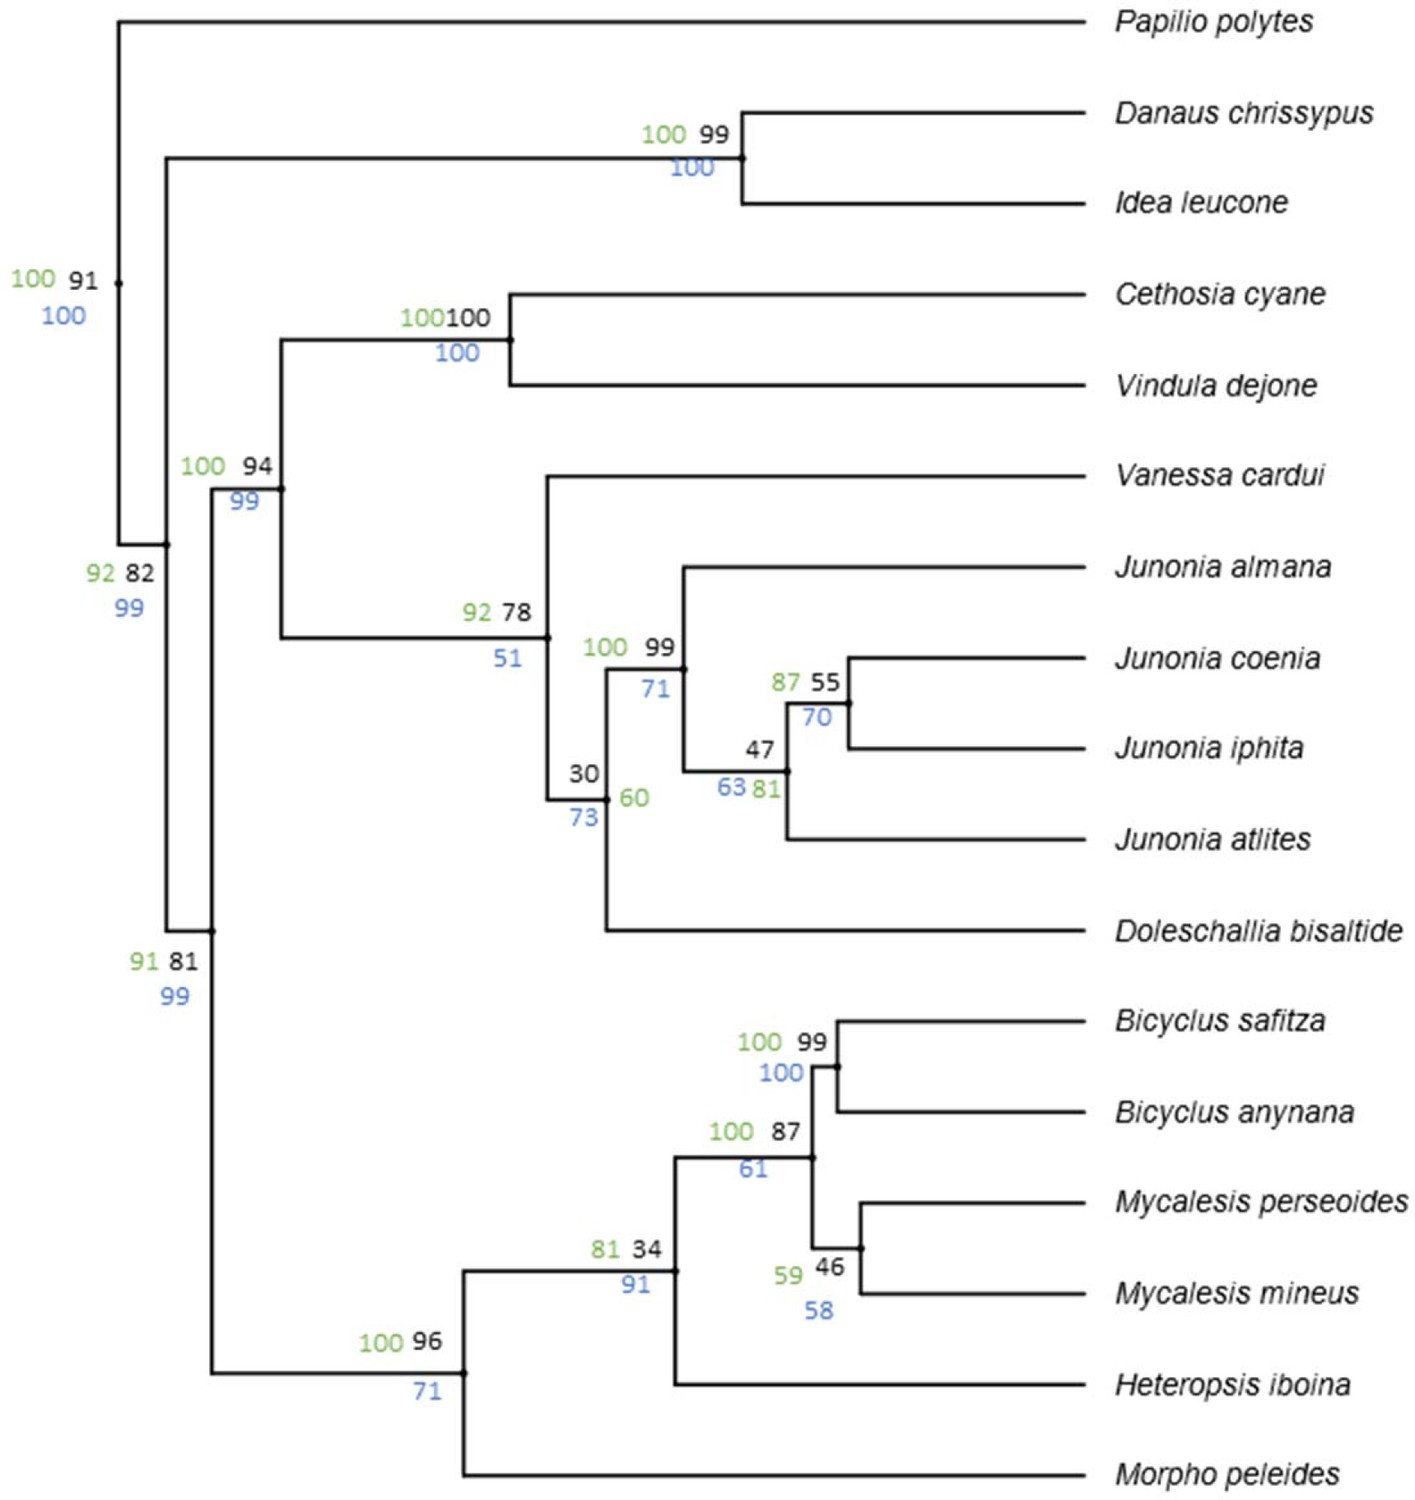
Data from Wahlberg et al. (2009) show high support value for the basal nodes across different analysis methods.
Figure 1—figure supplement 3

Ancestral state reconstruction using maximum likelihood models suggest that positive directionality of plasticity is a derived trait in Satyrid butterflies.
Ancestral states are significantly positive (blue outline), significantly negative (red outline), or not significantly different from zero (gray outline).
Figure 1—figure supplement 4
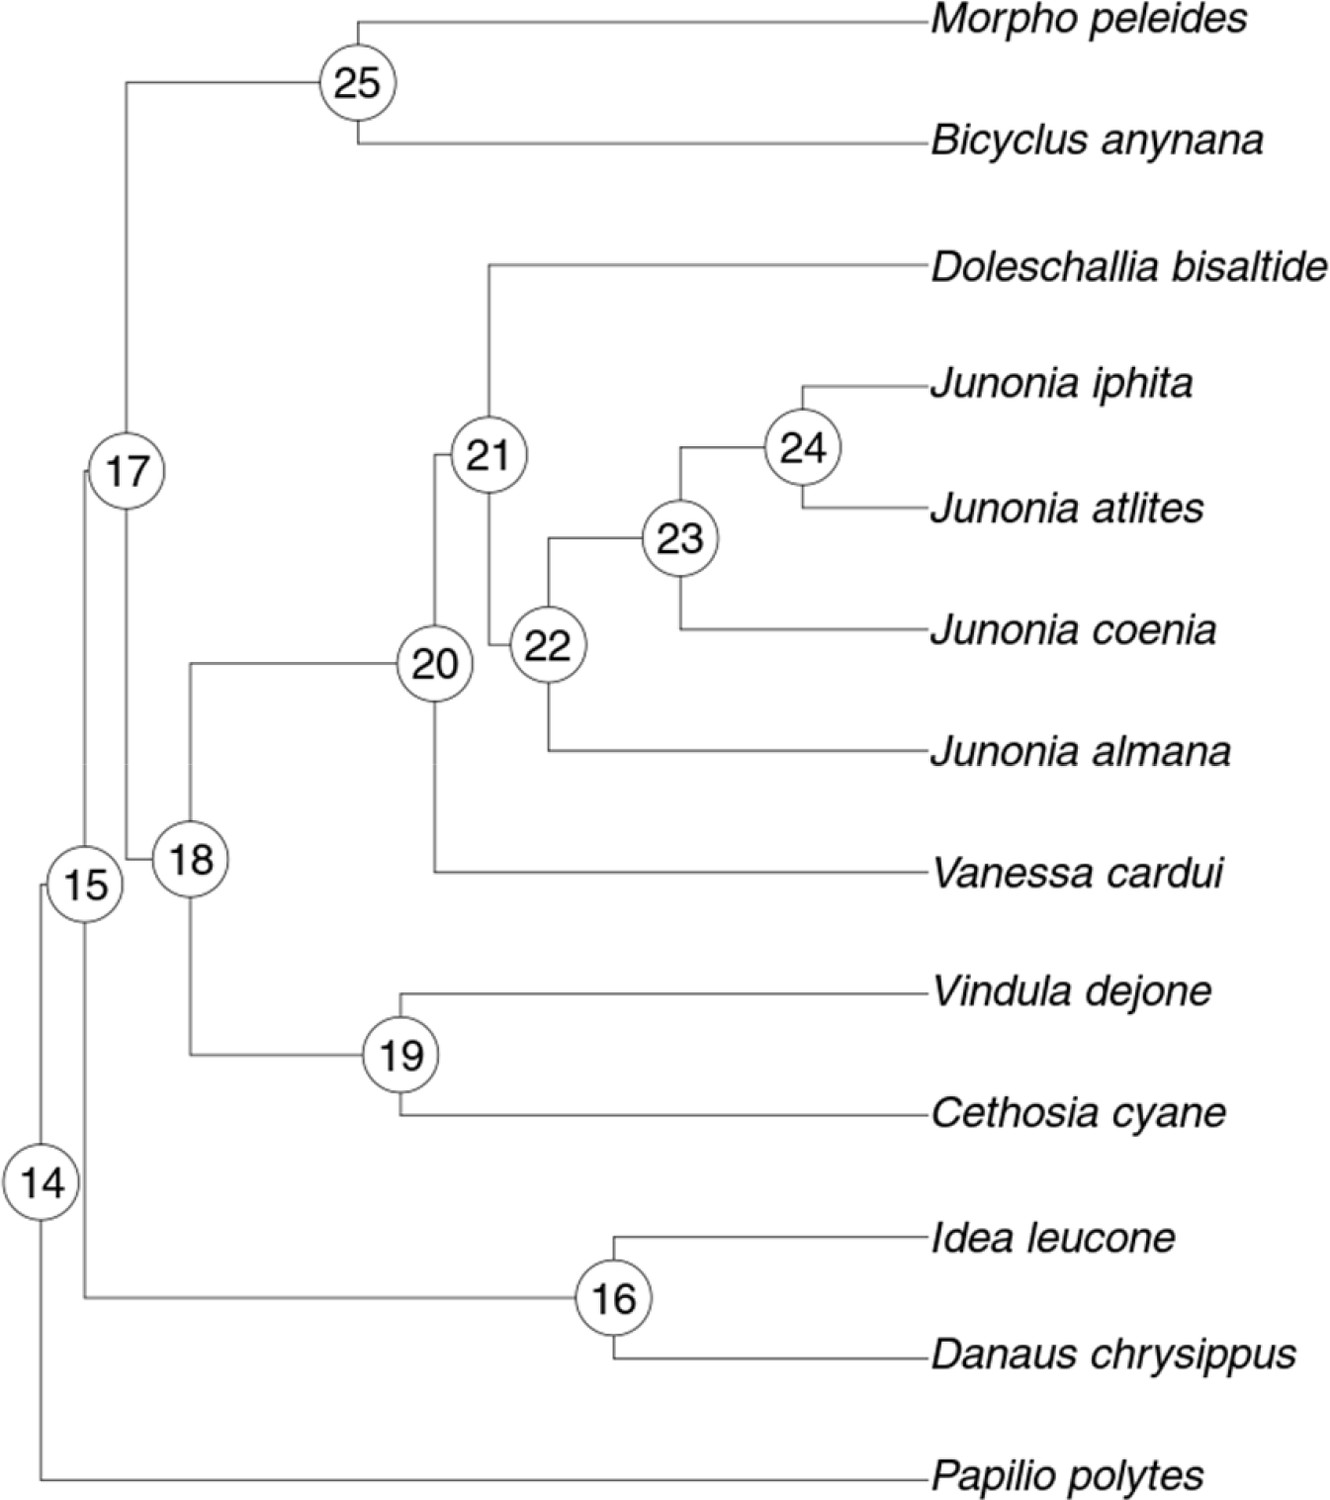
Tree used for ancestral state hypotheses tests.
See text and Figure 4—source data 1 for explanation of node numbers.
Figure 2 with 2 supplements
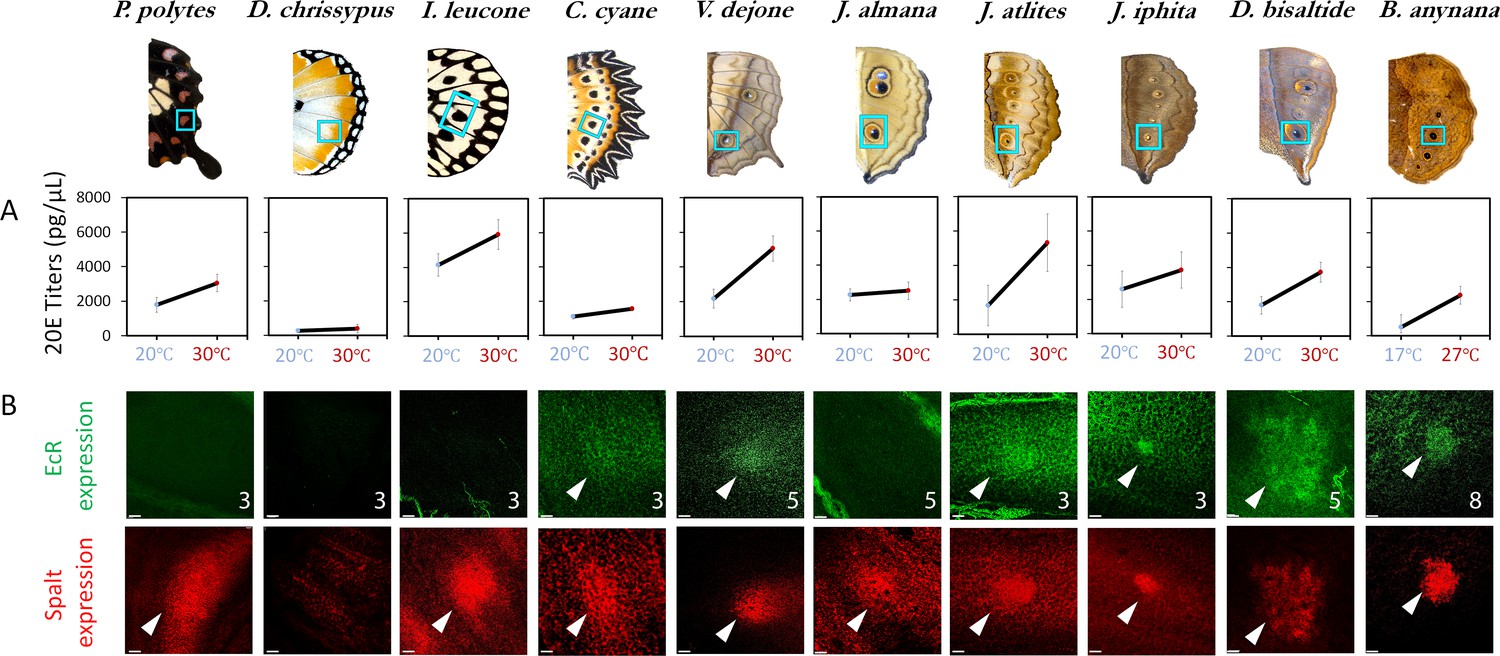
20E titers increase with rearing temperature across most species but EcR expression is only found in a subset of nymphalids with eyespots.
(A) 20E titers increase with an increase in rearing temperature across most species. This trait is ancestral in nature, with a likely origin before the origin of eyespots. (B) EcR is absent in simple spots, but present in the future eyespot centers of most of the species investigated (N ≥ 3 for each immunostaining: numbers in superscript represent sample size; Scale bars,10µm).
-
Figure 2—source data 1
F statistics, p-values from analysis of covariance for differences in 20E hormone titers between rearing temperatures (fixed factor) and assigned character states for phylogenetic analysis.
- https://cdn.elifesciences.org/articles/49544/elife-49544-fig2-data1-v1.docx
Figure 2—figure supplement 1
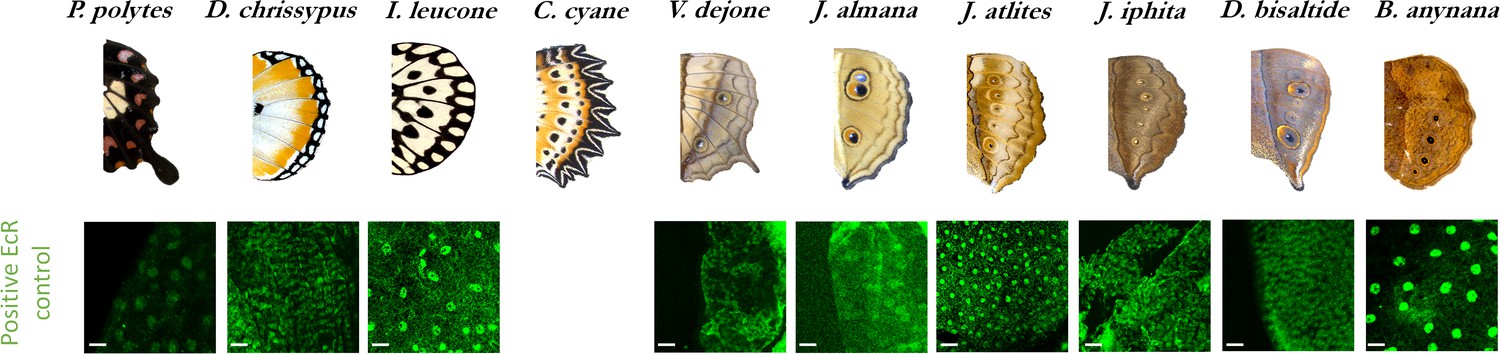
EcR expression as a positive control in peripodial membrane nuclei acrossspecies.
(N ≥ 3 for each species, Scale bars, 10µm).
Figure 2—figure supplement 2
20E titers increase with increasing temperatures as an ancestral trait, present at the basal node of Nymphalids and outgroups.
All ancestral states are not significantly different from zero (gray outline).
Figure 3
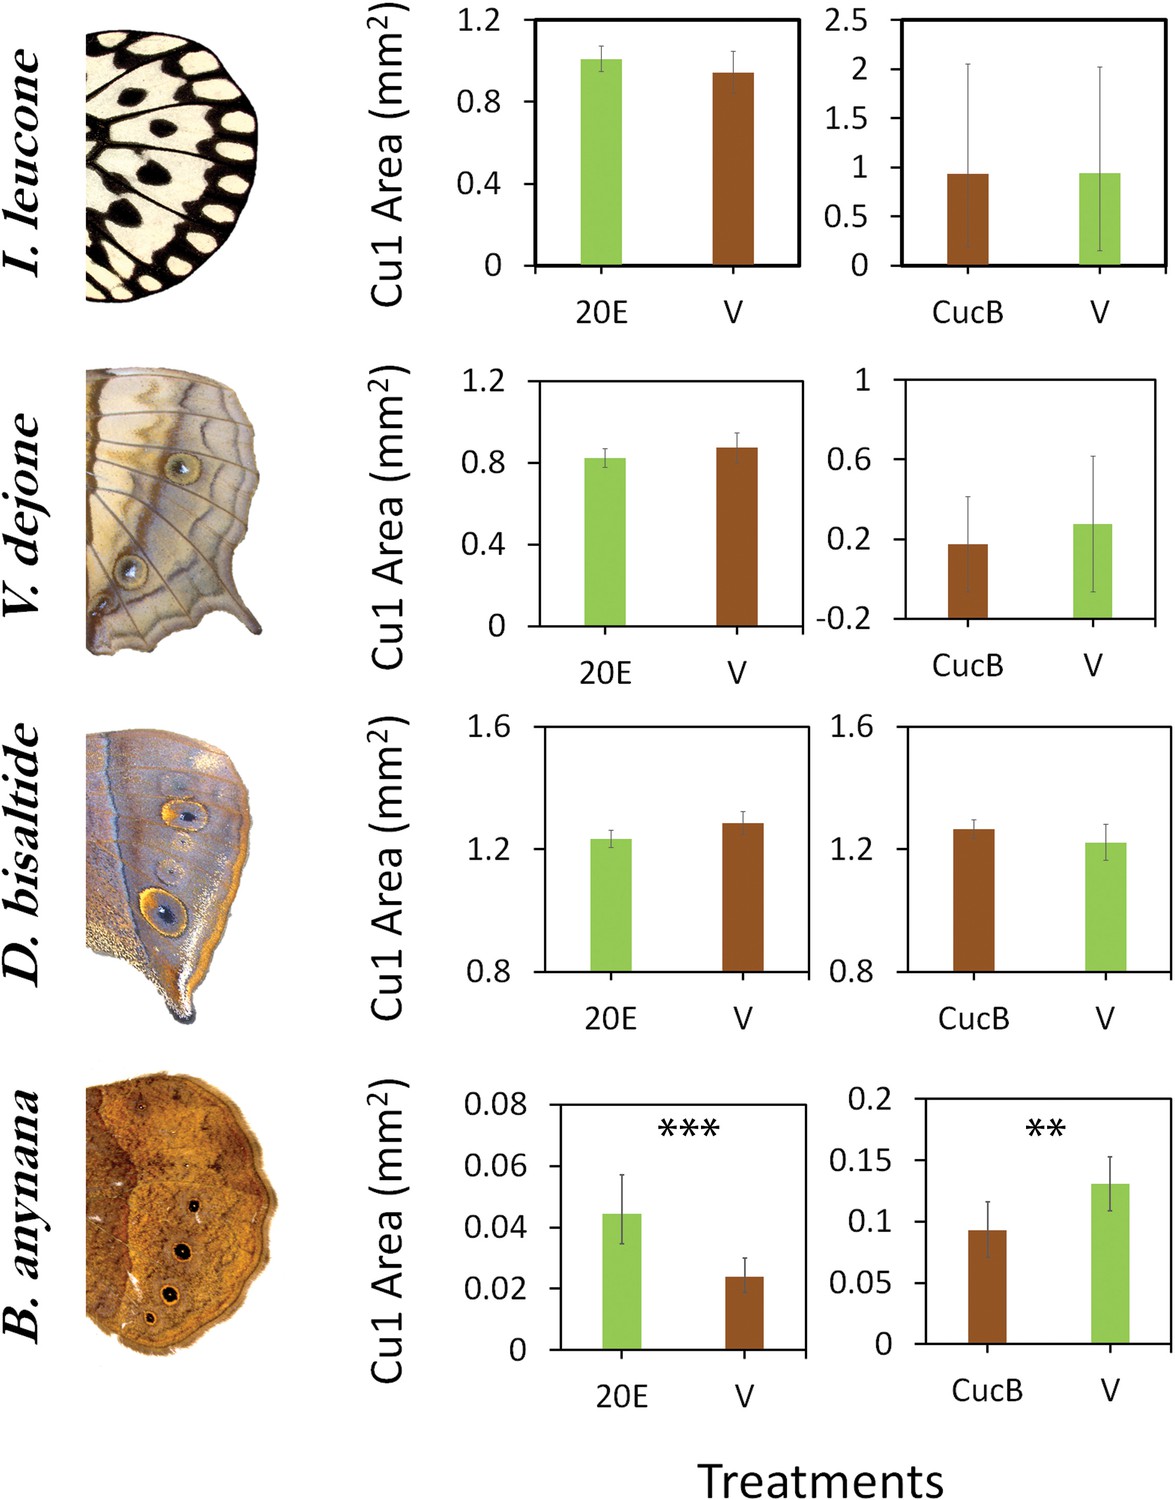
Sensitivity of eyespots to EcR-mediated signaling evolved in the lineage leading to B. anynana butterflies.
Four species of butterflies were injected with 20E hormones or EcR antagonists (CucB) during the wandering (Wr) stage. Control larvae were injected with an equal volume solution of saline vehicle (V). While Idea leuconoe, Vindula dejone and Doleschallia bisaltide are not sensitive to either of the hormone signal manipulations, B. anynana shows sensitivity towards both 20E and CucB. Error bars represent 95% CI of means. Significant differences between treatments are represented by asterisks: **, p<0.01, ***, p<0.001.
-
Figure 3—source data 1
Mean body weight of wandering larvae, hemolymph volume and natural 20E titers at two different rearing temperatures; 20E and CucB injection volume.
- https://cdn.elifesciences.org/articles/49544/elife-49544-fig3-data1-v1.docx
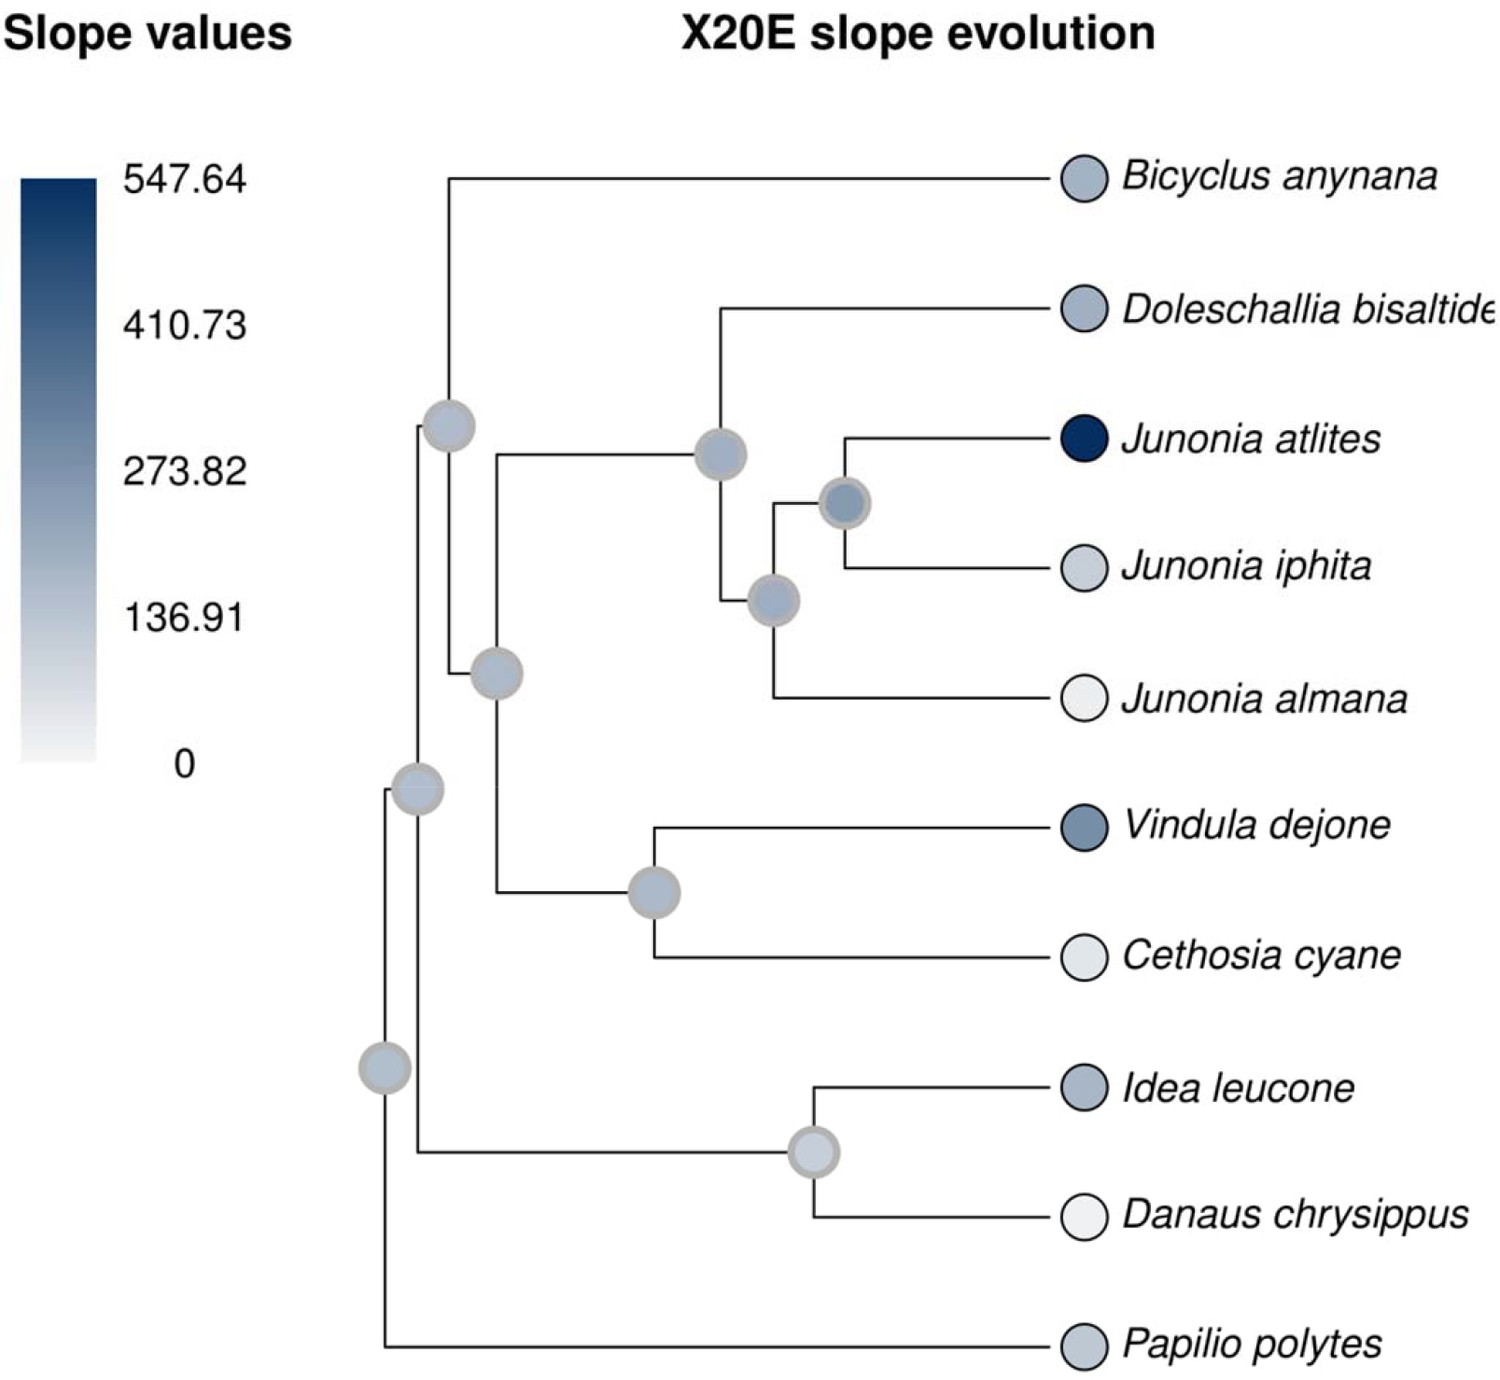
Figure 4

Phenotypic plasticity as a complex trait evolved gradually.
Phylogenetic analysis suggests three independent origins for two different patterns of eyespot size plasticity (eyespot size decreases with increasing temperatures: red lineages and red circles, and eyespot size increases with increasing temperature: blue lineage and blue circles). Empty circles represent a lack of plastic response. Green circles (character state 1) represent high 20E titers with increasing temperature, while white circles (character state 0) represent no significant difference in titers at two developmental temperatures. Green squares represent presence of EcR in eyespots, while white squares represent its absence. EcR expression in eyespots is inferred to have originated concurrently with the origin of eyespots, about 85 Mya, and subsequently lost in a few nymphalid lineages. Green triangles represent sensitivity towards 20E (character state 1), while white triangles represent absence of sensitivity (character state 0). Question marks represent missing data points. Circles, square and triangle on left with vertical bars represent respective estimated evolution of eyespot size plasticity (red and blue circles), 20E titer plasticity (green circle), EcR expression in eyespots (green square) and sensitivity towards 20E (green triangle). Alternative models using Maximum Likelihood reach similar conclusions (Supplementary Information: Figure 1—figure supplement 2, 3, Figure 4—source data 1). H. iboina image copyright of David.C. Lees, Cambridge University Department of Zoology.
-
Figure 4—source data 1
Results of likelihood ratio tests and AIC comparisons.
See Figure 1—figure supplement 1 for node identities.
- https://cdn.elifesciences.org/articles/49544/elife-49544-fig4-data1-v1.docx
Tables
Key resources table
| Reagent type (species) or resource | Designation | Source or reference | Identifiers | Additional information |
|---|---|---|---|---|
| Strain, strain background (Butterflies, females) | Junonia atlites; Junonia coenia; Junonia iphita; Junonia almana; Doleschallia bisaltide; Vanessa cardui; Vindula dejone; Cethosia cynae; Bicyclus anynana; Morpho peleides; Danaus chryssipus; Idea leuconoe; Papilio polytes | Penang Butterfly Farm, Malaysia; Duke University; Yale University; National University of Singapore | ||
| Antibody | EcR common isoform, Manduca sexta | DSHB | 1:10 | |
| Antibody | Spalt, Primary antibody, Guinea pig | Stoehr et al., 2013 | 1:20000 | |
| Antibody | AlexaFlour 488 green Goat anti-mouse secondary antibody | Molecular Probes | Cat# A-11001, RRID:AB_2534069 | 1:800 |
| Antibody | Goat anti-Guinea pig secondary antibody | Molecular Probes | Cat# A-11076, RRID:AB_141930 | 1:800 |
| Chemical compound, drug | 20-Hydroxyecdysone (20E) | Sigma-Aldrich | Cat# H5142 | Lot # 060M1390V |
| Chemical compound, drug | Cucurbitacin B (CucB) | Sigma–Aldrich | Cat# C8499 | Lot # 035M47104V |
| Software, algorithm | Imaris v8.64 | (ImarisXT, Bitplane AG) | ||
| Software, algorithm | Rphylopars | (Goolsby et al., 2017) | ||
| Software, algorithm | ape | (Paradis et al., 2004) | ||
| Software, algorithm | packages for R | (R Development Core Team, 2018) |
Additional files
Download links
A two-part list of links to download the article, or parts of the article, in various formats.
Downloads (link to download the article as PDF)
Open citations (links to open the citations from this article in various online reference manager services)
Cite this article (links to download the citations from this article in formats compatible with various reference manager tools)
Origin of the mechanism of phenotypic plasticity in satyrid butterfly eyespots
eLife 9:e49544.
https://doi.org/10.7554/eLife.49544


