Neuropeptide F regulates courtship in Drosophila through a male-specific neuronal circuit
- University of California, Santa Barbara, United States
- Zhejiang University, China
Figures
Figure 1 with 3 supplements

Effects of disruption of NPF neurons and the npf gene on male courtship.
(A and B) Effects of silencing NPF neurons with Shits (npf-Gal4/+;UAS-Shits/+) on courtship of group-housed male flies towards female targets. Male-female (M–F) courtship was assayed at the permissive (23°C) and non-permissive (31 °C) temperatures for Shits. (A) The percentages of males that initiated courtship. n = 4 (6 flies/group). (B) Courtship index (ratio of time that a male fly exhibits courtship behavior out of the total observation time) scored from 20 to 30 min observation time during a 30 min incubation period, n = 24. (C) Silencing NPF neurons with Shits (npf-Gal4/+;UAS-Shits/+) induces male-male (M–M) courtship. Isolation-housed males were assayed for chaining behavior at 23°C and 31°C for 10 min. n = 6 (8—12 flies/group). The chaining index is the proportion of time that ≥ 3 tester males engage in courtship simultaneously out of a 10 min observation time. The bars indicate means ± SEMs. To determine significance, we used the Mann-Whitney test. *p < 0.05, **p < 0.01, ***p < 0.001. (D) Schematic illustration of npfLexA knock-in reporter line generated by the CRISPR-HDR method. (E) Schematic illustration of the npf1 allele generated by the CRISPR-NHEJ method. npf1 harbors a single nucleotide deletion in the 2nd position of codon 19. (F) Courtship index of group-housed males towards mature, active females. The control flies are w1118-CS. P[g-npf+] is a transgene encompassing the npf+ genomic region. n = 24. (G) Courtship of isolation-housed males towards Drosophila simulans females. n = 12. (H) Courtship of isolation-housed males towards group-housed w1118 males. n = 19—24. (I) Discrimination of male and female targets by the indicated males. Males of the indicated genotypes were exposed to a decapitated 5 day old male and a decapitated 5 day old virgin female. The preference index indicates the proportion of courtship time directed towards a female target out of the total courtship time in 10 min. A preference index of 1.0 indicates that the male spent 100 % of the time courting the decapitated female. n = 12. (J) Courtship index of group-housed males towards newly-eclosed female targets. n = 24. (K) Courtship of group-housed males towards decapitated female targets. n = 20—22. The bars indicate means ± SEMs. The Kruskal-Wallis test followed by the Dunn’s post hoc test was used to assess significance. *p < 0.05, **p < 0.01, ***p < 0.001.
-
Figure 1—source data 1
Figure 1A—C Source data.
- https://doi.org/10.7554/eLife.49574.014
-
Figure 1—source data 2
Figure 1A—C Summary statistics.
- https://doi.org/10.7554/eLife.49574.015
-
Figure 1—source data 3
Figure 1F—K Source data.
- https://doi.org/10.7554/eLife.49574.016
-
Figure 1—source data 4
Figure 1F—K Summary statistics.
- https://doi.org/10.7554/eLife.49574.017
Figure 1—figure supplement 1
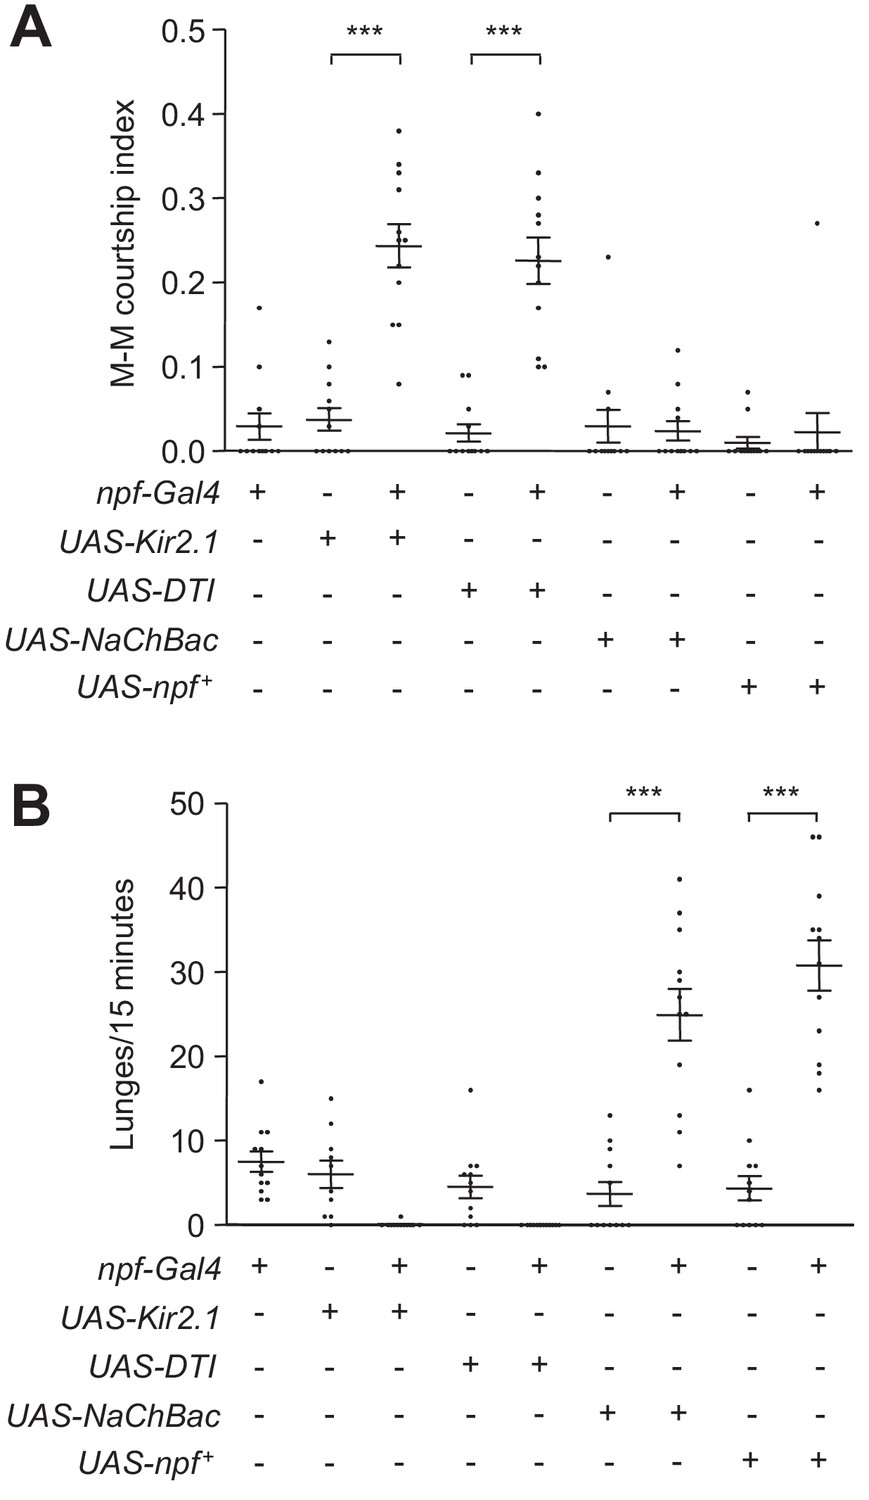
Effects of increasing or decreasing NPF signaling on male-male (M–M) courtship and aggression.
(A) Single tester males of the indicated genotypes were assayed for M–M courtship. Single group-housed w1118 males were used as the targets. n = 12. (B) Tester males of the indicated genotypes were assayed for aggression. Lunges over the course of 15 min were scored. Group-housed w1118 males were used as the targets. n = 10—12. The bars indicate means ± SEMs. Significance was assessed using the Mann-Whitney test. ***p < 0.001.
-
Figure 1—figure supplement 1—source data 1
Figure 1—figure supplement 1A Source data.
- https://doi.org/10.7554/eLife.49574.004
-
Figure 1—figure supplement 1—source data 2
Figure 1—figure supplement 1A Summary statistics.
- https://doi.org/10.7554/eLife.49574.005
-
Figure 1—figure supplement 1—source data 3
Figure 1—figure supplement 1B Source data.
- https://doi.org/10.7554/eLife.49574.006
-
Figure 1—figure supplement 1—source data 4
Figure 1—figure supplement 1B Summary statistics.
- https://doi.org/10.7554/eLife.49574.007
Figure 1—figure supplement 2
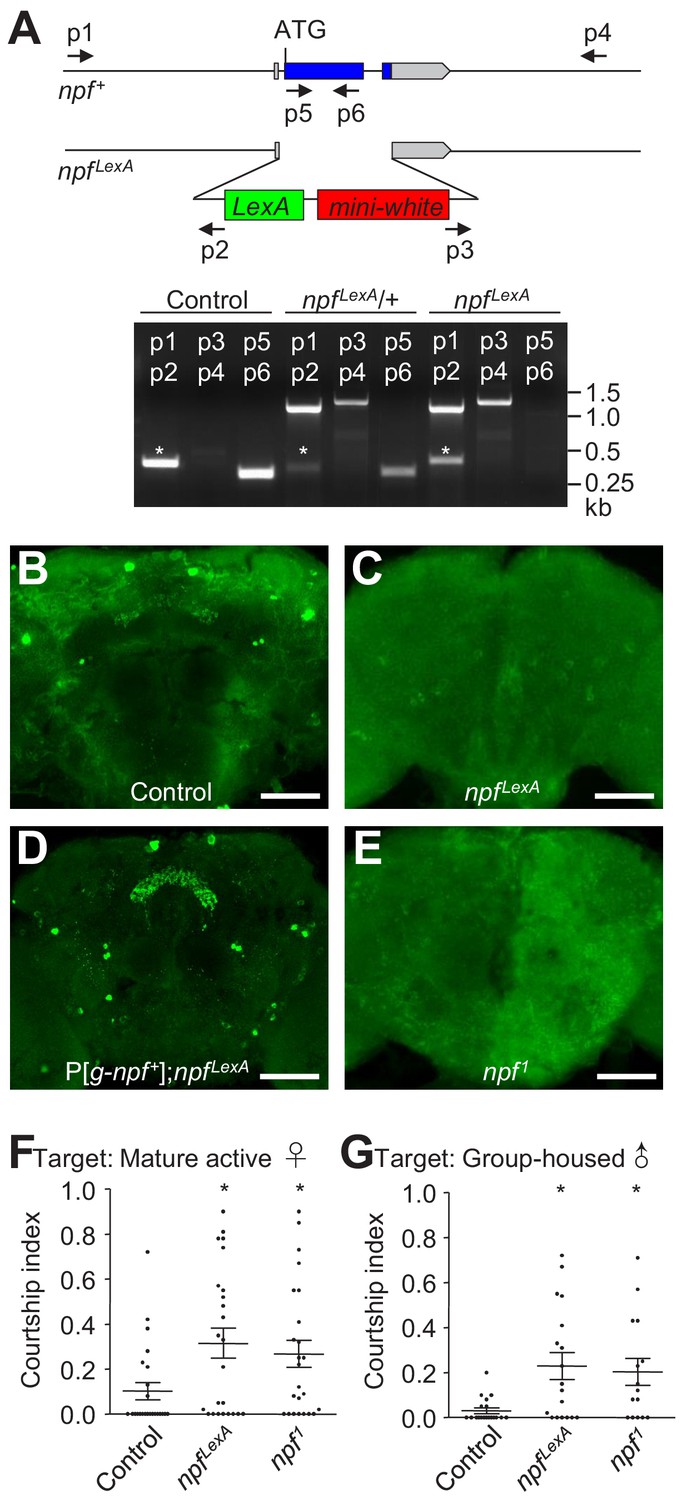
Genotyping, testing for NPF expression, and courtship assays using the npf1 and npfLexA mutants.
(A) Schematic showing the npfLexA knock-in reporter/mutant line generated using CRISPR-HDR. Shown below is the genotyping employing the indicated primer pairs, which confirms the integration of LexA and the mini-white coding sequences and disruption of the endogenous npf gene. The stars indicate non-specific bands generated in the control (w1118-CS) and npfLexA during the PCR amplification. (B—E) npfLexA, npf1, P[g-npf+];npfLexA and control male brains stained with anti-NPF. The scale bars represent 50 μm. (F) Group-housed npf1 and npfLexA males were assayed for courtship towards mature active female targets. n = 24. (G) Isolation-housed npf1 and npfLexA mutants were assayed for male-male (M–M) courtship. n = 15—19. The bars indicate means ± SEMs. The Kruskal-Wallis test followed by Dunn’s post hoc test was used to assess significance. *p < 0.05.
-
Figure 1—figure supplement 2—source data 1
Figure 1—figure supplement 2F Source data.
- https://doi.org/10.7554/eLife.49574.009
-
Figure 1—figure supplement 2—source data 2
Figure 1—figure supplement 2F Source data.
- https://doi.org/10.7554/eLife.49574.010
-
Figure 1—figure supplement 2—source data 3
Figure 1—figure supplement 2G Source data.
- https://doi.org/10.7554/eLife.49574.011
-
Figure 1—figure supplement 2—source data 4
Figure 1—figure supplement 2G Summary statistics.
- https://doi.org/10.7554/eLife.49574.012
Figure 1—figure supplement 3
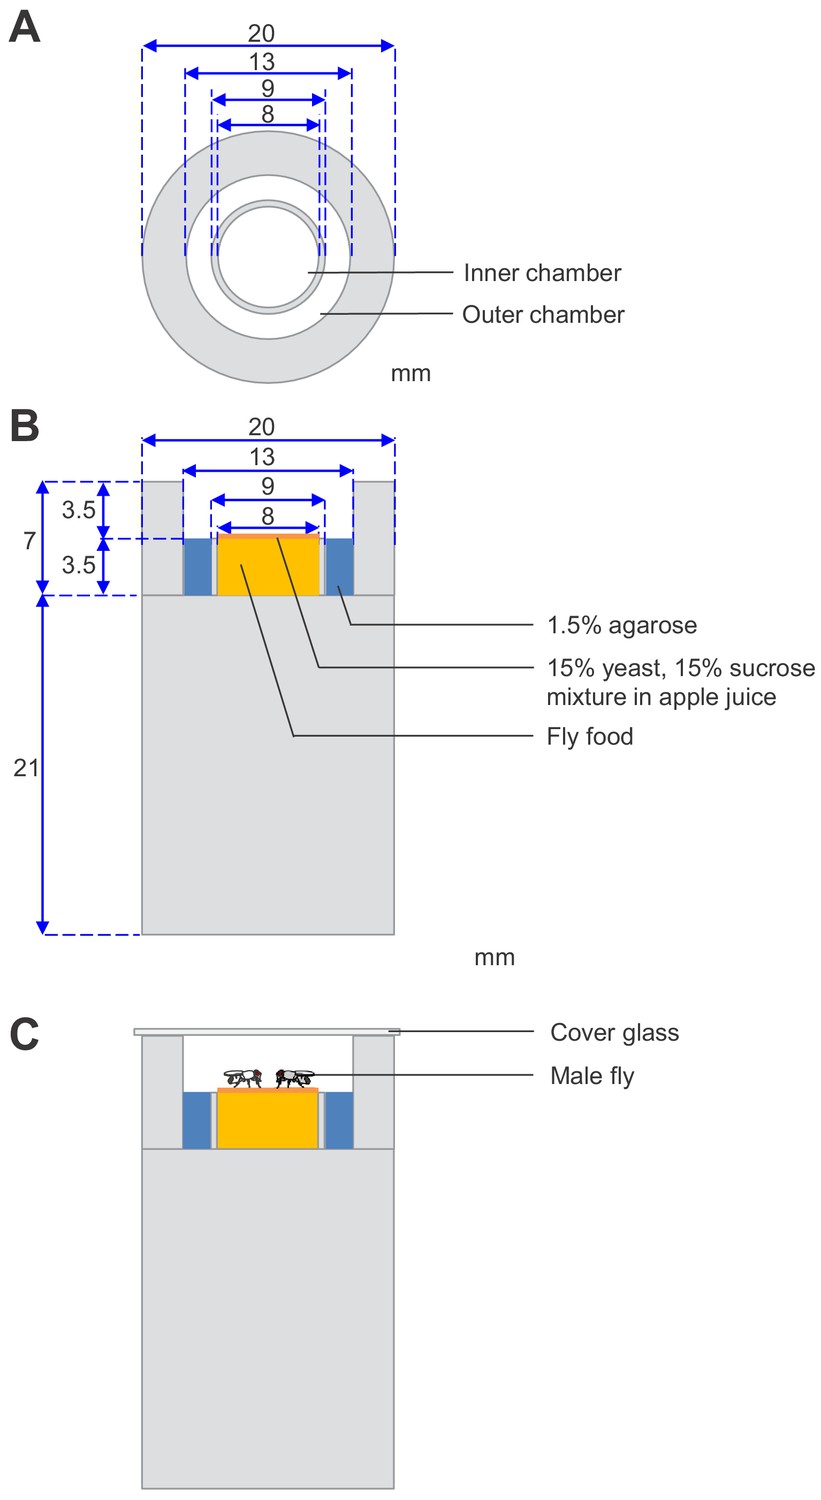
Illustration of the aggression chamber.
(A) Top view of the aggression chamber. (B) Side view of the aggression chamber. The numbers indicate the dimensions in mm. (C) Side view of the chamber with slide cover and addition of two males.
Figure 2 with 1 supplement

Identification of male-specific NPFM neurons.
(A and B) npfLexA/LexAop-IVS-mVenus male and female brains immunostained with anti-GFP to detect mVenus. The boxes indicate NPFM neurons, and the circles indicate the antennal lobes. (C) npfLexA/LexAop-IVS-mVenus male brain immunostained with anti-GFP and anti-NPF. NPFM neurons are boxed. (c1—c6) Zoomed in images showing NPFM neurons. (D) npfLexA/LexAop-IVS-mVenus male brain immunostained with anti-GFP and anti-FruM. The boxes indicate NPFM neurons. (d1—d6) Zoomed in images showing NPFM neurons. (E and F) fru mutant (fruFLP/fruFLP) and control fruFLP/+ male brains immunostained with anti-NPF. The boxes indicate NPFM neurons. The scale bars in A—F represent 50 μm. The scale bars in c1—c6 and d1—d6 represent 10 μm.
Figure 2—figure supplement 1
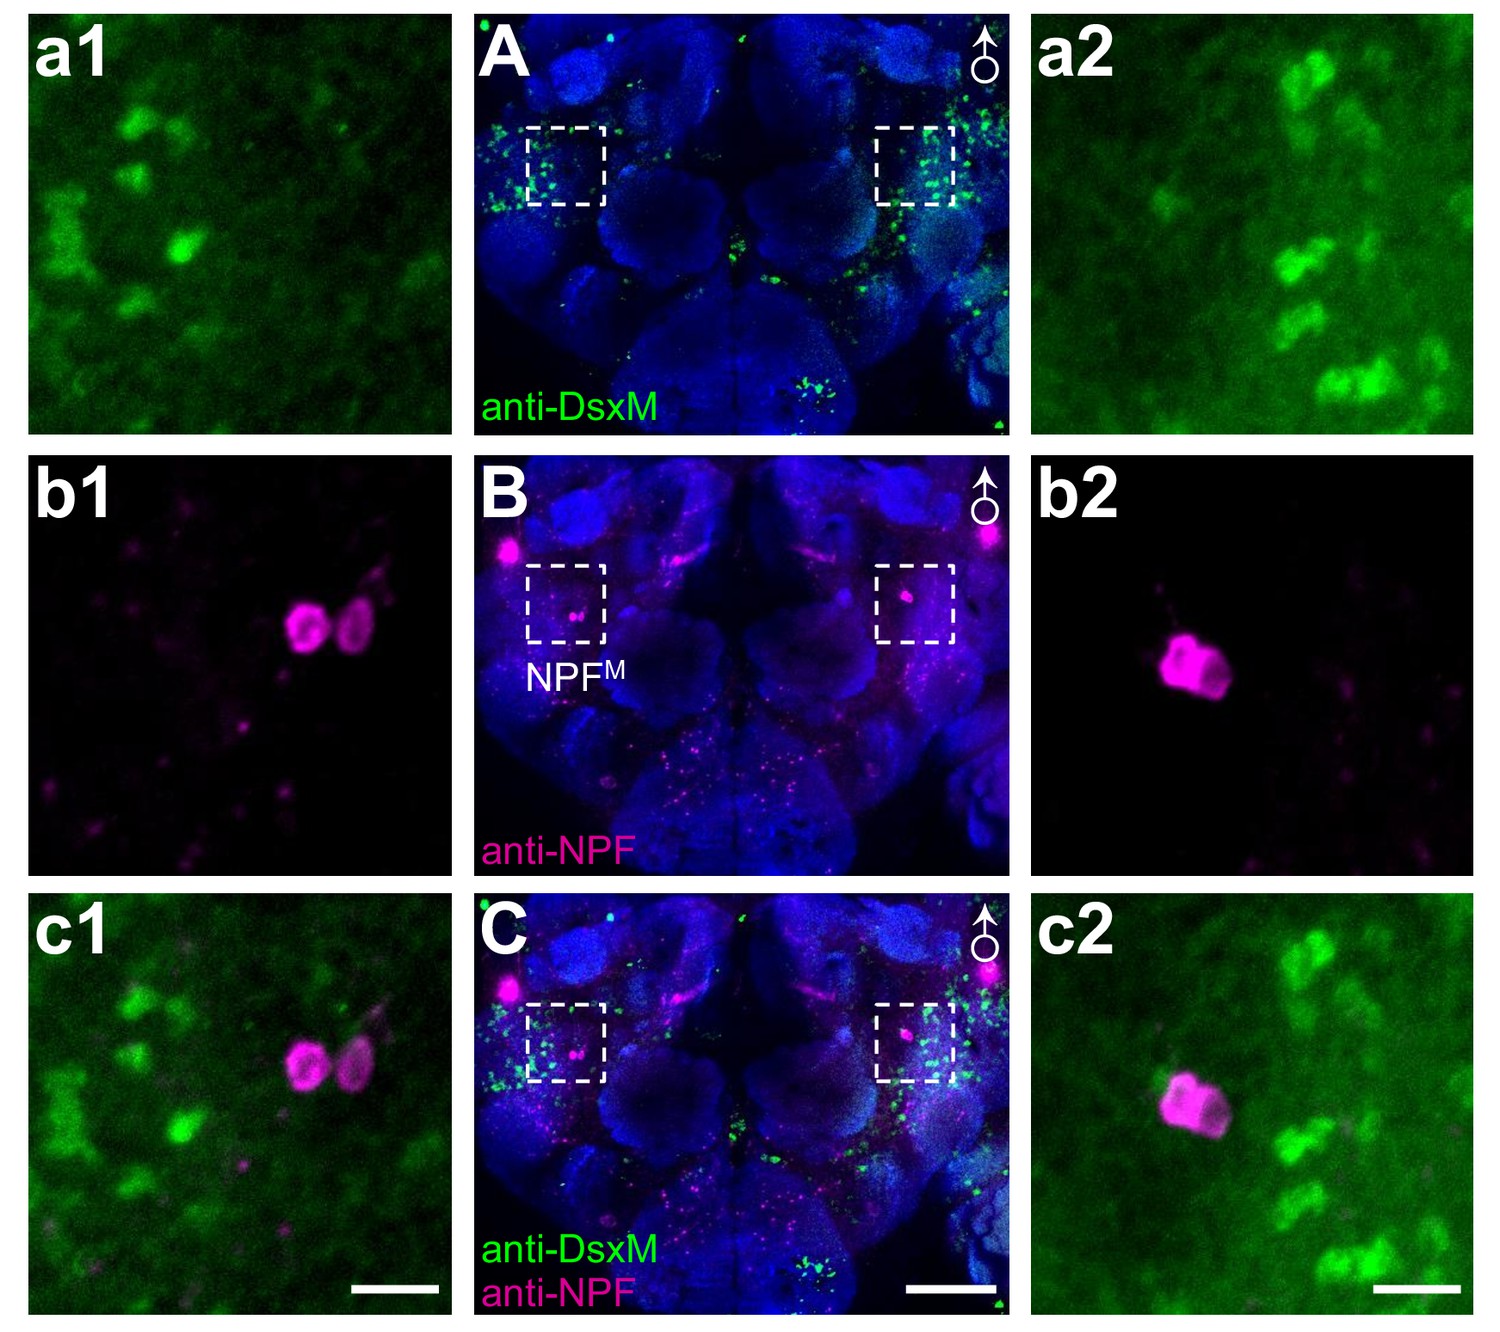
w1118-CS male flies stained with anti-NPF and anti-DsxM.
(A) Anti-DsxM. (B) Anti-NPF. (C) Merge of A) and B). The boxes outline the region containing NPFM neurons, shown at higher magnification in a1—c1 and a2—c2. The scale bars represent 50 μm in A—C and 10 μm in a1—c1 and a2—c2.
Figure 3
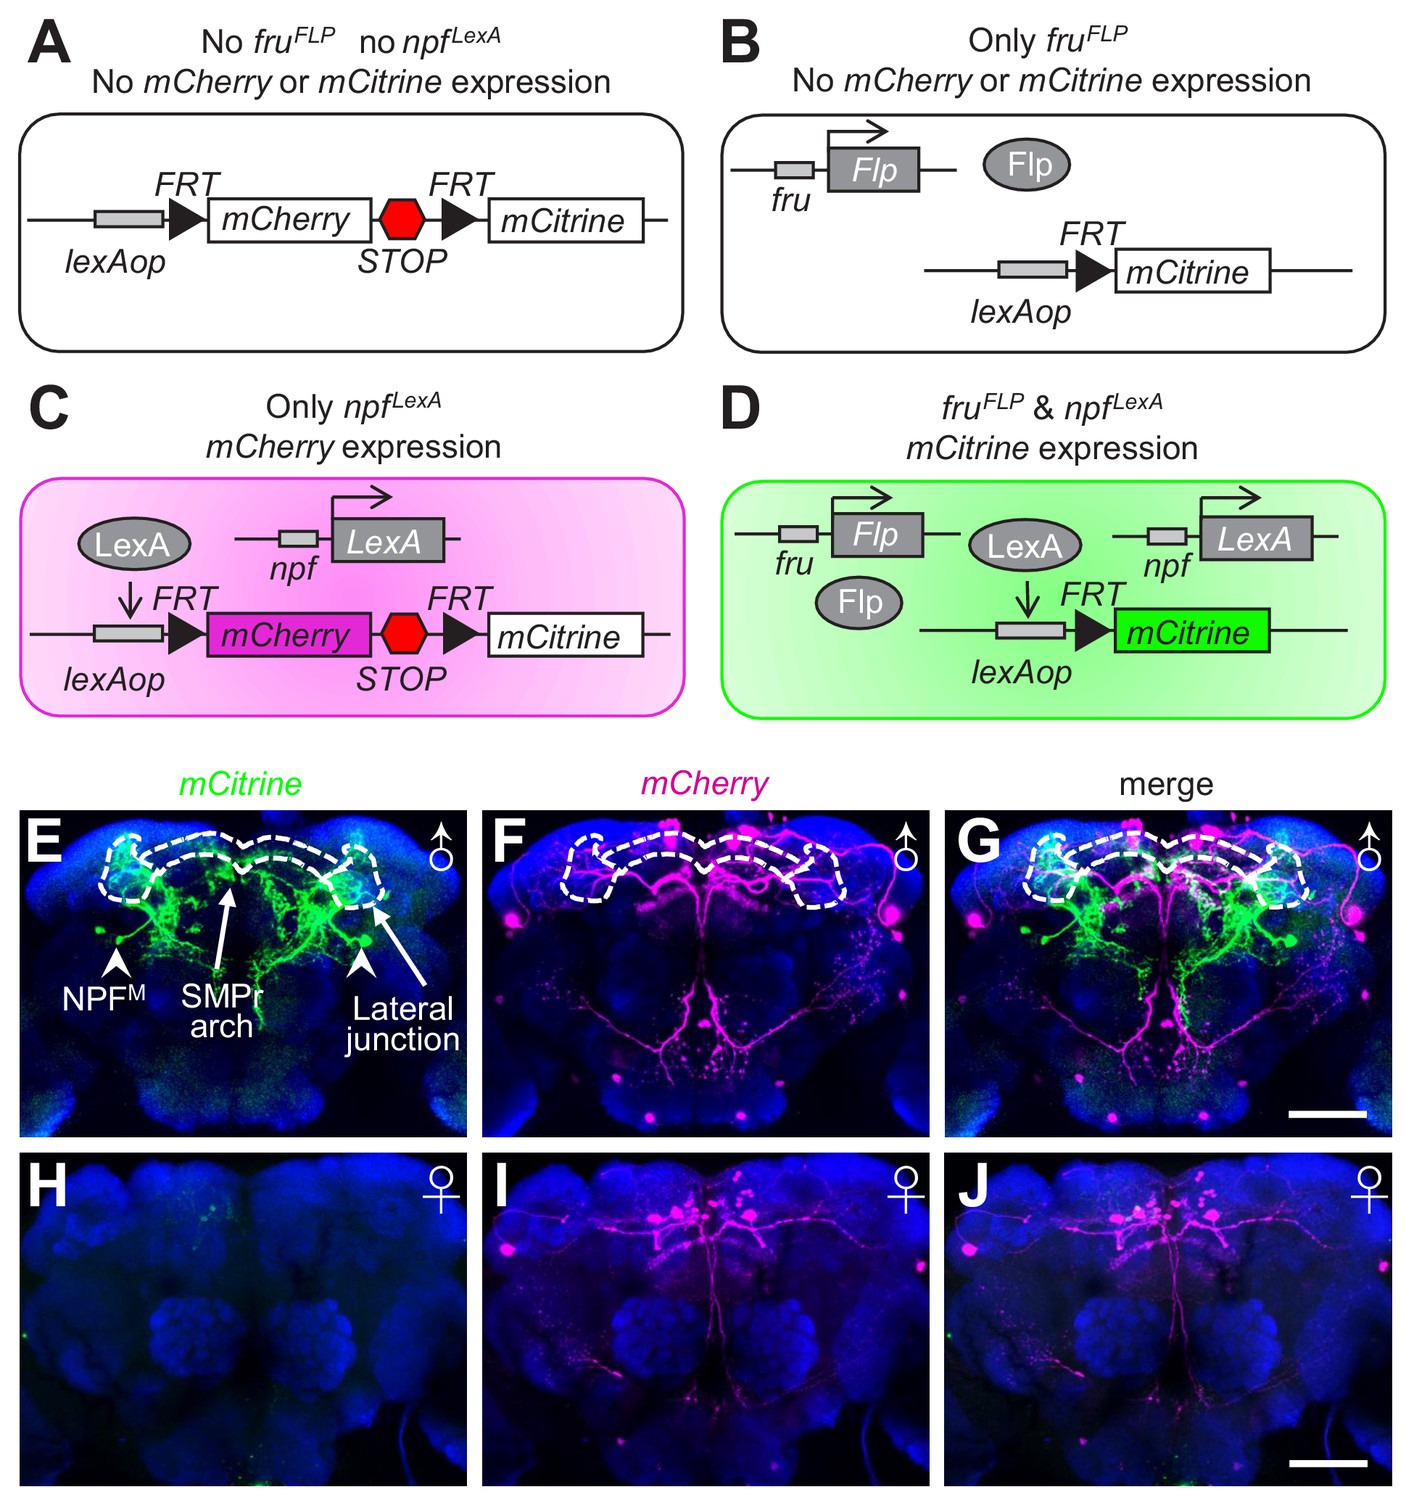
Labeling of NPFM neurons using the FlpOut method.
(A—D) Schematic illustration of the FlpOut method to label NPFM neurons. Only neurons that express both fru (fruFLP) and npf (npfLexA) will express mCitrine. (E—G) Expression patterns of mCitrine (stained with anti-GFP) and mCherry (stained with anti-DsRed) in a male brain. The white dashes outline the SMPr arch and lateral junction regions of the LPC. Arrowheads indicate NPFM soma. (H—J) mCitrine and mCherry expression patterns in a female brain. The scale bars represent 50 μm.
Figure 4
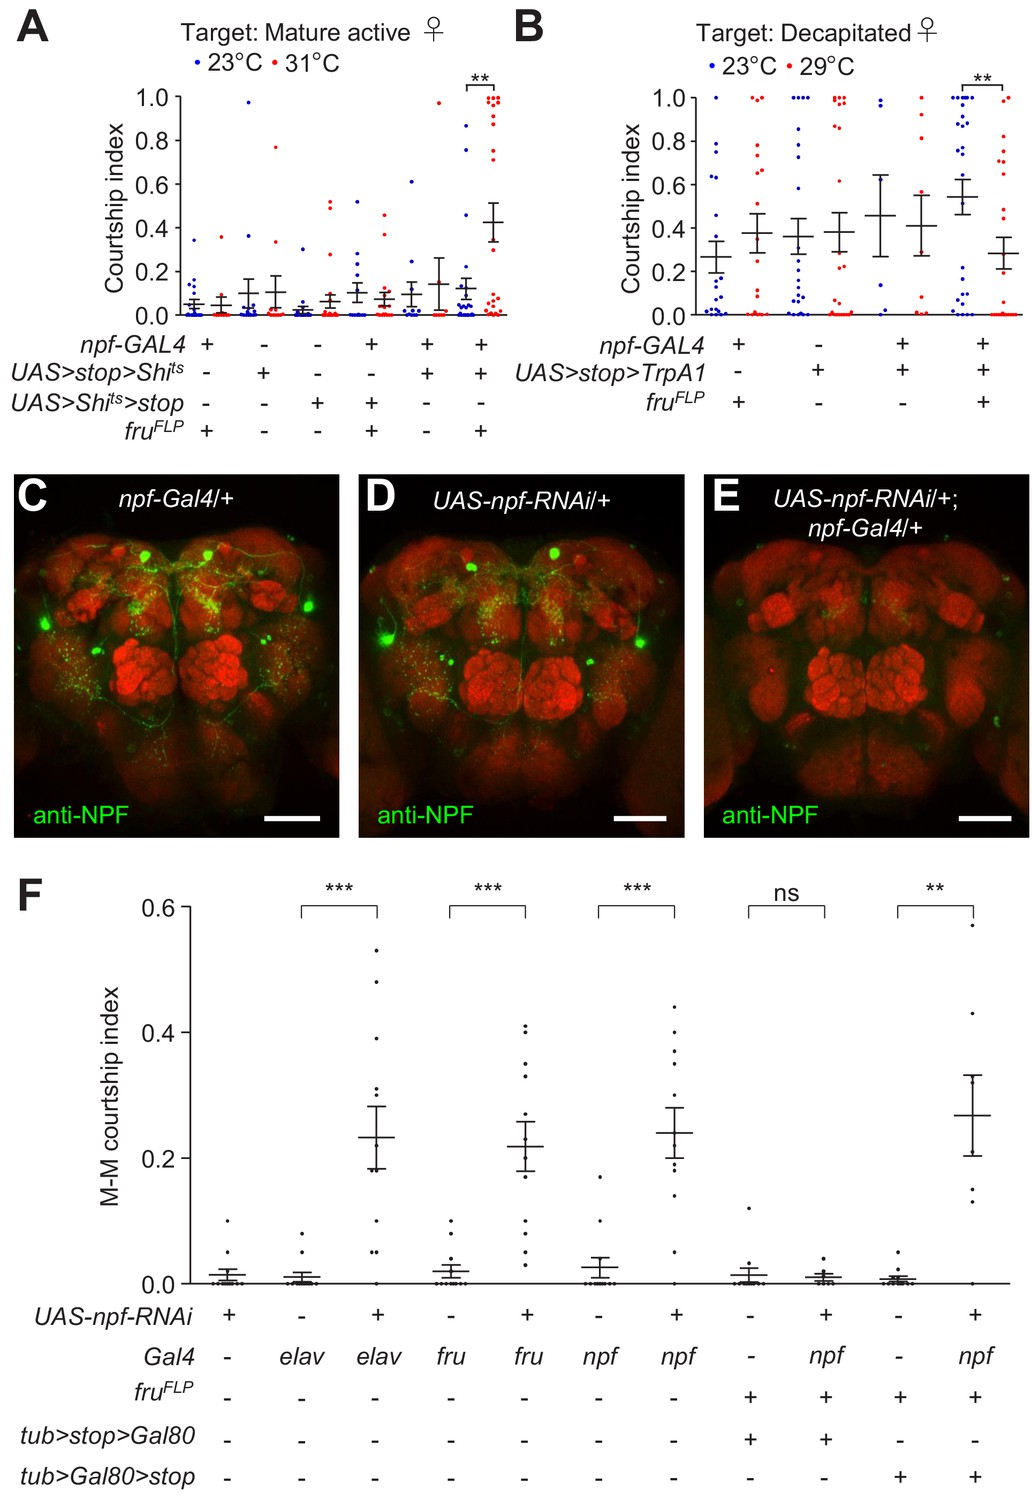
Specificity of NPFM neurons in regulating male courtship.
(A) Single tester males of the indicated genotypes were assayed for male-female (M–F) courtship at both permissive (23°C) and non-permissive (31°C) temperatures for Shits. Newly-eclosed male flies were isolated for 5 days, after which they were housed with 5—7 w1118 virgin female flies for 4 hr prior to the experiment. 7—15 day-old mature active mated w1118 female flies were used as targets. The courtship index is the mean ratio of time spent by the tester male in courtship within 30 min following a 10 min incubation period. n = 8—24. Bars indicate means ± SEMs. Significance was determined using Mann-Whitney test. **p < 0.01. (B) Single tester males of the indicated genotypes were assayed for courtship at two different temperatures (23°C and 29°C). Newly-eclosed males that were isolated for 2 days were used as testers. Decapitated w1118 female flies were used as the targets. Courtship index represents the mean ratio of time the male flies spent in courting within 10 min following a 5 min incubation period. n = 6—27. Bars indicate means ± SEMs. Significance was determined using Mann-Whitney test. **p < 0.01. (C—E) Immunohistochemistry showing the effect of npf RNAi knock down on NPF protein expression in male brains. Control genotypes of npf-Gal4/+ and UAS-npf-RNAi male brains and experimental genotype of npf-Gal4/+;UAS-npf-RNAi/+ male brains were immuno-stained with anti-NPF. Scale bars indicate 50 μm. (F) Effects on male-male (M–M) courtship due to RNAi knock down of npf in all neurons (elav), fru neurons, npf neurons, non-NPFM npf neurons and NPFM neurons. n = 7—12. The bars indicate means ± SEMs. Mann-Whitney test was used to determine significance. **p < 0.01.
-
Figure 4—source data 1
Figure 4A Source data.
- https://doi.org/10.7554/eLife.49574.023
-
Figure 4—source data 2
Figure 4A Summary statistics.
- https://doi.org/10.7554/eLife.49574.024
-
Figure 4—source data 3
Figure 4B Source data.
- https://doi.org/10.7554/eLife.49574.025
-
Figure 4—source data 4
Figure 4B Summary statistics.
- https://doi.org/10.7554/eLife.49574.026
-
Figure 4—source data 5
Figure 4F Source data.
- https://doi.org/10.7554/eLife.49574.027
-
Figure 4—source data 6
Figure 4F Summary statistics.
- https://doi.org/10.7554/eLife.49574.028
Figure 5 with 3 supplements
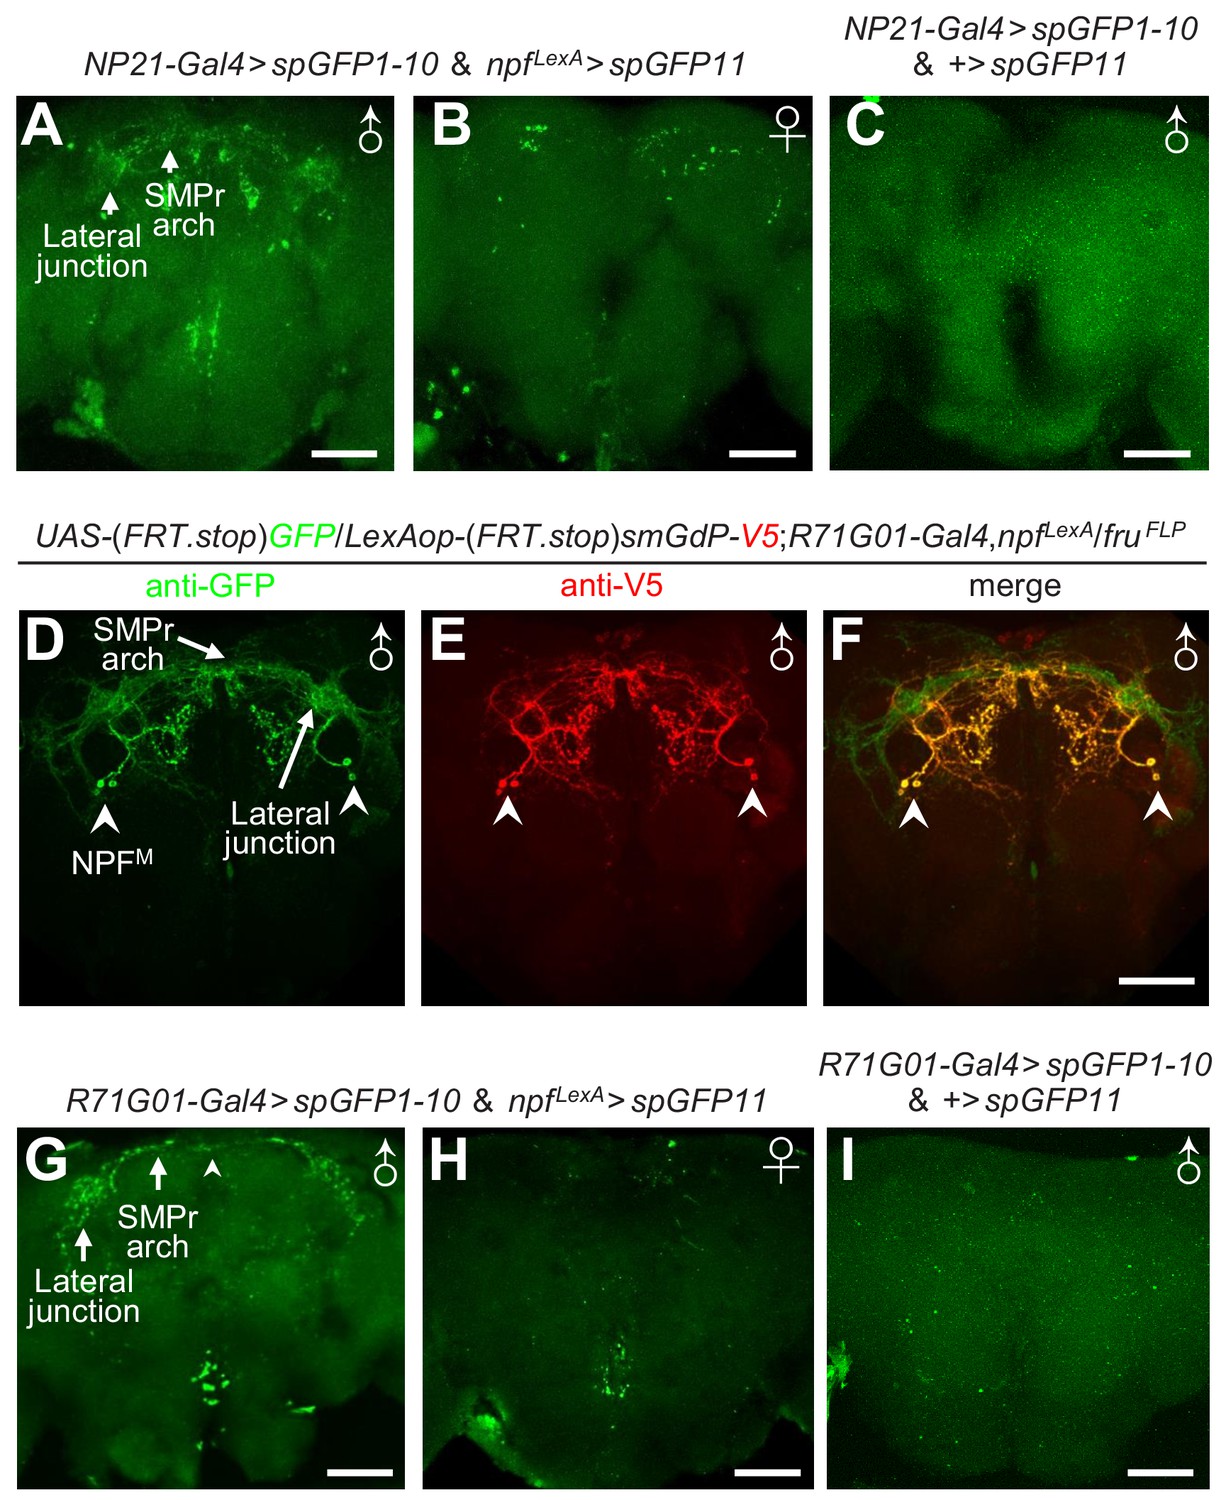
Anatomical and functional interactions between P1 and NPFM neurons.
(A—C) GRASP approach to examine close interactions between NPF and fru neurons in UAS-spGFP1-10, LexAop-spGFP11/NP21-Gal4, npfLexA flies. GFP fluorescent signals indicate close associations. (A) Reconstituted GFP signals in a male brain. The arrows indicate the SMPr arch and lateral junction structures. (B) Reconstituted GFP signals in a female brain. (C) Negative control for GRASP showing a UAS-spGFP1-10, LexAop-spGFP11/NP21-Gal4 male brain. Scale bars indicate 50 μm. A portion of the brain stacks, including the LPC structure, is shown. The full brain stacks are presented in the source data files. (D—F) FlpOut approach to differentially label P1 neurons and NPFM neurons. (D) Anti-GFP stained fru-positive P1 (due to smGdP expression) and NPFM neurons. Arrows indicate the SMPr arch and the lateral junction. Arrowheads indicate the soma of NPFM neurons. (E) Anti-V5 exclusively labels NPFM neurons. The arrowheads indicate soma of NPFM neurons. (F) Composite of P1 and NPFM neurons. The arrowheads indicate NPFM soma. The scale bar represents 50 μm. (G—I) GRASP approach to examine close interactions between NPF and P1 neurons in UAS-spGFP1-10,LexAop-spGFP11/R71G01-Gal4,npfLexA flies. GFP fluorescent signals indicate close associations. (G) Reconstituted GFP signals in a male brain. Arrows indicate lateral junction and SMPr arch of the LPC. The arrowhead indicates an example of a reconstituted GFP signal. (H) Reconstituted GFP signals in a female brain. (I) Negative control for GRASP showing a UAS-spGFP1-10, LexAop-spGFP11/R71G01-Gal4 male brain. Scale bars indicate 50 μm. A portion of the brain stacks, including the LPC structure, is shown. The full brain stacks are presented in the source data files.
-
Figure 5—source data 1
Figure 5A—C, G—I Full stacks.
- https://doi.org/10.7554/eLife.49574.033
Figure 5—figure supplement 1
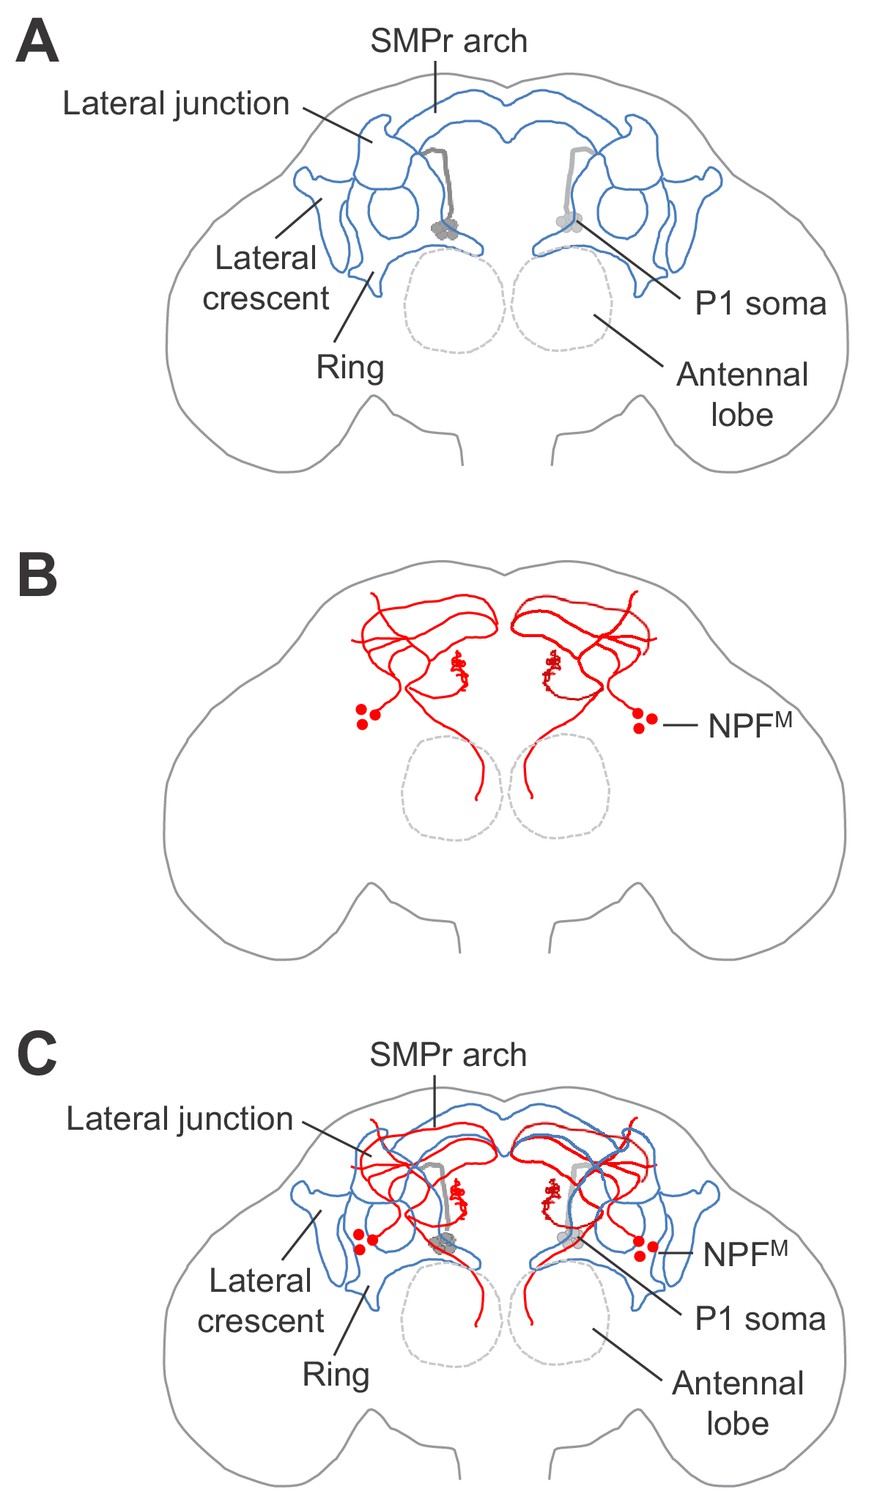
Cartoons of male brains showing the approximate positions of selected brain regions and neurons.
(A) Schematic illustration of the LPC structure formed by P1 neuronal processes. Lateral junction, SMPr arch, lateral crescent and ring of the LPC are indicated. (B) Schematic illustration of NPFM neurons. (C) Schematic illustration of composite of NPFM neurons and LPC structure.
Figure 5—figure supplement 2

Comparison of the projection patterns of NPF and P1 neurons in a male brain.
(A—C) UAS-mCD8::RFP,LexAop-mCD8::GFP/+,Y;;R71G01-GAL4/npfLexA male and female brains immunostained with anti-GFP and anti-DsRed (stains RFP), which labels NPF and P1 neurons, respectively. (A—C) RFP and GFP expression patterns in a male brain. The boxed regions indicate the LPC. NPFM neurons are indicated by the arrows. (D—F) RFP and GFP expression patterns in a female brain. Scale bars indicate 50 μm.
Figure 5—figure supplement 3
Directionality of connections between P1 and NPFM neurons.
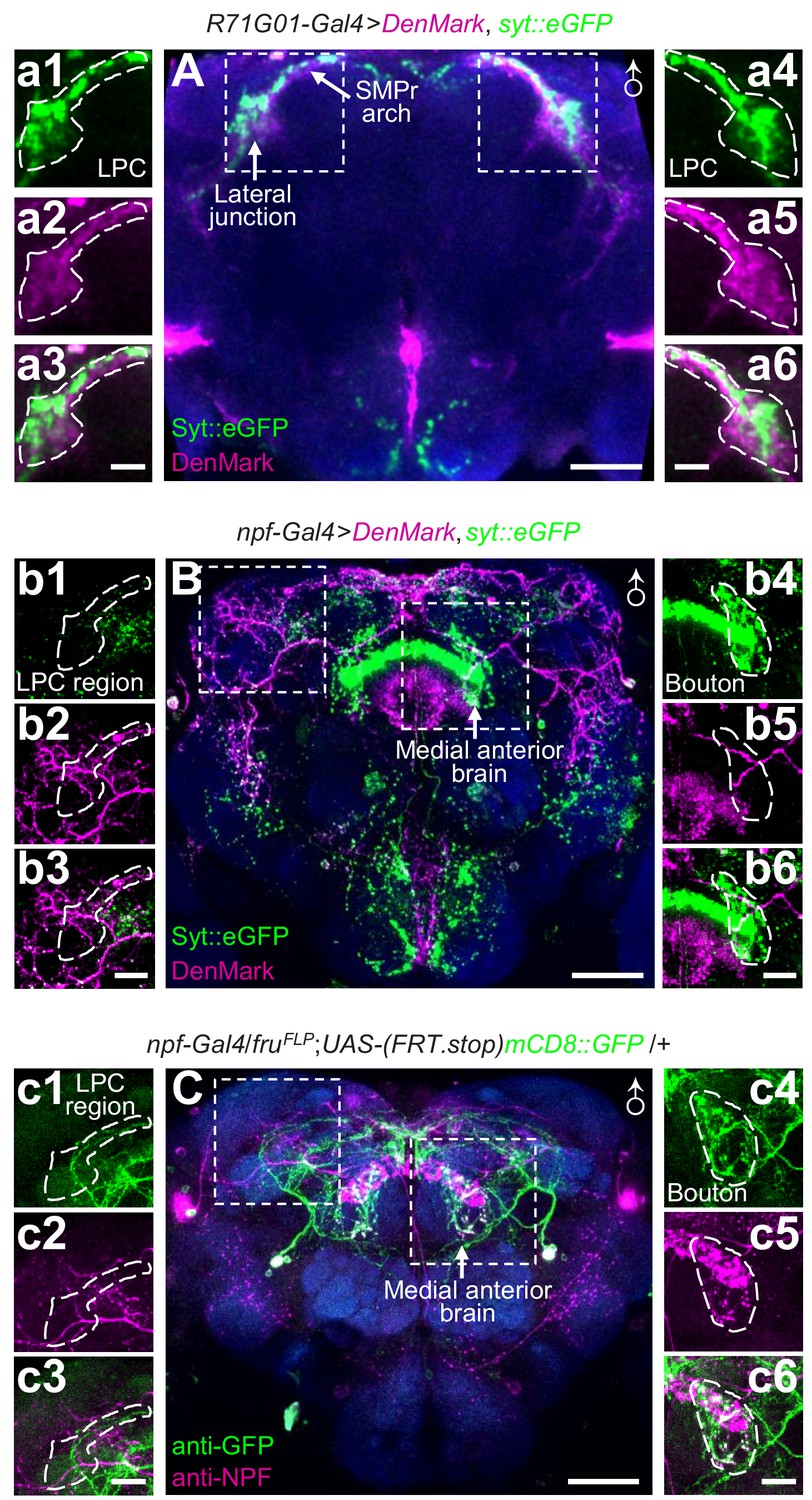
(A) Pre- and post-synaptic regions of P1 neurons were labeled with Syt::eGFP and DenMark, respectively in a male brain from a UAS-DenMark,UAS-Syt::eGFP/+;R71G01-Gal4/+fly. DenMark and Syt::EGFP were detected with anti-DsRed and anti-GFP, respectively. The boxes indicate the lateral junction and SMPr arch of the LPC, which are contoured in a1—a6. (B) Pre- and post-synaptic regions of NPF neurons were labeled with Syt::eGFP and DenMark, respectively in an npf-Gal4/UAS-DenMark,UAS-syt::eGFP male brain. The box to the left shows the LPC region (contoured in b1 —b3). The box to the right shows the medial anterior brain. Bouton-shaped syt::eGFP signals in this region are contoured in b4—b6. (C) npf-Gal4/ UAS > stop > mCD8::GFP;fruFLP/+ male brain stained with anti-NPF and anti-GFP. The left box outlines the LPC region, which is contoured in (c1 —c3). The right box shows boutons that are double-stained with both antibodies in the medial anterior brain, and contoured in (c4 —c6). The scale bars represent 50 μm in panels (A —C), and 20 μm in panels (a1 —a6), (b1 —b6) and (c1 —c6).
Figure 6 with 1 supplement
Neural activity changes in NPFM neurons in response to activation of P1 neurons.
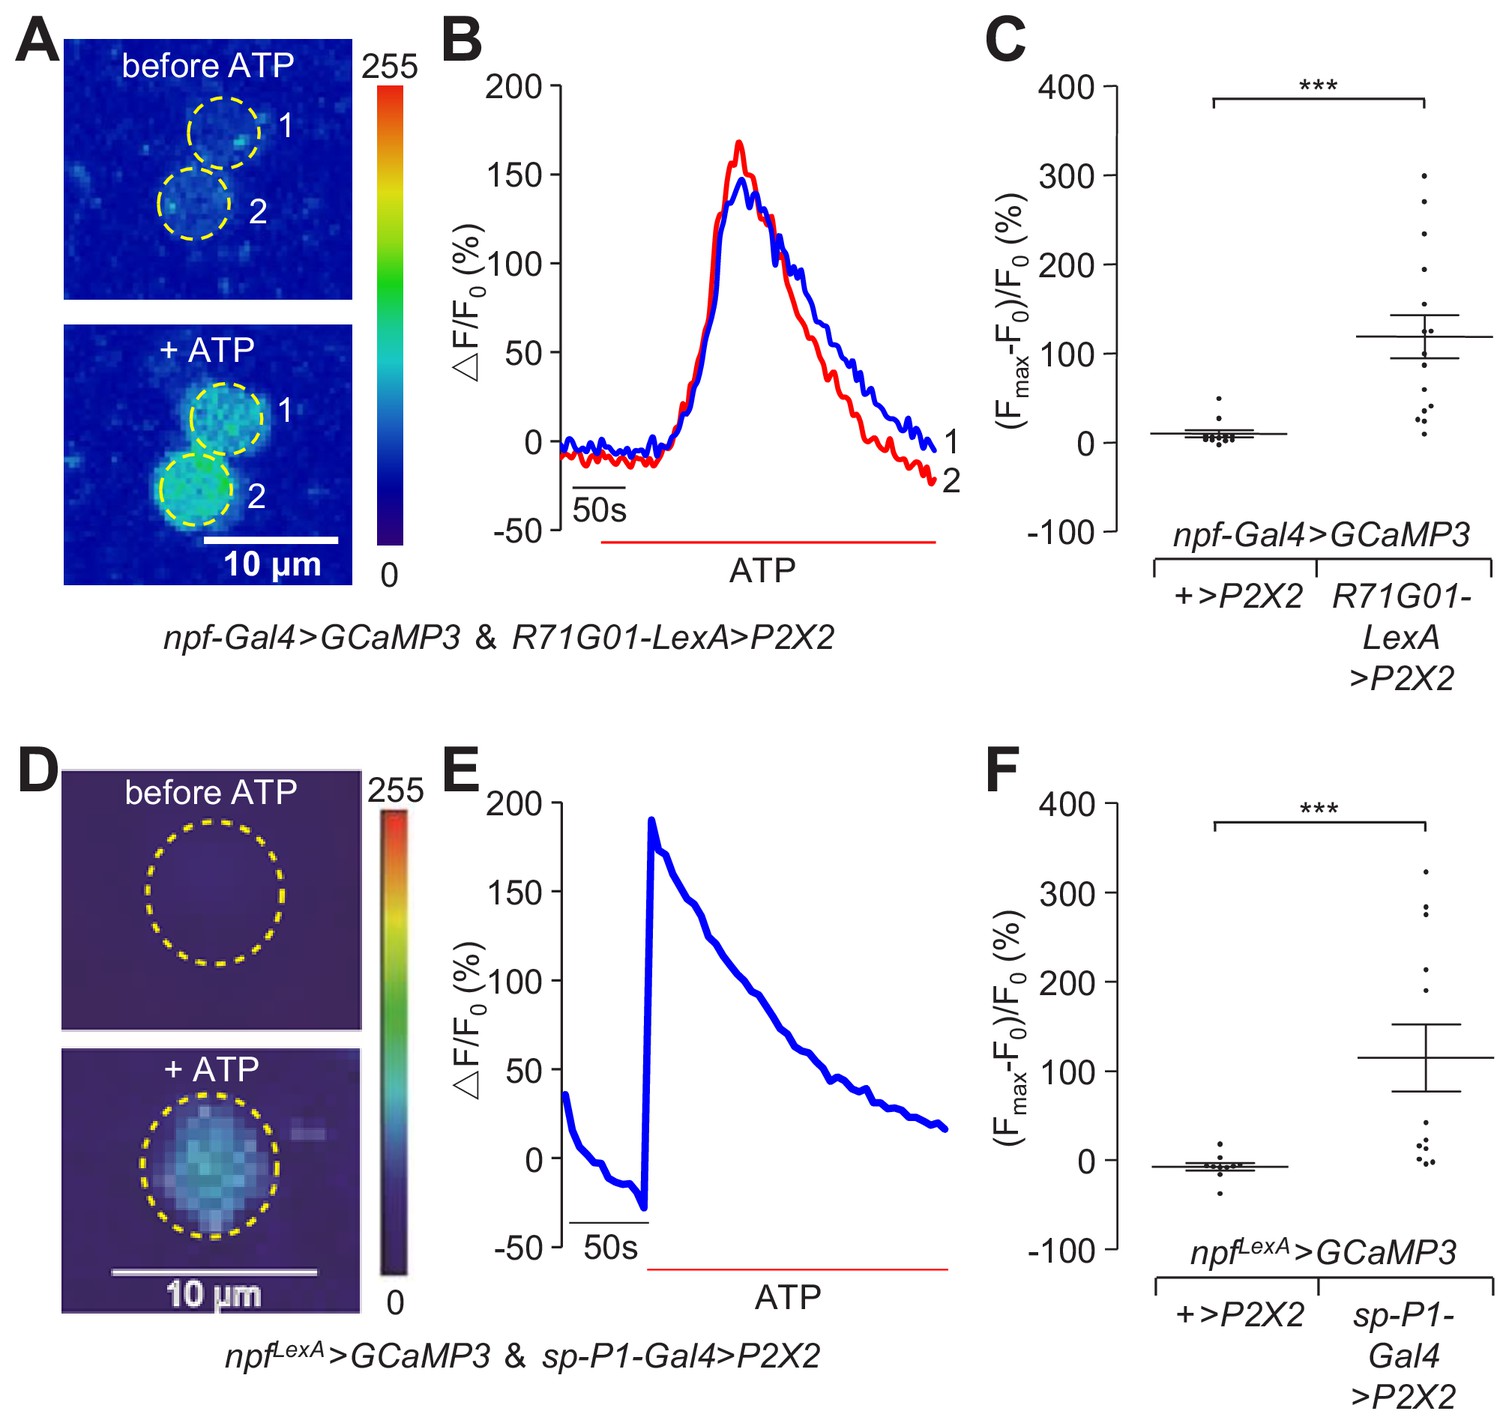
(A—C) UAS-GCaMP3, LexAop- P2X2/R71G01-LexA;npf-Gal4/+ male brains were imaged for GCaMP3 responses. Cell bodies of NPFM neurons were imaged. (A) Representative heat maps indicating GCaMP3 fluorescence before and during ATP application. The numbers indicate NPFM neurons. (B) Representative traces showing dynamic changes in GCaMP3 fluorescence in NPFM neurons (circled in panel A). (C) Largest GCaMP3 fluorescence changes [(Fmax-F0)/ F0 (%)] in response to ATP application in the control and experimental group. GCaMP3 fluorescence was recorded from 12 NPFM neurons from eight control brains, and 15 NPFM neurons from nine experimental brains. (D—F) UAS- P2X2 , LexAop-GCaMP3/R15A01-AD; npfLexA / R 71 G01-DBD male brains were imaged for GCaMP3 responses. The cell bodies of NPFM neurons were imaged. (D) Representative heat maps indicating GCaMP3 fluorescence before and during ATP application. The numbers indicate NPFM neurons. (E) Representative traces showing dynamic changes in GCaMP3 fluorescence in NPFM neurons (circled in panel D). (F) Largest GCaMP3 fluorescence changes [(Fmax-F0)/ F0 (%)] in response to ATP application in the control and experimental group. GCaMP3 fluorescence was recorded from 10 NPFM neurons from three control brains, and 12 NPFM neurons from three experimental brains. The scale bars in (A and D) represent 10 μm. The bars in (C and F) indicate means ± SEMs. Significance was assessed using the Mann Whitney test, ***p < 0.001.
-
Figure 6—source data 1
Figure 6C Source data.
- https://doi.org/10.7554/eLife.49574.037
-
Figure 6—source data 2
Figure 6C Summary statistics.
- https://doi.org/10.7554/eLife.49574.038
-
Figure 6—source data 3
Figure 6F Source data.
- https://doi.org/10.7554/eLife.49574.039
-
Figure 6—source data 4
Figure 6F Summary statistics.
- https://doi.org/10.7554/eLife.49574.040
Figure 6—figure supplement 1
Ca2+ imaging of NPFM neurons in response to activation of P1 neurons.
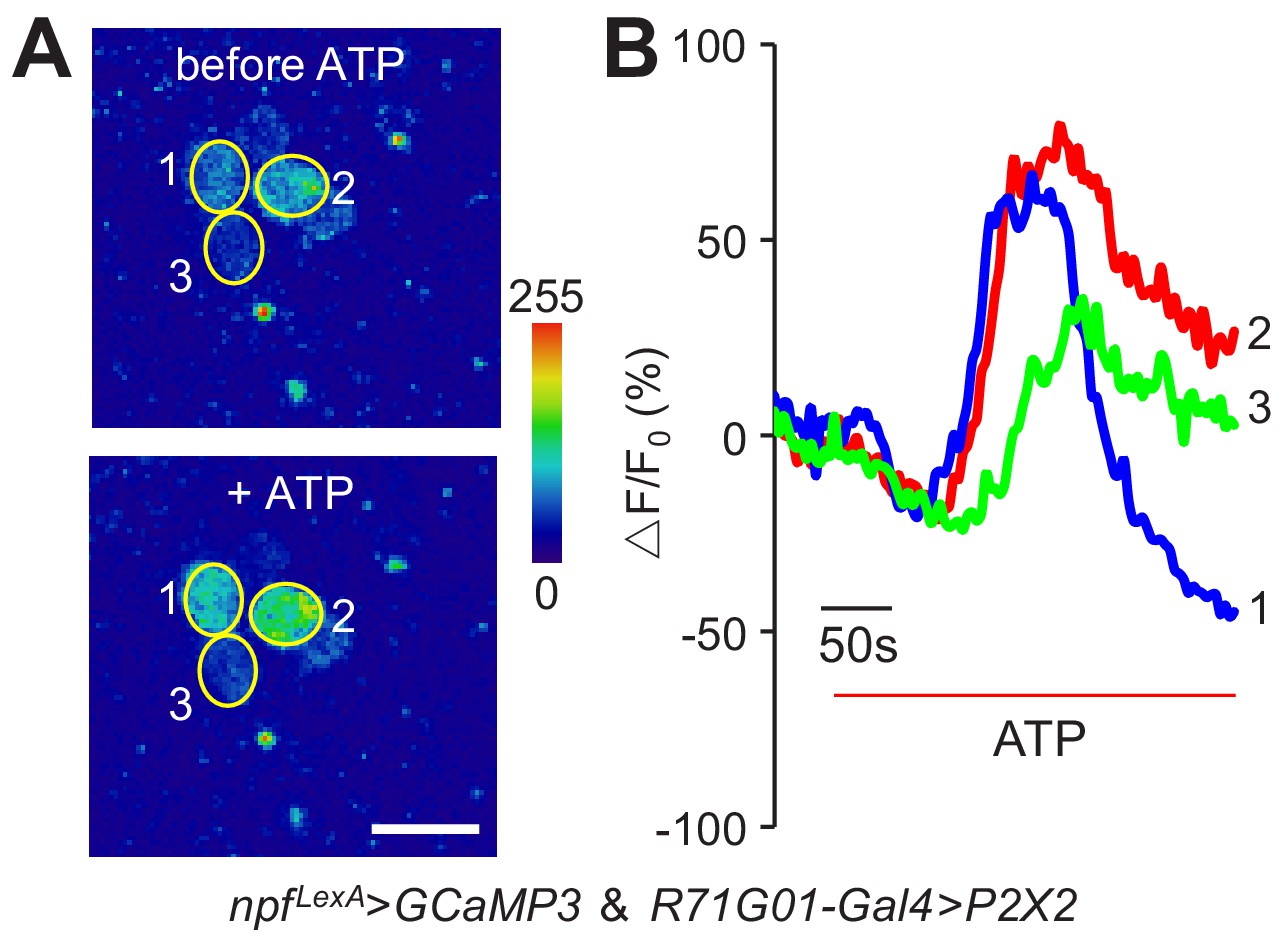
(A) UAS- P2X2,LexAopGCaMP3/+;R71G01-Gal4,npfLexA/+ male brains were imaged for GCaMP3 responses upon ATP application. Heat maps show the basal and maximal GCaMP3 fluorescence levels before and during ATP application. The numbers indicate NPFM neurons. The scale bar represents 10 μm. (B) Representative traces of dynamic GCaMP3 fluorescence changes in the NPFM neurons indicated in (A).
Figure 7 with 1 supplement
Effects of inactivating NPF and P1 neurons on male courtship, characterization of npfr reporter expression, and impact of npfr on male courtship.
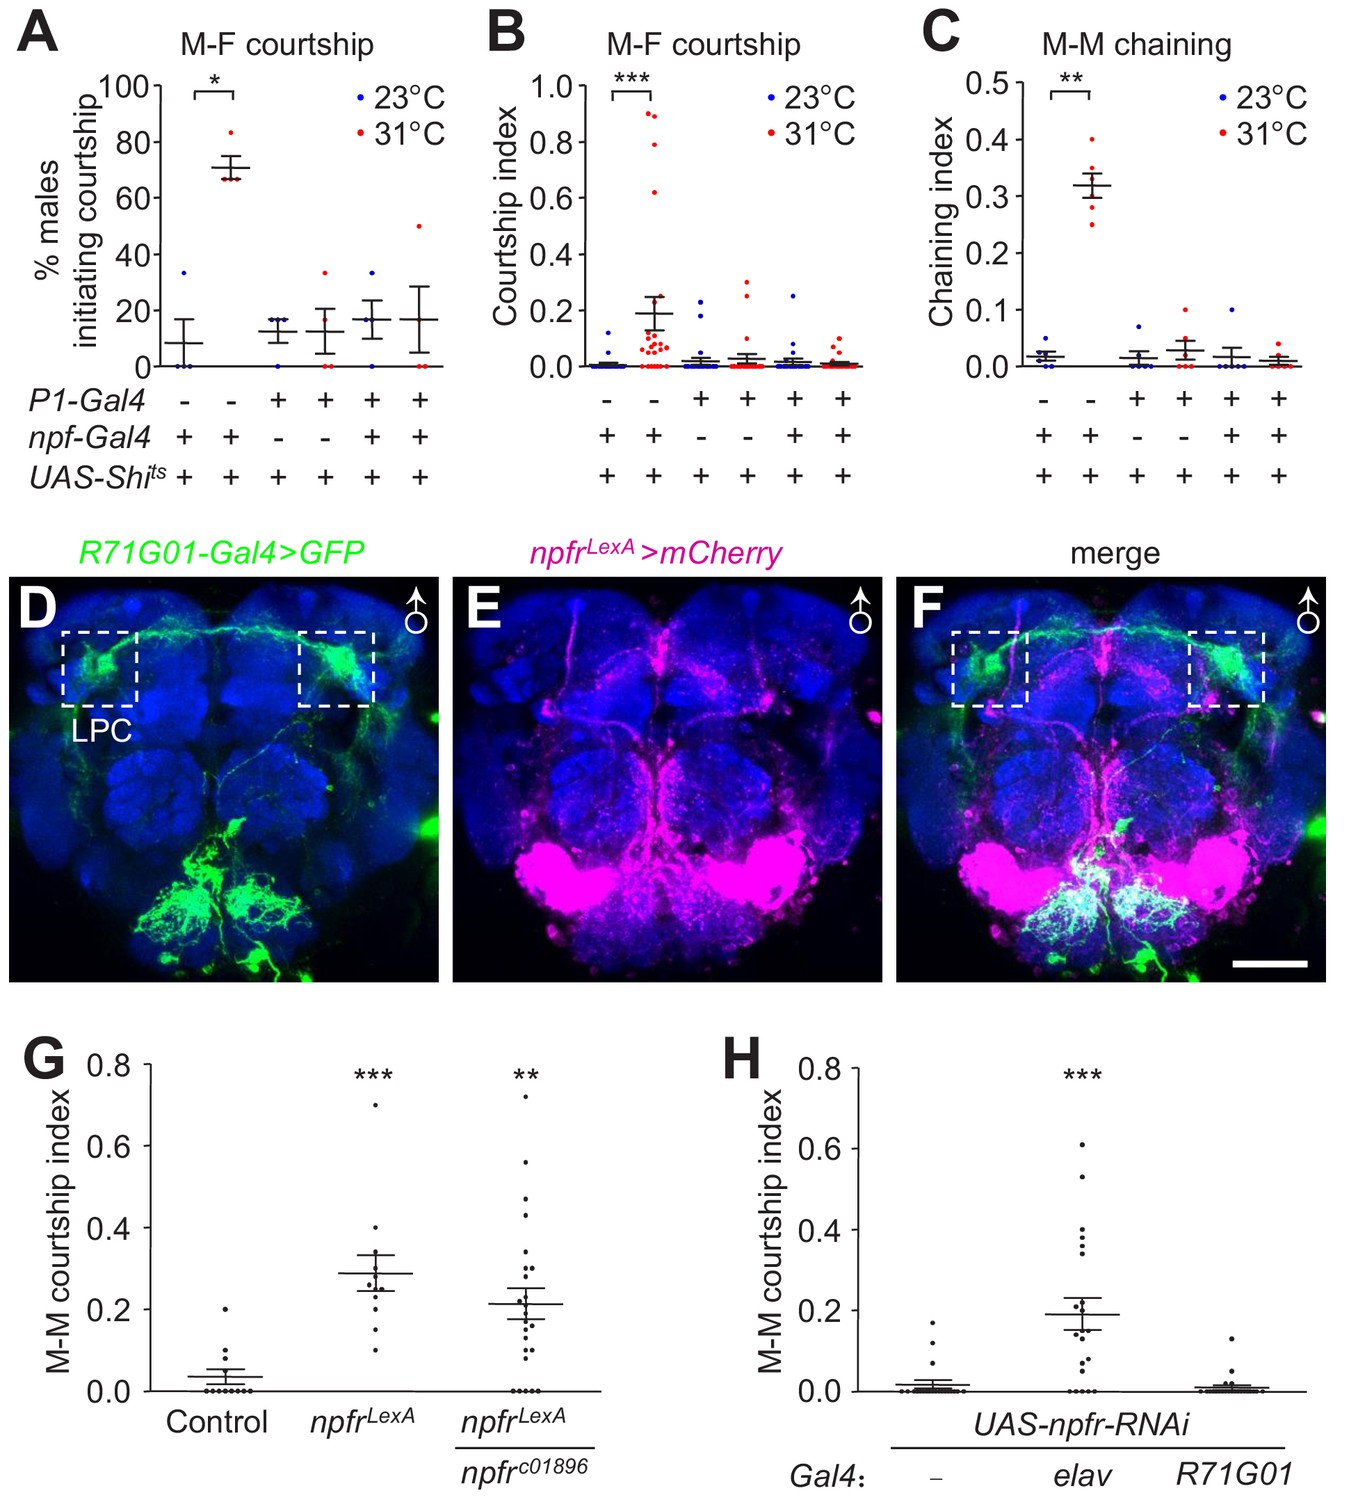
(A—C) Effects of silencing both NPF and P1 neurons with Shits (npf-Gal4/+;R71G01-Gal4/UAS-Shits) on courtship of group-housed males towards female targets. Male-female (M–F) courtship was assayed at the permissive (23°C) and non-permissive (31°C) temperatures for Shits. (A) The percentages of males that initiated courtship. n = 4 (6 flies/group). (B) The courtship indexes were scored based on 20—30 min of observation during a 30 min incubation period. n = 24. (C) Effect of silencing both NPF and P1 neurons with Shits (npf-Gal4/+;R71G01-Gal4/UAS-Shits) on male-male (M–M) courtship. Isolation-housed males were assayed for chaining behavior at 23°C and 31°C for 10 min. n = 6 (8—12 flies/group). The bars indicate means ± SEMs. Significance was assessed using the Mann-Whitney test. *p < 0.05, **p < 0.01, ***p < 0.001. (D—F) Spatial distribution of npfr (mCherry) and P1 (GFP) reporters in a male brain (UAS-mCD8::GFP/+;R71G01-Gal4/npfrLexA,LexAop-mCherry). The reporters were detected with GFP and DsRed antibodies. The boxed regions indicate the LPC. The scale bar represents 50 μm. (G) npfrLexA homozygous and npfrLexA/npfrc01896 trans-heterozygous mutants were assayed for M–M courtship. The control flies are w1118-CS. n = 12—24. (H) Effects on M–M courtship due to knock down of npfr pan-neuronally (elav-Gal4) or in P1 neurons. n = 21—23. The bars indicate means ± SEMs. To determine significance, we used the Kruskal-Wallis test followed by the Dunn’s post hoc test. **p < 0.01, ***p < 0.001.
-
Figure 7—source data 1
Figure 7A Source data.
- https://doi.org/10.7554/eLife.49574.045
-
Figure 7—source data 2
Figure 7A Summary statistics.
- https://doi.org/10.7554/eLife.49574.046
-
Figure 7—source data 3
Figure 7G—H Source data.
- https://doi.org/10.7554/eLife.49574.047
-
Figure 7—source data 4
Figure 7G—H Summary statistics.
- https://doi.org/10.7554/eLife.49574.048
Figure 7—figure supplement 1
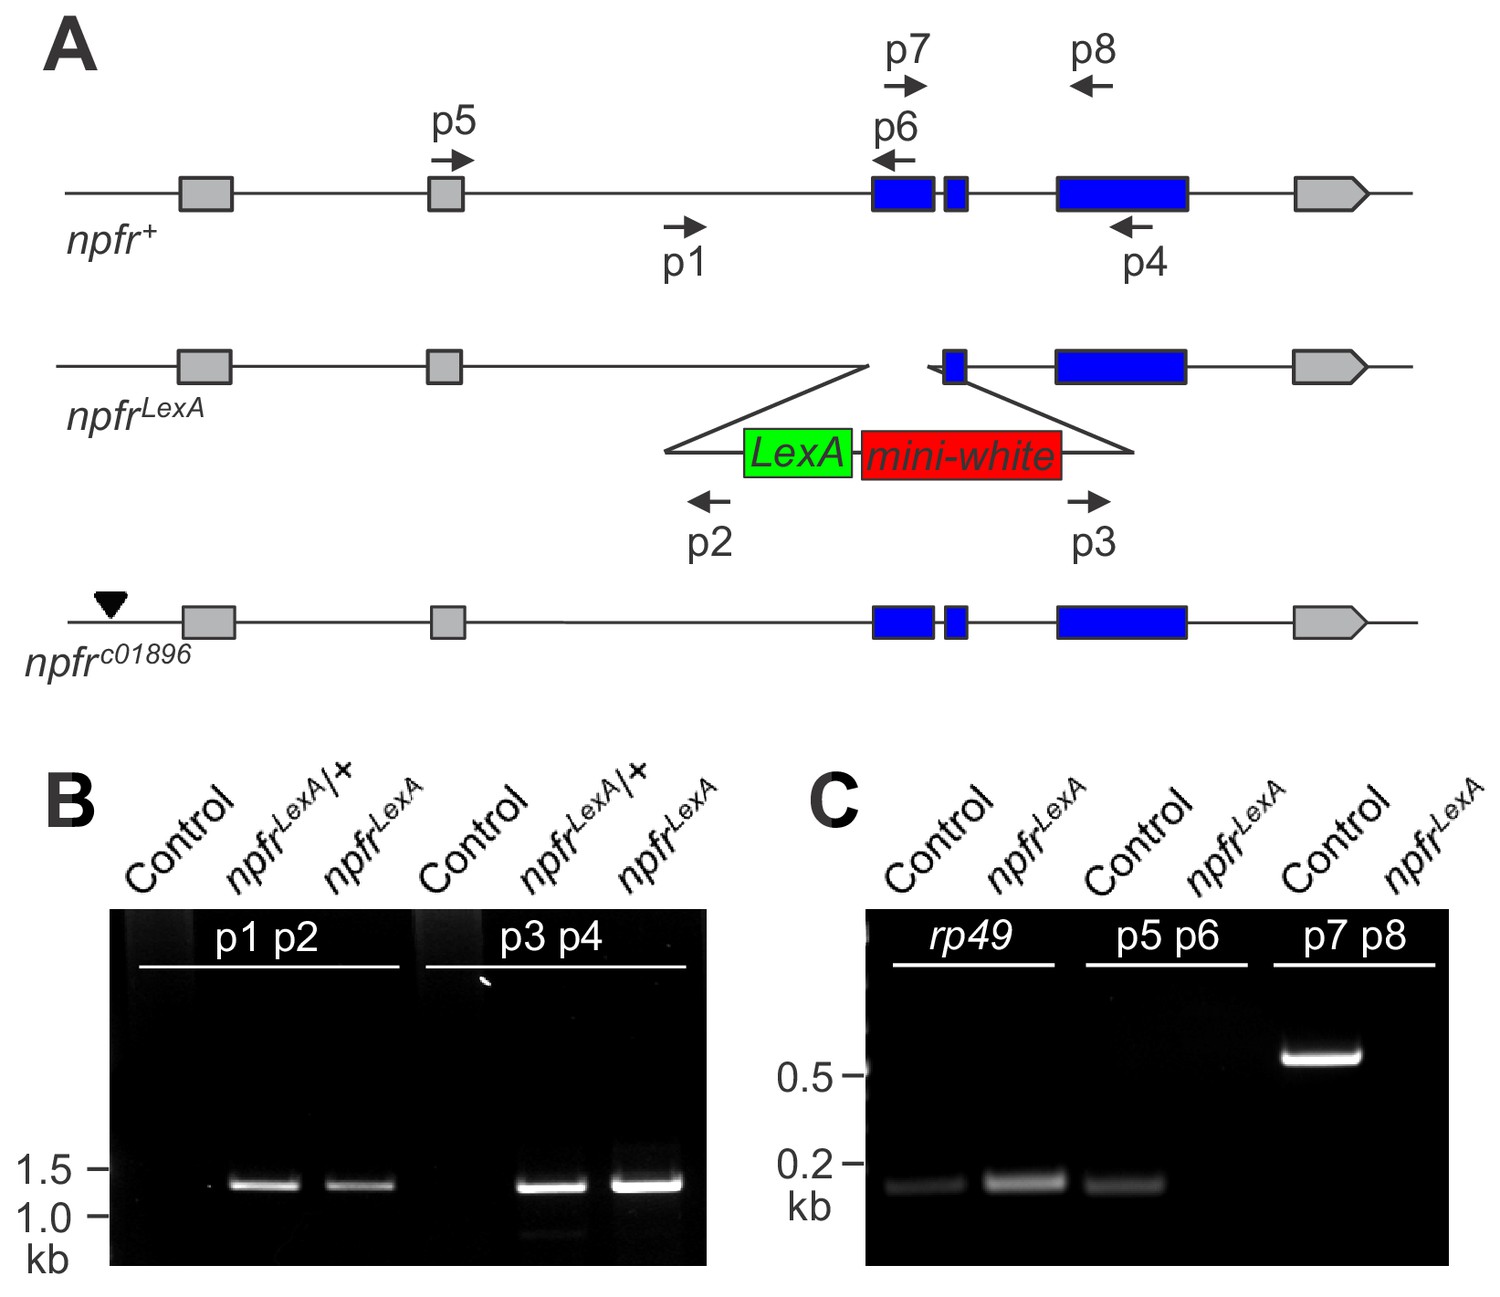
npfrLexA mutant.
(A) Schematic of the npfrLexA knock-in reporter/mutant line generated by CRISPR-HDR and npfrc01896 transposable element insertion mutant (inverted triangle indicates the transposon insertion site). (B) Genotyping using the indicated primers to perform PCR using genomic DNA confirmed the integration of LexA and the mini-white cassette into the npfr locus. The control is w1118-CS. (C) RT-PCR using RNA and the indicated primers confirmed that the npfr transcripts were disrupted in the npfrLexA mutant. RT-PCR amplification of rp49 from the control (w1118-CS) and npfrLexA served as a control for the quality of the RNA.
Figure 8
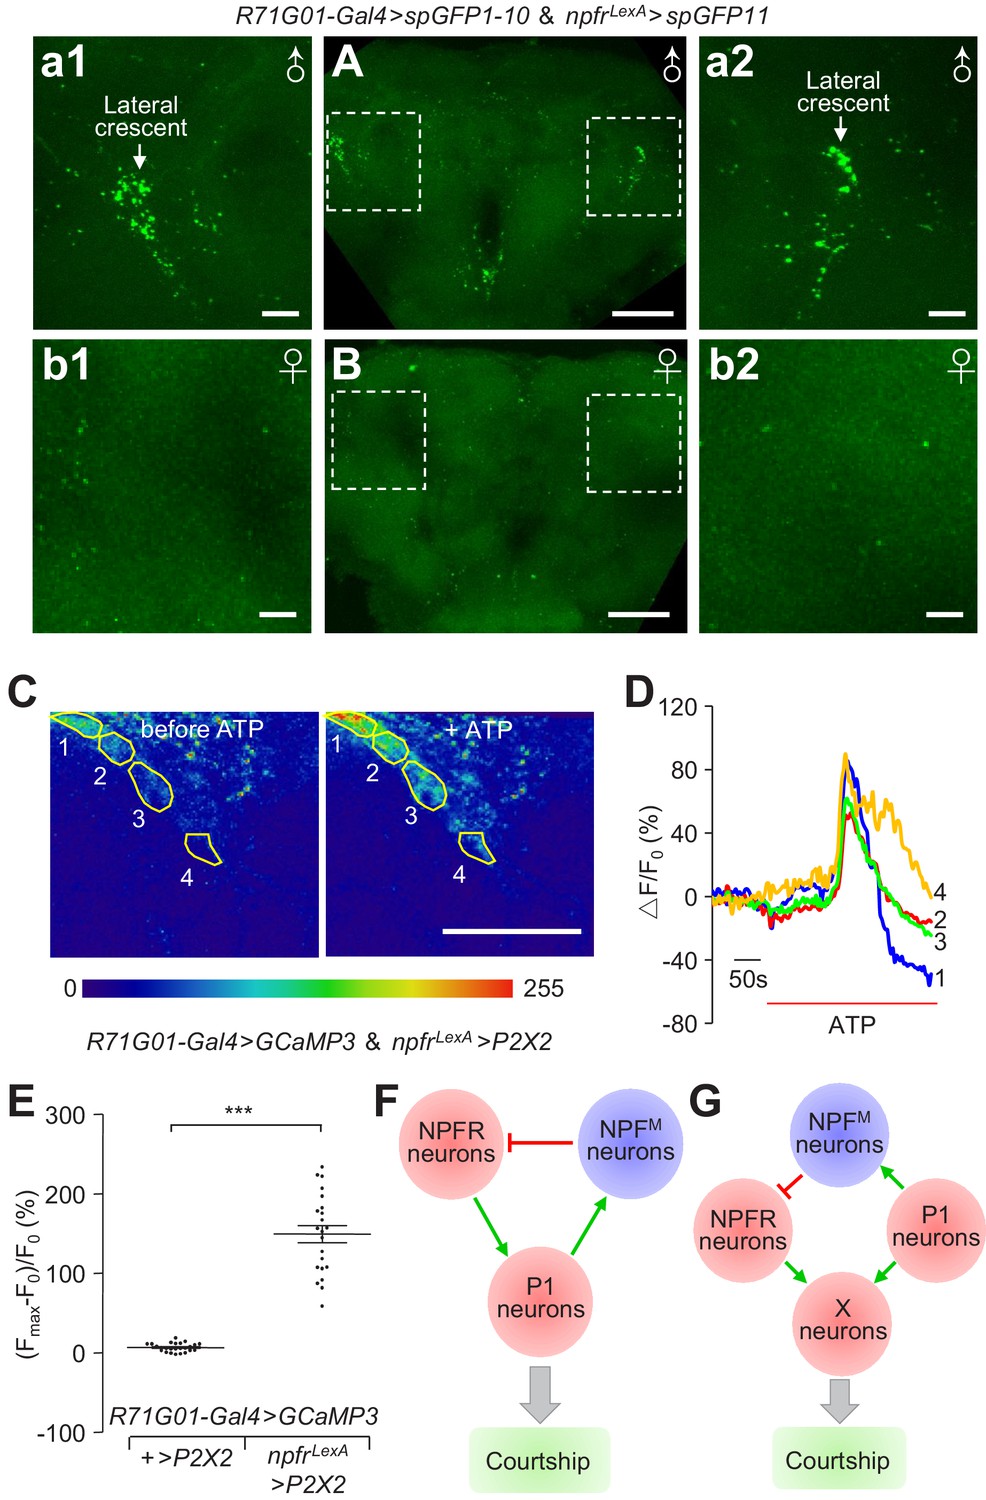
Anatomical and physiological interactions between NPFR and P1 neurons.
(A and B) GRASP analyses to test for close associations between npfr and P1 neurons. UAS-spGFP1-10,LexAop-spGFP11/R71G01-Gal4,npfrLexA male and female brains were imaged for reconstituted GFP signals. (A) Reconstituted GFP signals in a male brain. The boxes indicate the higher magnification images (a1 and a2) showing the bouton-shaped GFP signals in the lateral crescent within the LPC. (B) Reconstituted GFP signals in a female brain. The boxes indicate the zoomed in areas (b1 and b2) showing the lateral regions of the female brain, corresponding approximately to the lateral crescent regions in the male brain. The scale bars represent 50 μm in (A and B), and 10 μm in a1—a2 and b1—b2. A portion of the brain stacks, including the LPC structure, is shown. The full brain stacks are presented in the source data files. (C—E) Assaying effects on P1 neuronal activity with GCaMP3, after stimulating npfr neurons with ATP. GCaMP3 and P2X2 were expressed specifically in P1 and npfr neurons, respectively, in the following flies: UAS-GCaMP3, LeAop P2X2/+;R71G01-Gal4/npfrLexA. GCaMP3 responses were imaged in the LPC structures in male brains. (C) Representative heat maps indicating GCaMP3 fluorescence before and during ATP application. The numbers indicate the regions within the LPC structure measured. (D) Representative traces showing dynamic fluorescence changes in the specified regions circled in (C). (E) Maximal fluorescence increases [(Fmax-F0)/ F0 (%)] in response to ATP application. GCaMP3 fluorescence was recorded from 25 regions from five control brains, and 22 regions from four experimental brains. The scale bar in (C) represents 50 μm. The bars in (E) indicate means ± SEMs. To determine significance, we used the Mann Whitney test. ***p < 0.001. (F) A model illustrating the feedback loop of NPFM neurons in the regulation of P1 neuronal activity. (G) Illustration of a feedforward parallel model, in which target neurons (X neurons) receive parallel input from P1 neurons and NPFR neurons.
-
Figure 8—source data 1
Figure 8E Source data.
- https://doi.org/10.7554/eLife.49574.050
-
Figure 8—source data 2
Figure 8E Summary statistics.
- https://doi.org/10.7554/eLife.49574.051
-
Figure 8—source data 3
Figure 8A—B Full stacks.
- https://doi.org/10.7554/eLife.49574.052
Videos
Video 1
Morphology of male-specific NPFM neurons.
A male brain from a LexAop > mCherry > mCitrine/+;npfLexA/fruFLP fly was stained with anti-GFP (recognizes mCitrine) and anti-DsRed (recognizes mCherry). The npf and fru double positive (NPFM) neurons express mCitrine and are labeled by anti-GFP (Figure 3E—G). The remaining npf neurons are labeled by mCherry, and are stained with anti-DsRed. Imaris (Bitplane) software was used to prepare the reconstruction and animation.
Video 2
Animated representation of projections of NPFM and P1 neurons.
UAS > stop > mCD8::GFP/ LexAop > stop > myr::smGdP-V5;R71G01-Gal4,npfLexA/fruFLP male brain stained with anti-GFP and anti-V5. The P1 neurons were singly labeled with anti-GFP, while NPFM neurons were double labeled with anti-GFP and anti-V5. Imaris (Bitplane) software was used to prepare the reconstruction and animation.
Video 3
Activation of P1 neurons causes a significant increase in GCaMP3 fluorescence in NPFM neurons.
The NPFM neurons were imaged in a UAS-GCaMP3, LexAop P2X2/R71G01-LexA;npf-Gal4/+ male brain. ATP was applied to the brain sample as indicated.
Video 4
Activation of P1 neurons causes a significant increase in GCaMP3 fluorescence in NPFM neurons following application of ATP to the brain sample.
The NPFM neurons were imaged in a UAS- P2X2,LexAopGCaMP3/+;R71G01-Gal4,npfLexA/+ male brain. ATP was applied to the brain sample as indicated.
Video 5
Activation of NPFR neurons with ATP causes a significant increase in GCaMP3 fluorescence in the LPC structure of P1 neurons.
The imaging was performed on a UAS-GCaMP3, LexAop P2X2 /+;R71G01-Gal4/npfrLexA male brain. ATP was applied to the brain sample as indicated.
Additional files
-
Supplementary file 1
Key Resources Table.
- https://doi.org/10.7554/eLife.49574.054
-
Supplementary file 2
Genotypes of flies used in each figure and video.
- https://doi.org/10.7554/eLife.49574.055
-
Transparent reporting form
- https://doi.org/10.7554/eLife.49574.056
Download links
A two-part list of links to download the article, or parts of the article, in various formats.
Downloads (link to download the article as PDF)
Open citations (links to open the citations from this article in various online reference manager services)
Cite this article (links to download the citations from this article in formats compatible with various reference manager tools)
Neuropeptide F regulates courtship in Drosophila through a male-specific neuronal circuit
eLife 8:e49574.
https://doi.org/10.7554/eLife.49574


