Improving drug discovery using image-based multiparametric analysis of the epigenetic landscape
- Sanford Burnham Prebys Medical Discovery Institute, United States
- University of Toronto, Canada
- University of California, Santa Cruz, United States
Figures
Figure 1 with 5 supplements
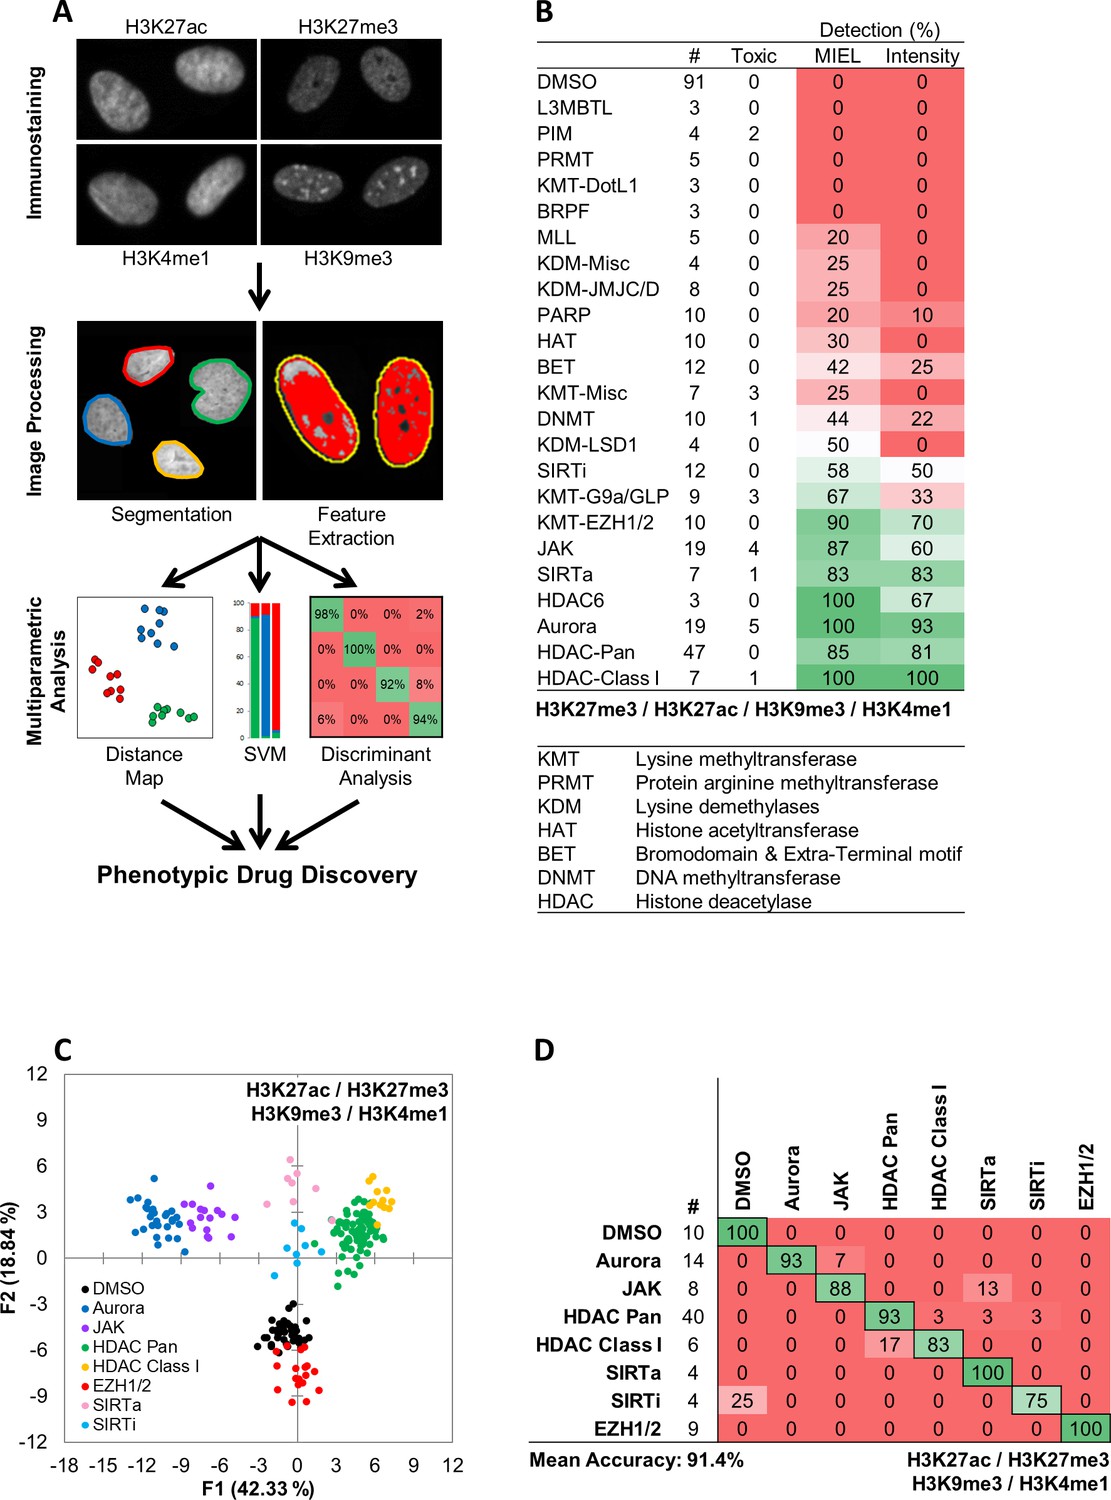
MIEL compares the epigenetic landscape of multiple cell populations and can be used to detect active epigenetic drugs across cell lines and drug concentrations.
(A) Flowchart of MIEL pipeline. Fixed cells were immunostained for the desired epigenetic modifications and imaged. Nuclei were segmented based on DNA staining (Hoechst 33342 or DAPI) and texture features were calculated from the pattern of immunofluorescence. The relative similarity of multiple cell populations was assessed by calculating the multi-parametric Euclidean distance between populations centers, and represented in 2D following MDS (distance map). Discriminant analysis is used to functionally classify whole cell populations based on their multi-parametric centers. SVM classification is used to separate single cells in each population and estimate populations overlap. (B) Table showing the fraction of epigenetic drugs in each functional category identified as active by either MIEL analysis employing texture features derived from images of GBM2 cells stained for H3K9me3, H3K4me1, H3K27ac, H3K27me3, or by intensity-based analysis using the same modifications (see Materials and methods). (C,D) Quadratic discriminant analysis using texture features derived from images of GBM2 cells treated with either DMSO or 85 active compounds (two technical replicates per compound; 38 DMSO replicates) stained for H3K9me3, H3K27me3, H3K4me1, H3K27ac. (C) Scatter plots depicting the first two discriminant factors derived from features of all four histone modification images for each cell population. (D) Confusion matrix showing classification results of discriminant analysis. Left column details number of compounds or DMSO replicates for each category in the test set (one replicate per compound). Numbers represent the percent of compounds classified correctly (diagonal) and incorrectly (off the diagonal).
Figure 1—figure supplement 1

Overview of the epigenetic drug library used in this study.
(A) Pi chart showing functional classes of epigenetic drugs used in the study. (B) Table detailing the molecular targets of epigenetic drugs used in the study.
Figure 1—figure supplement 2
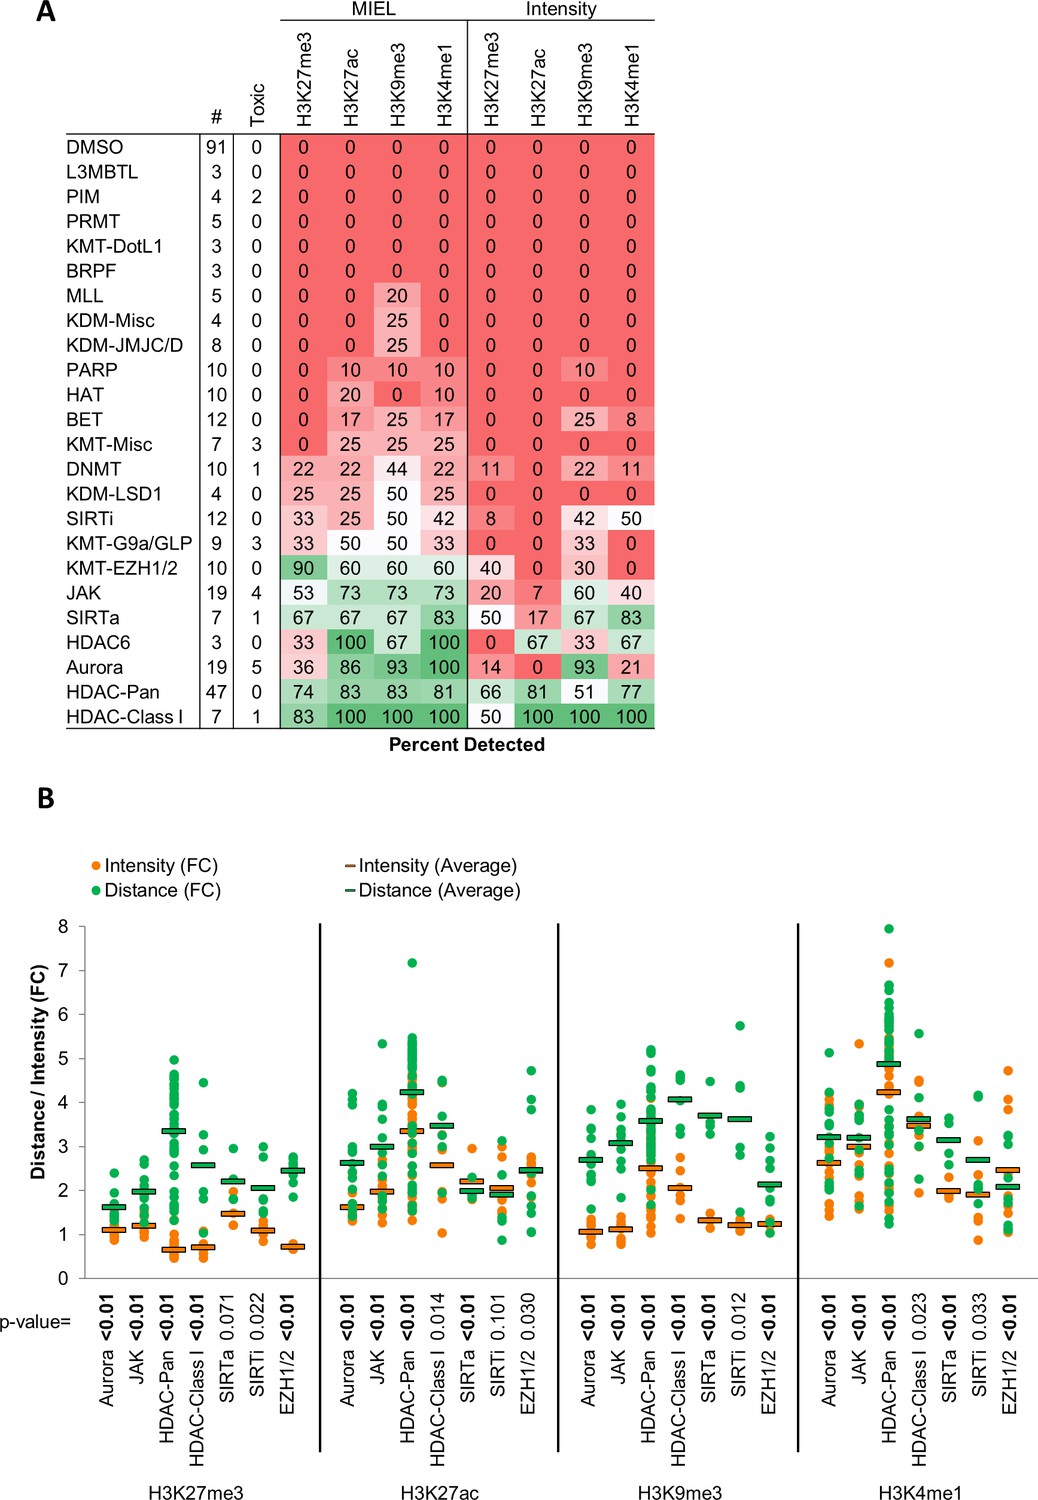
MIEL improves detection rates and effect size compared to intensity based methods.
(A) Table showing the fraction of epigenetic drugs in each functional category identified as active by either MIEL analysis employing texture features derived from images of GBM2 cells stained for either H3K9me3, H3K4me1, H3K27ac, H3K27me3 or by intensity-based analysis using individual modifications (see Materials and methods). (B) Bar graph depicting the average fold change in Euclidean distance from DMSO replicates induced by drugs from several functional categories as calculated using mean intensity or using texture features derived from images of individual histone modification (Mean ± SD; p-values calculated by ANOVA using Tukey’s HSD for multiple comparisons and shown in table; n for each category is shown in ‘A’).
Figure 1—figure supplement 3

Intensity based functional classification shows reduced classification accuracy compared with MIEL.
(A) Quadratic discriminant analysis using average fluorescent intensity derived from images of GBM2 cells treated with either DMSO or 85 active compounds (two technical replicates per compound; 38 DMSO replicates) stained for H3K9me3, H3K27me3, H3K4me1, H3K27ac. Scatter plots depicting the first two discriminant factors derived from features of all four histone modification images for each cell population. Confusion matrix showing classification results of the discriminant analysis. Left column details number of compounds or DMSO replicates for each category in the test set (one replicate per compound). Numbers represent the percent of compounds classified correctly (diagonal) and incorrectly (off the diagonal). (B) Quadratic discriminant analysis using texture features derived from images of GBM2 cells treated with either DMSO or 85 active compounds (two technical replicates per compound; 38 DMSO replicates) stained for H3K9me3, H3K27me3, H3K4me1, H3K27ac or DAPI. Confusion matrix showing classification results from discriminant analysis. Number of compounds or DMSO replicates for each category (one replicate per compound) is as shown in ‘b’. Numbers represent the percent of compounds classified correctly (diagonal) and incorrectly (off the diagonal).
Figure 1—figure supplement 4
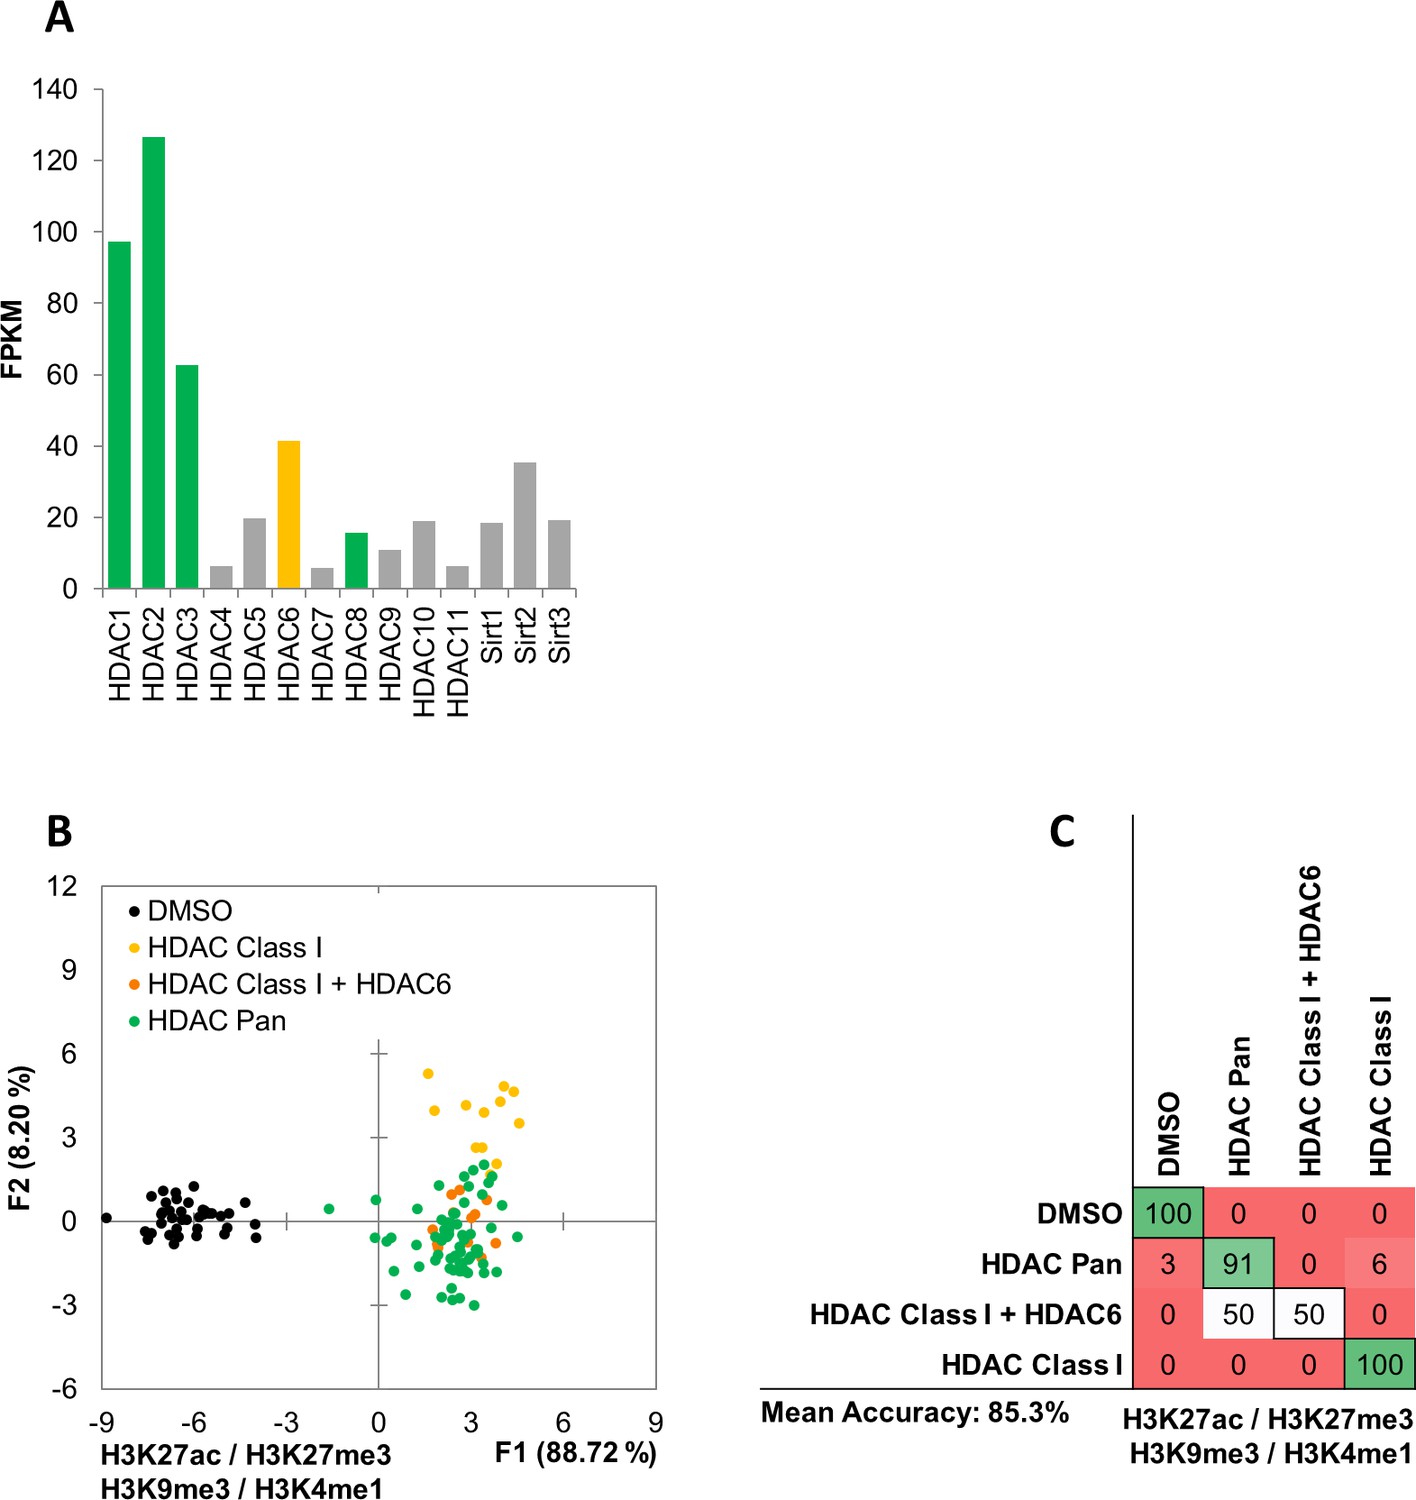
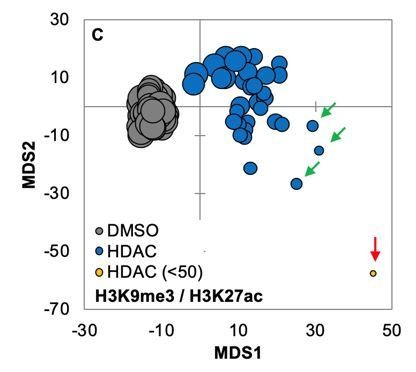
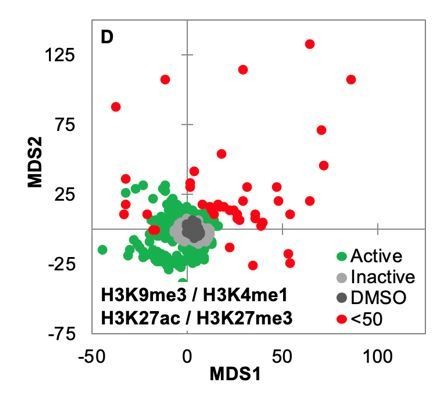
MIEL can distinguish between HDAC inhibitors with different specificity.
(A) Bar graph showing expression level (FPKM) of HDAC and SIRT genes in GBM2 cells obtained from RNA sequencing. (B, C) Quadratic discriminant analysis using texture features derived from images of GBM2 cells treated with either DMSO or 45 active compounds (two replicates per compound, 38 DMSO replicates) and stained for H3K9me3, H3K27me3, H3K4me1, H3K27ac. (B) Scatter plot depicting the first two discriminant factors derived from features of all histone modification images for each cell population. (C) Confusion matrix showing classification results for the discriminant analysis (test set: one replicate per compound; 10 DMSO replicates). Numbers represent the percent of correctly (diagonal) and incorrectly (off the diagonal) classified cell populations.
Figure 1—figure supplement 5
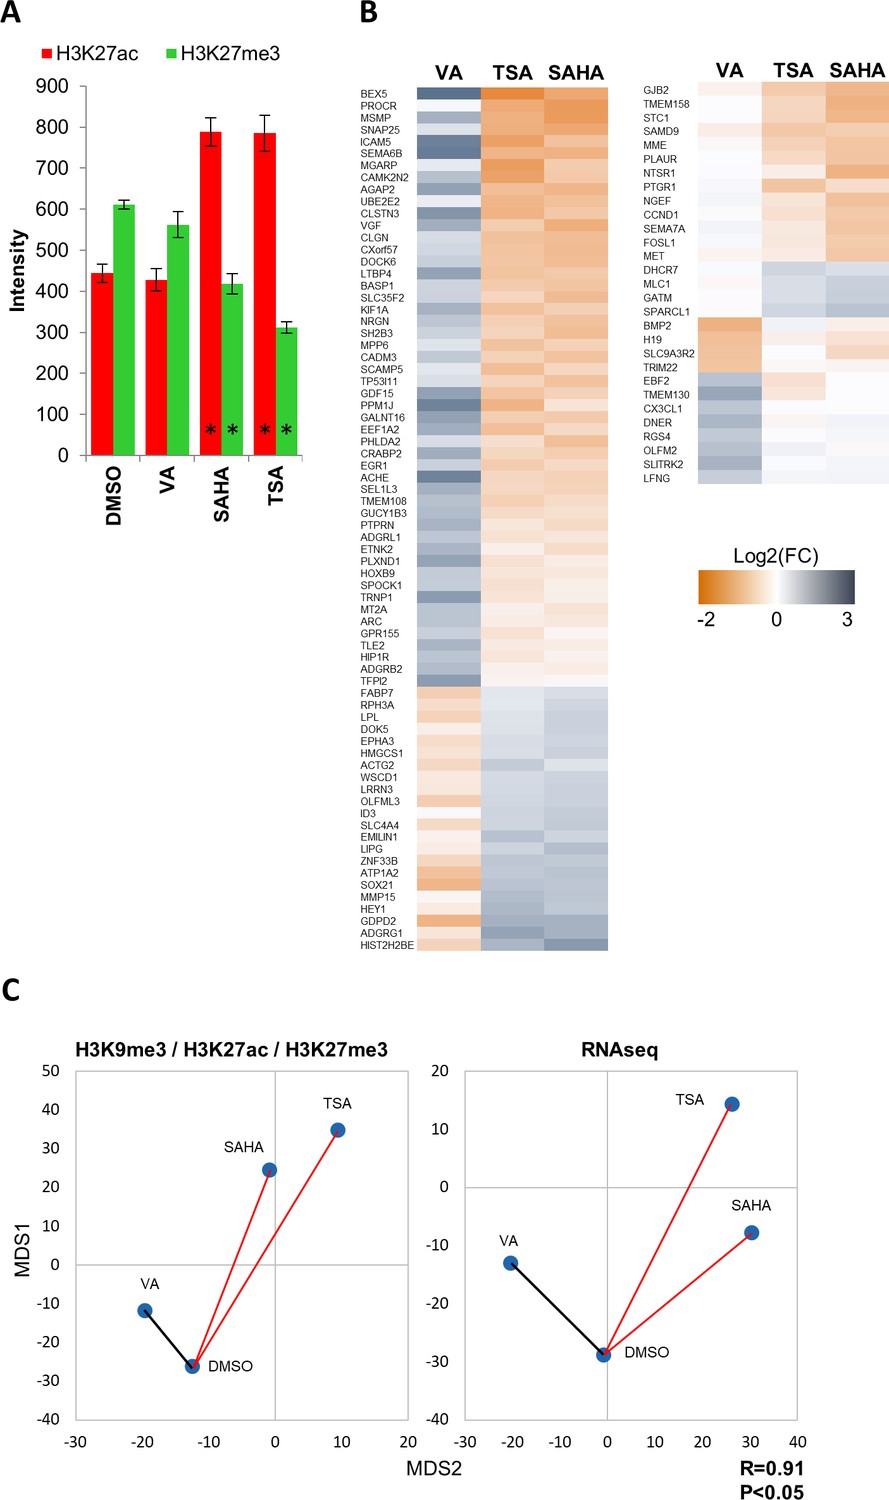
Low concentration valproic acid treatment induces epigenetic and transcriptomic changes distinct from that of known HDAC inhibitors.
(A) Bar graph showing average fold change in average intensity resulting from 24 hr treatment of GBM2 cells with DMSO, valproic acid (15 µM), SAHA (3 µM) or TSA (1 µM) (Mean ± SD; n = 6 technical replicates). (B) Heat maps showing log2 of fold change in expression (RNA sequencing) of select differentially expressed genes. (C) Distance map depicting the relative Euclidean distances between the multiparametric centroids GBM2 cells treated for 24 hr with either DMSO, valproic acid (15 µM), SAHA (3 µM) or TSA (1 µM). Left: Distances calculated using texture features derived from images of H3K9me3, H3K27ac and H3K27me3 marks. Right: Distances calculated using FPKM values of all expressed genes (13,119 genes; FPKM > 1 in at least one sample). R denotes Pearson correlation coefficient.
Figure 2 with 1 supplement
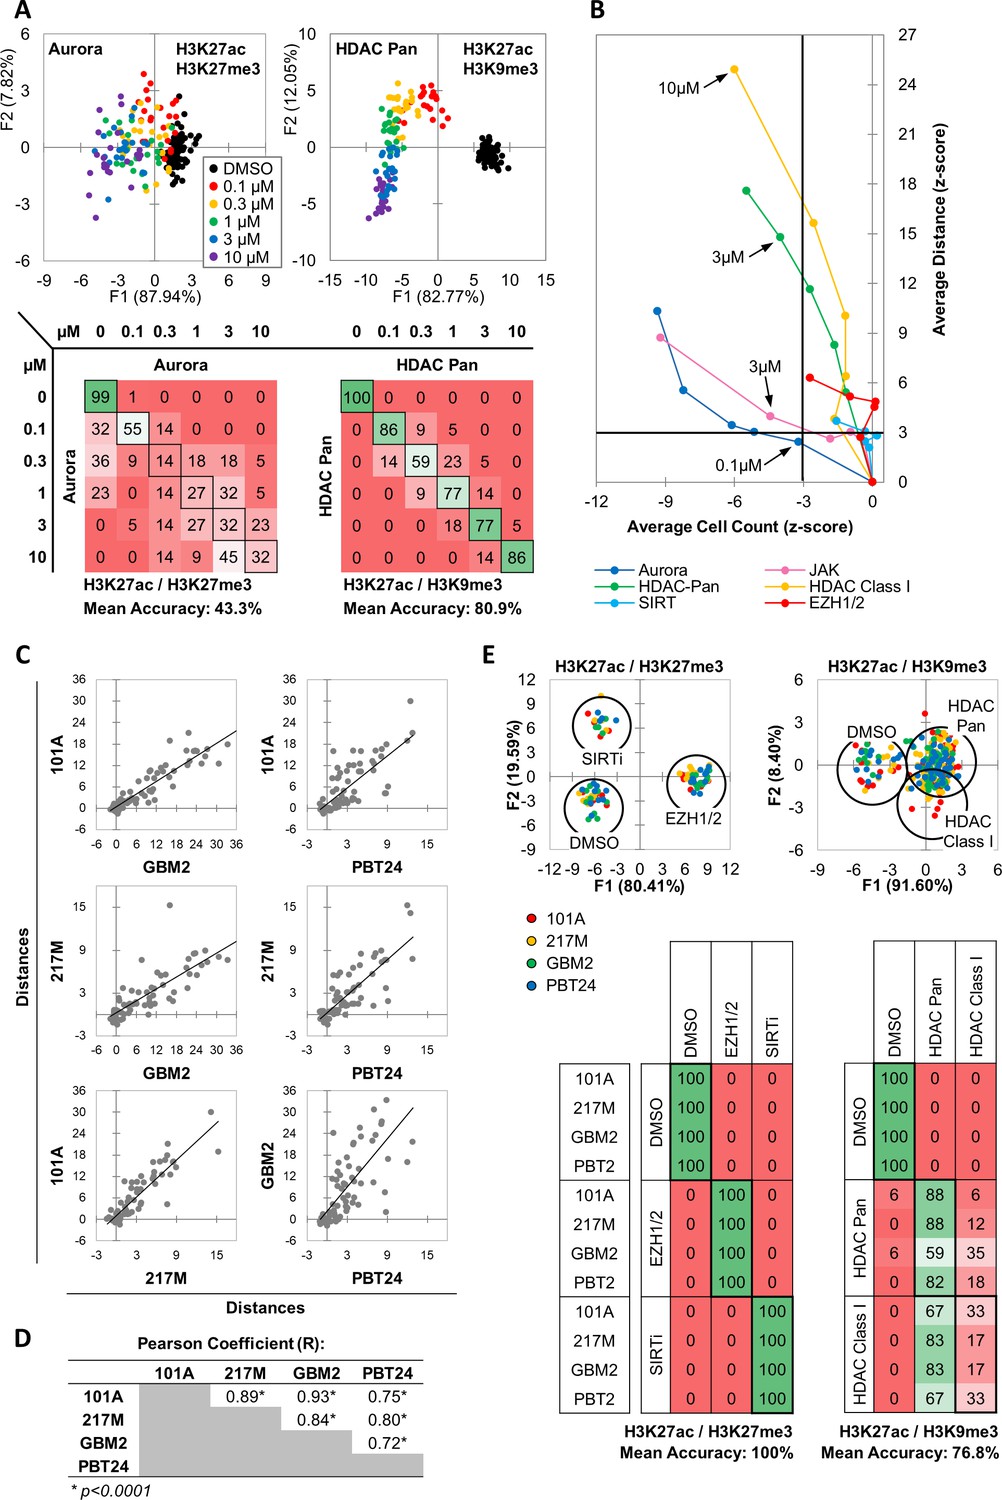
MIEL distinguishes between multiple categories of epigenetic drugs.
(A) Quadratic discriminant analysis using texture features derived from images of GBM2 cells treated with DMSO, 0.1, 0.3, 1, 3 or 10 µM Aurora kinase (n = 11 compounds, two replicates) or HDAC Pan inhibitors (n = 11 compounds, two replicates) stained for either H3K9me3+H3k27ac or H3K27me3 + H3K27ac. Scatter plots depict the first two discriminant factors for each cell population (drug replicate). Confusion matrixes showing results for the discriminant analysis. Numbers represent the percent of replicates classified correctly (diagonal) and incorrectly (off the diagonal). (B) Scatter plot comparing the magnitude of effect (average z-scored Euclidean distances from DMSO) to drug-induced cytotoxicity (average z-scored cell count). Euclidean distance was calculated using image texture features derived from images of H3K27ac + H3K27me3 (Aurora, JAK, SIRT, EZH1/2) or H3K27ac + H3K9me3 (HDAC Pan, HDAC Class I). Distances and cell counts represent average of all compounds in each category; nAurora = 11, nEZH1/2=5, nHDAC Class I=7, nHDAC Pan=43, nJAK = 15, nSIRTi = 4). Arrows denote the lowest concentration at which compounds of each category induce significant cytotoxicity. (C) Scatter plots comparing the z-scored Euclidean distances from DMSO replicates across 4 GBM lines (n = 57 compounds, z-score for each compound is the average of 3 technical replicates). Euclidean distances were calculated using image texture features derived from images of H3K27ac and H3K27me3 or H3K27ac and H3K9me3. (D) A table summarizing the Pearson coefficient and statistical significance of z-scored Euclidean distances shown in ‘C.’ (E) Quadratic discriminant analysis using texture features derived from images of GBM2, PBT24, 101A, 217 M cells treated with either DMSO, 5 EZH1/2 inhibitors, 3 SIRT inhibitors, 6 Class I HDAC inhibitors or 17 Pan HDAC inhibitors. Features derived from images of cells stained for H3K27me3 + H3K27ac (EZH1/2, SIRT) or H3K27ac + H3K9me3 (HDACi). Scatter plots depicting the first two discriminant factors for each cell population (two replicates per drug per cell line) color coded according to cell line. Confusion matrix showing classification results for the discriminant analysis (test set, one replicate per drug per cell line). Numbers represent the percent of compounds classified correctly (diagonal) and incorrectly (off the diagonal).
Figure 2—figure supplement 1

MIEL distinguishes between multiple categories of epigenetic drugs across different drug concentrations.
(A) Quadratic discriminant analysis using texture features derived from images of GBM2 cells treated with DMSO, 0.1, 0.3, 1, 3 or 10 µM of EZH1/2 (n = 6), SIRT (n = 4), JAK (n = 15) or HDAC Class I (n = 6) inhibitors (two replicates per compound) stained for either H3K27me3 and H3K27ac (EZH1/2, JAK, SIRT) or H3K9me3 and H3K27ac (HDAC Class I). Confusion matrixes showing results for the discriminant analysis. Numbers represent the percent of replicates classified correctly (diagonal) and incorrectly (off the diagonal). (B) Graph depicting the average Euclidean distance from DMSO replicates induced by SIRT inhibitors (n = 4 compounds, three replicates per compound, mean ± S.D, *p<0.01, unpaired two-tailed t-test), as calculated using image texture features derived from images of 217M, 101A, PBT24 and GBM2 cells stained for H3K27ac and H3K27me3. Distances for each compound in each line are normalized to average distance of each compound in all four lines (C) Left: Scatter plot comparing the average Euclidean distances shown in ‘b’ with Sirt1 expression in each cell line (FPKM values derived by RNA sequencing normalized to average FPKM across all four lines). Right: table showing FPKM values for Sirt1 in the 4 GBM lines.
Figure 3 with 1 supplement
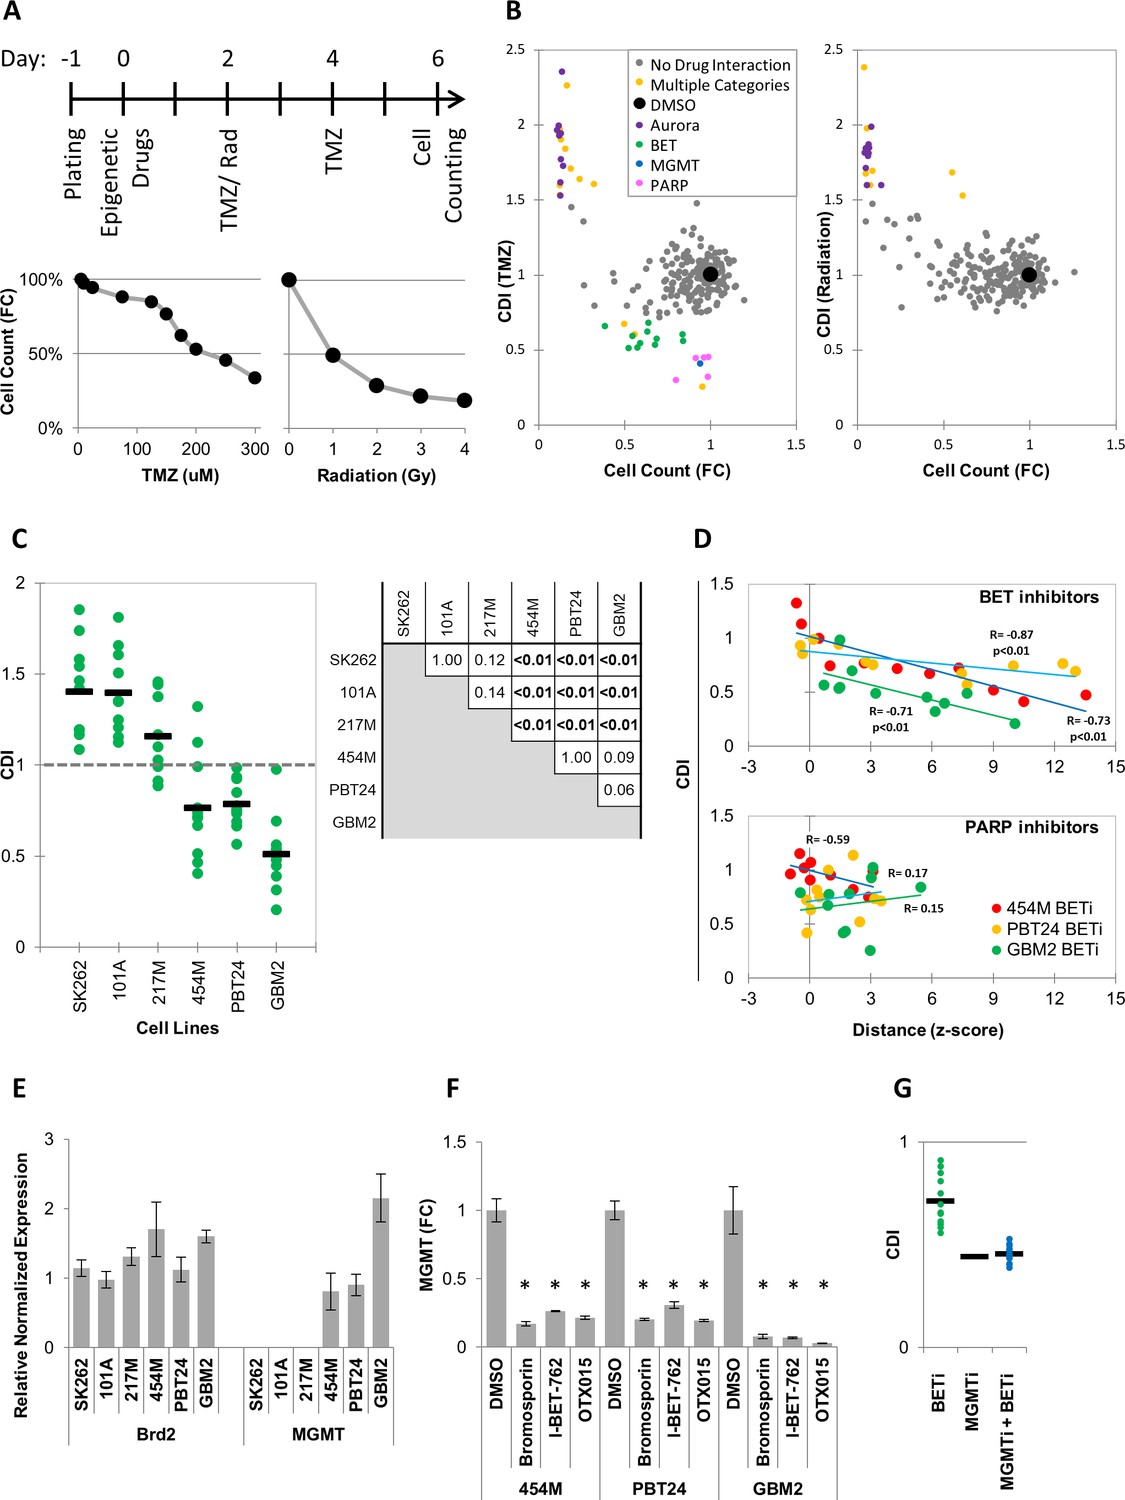
MIEL can be used to rank candidate drugs by activity.
(A) Top: Scheme describing the experimental setup used to identify synergy between epigenetic drugs and radiation or TMZ. Bottom: Scatter plots showing the fold reduction in GBM2 cell count following a 4 day treatment with varying TMZ concentration and radiation doses. (B) Scatter plots showing fold change in cell count (compared to DMSO treated cells) and coefficient of drug interaction (CDI) for synergy with TMZ (left) and radiation (right) for each drug (n = 222, values represent the average of 3 technical replicates). (C) Graph showing individual and average CDI for BET inhibitors in 6 GBM lines (n = 11 drugs, average of 3 technical replicates; p-values calculated by ANOVA using Tukey’s HSD for multiple comparisons between lines and shown in table). (D) Scatter plot showing the correlation between CDI and MIEL-derived activity (z-scored Euclidean distance from DMSO) of BET and PARP inhibitors (nBETi = 11; nPARPi = 10; values represent the average of 3 technical replicates) in 3 GBM lines (454M, PBT24, GBM2). (E) Bar graph showing the relative normalized expression of Brd2 and MGMT in 6 GBM lines as measured by qPCR (Mean ± SD; n = 3 technical repeats). (F) Bar graph showing fold reduction in MGMT expression following treatment with BET inhibitors in three different GBM lines as measured by qPCR (Mean ± SD; n = 3 technical repeats). (G) Graph showing individual and average TMZ sensitization CDI for BETi, MGMTi (Lomeguatrib) and BETi and MGMTi in GBM2 cells (n = 11 drugs, values represent the average of 3 technical replicates).
Figure 3—figure supplement 1
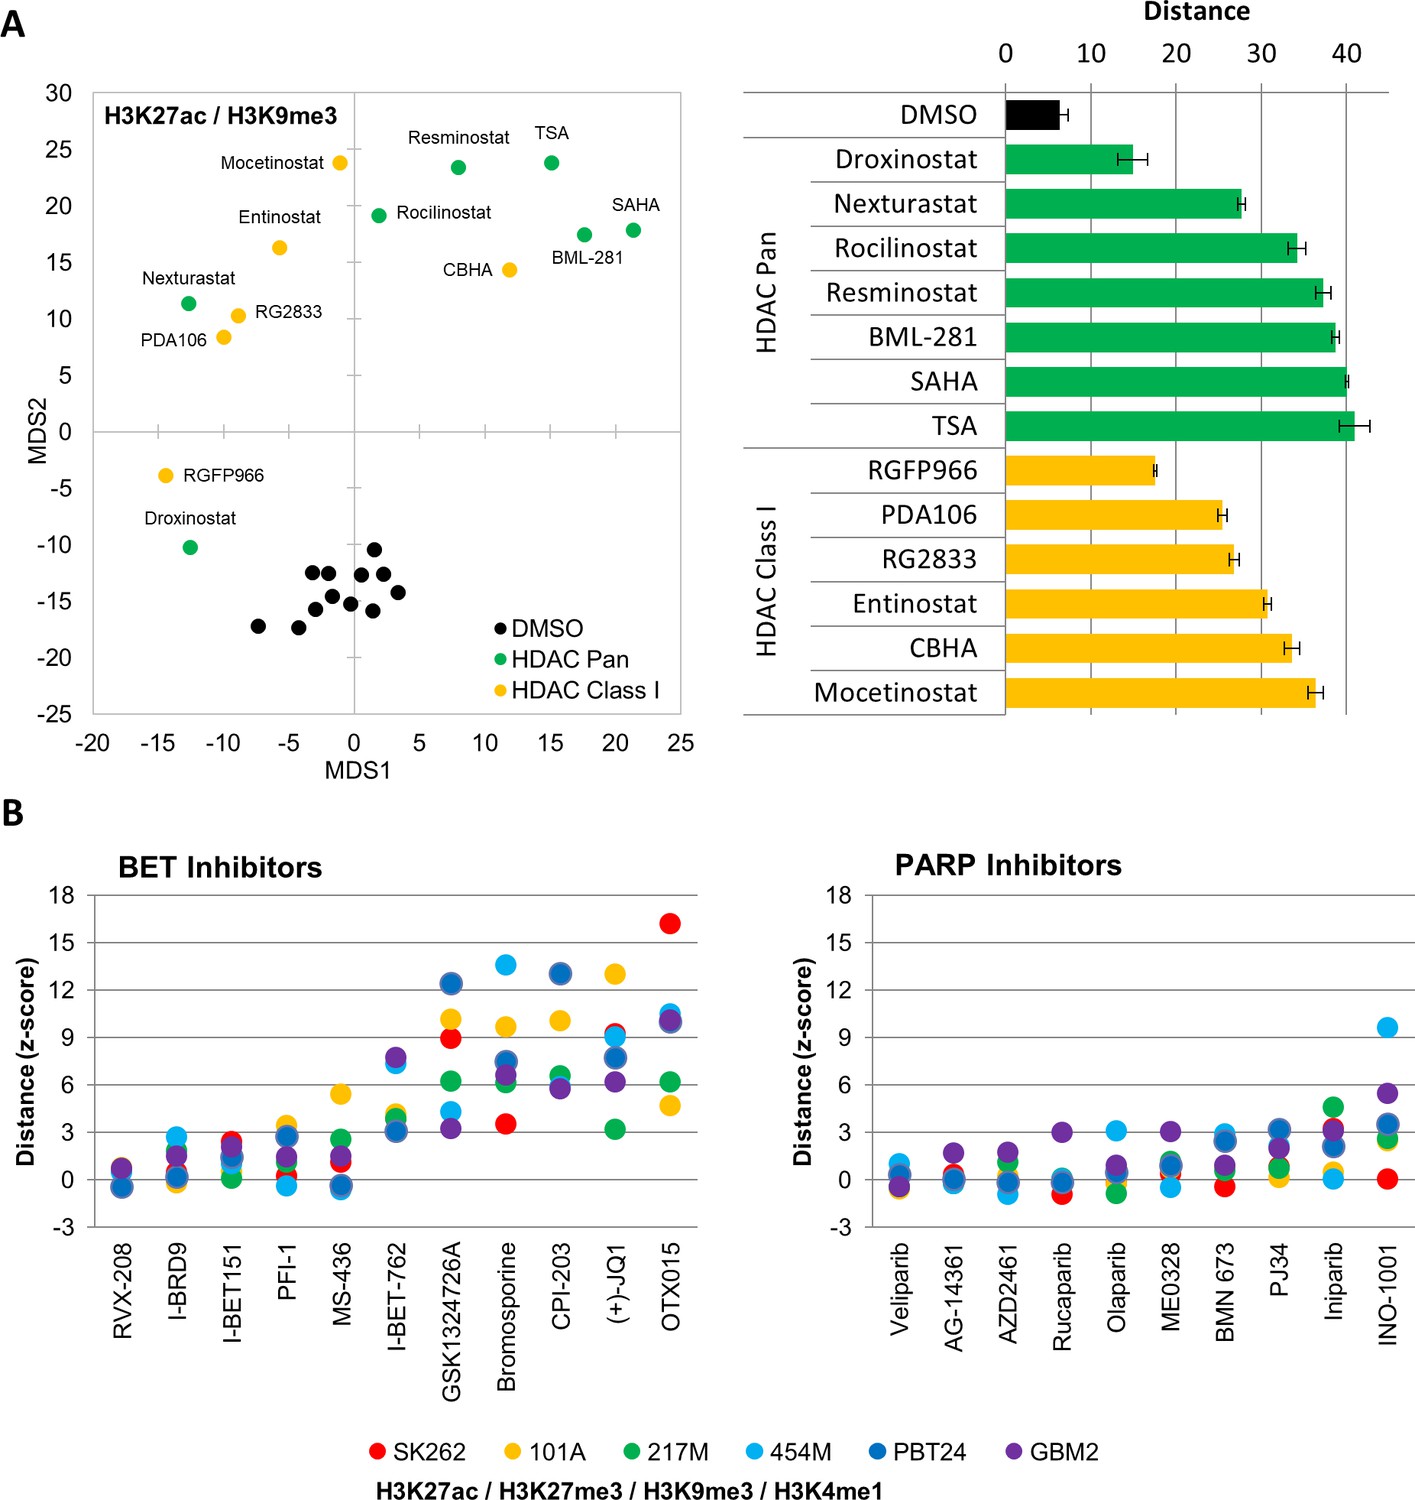
MIEL can report relative drugs activity.
(A) Left: Distance map depicting the relative Euclidean distance between the multiparametric centroids of GBM2 cells treated with either DMSO (n = 12 replicates), HDAC Pan (n = 7 compounds; showing average or three replicates) or HDAC Class I inhibitors (n = 6 compounds; showing average or three replicates). Distances calculated using texture features derived from images of cells stained with H3K9me3 and H3K27ac. Right: Bar graph depicting the Euclidean distance from DMSO replicates (Mean ± SD; n = 3 technical replicates) induced by drug treatments shown in ‘A’. (B) Graph depicting the average fold change in Euclidean distance from DMSO replicates induced by individual BET (left) and PARP (right) inhibitors as calculated using texture features derived from images of H3K27ac and H3K9me3 (n = 3 replicates per compound).
Figure 4 with 5 supplements
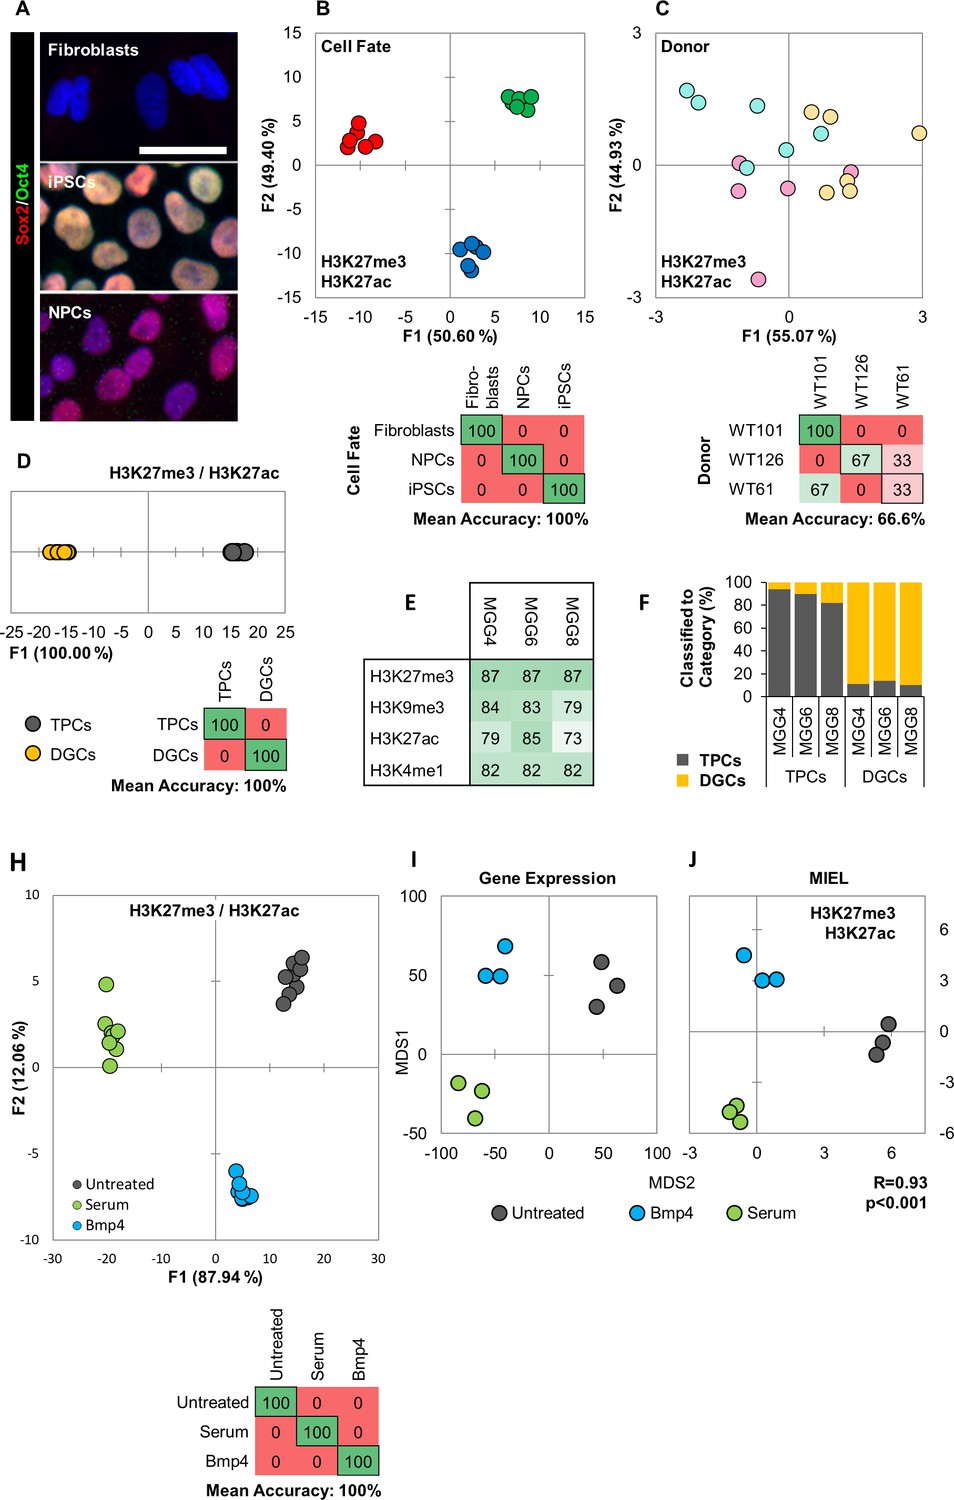
MIEL can distinguish between cell fates and identify glioblastoma differentiation.
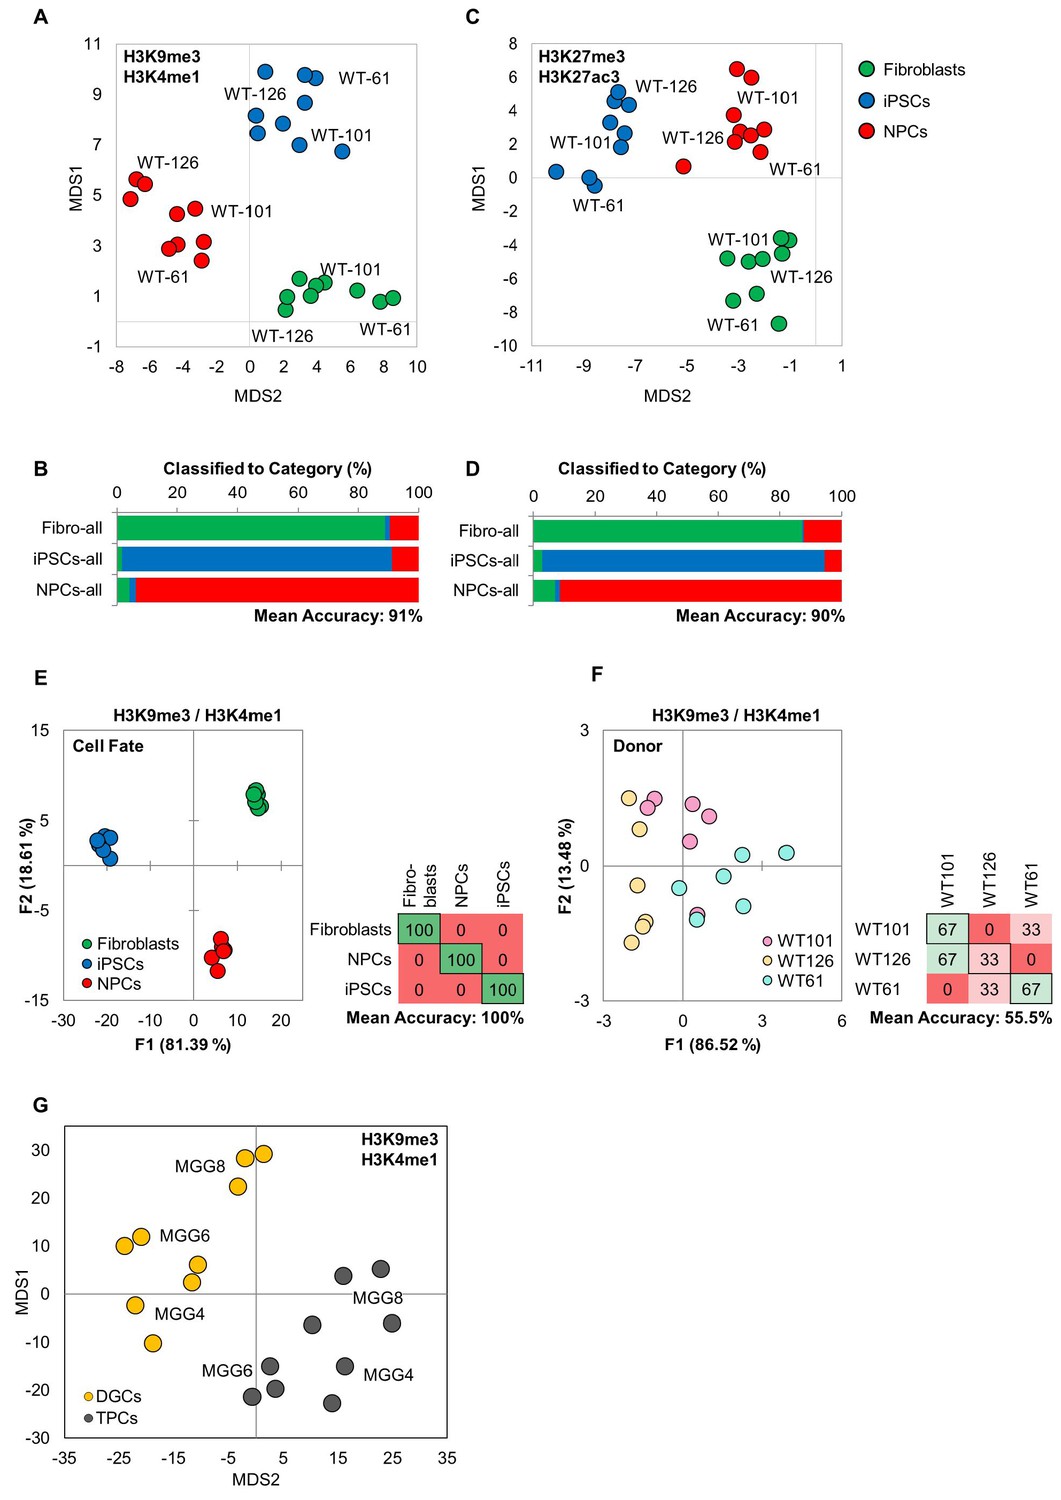
(A) Hoechst 33342 stained (blue), and Sox2 (red) and Oct4 (green) immunofluorescence labeled fibroblasts (Sox2-/Oct4-), iPSCs (Sox2+/Oct4+) and NPCs (Sox2+/Oct4-). Scale bar, 50 µm. (B, C) Quadratic discriminant analysis separating either cell fates or cell lines using texture features derived from images of fibroblasts, iPSCs, and NPCs lines from three human donors (WT-61, WT-101 and WT-126; three technical replicates each); stained for H3K9me3 and H3K4me1. (B) Discriminant analysis separating the different cell types. Scatter plot depicting the first two discriminant factors for each cell population (two replicate per cell line and cell type). Confusion matrixes showing classification results for discriminant analysis (test set: one replicate per cell line and cell type) Numbers represent the percent of correctly (diagonal) and incorrectly (off the diagonal) classified cell populations. (C) Discriminant analysis attempting to separate different cell lines. Scatter plot depicting the first two discriminant factors for each cell population (two replicates per cell line and cell type). Confusion matrixes showing classification results for discriminant analysis (test set: one replicate per cell line and cell type). Numbers represent the percent of correctly (diagonal) and incorrectly (off the diagonal) classified cell populations. (D, E, F) TPC and DGC cell lines derived simultaneously from tumors of 3 human donors (MGG4, MGG6, MGG8; three technical replicates each); stained for H3K9me3, H3K4me1. (D) Quadratic discriminant analysis separating TPCs and DGCs using image texture features. Scatter plot depicting the first discriminant factor for each cell population (two replicates per cell line). Confusion matrix showing classification results for discriminant analysis (test set: one replicate per cell line). Numbers represent the percent of correctly (diagonal) and incorrectly (off the diagonal) classified cell populations. (E) Pairwise classification of single TPC and DGC cells using an SVM classifier trained on texture features derived from images of H3K27me3, H3K9me3, H3K27ac, or H3K4me1. Numbers correspond to the percent of correctly classified cells for each line using indicated epigenetic marks. (F) Bar graph showing results of SVM classification for single TPC and DGC cells using a classifier trained on texture features derived from images of H3K27ac and H3K27me3 marks in the MGG4 line. (H) Quadratic discriminant analysis using texture features derived from images of untreated or 2 days serum or Bmp4 treated GBM2, 101A, SK262 and 454 M cells (three replicates per cell lines per treatment) and stained for H3K9me3, H3K4me1. Scatter plot depicting the first two discriminant factors for each cell population (two replicates per cell lines per treatment). Confusion matrix showing classification results for discriminant analysis (test set: one replicate per cell line per treatment). Numbers represent the percent of correctly (diagonal) and incorrectly (off the diagonal) classified cell populations. (I) Distance map depicting the relative Euclidean distance between the transcriptomic profiles of DMSO-, Bmp4- and serum-treated GBM2 cells calculated using FPKM values of all expressed genes (14,376 genes; FPKM > 1 in at least one sample). Each treatment in triplicates. (J) Distance map depicting the relative Euclidean distance between the multiparametric centroids of DMSO-, Bmp4- and serum-treated GBM2 cells calculated using texture features derived from images of H3K27ac and H3K27me3 marks. Each treatment in triplicates. R denotes Pearson correlation coefficient.
Figure 4—figure supplement 1
MIEL can distinguish between multiple cell fates.
(A, B) Distance map depicting the relative Euclidean distance following MDS between the multiparametric centroids of 9 cell lines: three fibroblasts, 3 iPSCs, and 3 NPCs, calculated from texture feature values derived from images of (A) H3K9me3 and H3K4me1 or (B) H3K27ac and H3K27me3 marks. Each cell line appears as three technical triplicates. (C, D) Three-way classifications of the 9 cell lines using an SVM classifier trained on image texture features derived from images of pooled fibroblasts, iPSCs, and NPCs stained for (c) H3K9me3 and H3K4me1 or (d) H3K27ac and H3K27me3. (E, F) Quadratic discriminant analysis separating either cell fates or cell lines using texture features derived from images of fibroblasts, iPSCs, and NPC lines from three human donors (WT-61, WT-101 and WT-126; three technical replicates each); stained for H3K27me3 and H3K27ac. (E) Discriminant analysis separating the different cell types. Scatter plot depict the first two discriminant factors for each cell population (two replicate per cell line and cell type). Confusion matrixes showing results of classification for the discriminant analysis (test set: one replicate per cell line and cell type) Numbers represent the percent of correctly (diagonal) and incorrectly (off the diagonal) classified cell populations. (F) Discriminant analysis attempting to separate the different cell lines. Scatter plot depicting the first two discriminant factors for each cell population (two replicate per cell line and cell type). Confusion matrixes showing results of classification for discriminant analysis (test set: one replicate per cell line and cell type). Numbers represent the percent of correctly (diagonal) and incorrectly (off the diagonal) classified cell populations. (G) Distance map depicting the relative Euclidean distance between the multiparametric centroids of 3 genetically distinct TCP and DGC lines calculated using texture features derived from images of H3K9me3 and H3K4me1 marks.
Figure 4—figure supplement 2
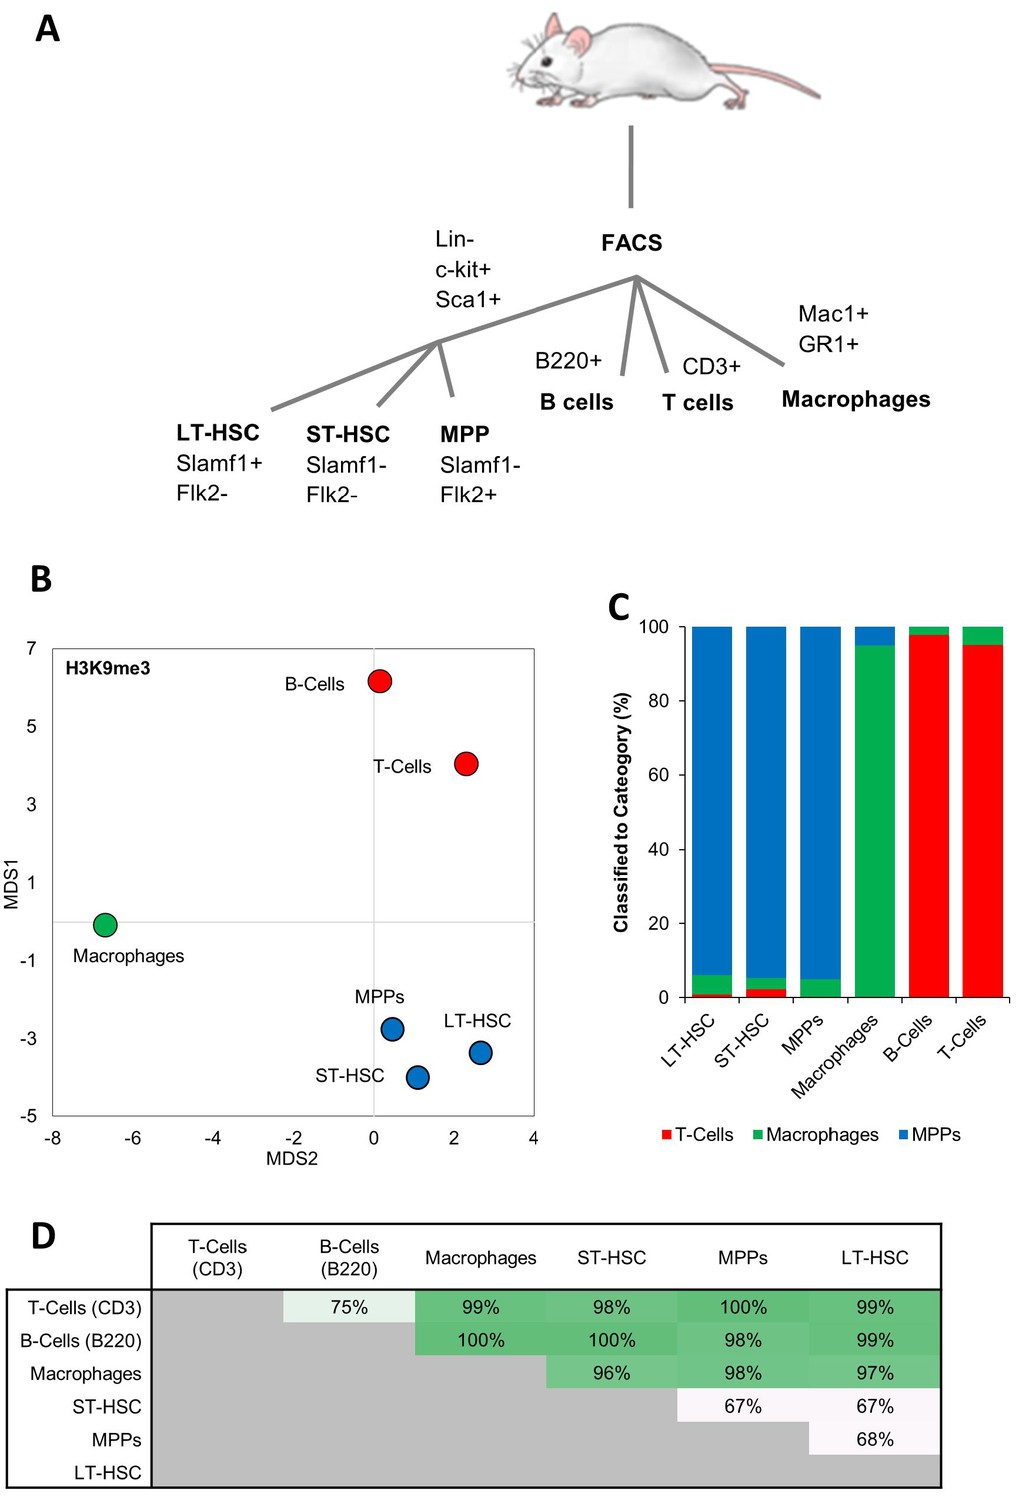
MIEL can distinguish between cells from different hematopoietic lineages.
(A) Surface markers for isolation of hematopoietic cells by flow cytometry. (B) Distance map depicting the relative Euclidean distance between the multiparametric centroids of image texture features from immunofluorescence micrographs of 6 hematopoietic cell types. (C) Three-way classification of hematopoietic stem or progenitor cells, T and B lymphoid cells, and macrophages, using an SVM classifier trained on randomly selected subsets of MPPs, macrophages, and T-cells. (D) Accuracy of pairwise SVM classification between the 6 hematopoietic cell types.
Figure 4—figure supplement 3
Serum and Bmp4 reduce expression of genes associated with undifferentiated glioblastoma TPCs.
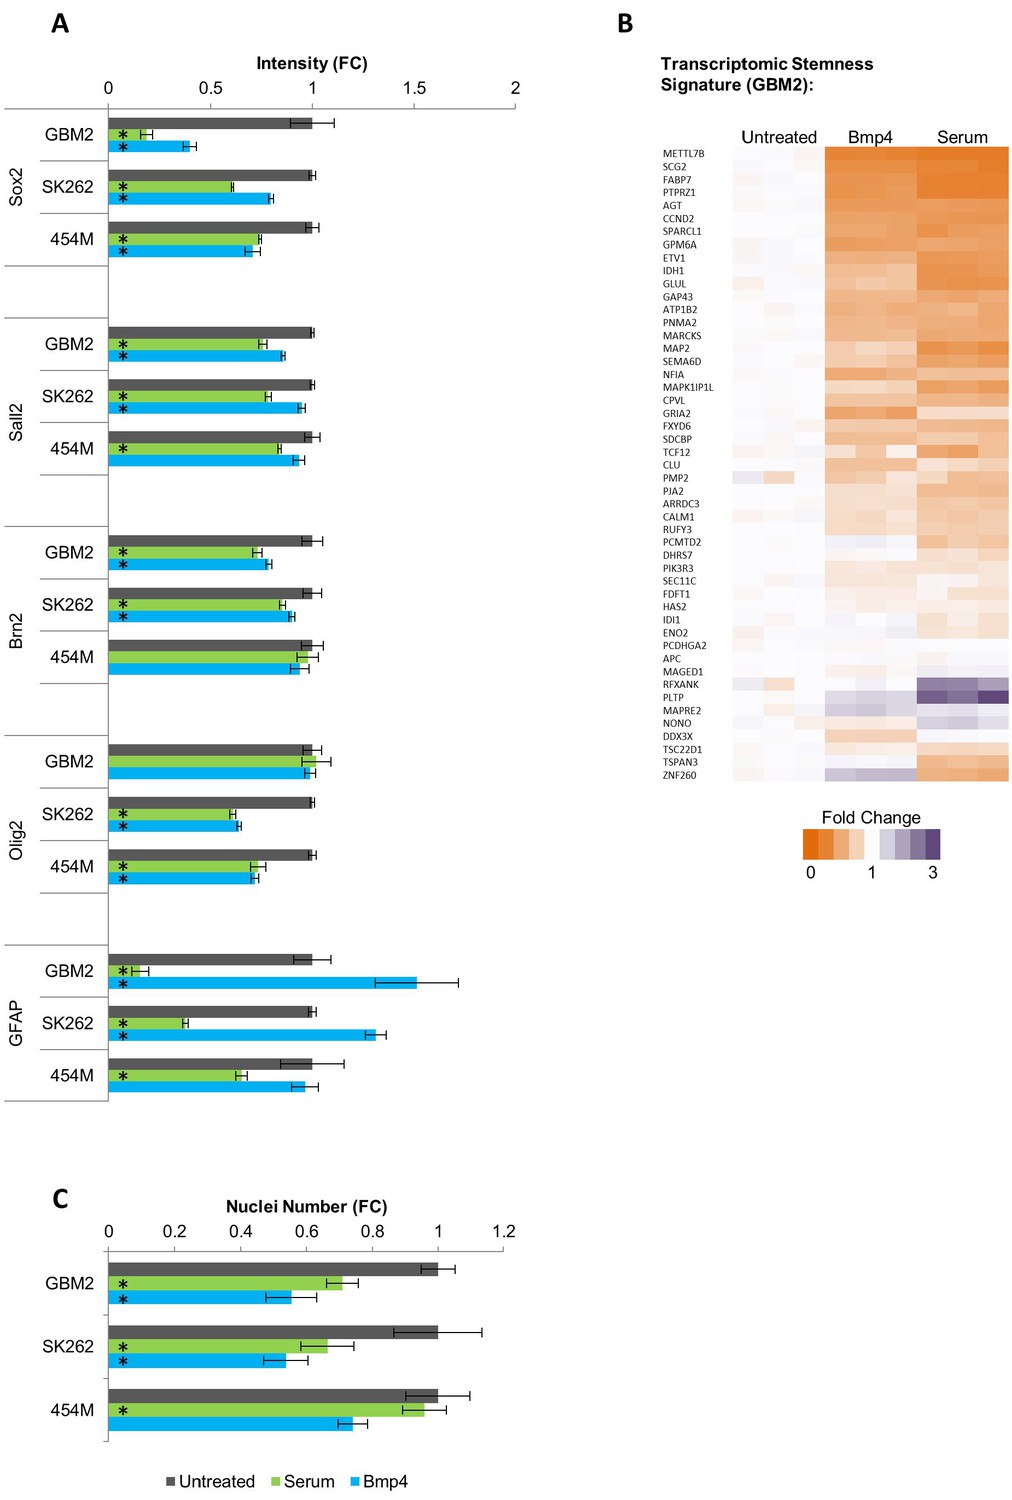
(A) Fold change in immunofluorescence intensity of Sox2, Sall2, Brn2, Olig2, and GFAP for primary human GBM lines treated for 3 days with serum or Bmp4 compared to untreated cells (mean ± S.D, n=3, *p<0.05, unpaired two-tailed t-test). (B) Fold change in nuclei number of 3 days serum- or Bmp4- treated primary human GBM lines compared to untreated cells (mean ± S.D, n=3, *p<0.05, unpaired two-tailed t-test). (C) Heat map showing expression changes of genes identified as the TPC stemness signature in GBM2 cells following 3 days treatment with either serum or Bmp4 (values shown as fold change: FPKM value in every sample divided by average FPKM value of the 3 untreated samples).
Figure 4—figure supplement 4
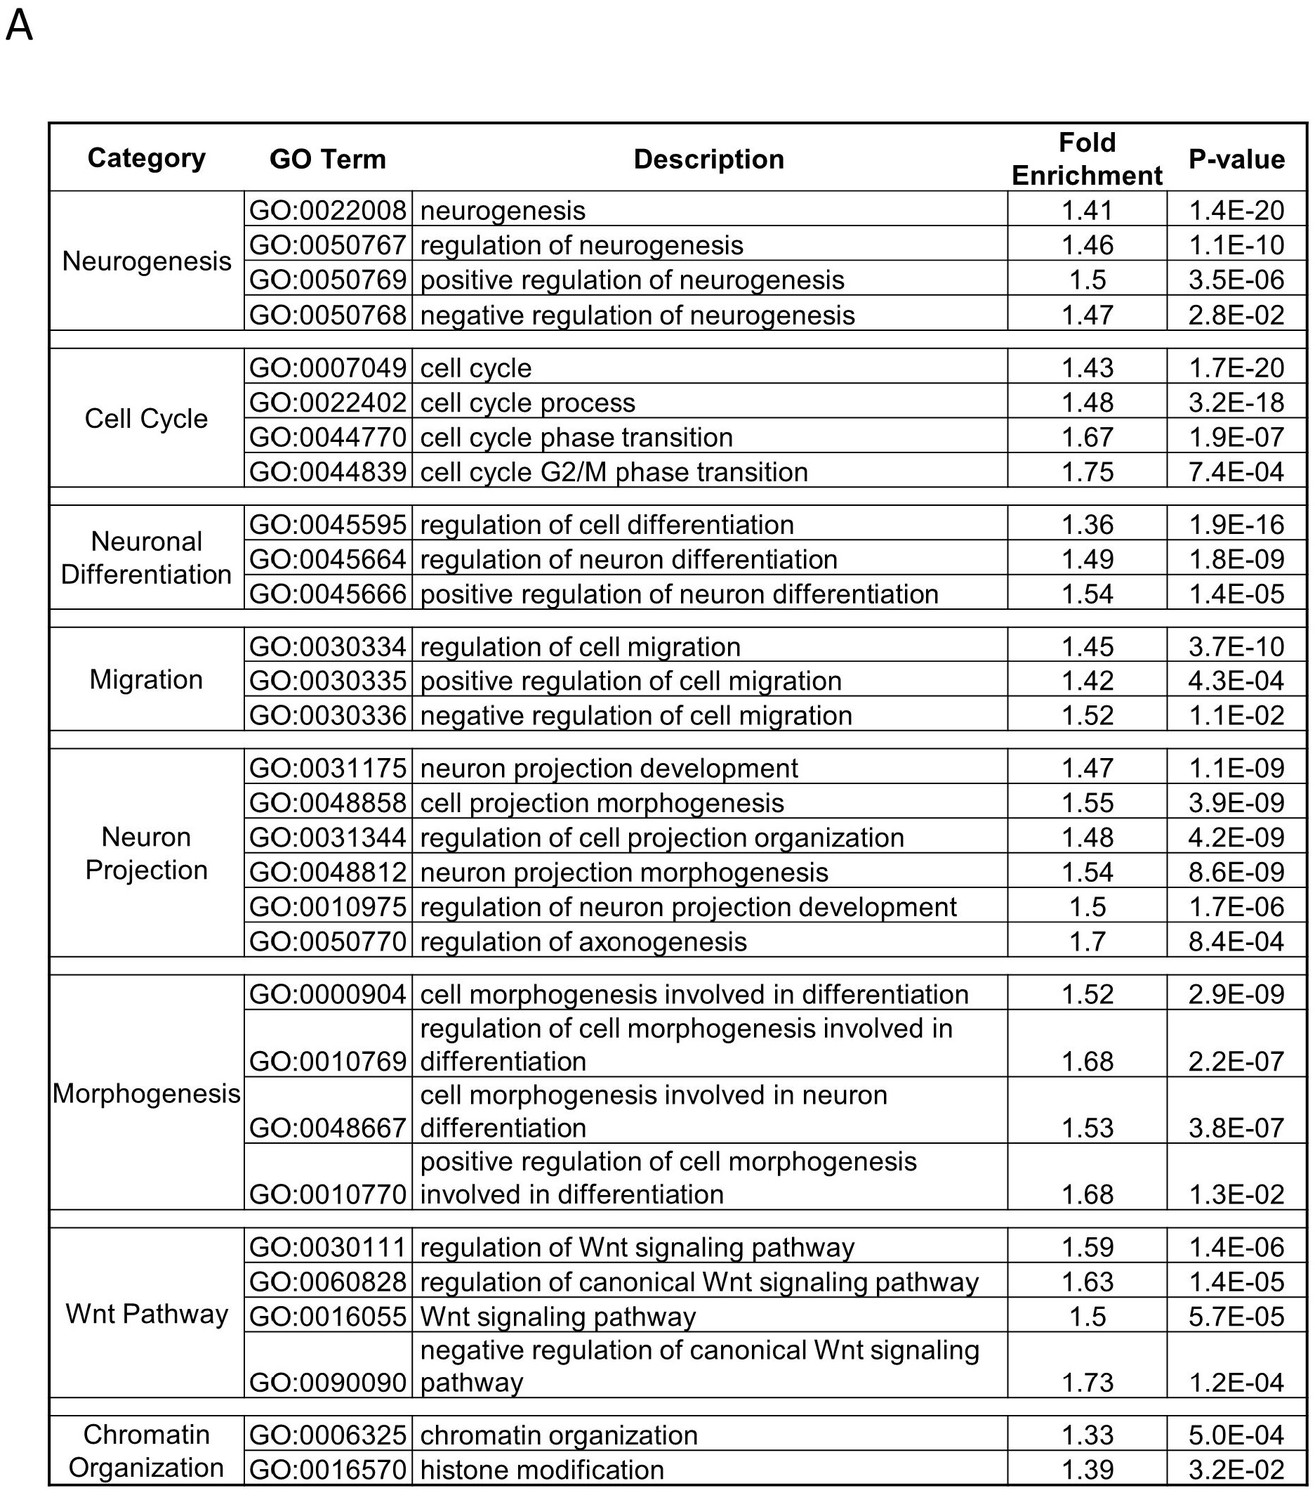
GO analysis of transcriptomic changes induced by serum and Bmp4.
Figure 4—figure supplement 5
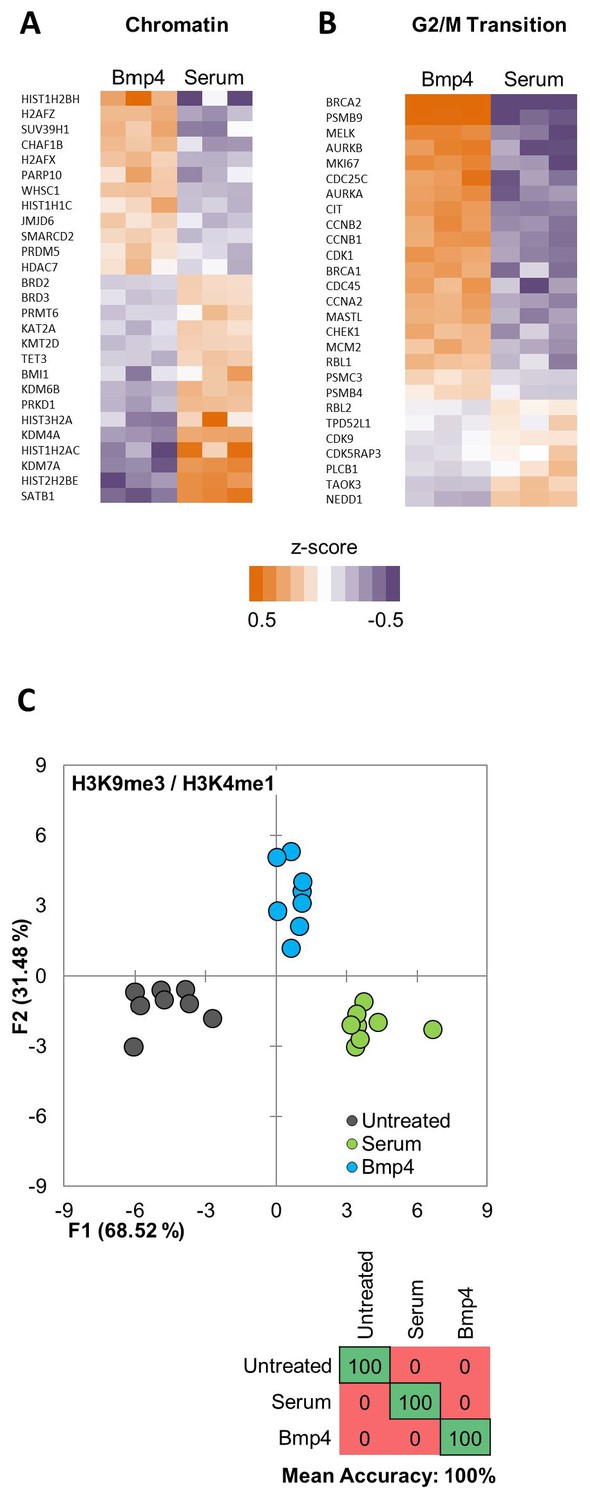
Serum and Bmp4 treatments induce distinct epigenetic and transcriptomic changes.
(A, B) Heat maps showing differential expression of selected genes from Gene Ontology (GO) terms (A) chromatin-modification (GO:0006325) or (B) cell-cycle G2/M phase transition (GO:0044839). Expression levels (FPKM) are represented as z-score to highlight difference in levels of expression. (C) Quadratic discriminant analysis using texture features derived from images of untreated or 2 days serum- or Bmp4- treated GBM2, 101A, SK262 and 454 M cells (three replicates per cell lines per treatment) and stained for H3K27me3 and H3K27ac. Scatter plot depicting the first two discriminant factors for each cell population (two replicates per cell lines per treatment). Confusion matrix showing classification results for the discriminant analysis (test set: one replicate per cell line per treatment). Numbers represent the percent of correctly (diagonal) and incorrectly (off the diagonal) classified cell populations.
Figure 5 with 2 supplements
MIEL prioritizes small molecules based on serum/Bmp4 differentiation signature.
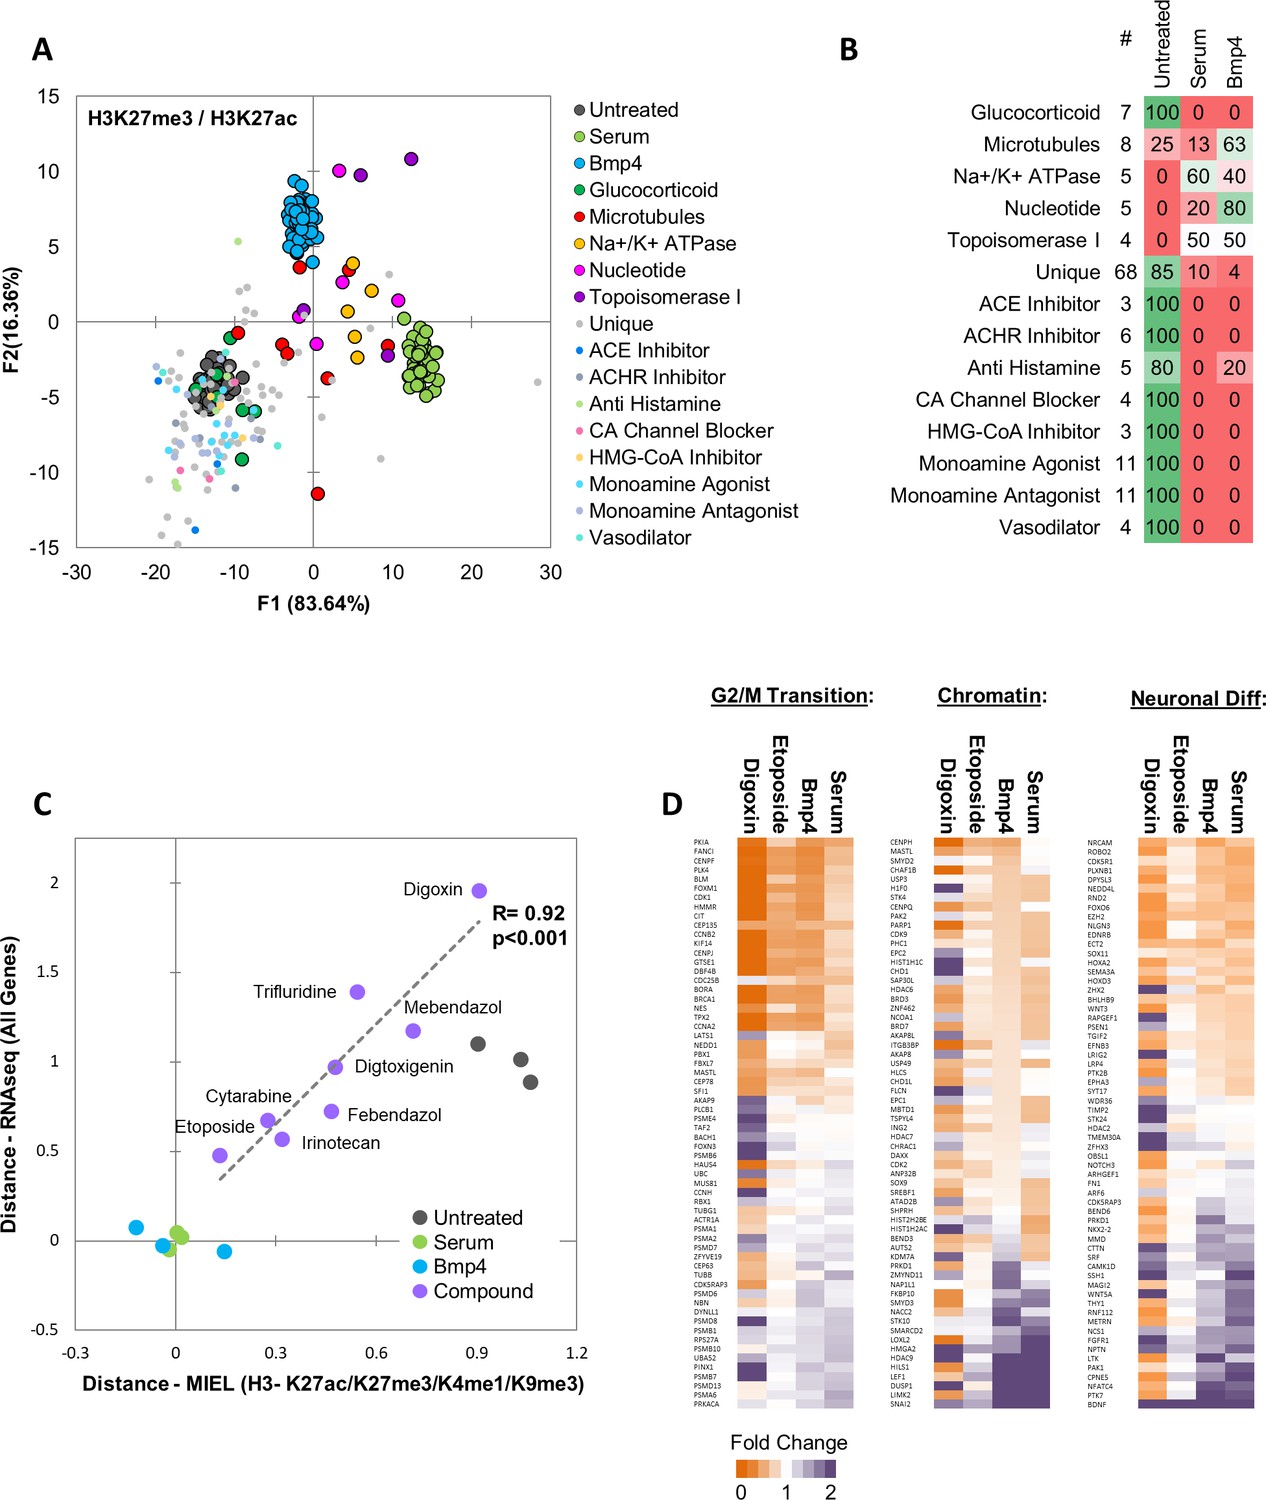
Quadratic discriminant analysis using texture features derived from images of untreated, serum-, Bmp4- and compound-treated GBM2 cells stained for H3K27me3, H3K27ac. Model was built to separate untreated, serum- and Bmp4-treated cells (60 technical replicates each). (A) Scatter plot depicting the first two discriminant factors for each population. (B) Confusion matrix showing classification of epigenetically active Prestwick compounds. Numbers depict the percent of compounds from each category classified as either untreated, serum or Bmp4 treated. (C) Scatter plot showing the correlation of gene expression profile-based ranking and MIEL-based ranking for eight candidate drugs, untreated, serum- or Bmp4-treated GBM2 cells. Euclidean distance to serum- or Bmp4-treated GBM2 cells was calculated using transcriptomic profiles (vertical axis) or texture features derived from images of H3K27ac and H3K27me3, H3K9me3, and H3K4me1 marks (horizontal axis). Distances were normalized to untreated and serum- or Bmp4-treated GBM2 cells. (D) Heat maps showing fold change in expression of select genes taken from the Gene Ontology (GO) list: cell cycle G2/M phase transition (GO:0044839), chromatin modification (GO:0006325), and regulation of neuron differentiation (GO:0045664). R denotes Pearson correlation coefficient. Drug concentrations a-c: febendazole = 0.5 µM, mebendazole = 0.5 µM, cytarabine = 0.3 µM, trifluridine = 3 µM, irinotecan = 0.5 µM, etoposide = 0.3 µM, digitoxigenin = 0.3 µM, digoxin = 0.3 µM.
Figure 5—figure supplement 1

Functional categories of drugs prioritized by MIEL from the Prestwick library.
(A) Twenty hit compounds grouped by the functional classes. For the pairwise classification, the classifier was trained on texture features derived from H3K27ac and H3K27me3 images of serum- or Bmp4-treated GBM2 (vs untreated; cut off = classified to treatment >50%). Normalized distance calculated as the Euclidean distance of a compound to either serum or Bmp4 (the smaller of the two) divided by the distance of untreated cells to the same control (cutoff = normalized distance <1). (B) Table showing pairwise classification of indicated drug-treated GBM2 using a classifier trained on texture features derived from H3K27ac and H3K27me3 images of DMSO- and either serum- or Bmp4-treated GBM2 cells.
Figure 5—figure supplement 2
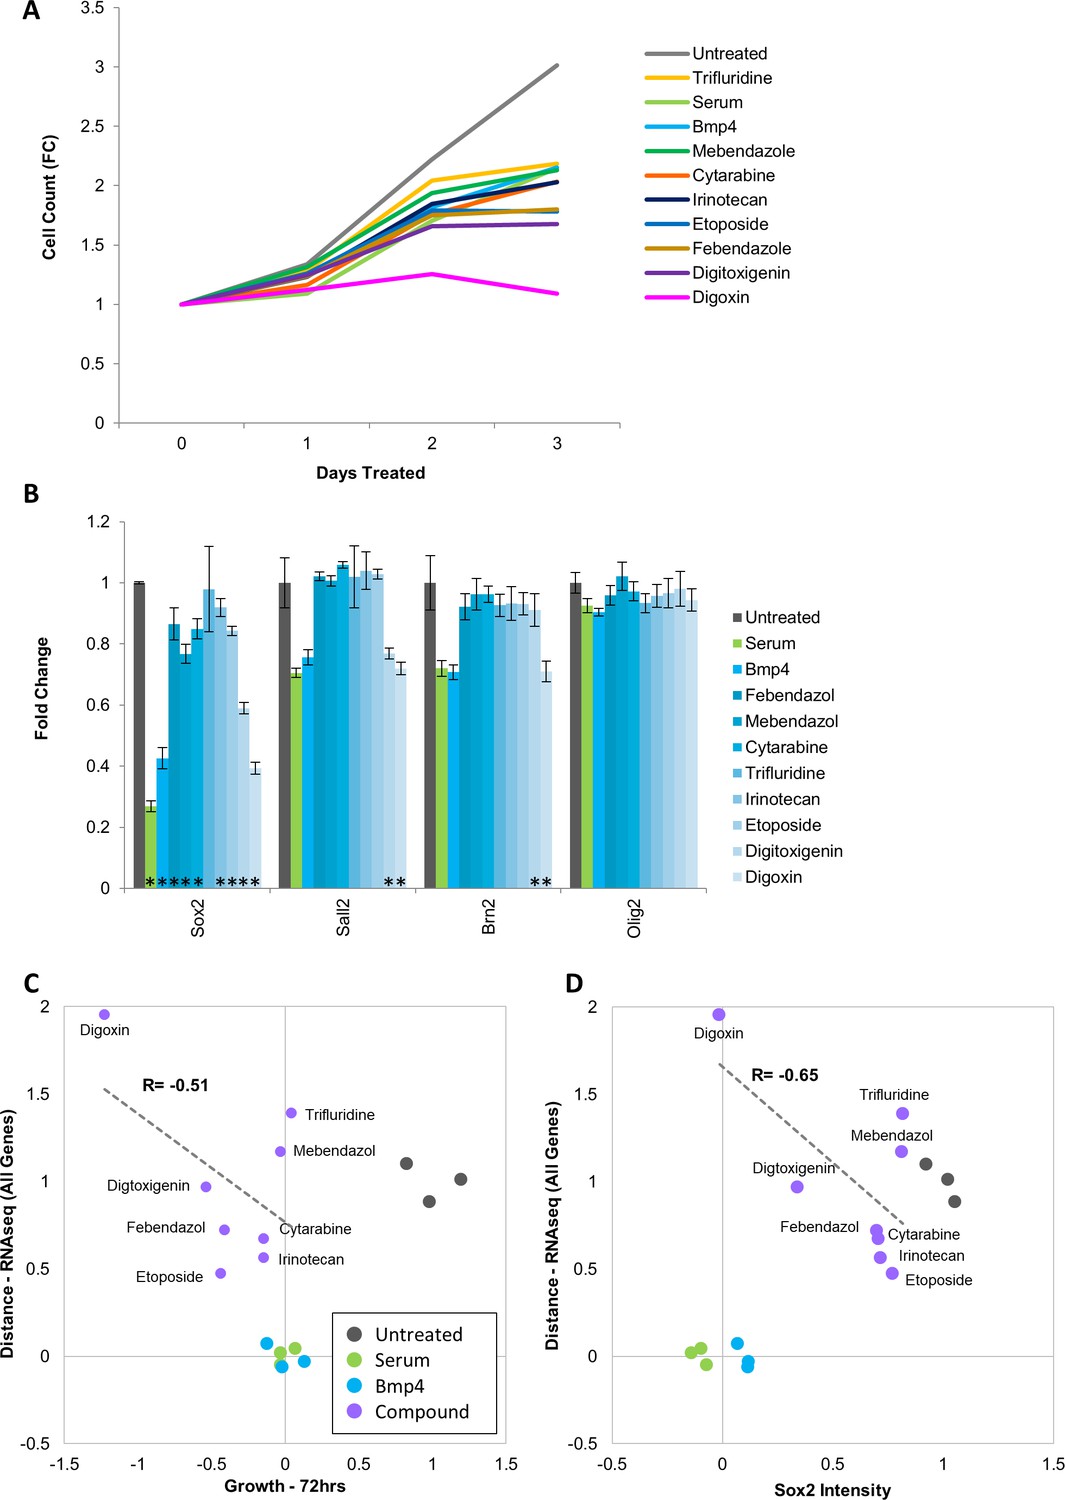
Drugs identified in screen lower proliferation rate of Glioblastoma cells but do not induce down regulation of key transcription factors.
(A) Growth dynamics (fold change in cell count – vertical axis) of untreated, serum-, Bmp4- or drug-treated GBM2 cells over 3 days. (B) Fold change in Sox2, Sall2, Brn2, and Olig2 immunofluorescence intensity of untreated or serum-, Bmp4- or drug-treated GBM2 cells; 3 days of treatment (mean ± S.D, n = 3, p<0.05, unpaired two-tailed t-test). (C) Scatter plot showing the correlation of gene expression profile-based ranking and growth rates for untreated, serum-treated, Bmp4-treated, or 8-drugs-treated GBM2 cells. Euclidean distance to serum- or Bmp4-treated GBM2 cells was calculated using transcriptomic profiles (vertical axis), or growth rate after 72 hr treatment with immunofluorescence intensity (horizontal axis). Distances and growth rates were normalized to untreated and serum- or Bmp4-treated GBM2 cells. R denotes Pearson correlation coefficient. (D) Scatter plot showing the correlation of gene expression profile-based ranking and Sox2 expression for eight candidate drugs, untreated, serum- or Bmp4-treated GBM2 cells. Euclidean distance to serum- or Bmp4-treated GBM2 cells was calculated using transcriptomic profiles (vertical axis), or Sox2 immunofluorescence intensity (horizontal axis). Distances and Sox2 levels were normalized to untreated and serum- Bmp4-treated GBM2 cells.
Author response image 1
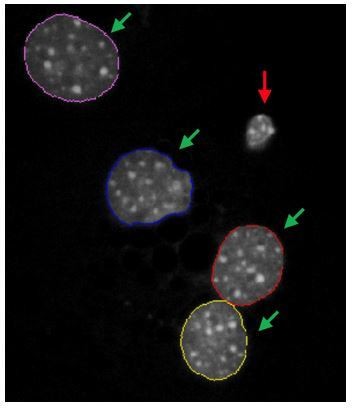
Image of DAPI-stained mouse hepatocytes showing segmentation of normal healthy nuclei (green arrows), but not of pyknotic or pre-pyknotic nuclei (red arrow).
Author response image 2
Distance map depicting the relative Euclidean distance between the multiparametric centroids of GBM2 cells treated with DMSO (88 replicates) or pan HDAC inhibitors (7 compounds; average or 2 replicates shown).
Compounds were present at 0.3, 1, 3, 10, and 30 μM. Distances calculated using texture features derived from images of cells stained with H3K9me3 and H3K27ac.
Author response image 3
Distance map depicting the relative Euclidean distance between the multiparametric centroids of GBM2 cells treated with DMSO or 85 active compounds (3 technical replicates per compound; 91 DMSO replicates).
Distances calculated using texture features derived from images of cells stained for H3K9me3, H3K27me3, H3K4me1, and H3K27ac.
Author response image 4
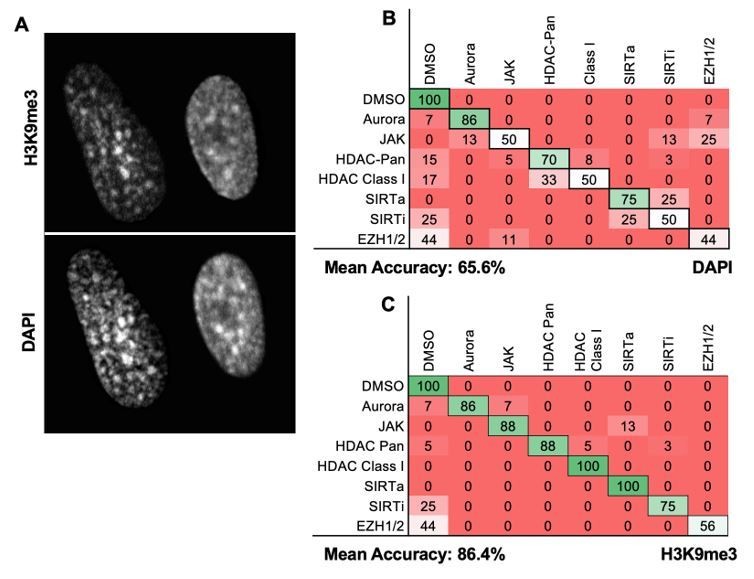
DAPI images can be used for MIEL analysis.
(A) Image of DAPI-stained GBM2 cells demonstrating the similarities in DAPI and H3K9me3 staining (contrast and brightness adjusted to highlight similarity of stain). (B, C) Quadratic discriminant analysis using texture features derived from images of GBM2 cells treated with DMSO or 85 active compounds (2 technical replicates per compound; 38 DMSO replicates) stained for (B) DAPI or (C) H3K9me3 (reproduced from manuscript Figure 1—figure supplement 3B). Confusion matrices show classification results from discriminant analysis. Numbers represent the percentage compounds classified correctly (diagonal) and incorrectly (off diagonal).
Additional files
-
Source code 1
Acapella script used for image processing.
- https://cdn.elifesciences.org/articles/49683/elife-49683-code1-v2.script
-
Supplementary file 1
Tables of resources.
- https://cdn.elifesciences.org/articles/49683/elife-49683-supp1-v2.xlsx
-
Transparent reporting form
- https://cdn.elifesciences.org/articles/49683/elife-49683-transrepform-v2.pdf
Download links
A two-part list of links to download the article, or parts of the article, in various formats.
Downloads (link to download the article as PDF)
Open citations (links to open the citations from this article in various online reference manager services)
Cite this article (links to download the citations from this article in formats compatible with various reference manager tools)
Improving drug discovery using image-based multiparametric analysis of the epigenetic landscape
eLife 8:e49683.
https://doi.org/10.7554/eLife.49683


