Actomyosin regulation by Eph receptor signaling couples boundary cell formation to border sharpness
- The Francis Crick Institute, United Kingdom
Figures
Figure 1
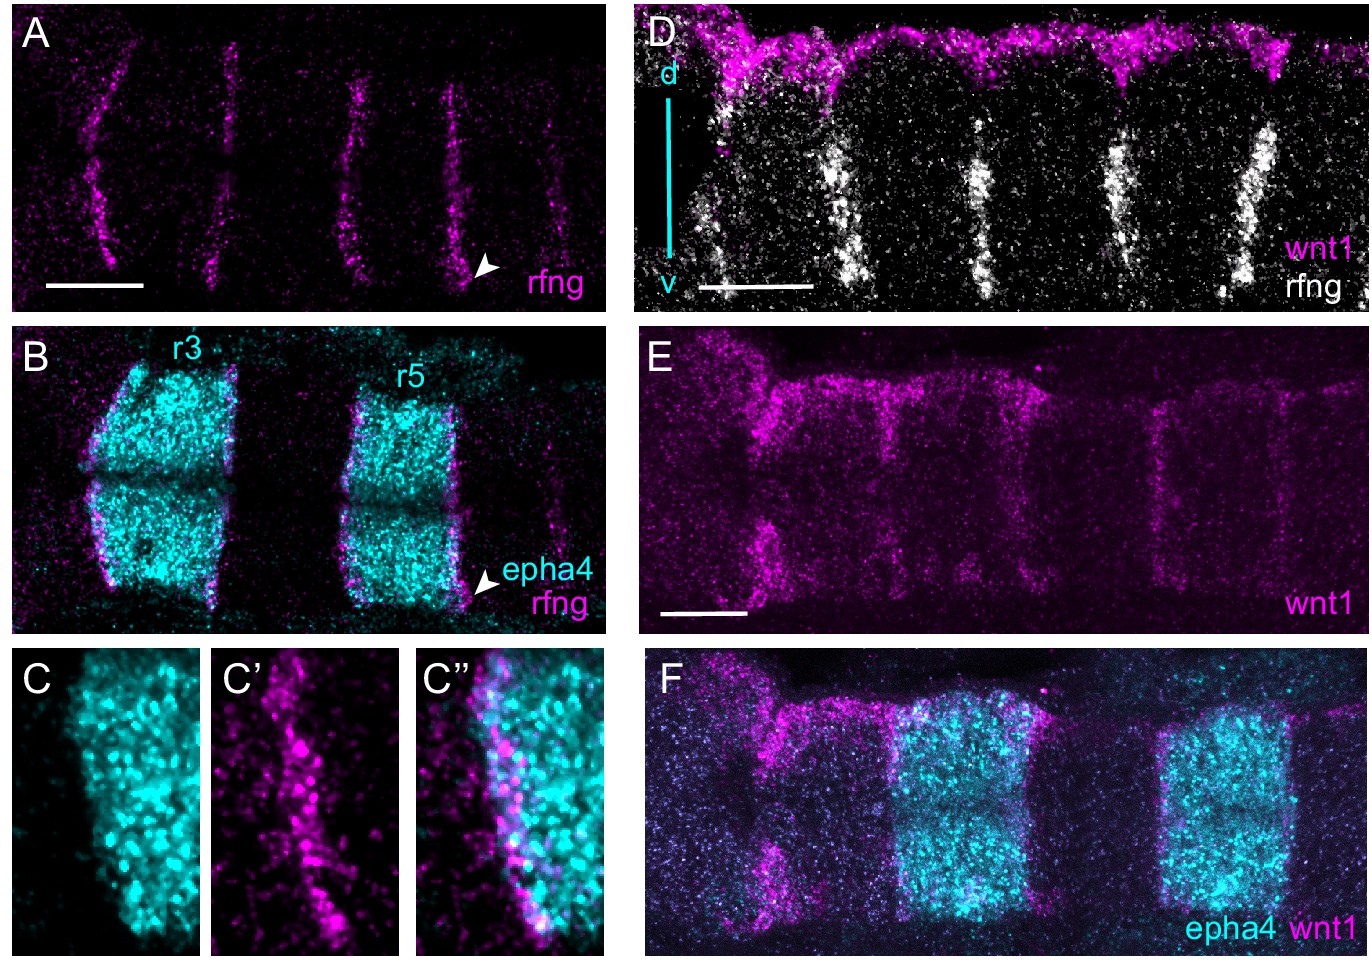
Boundary markers are expressed in epha4-expressing rhombomeres.
(A–C) HCR stainings for rfng and epha4. rfng is mainly expressed in epha4-expressing cells in rhombomeres r3 and r5, with a few rfng-expressing cells in adjacent segments, for example r6 (arrowhead). (C–C’’) show a higher magnification view of an r2/r3 border. (D–F) Boundary expression of wnt1 is dorsal to rfng (D) and is co-expressed with epha4 (E, F). (A–C, E, F) are dorsal views, (D) is a lateral view, dorsal (d) top, ventral (v) bottom. Anterior to the left in all panels. Scale bar: 50 μm.
Figure 2 with 2 supplements
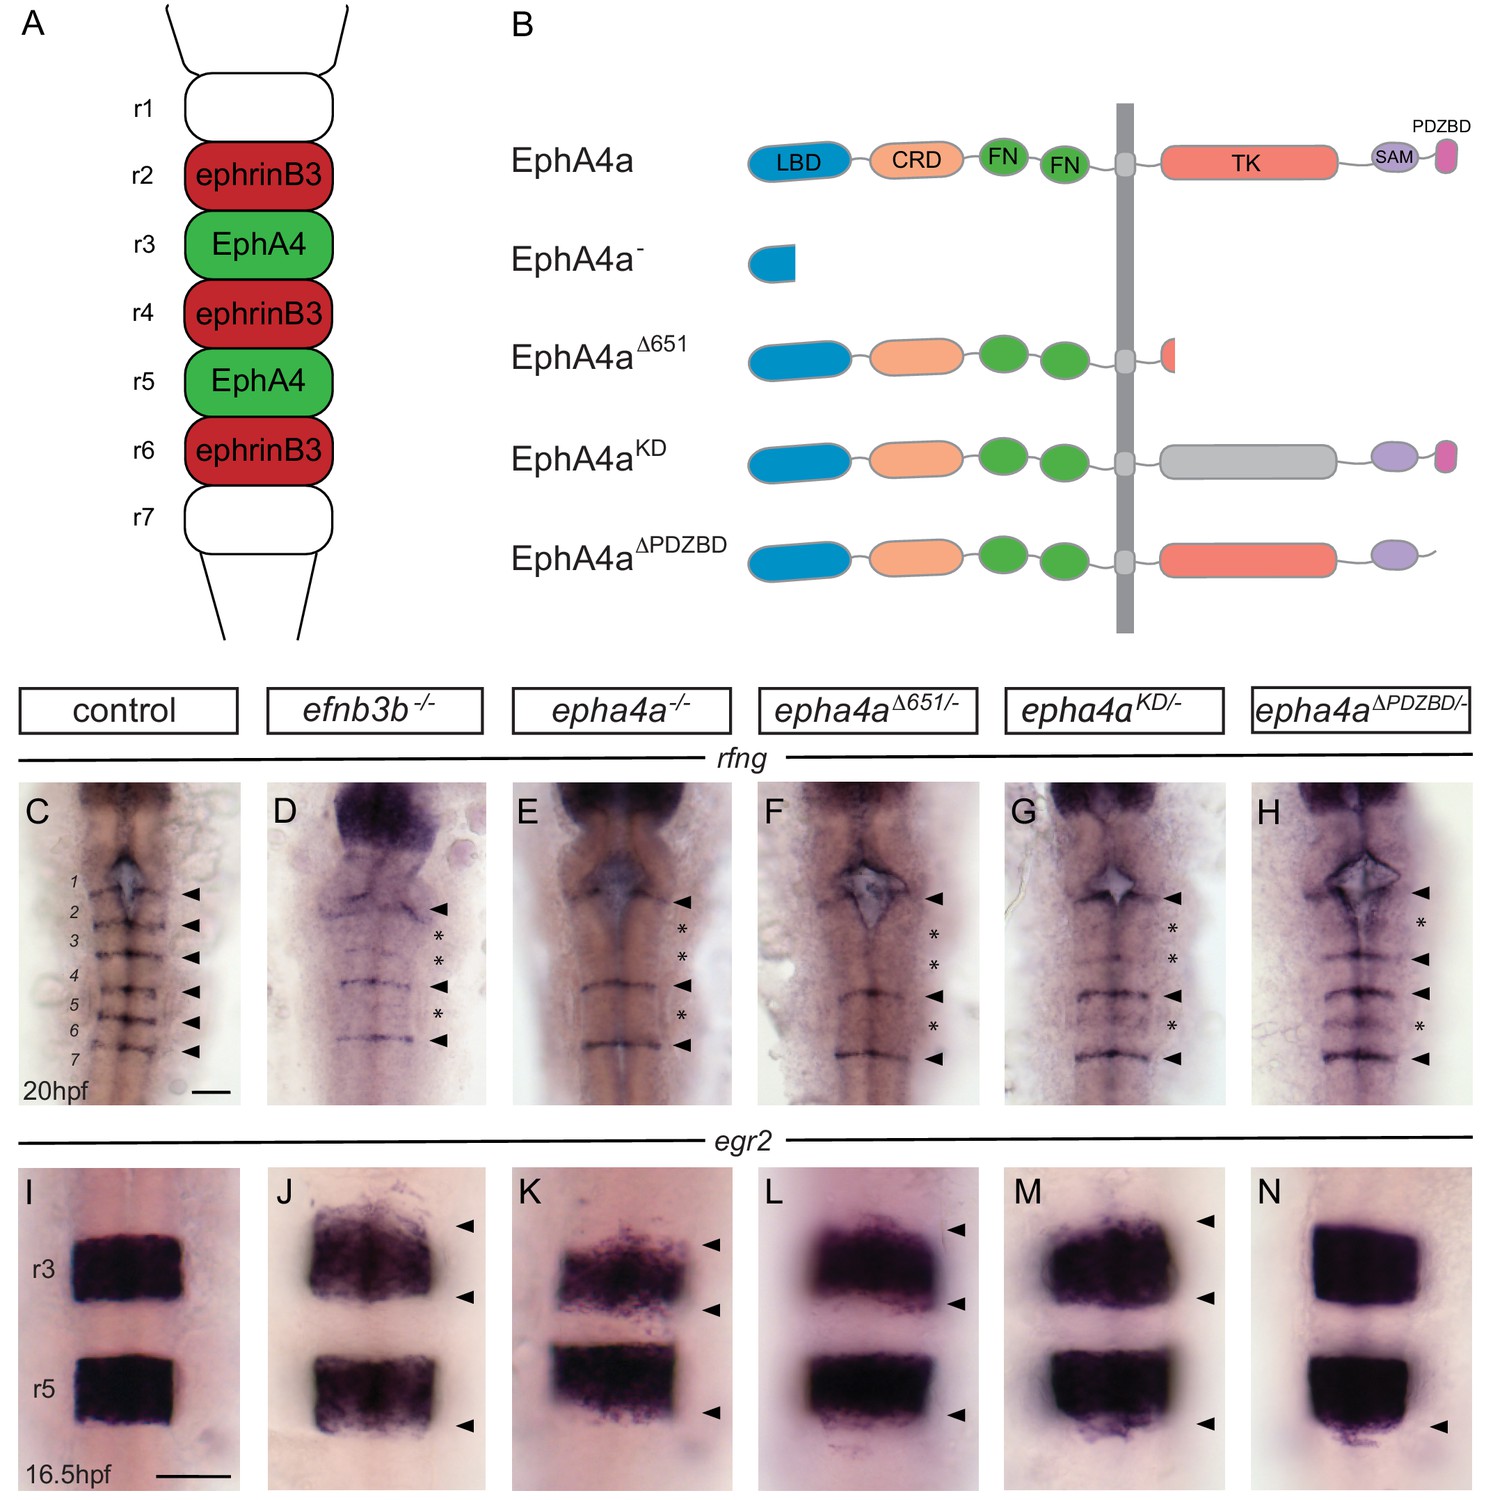
EphA4 forward signalling regulates boundary marker expression and cell segregation.
(A) Schematic representation of the segmented expression of EphA4 and ephrinB3 in the hindbrain. (B) Schematic representation of the different mutant alleles of ephA4a generated for this study. The null allele contains an early truncation in the ligand binding domain. The epha4Δ651 allele lacks most of the cytosolic domain. The ephA4KD allele contains a point mutation of a critical lysine in the tyrosine kinase domain. The ephA4ΔPDZBD mutation consists of a C-terminal truncation that deletes the PDZ-binding domain. LBD – ligand binding domain; CRD – cysteine rich domain; FN – fibronectin repeat; TK – tyrosine kinase domain; SAM – sterile alpha motif; PDZBD – PDZ binding domain. (C–H) rfng is expressed at boundaries in control embryos (arrowheads) (C), but is reduced or absent (asterisk) at specific boundaries in ephrinb3-/- (D), epha4-/- (E), epha4Δ651 (F), epha4KD (G) and epha4ΔPDZBD (H) mutants. Numbers analysed for C-G are in Figure 4 legend. For H, 8/8 have decrease at r2/r3, 4/8 at r5/r6. (I–N) egr2 expression in r3 and r5 has sharp borders in control embryos (I, 13/13); border sharpening defects (arrowheads) are observed in ephrinb3-/- (J; 12/12), epha4-/- (K; 17/17), epha4Δ651 (L; 8/8), epha4KD (M; 6/6) and epha4ΔPDZBD (N; 2/7 at r2/r3; 7/7 at r5/r6) mutants. Dorsal views, anterior to the top in all panels. Scale bar: 50 μm.
Figure 2—figure supplement 1
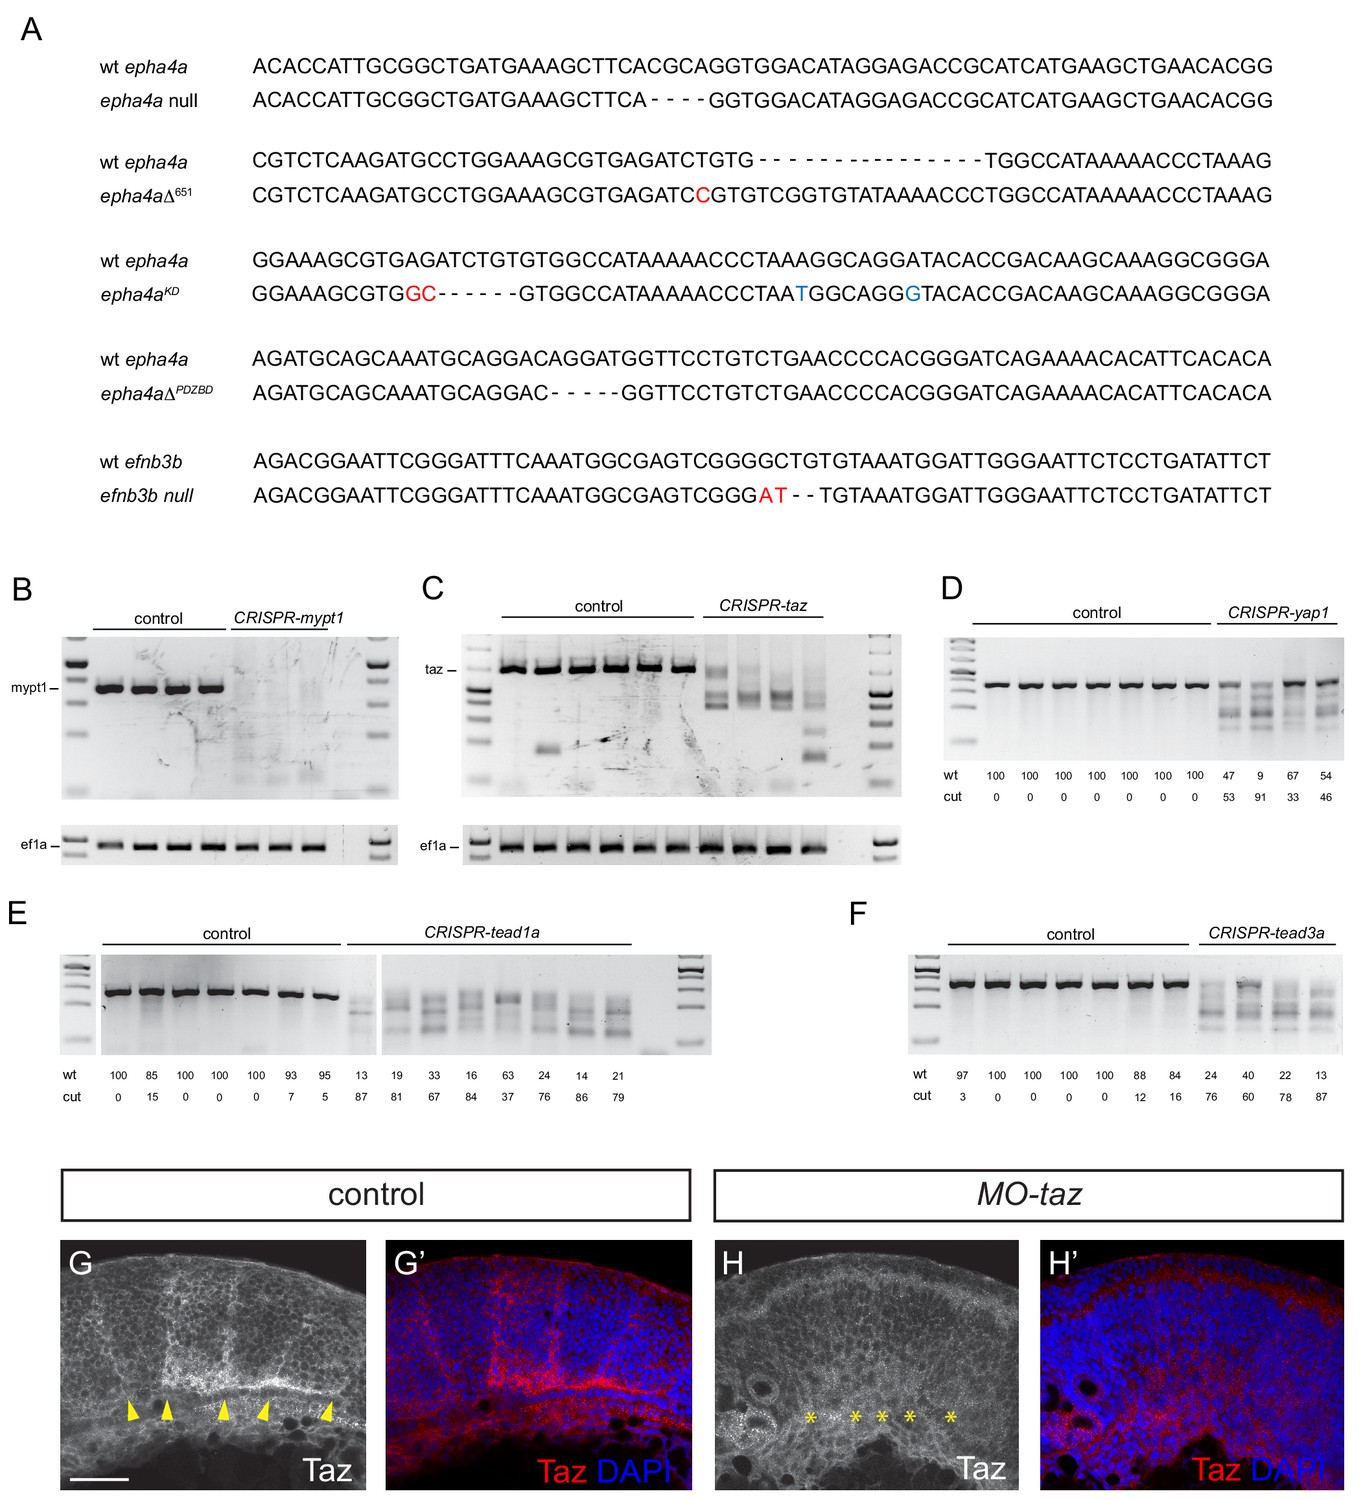
Validation of knockout and knockdown reagents and mutants.
(A) DNA sequence of the epha4a and efnb3b mutants. Nucleotides in red indicate small insertions or substitutions introduced at target sites; nucleotides in blue indicate residues that have been introduced by insertion of a template DNA, including the A to T transversion causing the kinase loss-of-function. (B, C) PCR of region targeted by multiple gRNAs against mypt1 (B) and taz (C) suggest that large deletions occur in injected embryos. (D–F) T7 endonuclease I digestion of PCR products of regions targeted in yap1 (D), tead1a (E) and tead3a (F), with quantitation of undigested (wt) and digested products. Cut bands in DNA from some uninjected embryos in E and F may reflect the presence of SNPs. Five embryos were pooled for each PCR or digestion. (G, H) Taz staining in boundaries is lost after taz knockdown. Lateral views. Arrowheads indicate Taz+ boundary position. Asterisks indicate Taz- boundary position. Scale bar: 50 μm.
Figure 2—figure supplement 2

Boundary marker expression in epha4 mutants.
(A–C) Expression of wnt1 is reduced at specific hindbrain boundaries in epha4-/- (B; 13/13) and epha4KD (C; 13/15) mutants compared to controls (A; 17/18). Dorsal expression of wnt1 is not changed in the mutants. (D–F) sema3gb expression is reduced at specific boundaries in epha4-/- (E; 14/14) and epha4KD (F; 17/17) mutants compared to controls (D; 17/17). Arrowheads indicate normal boundary expression of wnt1 or sema3gb, while stars indicate reduction or absence of boundary marker expression. Dorsal views, anterior to the top. (G, G’) HCR staining for rfng and epha4a in epha4KD mutants reveals that remaining rfng expression occurs in epha4-expressing cells at the r5/r6 boundary (white arrowhead; 20/20). Dorsal view, anterior to the left. Scale bar: 50 μm.
Figure 3 with 1 supplement
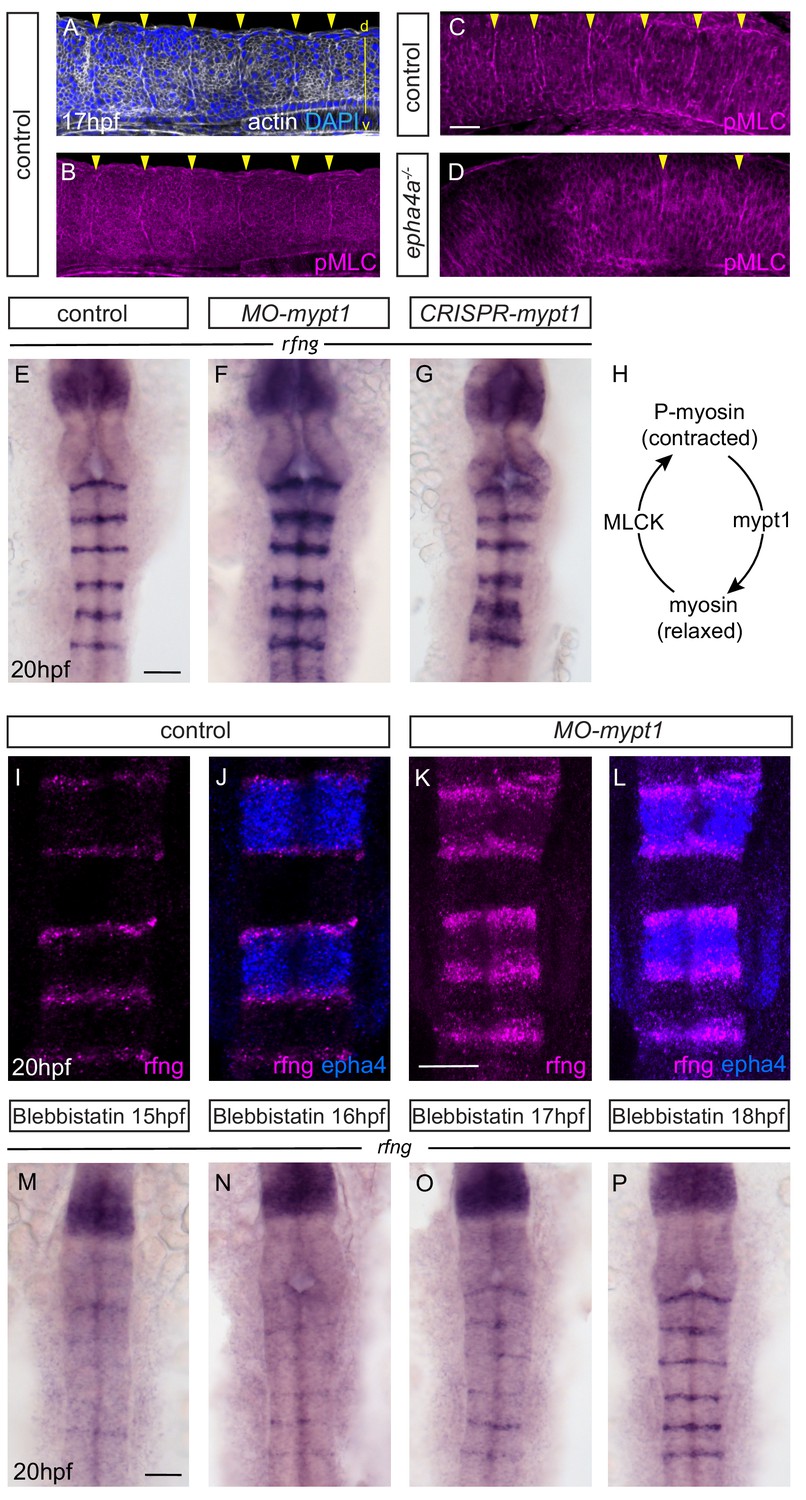
Actomyosin tension regulates boundary expression of rfng.
(A, B) Immunostainings to detect actin (A) and pMLC (B) which co-localize at segment boundaries. (C, D) pMLC is detected at all boundaries in control embryos (C, 37/38) but not at r2/r3, r3/4 and r5/r6 boundaries in epha4-/- embryos (D, 24/24). Lateral views, anterior to the left. (E–G) rfng expression is increased in mypt1 knockdowns (F; 38/45) and embryos injected with CRISPR/Cas9 against mypt1 (G; 19/26), compared to controls (E; 37/38). (H) Depiction of Mypt1 regulating actomyosin tension by dephosphorylating pMLC. (I–L) HCR stainings reveal that rfng expression in epha4-expressing cells in control embryos (I, J; 24/24) is increased after knockdown of mypt1 (K, L; 28/36). (M–P) Myosin II inhibitor blebbistatin suppresses rfng transcription when treatment is initiated at 15 hpf (M; 21/21), 16 hpf (N; 25/25) or 17 hpf (O; 23/23), but it is less affected when initiated at 18 hpf (P; reduced in 8/22). (E–P) Dorsal views, anterior to the top. Scale bar: 50 μm.
Figure 3—figure supplement 1
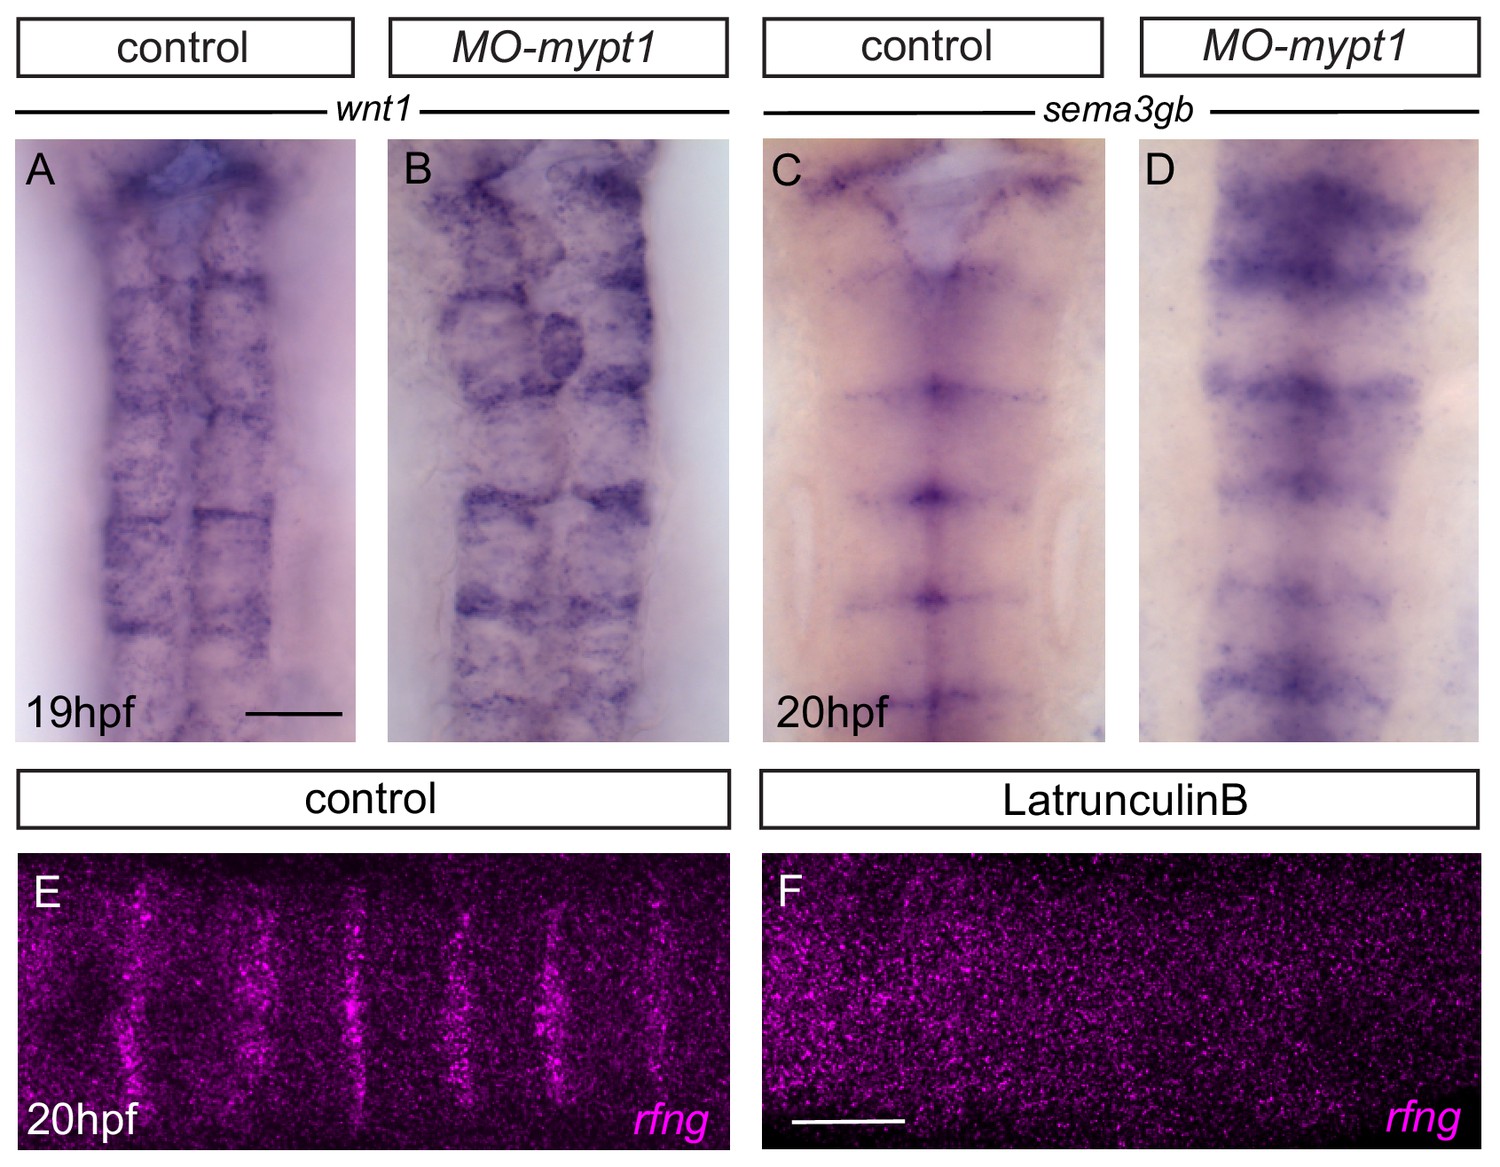
Boundary marker expression after mypt1 knockdown.
(A, B) Expression of wnt1 in control (A; 17/18) increases in mypt1 knockdown embryos (B; 13/29). (C, D) Expression of sema3gb in control (C; 17/17) increases in mypt1 knockdown embryos (D; 12/14). Dorsal views, anterior to the top. (E, F) HCR staining reveals that rfng in control (E) is no longer detected in latrunculinB-treated embryos (F; 12/12). Dorsal views, anterior to the left. Scale bar: 50 μm.
Figure 4
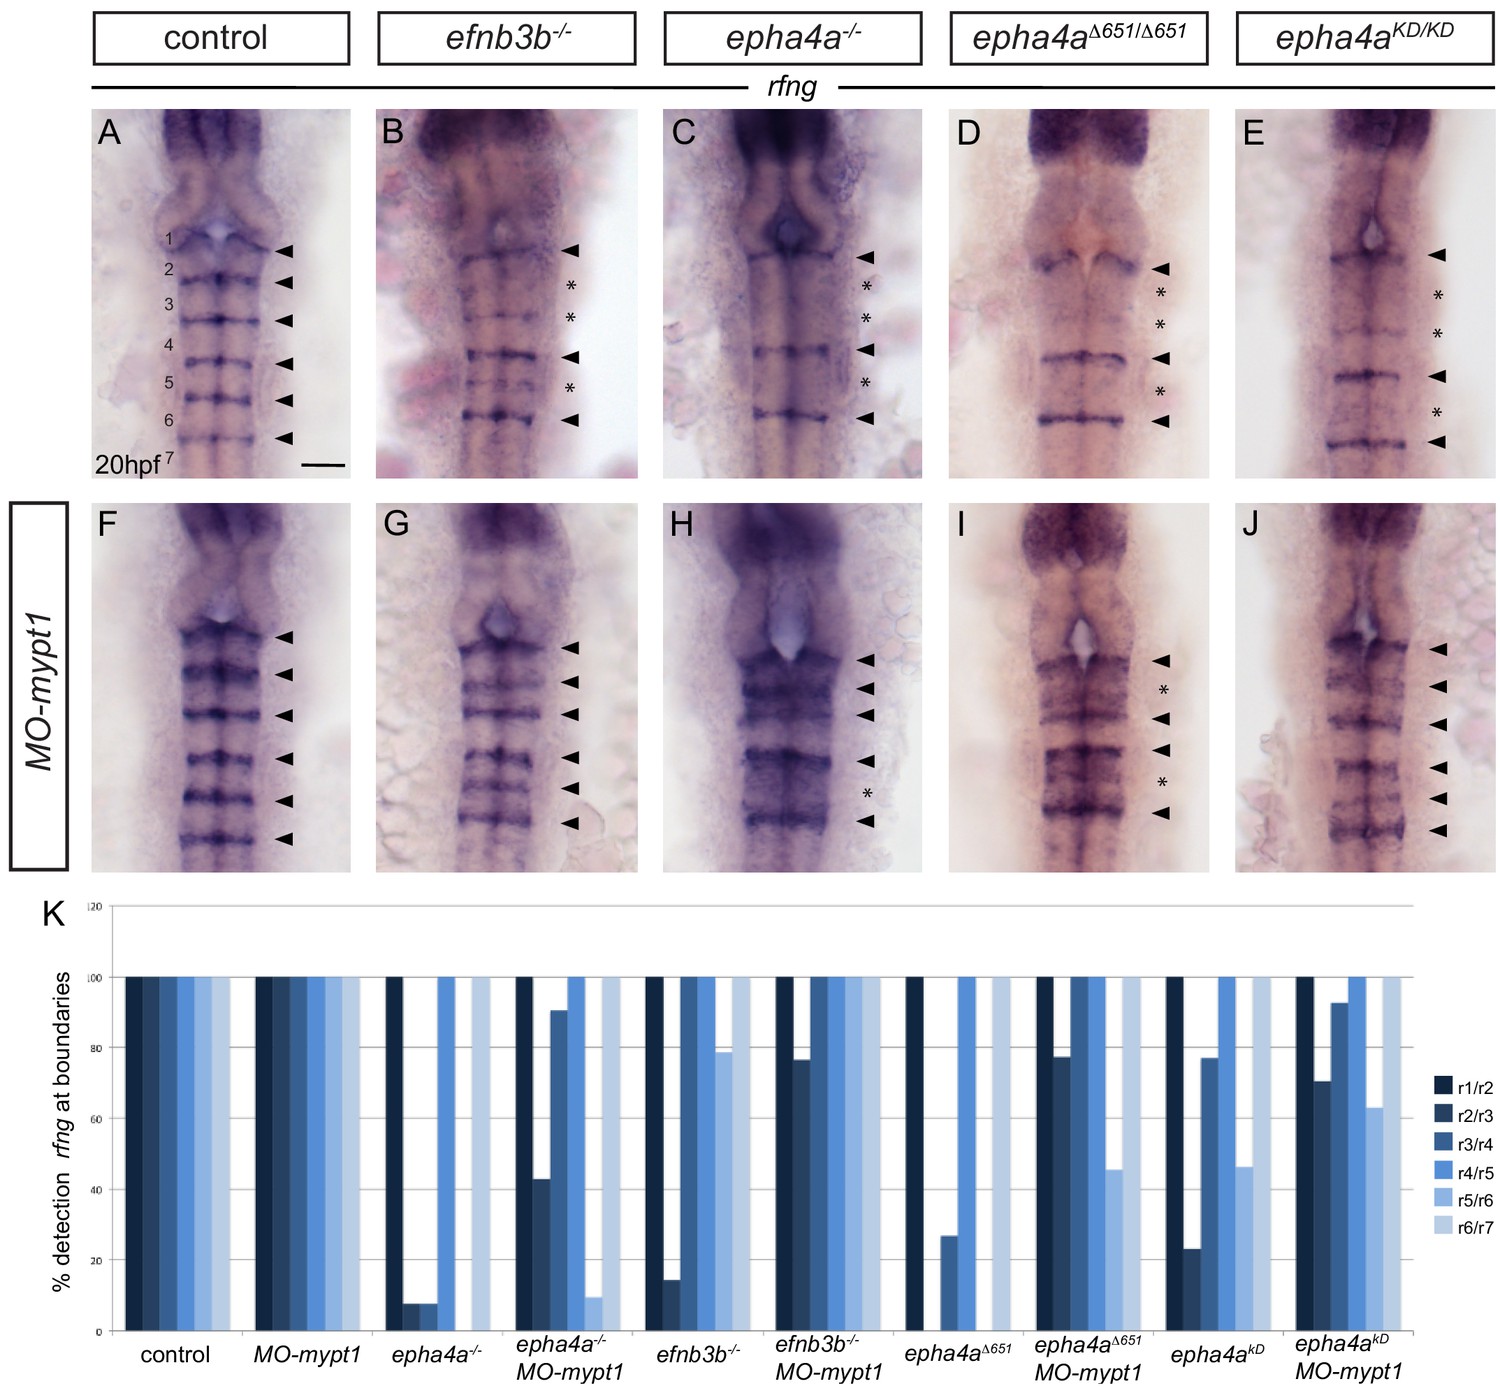
Increased tension selectively restores boundary expression of rfng in epha4 and ephrinb3 mutants.
(A–K) Knockdown of mypt1 increases rfng expression at hindbrain boundaries in control embryos (F) and restores rfng expression at specific boundaries in ephrinb3-/- (G), epha4-/- (H), epha4Δ651 (I) and epha4KD (J) mutants compared to uninjected controls (A–E). (K) Percentage of embryos showing rfng expression at the different boundaries for: control (n = 38); MO-mypt1 (45); epha4a-/- (13); epha4a-/-MO-mypt1 (42); efnb3b-/- (14); efnb3b-/- MO-mypt1 (17); epha4aΔ651 (15); epha4aΔ651 MO-mypt1 (22); epha4aKD (13); epha4aKD MO-mypt1 (27). Dorsal views, anterior to the top. Arrowheads indicate normal boundary expression of rfng, while asterisks indicate reduction or absence of rfng expression at boundaries. Scale bar: 50 μm.
Figure 5 with 1 supplement

Taz and Tead1a are required for boundary expression of rfng.
(A–H) Hindbrain boundary expression of rfng is reduced in taz knockdowns (B), and in taz (C) and tead1a (F) transient knockouts compared to controls (A), while yap1 knockdown (D) and yap1 (E) and tead3a (G) transient knockouts have normal rfng expression. (H) Scoring of boundary expression of rfng in different conditions according to severity levels: wild type = normal expression of rfng in all boundaries; severity 1 = general reduction of rfng expression levels; severity 2 = partial absence of rfng expression leading to discontinuous boundaries; severity 3 = total absence of rfng boundary expression. Number of embryos: control (15); MO-taz (20); CRISPR-taz (30); MO-yap1 (52); CRISPR-yap1 (21); CRISPR-tead1a (23); CRISPR-tead3a (12). Dorsal views, anterior to the top. Scale bar: 50 μm.
Figure 5—figure supplement 1
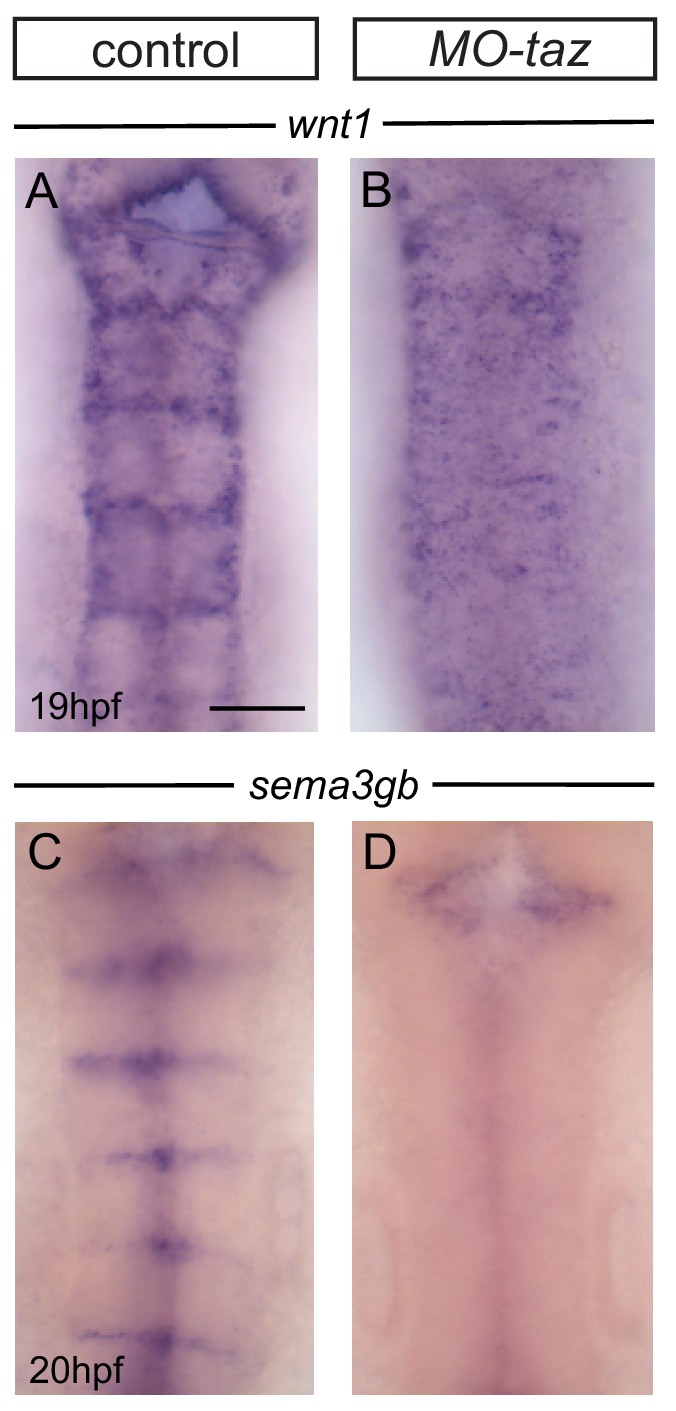
Boundary marker expression after taz knockdown.
(A, B) Boundary expression of wnt1 in control (A; 17/18) is no longer detected in taz knockdown embryos (B; 12/12). (C, D) Boundary expression of sema3gb in control (C; 17/17) is no longer detected in taz knockdown embryos (D; 19/19). Boundary expression of both markers is lost following taz knockdown. Dorsal views, anterior to the top. Scale bar: 50 μm.
Figure 6 with 2 supplements
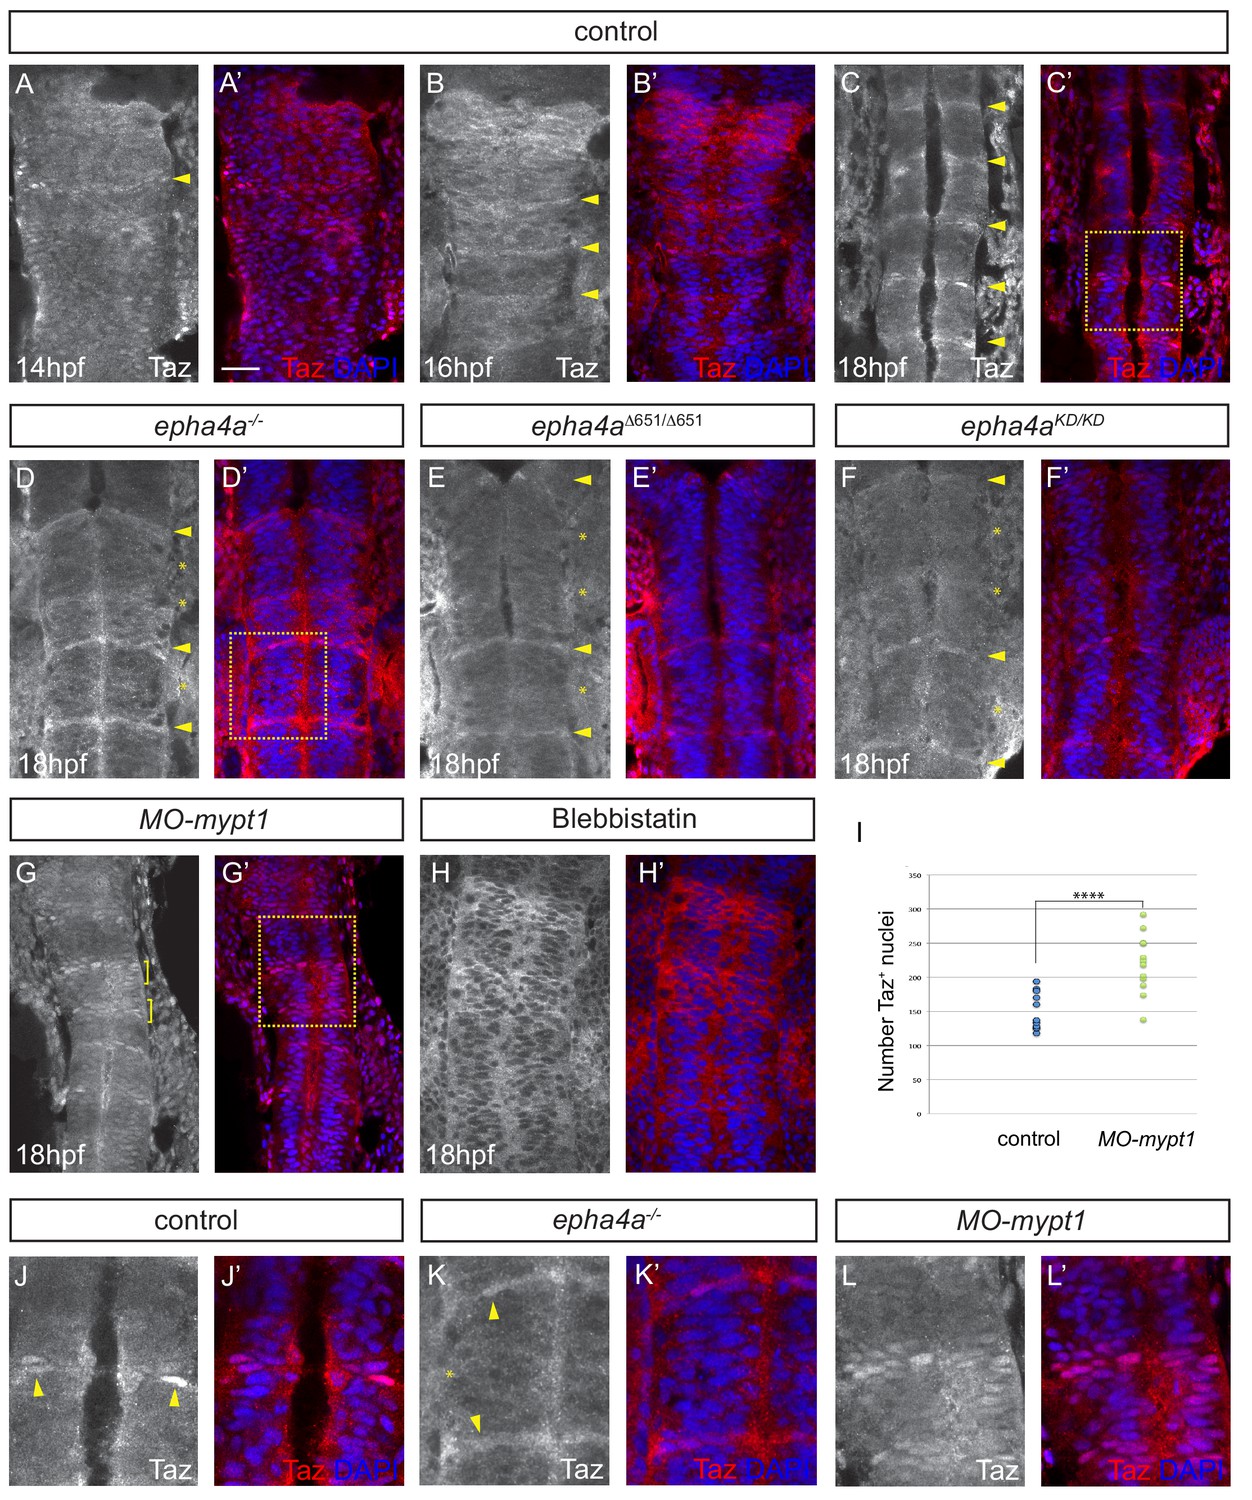
Eph-ephrin signalling and actomyosin tension regulate Taz nuclear localization.
(A–C) Time course of the localization of Taz protein. Nuclear localization of Taz starts to be detected in hindbrain boundaries at 14 hpf (A, A’). Several boundaries have elevated nuclear Taz at 16 hpf (B, B’), and nuclear Taz is present in all boundaries at 18 hpf (C, C’). (D–F) Nuclear Taz is reduced at r2/r3, r3/r4 and r5/r6 boundaries in epha4 null (D, D’), epha4Δ651 (E, E’) and epha4aKD mutants (F, F’) at 18 hpf. (G, G’) Ectopic cells with elevated nuclear Taz are observed at 18 hpf after mypt1 knockdown. (H, H’) Blebbistatin treatment inhibits the nuclear accumulation of Taz at boundaries. (I) Quantitation of number of nuclei with Taz staining in controls (n = 12) and mypt1 knockdowns (n = 13) (****p<0.0001). (J–L) Higher magnification images corresponding to boxed areas in C’, D’ and G’. Dorsal views, anterior to the top. Arrowheads indicate boundary position; asterisks indicate boundaries with reduced nuclear Taz; brackets indicate expansion of nuclear Taz staining. Scale bar: 30 μm.
Figure 6—figure supplement 1
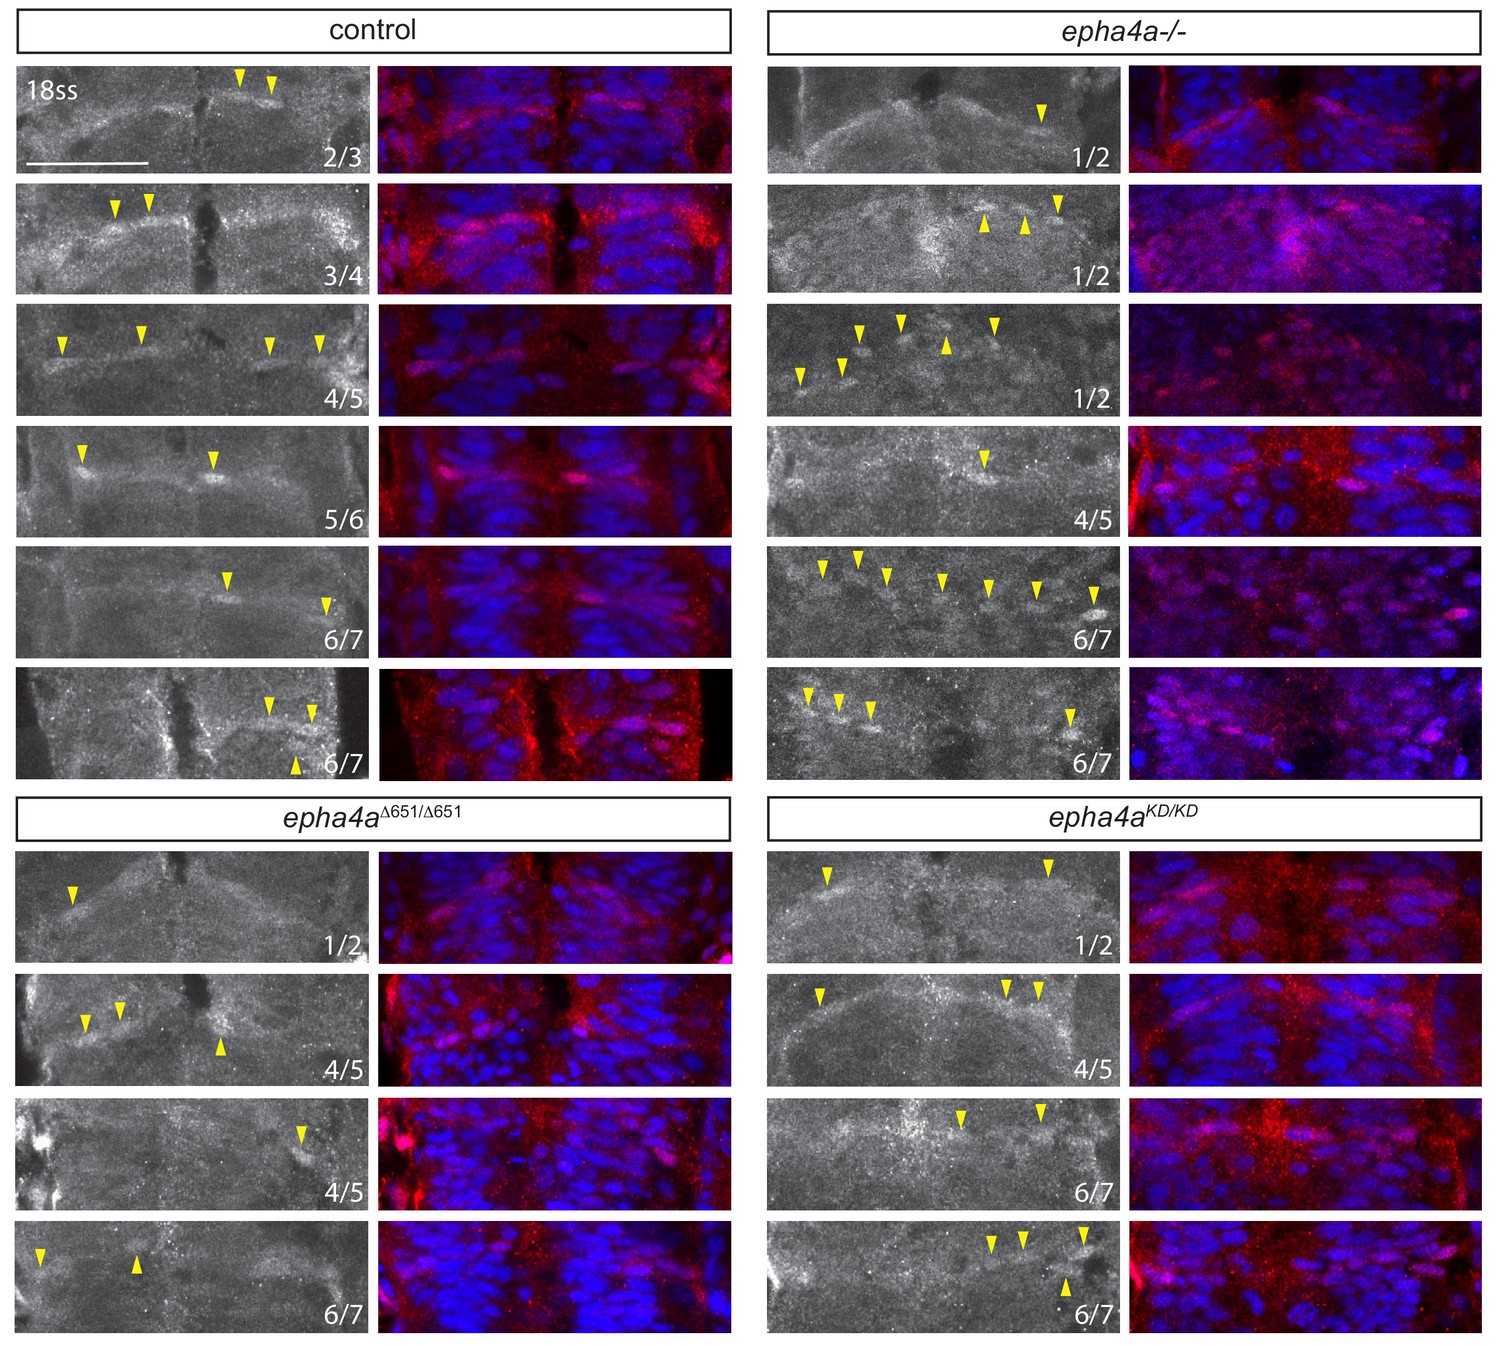
Taz localisation in hindbrain boundaries.
Additional examples of Taz nuclear accumulation in boundaries at different conditions. In control embryos, Taz accumulates in the nuclei of some cells in all boundaries, but only in the r1/r2, r4/r5 and r6/r7 boundaries in epha4a null, epha4aΔ651 and epha4aKD mutants. The numbers indicate which boundary is shown and arrowheads indicate Taz+ nuclei. Scale bar: 50 μm.
Figure 6—figure supplement 2
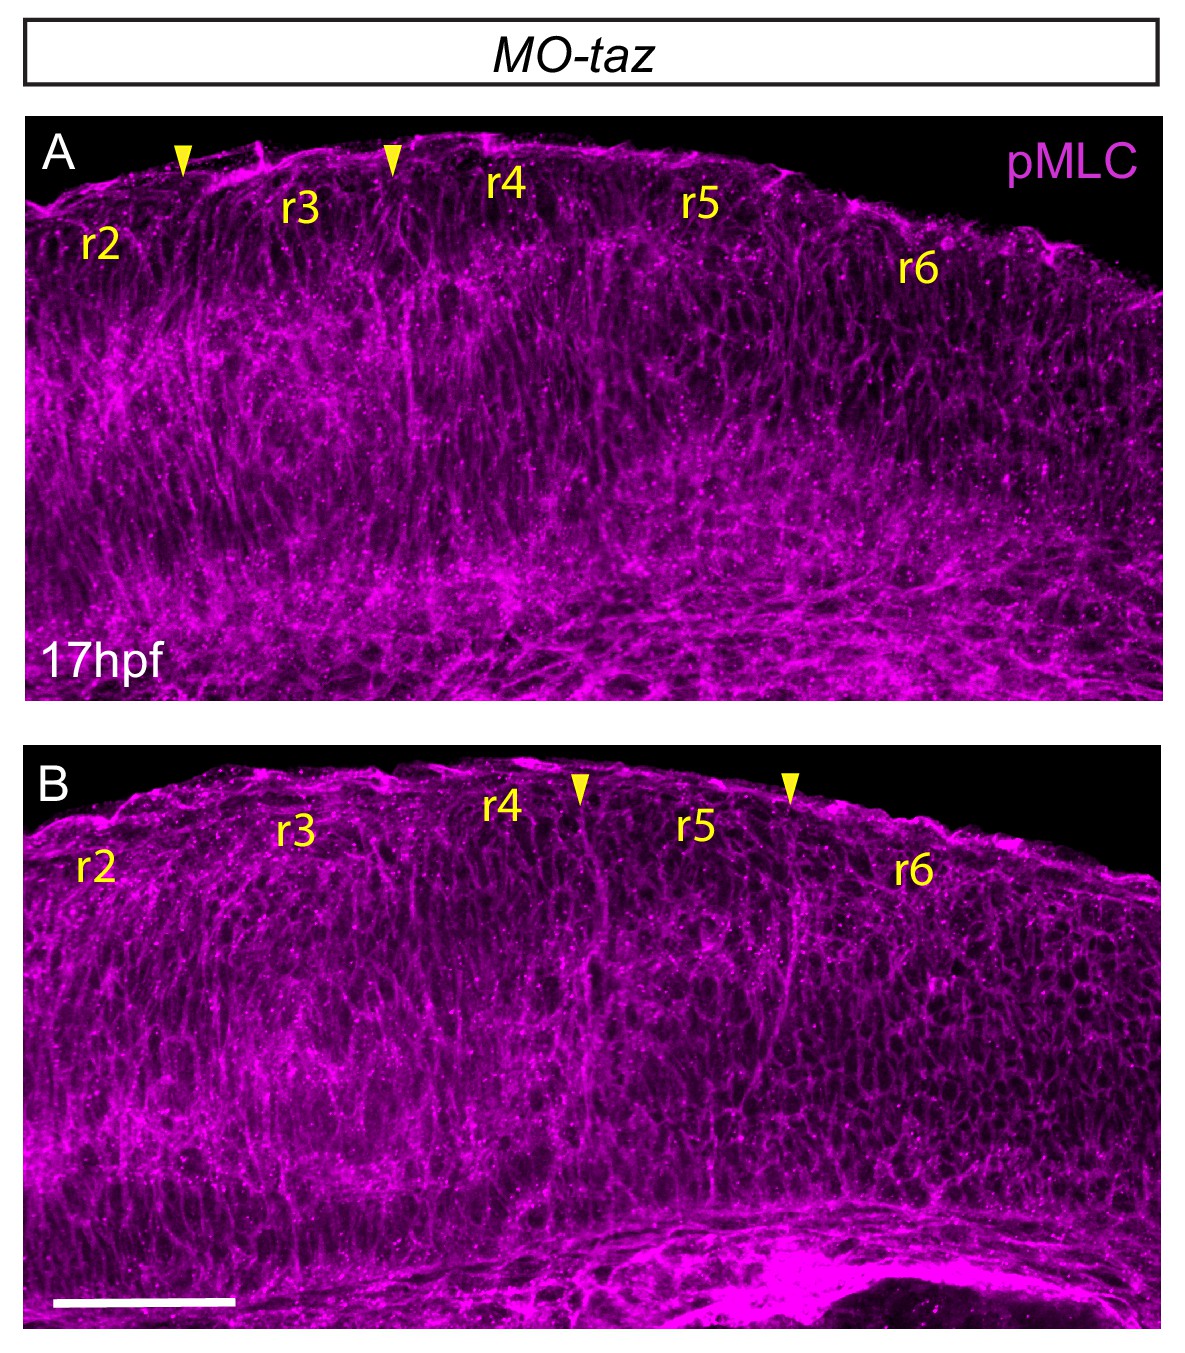
pMLC after taz knockdown.
(A, B) taz knockdown embryos immunostained to detect pMLC, shown in two different confocal planes. Increased pMLC is detected at hindbrain boundaries, suggesting that myosin phosphorylation does not require Taz function. Lateral views, anterior to the top. Scale bar: 50 μm.
Figure 7
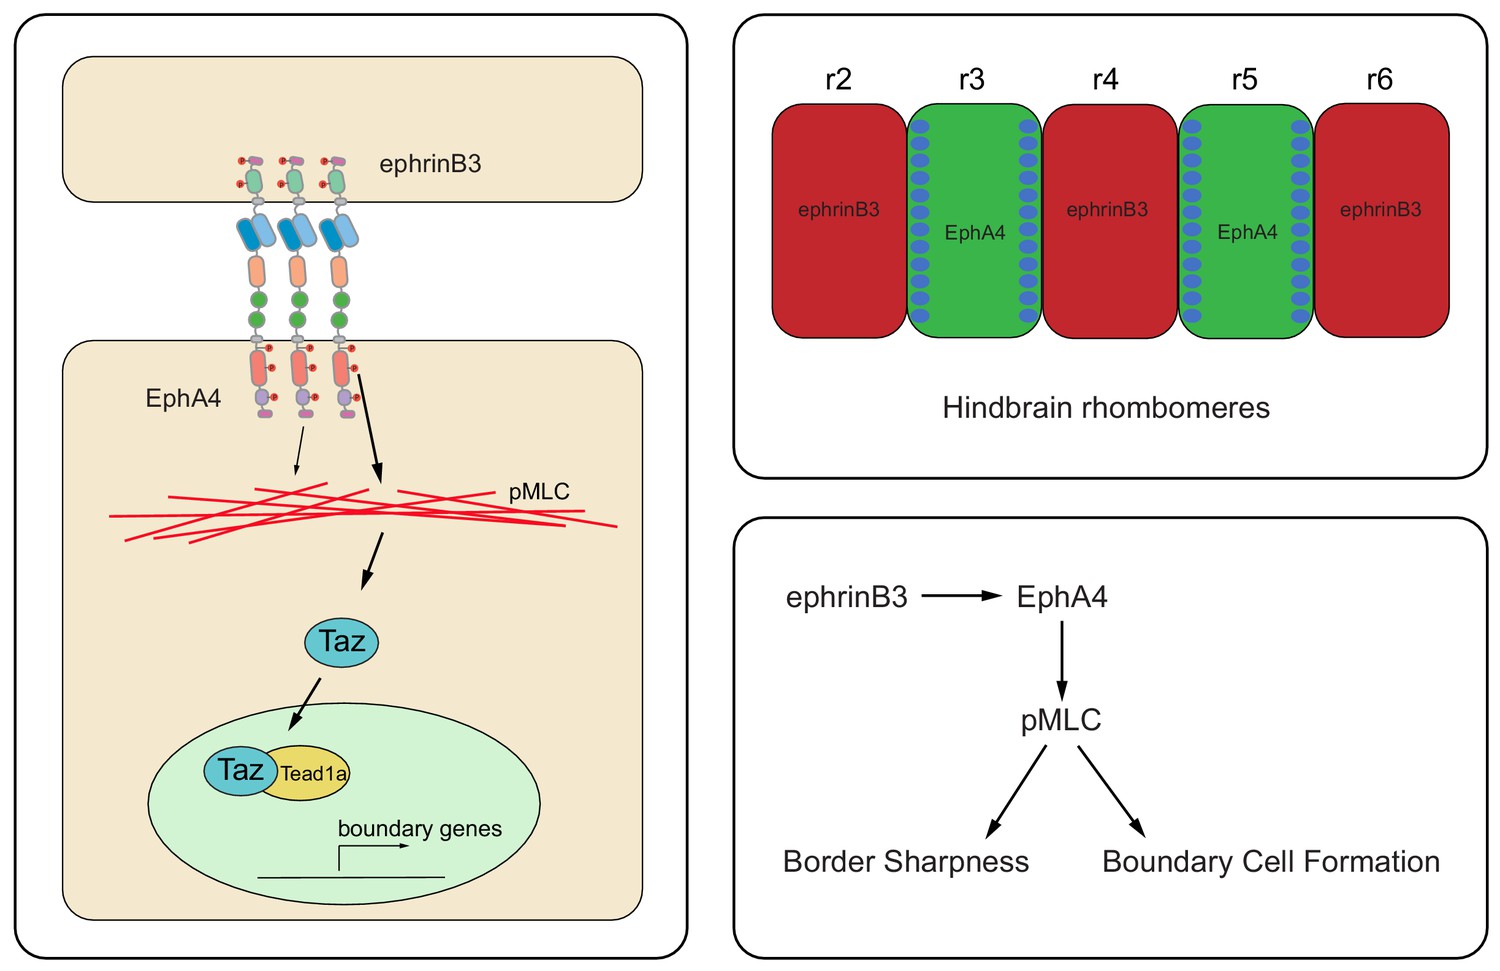
Model of EphA4 signaling and hindbrain boundary cell induction.
The diagram on the left depicts the activation of EphA4 forward signaling by ephrinB3, which through kinase-dependent and PDZ binding domain-dependent pathways increases the level of pMLC. pMLC promotes actomyosin contraction and translocation of Taz to the nucleus, where it interacts with Tead1a to upregulate boundary-specific gene expression. As a consequence, boundary cells form in EphA4-expressing cells at the borders of r3 and r5 (top right). By acting through pMLC, EphA4 signaling couples boundary cell formation to the maintenance of border sharpness (bottom right).
Tables
Key resources table
| Reagent type (species) or resource | Designation | Source or reference | Identifiers | Additional information |
|---|---|---|---|---|
| Recombinant DNA reagent | rfng (zebrafish, Danio rerio) in situ hybridisation probe | Cheng et al., 2004, PMID: 15068793 | ||
| Recombinant DNA reagent | wnt1 (zebrafish) in situ hybridisation probe | Molven et al., 1991, PMID: 2009859 | ||
| Recombinant DNA reagent | sema3gb (zebrafish) in situ hybridisation probe | Terriente et al., 2012, PMID: 22764046 | ||
| Recombinant DNA reagent | egr2b (zebrafish) in situ hybridisation probe | Oxtoby and Jowett, 1993, PMID: 8464695 | ||
| Sequence-based reagent | rfng (zebrafish) HCR probe | Molecular Instruments | Designed and supplied by Molecular Instruments | |
| Sequence-based reagent | wnt1 (zebrafish) HCR probe | Molecular Instruments | Designed and supplied by Molecular Instruments | |
| Sequence-based reagent | epha4 (zebrafish) HCR probe | Molecular Instruments | Designed and supplied by Molecular Instruments | |
| Antibody | anti-pMLC (rabbit polyclonal) | Cell Signalling Technology | Cat # 3671 RRID:AB_330248 | 1:200 |
| Antibody | anti-Taz (rabbit monoclonal) | Cell Signalling Technology | Cat # D24E4 RRID:AB_10950494 | 1:200 |
| Antibody | anti-EphA4 (rabbit polyclonal) | Irving et al., 1996, PMID: 8575627 | 1:450 | |
| Chemical compound, drug | phalloidin-atto 647N | Sigma-Aldrich | Cat # 65906 | 1:250 |
| Chemical compound, drug | blebbistatin | Sigma-Aldrich | Cat # B0560 | 12.5 μM |
| Chemical compound, drug | latrunculinB | Sigma-Aldrich | Cat # 428020 | 50 nM |
| Sequence-based reagent | morpholino to block mypt1 | Gutzman and Sive, 2010, PMID: 20147380 | ATTTTTTGTGACTTACTCAGCGATG | |
| Sequenced-based reagent | morpholino to block taz | Hong et al., 2005, PMID: 16099986 | CTGGAGAGGATTACCGCTCATGGTC | |
| Gequenced-based reagent | morpholino to block yap1 | Skouloudaki et al., 2009, PMID: 19439659 | AGCAACATTAACAACTCACTTTAGG | |
| Genetic reagent (D. rerio) | epha4a null mutant | This study | Sequence in Figure 2—figure supplement 1 | |
| Genetic reagent (D. rerio) | epha4a Δ651 mutant | This study | Sequence in Figure 2—figure supplement 1 | |
| Genetic reagent (D. rerio) | epha4a KD mutant | This study | Sequence in Figure 2—figure supplement 1 | |
| Genetic reagent (D. rerio) | epha4a ΔPDZBD mutant | This study | Sequence in Figure 2—figure supplement 1 | |
| Sequence-based reagent | genomic target of gRNA to create epha4a null mutant | This study | GGCTGATGAAAGCTTCACGC | |
| Sequence-based reagent | forward primer to screen for epha4a null mutant | This study | GCTCCGCAGTACATTTTAGGG | |
| Sequence-based reagent | reverse primer to screen for epha4a null mutant | This study | GTCTTTCCTCTCACAGTGGGA | |
| Sequence-based reagent | genomic target of gRNA to create epha4a Δ651 mutant | This study | GGAAAGCGTGAGATCTGTG | |
| Sequence-based reagent | forward primer to screen for epha4a Δ651 mutant | This study | CCCTTCACATACGAGGACCCC | |
| Sequence-based reagent | reverse primer to screen for epha4a Δ651 mutant | This study | GCTCGCTCACATTCAACACA | |
| Sequence-based reagent | genomic target of gRNA to create epha4a KD mutant | This study | GGAAAGCGTGAGATCTGTG | |
| Sequence-based reagent | Donor oligonucleotide to create epha4a KD mutant | This study | AAGATGCCTGGAAAGCGTGAaATtTGcGTGGCCATAAAAACCCTAAtGGCAGGgTACACCGACAAGCAAAGGCG | |
| Sequence-based reagent | forward primer to screen for epha4a KD mutant | This study | CCCTTCACATACGAGGACCCC | |
| Sequence-based reagent | reverse primer to screen for epha4a KD mutant | This study | GCTCGCTCACATTCAACACA | |
| Sequence-based reagent | genomic target of gRNA to create epha4a ΔPDZBD mutant | This study | GCAGCAAATGCAGGACAGGA | |
| Sequence-based reagent | forward primer to screen for epha4a ΔPDZBD mutant | This study | AGTTCTCCCCCTCAAACAAAA | |
| Sequence-based reagent | reverse primer to screen for epha4a ΔPDZBD mutant | This study | CAGTACAGCGCTAAACGATCC | |
| Sequence-based reagent | genomic targets of gRNAs to create deletions in mypt1 | This study | GGTACGGTACGAAAGAGAGG ACGAAGGTGAAGTTCGACGA GGAACGAGCAGTTAAAGCGC CTGCTCGAGCGGAGACACGG TGGCGGACGCCAAGCAGAAG | |
| Sequence-based reagent | forward primer to screen for deletions in mypt1 | This study | CGACGTAACCAGGTTTGTTCA | |
| Sequence-based reagent | reverse primer to screen for deletions in mypt1 | This study | ACATTGGCGTAGTTGATGTCG | |
| Sequence-based reagent | genomic targets of gRNAs to create deletions in yap1 | This study | CTCAACCTCATCGGCACGGA CCCGAACATGGACGATCTGG AAGAGCCTCCAGATCGGTCT | |
| Sequence-based reagent | forward primer to screen for deletions in yap1 | This study | GCCGGACACAGAACATCTTTT | |
| Sequence-based reagent | reverse primer to screen for deletions in yap1 | This study | CTGTTTGTGGTTTCTGAGGGG | |
| Sequence-based reagent | genomic targets of gRNAs to create deletions in taz | This study | CAAAGACCTGGACACGGATC GAGATGGCCTTCACCCCCAA GGAGACTCCACTCCCACACC | |
| Sequence-based reagent | forward primer to screen for deletions in taz | This study | AAAACTCTCCAAACTCCACGC | |
| Sequence-based reagent | reverse primer to screen for deletions in taz | This study | CCGTGTTCAATACTCATTCCCC | |
| Sequence-based reagent | genomic targets of gRNAs to create deletions in tead1a | This study | TAAGCCCATGGACAATGACG TGACATTGAGCAGAGCTTTC CATTCTCTCAATGTCCTCCC | |
| Sequence-based reagent | forward primer to screen for deletions in tead1a | This study | GTCAGTGTGCCTTGAGTTCTC | |
| Sequence-based reagent | reverse primer to screen for deletions in tead1a | This study | ATTTTGCCCTCATCAGACAGG | |
| Sequence-based reagent | genomic targets of gRNAs to create deletions in tead3 | This study | CATTGAACAAAGCTTCCAGG CTGAGAGGATGATCTTTCTG ATGGACAAAACCGGAATGGA | |
| Sequence-based reagent | forward primer to screen for deletions in tead3 | This study | GAGCCGCCACCATTGCAG | |
| Sequence-based reagent | reverse primer to screen for deletions in tead3 | This study | TAGCTCTGACTAACGTGGGTG | |
| Sequence-based reagent | RVD sequences of ephrinb3b TALENs | This study | Left: NG HD NN NN NN NN NI NG NG NG HD NI NI NI NG NN NN HD Right: HD NI NN NN NI NN NI NI NG NG HD HD HD NI NI NG HD HD NI NG |
Additional files
-
Transparent reporting form
- https://doi.org/10.7554/eLife.49696.015
Download links
A two-part list of links to download the article, or parts of the article, in various formats.
Downloads (link to download the article as PDF)
Open citations (links to open the citations from this article in various online reference manager services)
Cite this article (links to download the citations from this article in formats compatible with various reference manager tools)
Actomyosin regulation by Eph receptor signaling couples boundary cell formation to border sharpness
eLife 8:e49696.
https://doi.org/10.7554/eLife.49696


