GC content shapes mRNA storage and decay in human cells
- Sorbonne Université, CNRS, Institut de Biologie Paris Seine (IBPS), Laboratoire de Biologie du Développement, France
- Ecole Normale Supérieure, Institut de Biologie de l'ENS, IBENS, France
- ncRNA, Epigenetic and Genome Fluidity, Institut Curie, PSL Research University, CNRS UMR 3244, Sorbonne Université, France
- Université Côte d'Azur, CNRS, INSERM, IRCAN, FHU-OncoAge, France
- Université Côte d'Azur, CNRS, INSERM, iBV, France
- University of Cambridge, United Kingdom
- Sorbonne Université, CNRS, Institut de Biologie Paris Seine (IBPS), ARTbio Bioinformatics Analysis Facility, France
Figures
Figure 1 with 1 supplement
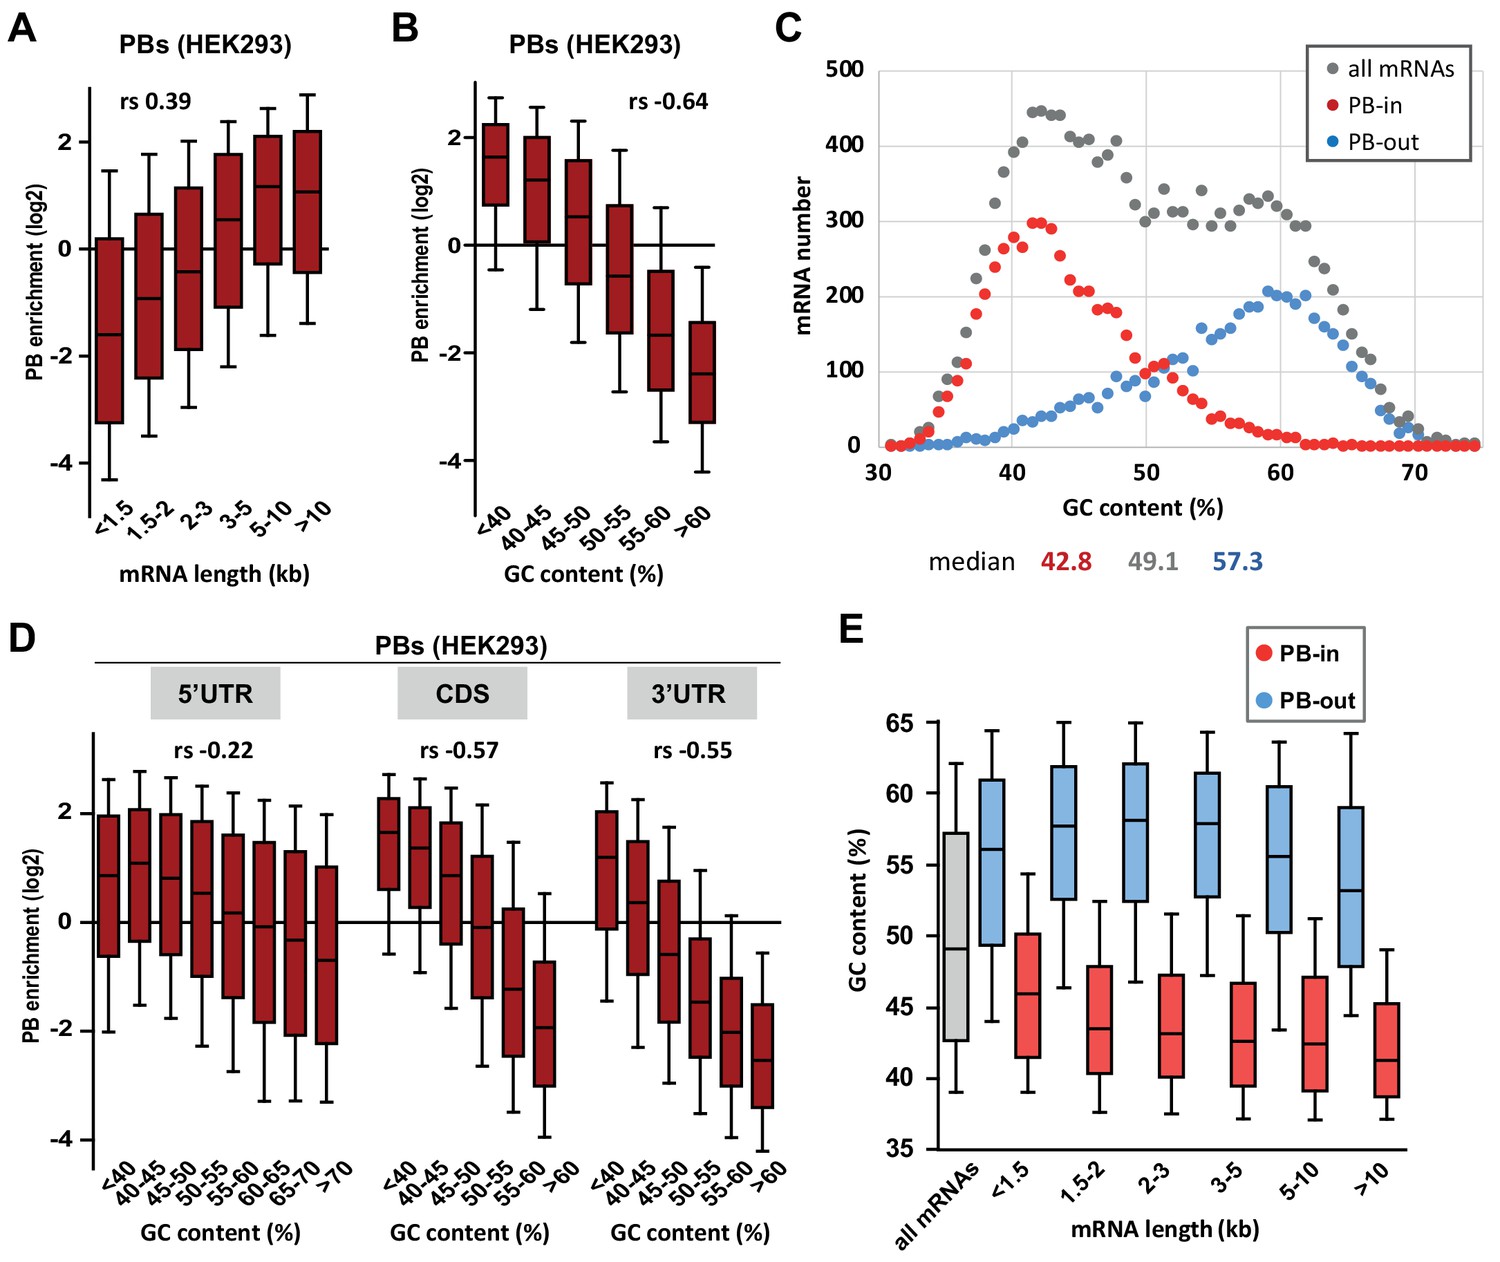
PB mRNAs are AU-rich and longer than average.
(A) Long mRNAs are particularly enriched in PBs. Transcripts were subdivided into six classes depending on their length (from <1.5 kb to >10 kb). The boxplots represent the distribution of their respective enrichment in PBs. The boxes represent the 25–75 percentiles and the whiskers the 10–90 percentiles. rs, Spearman correlation coefficient. (B) AU-rich mRNAs are particularly enriched in PBs. Transcripts were subdivided into six classes depending on their GC content (from <40 to >60%) and analyzed as in (A). (C) PBs mostly contain the AU-rich fraction of the transcriptome. The human transcriptome was binned depending on its GC content (0.7% GC increments). The graph represents the number of PB-enriched (PB-in, p<0.05, n = 5200) and PB-excluded (PB-out, p<0.05, n = 4669) transcripts in each bin. The distribution of all transcripts is shown for comparison (n = 14443). The median GC value is indicated below for each group. (D) mRNA localization in PBs mostly depends on the GC content of their CDS and 3’UTR. The analysis was repeated as in (B) using the GC content of the 5’UTR, CDS or 3’UTR, as indicated. For 5’UTRs, the >60% class was subdivided into three classes to take into account their higher GC content compared to CDSs and 3’UTRs. −0.57 and −0.55 are not significantly different (p=0.17), while −0.22 and −0.55 are (p<0.0001) (E) GC content is lower in PB-enriched mRNAs than PB-excluded ones independently of their length. The GC content distribution of PB-enriched (PB-in, p<0.05) and PB-excluded (PB-out, p<0.05) mRNAs was analyzed as in (B).
Figure 1—figure supplement 1
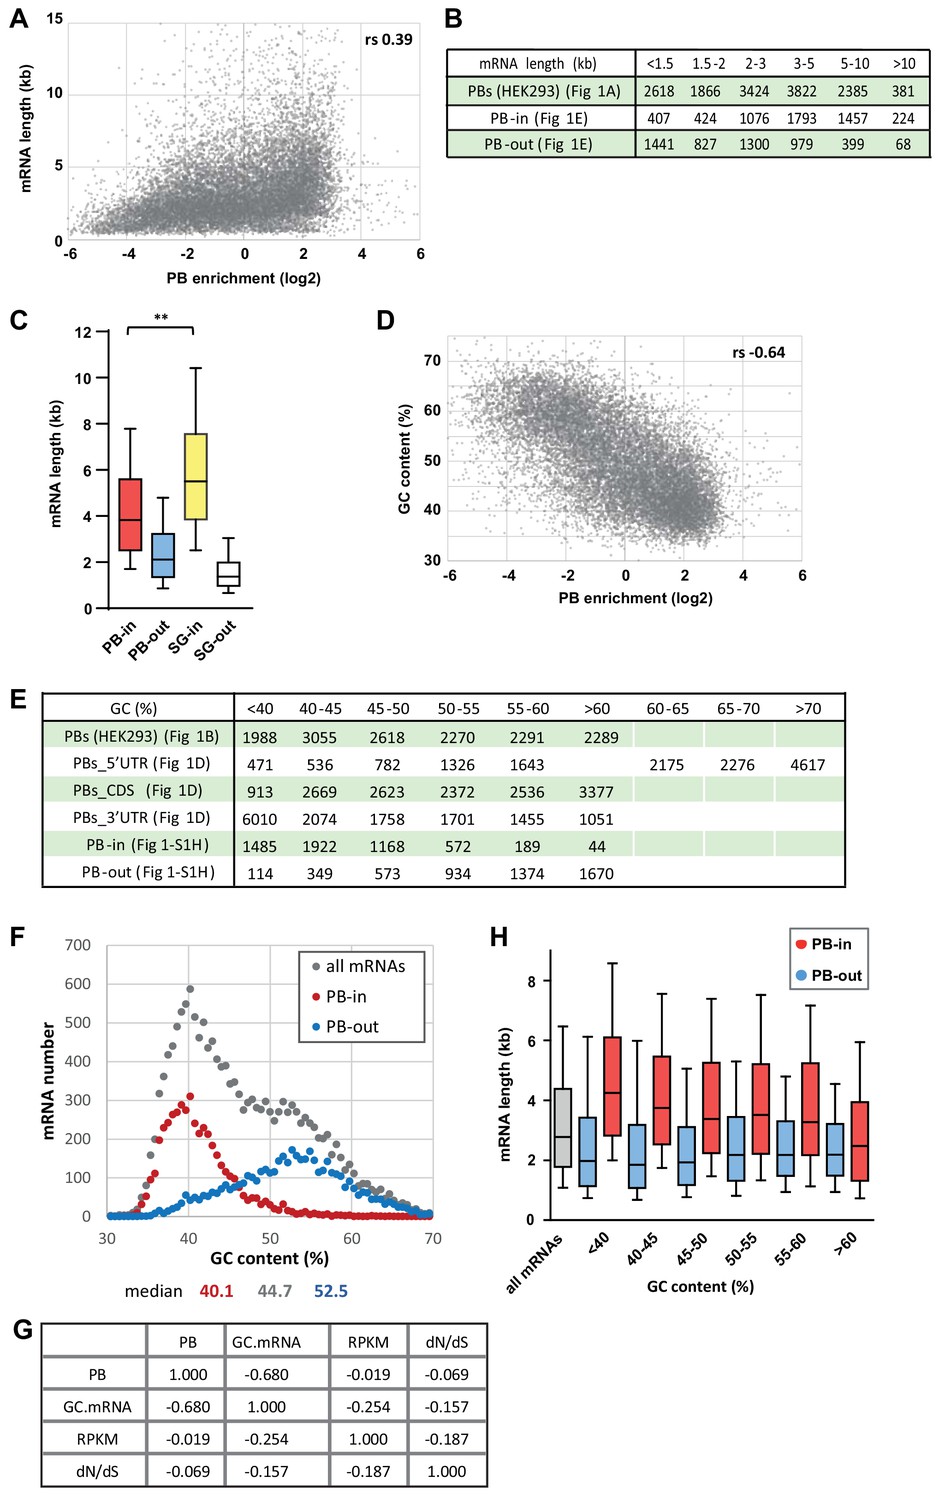
PB-enriched mRNAs tend to be long and AU-rich.
(A) The transcripts enriched in PBs tend to be long. The mRNA length was expressed as a function of PB enrichment. rs, Spearman correlation coefficient.(B) Number of transcripts in the different classes analyzed in Figure 1A,E. (C) PB mRNAs are longer than PB-excluded ones, but shorter than SG mRNAs. The boxplot represents the distribution of length of PB-enriched (PB-in) and PB-excluded (PB-out) mRNAs, and SG-enriched (SG-in) and SG-depleted (SG-out) mRNAs, as taken from Wells et al. (2017). The length of PB-enriched and SG-enriched mRNAs was statistically different using a two-tail Mann-Whitney test. **, p<0.0001. (D) The transcripts enriched in PBs tend to be AU-rich. The mRNA GC content was expressed as a function of PB enrichment. rs, Spearman correlation coefficient. (E) Number of transcripts in the different classes analyzed in Figure 1B,D and Figure 1—figure supplement 1. (F) PBs mostly contain transcripts from AU-rich genes. The graph was constructed as in Figure 1C using the GC content of the genes. The median value is indicated below for each group. (G) Partial correlations between PB localization (PBs), mRNA GC content (GC.mRNA), mRNA expression (RPKM) and sequence conservation (dN/dS). For each line, individual cells represent the correlation between the two corresponding variables, controlling for the effects of all other variables. dN/dS is the ratio of non-synonymous (dN) to synonymous (dS) changes between two organisms, here computed between human and mouse. It is used as a measure of natural selection strength in coding sequence. (H) PB-enriched mRNAs are longer than PB-excluded ones independently of their GC content. The distribution of length of PB-enriched (PB-in) and PB-excluded (PB-out) mRNAs was analyzed as in Figure 1E.
Figure 2 with 2 supplements
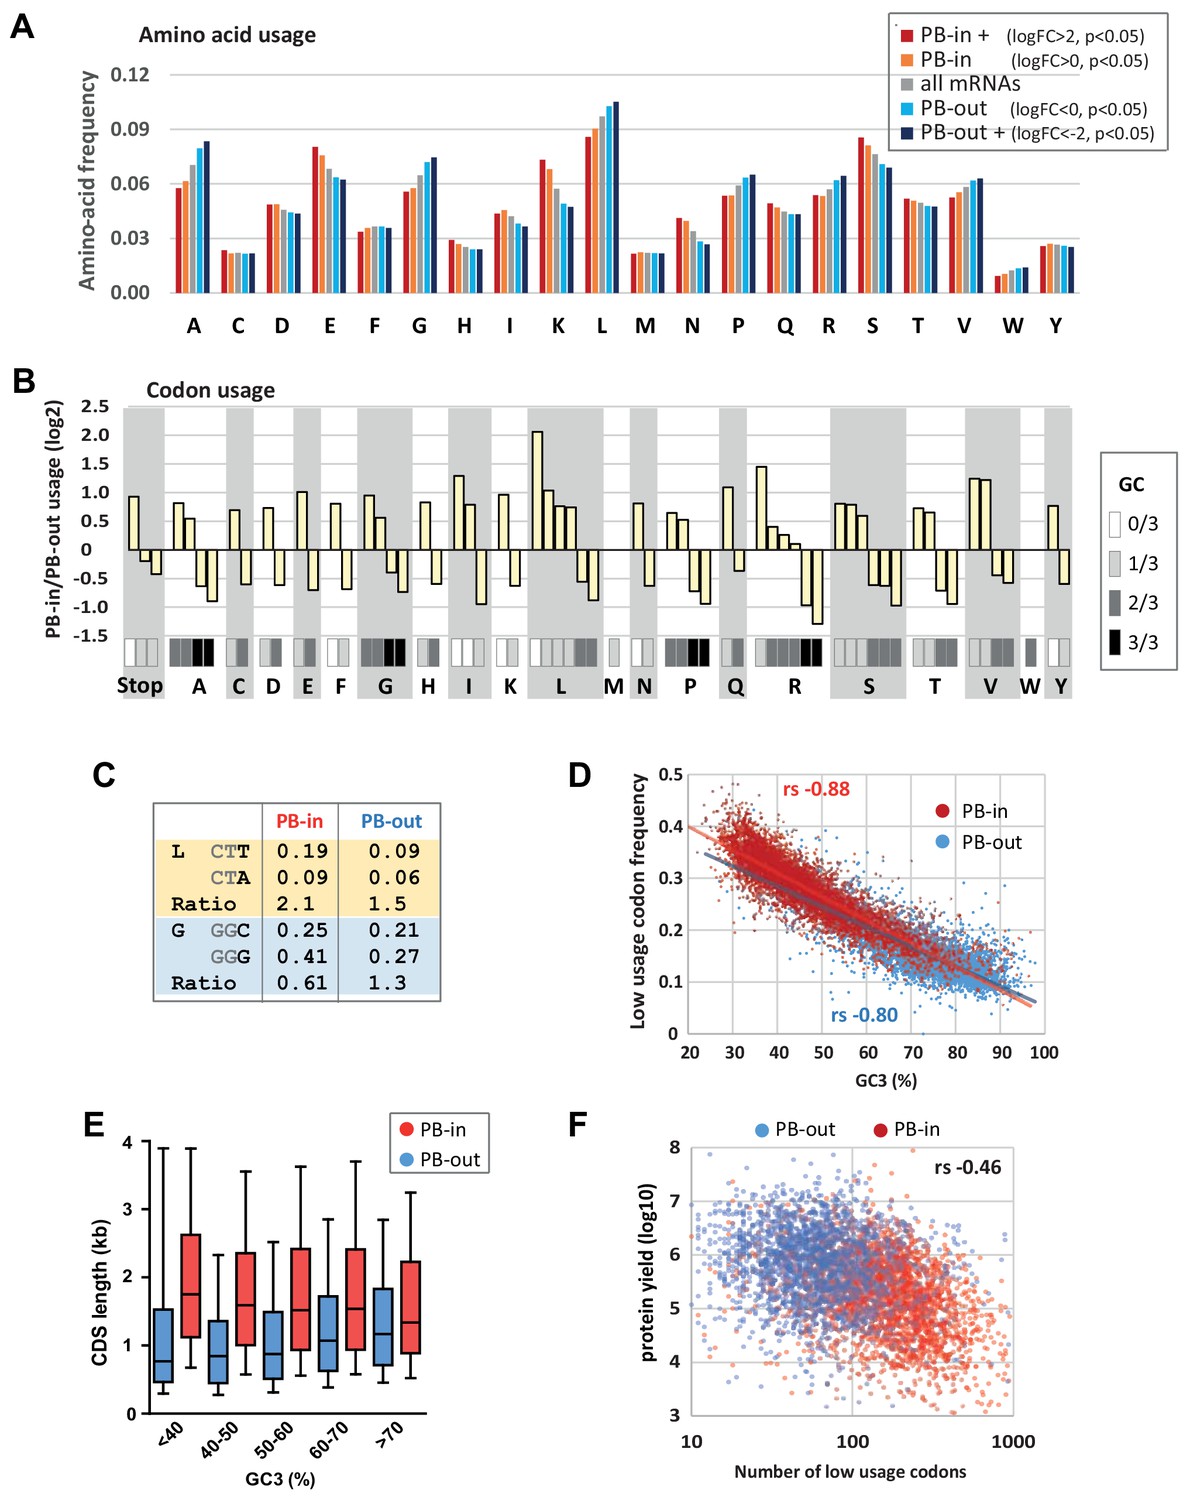
Codon usage is strongly biased in PBs.
(A) PB mRNAs and PB-excluded mRNAs encode proteins with different amino acid usage. The graph represents the frequency of each amino acid in the proteins encoded by mRNAs enriched or excluded from PBs, using the indicated PB enrichment thresholds. (B) Codon usage bias in and out of PBs follows their GC content. The relative codon usage for each amino acid was calculated in PB-enriched (PB-in) and PB-excluded (PB-out) mRNAs, using a PB enrichment threshold of +/- 1 (in log2). The graph represents the log2 of their ratio (PB-in/PB-out) and was ranked by decreasing values for each amino acid. The GC content of each codon is gray-coded below, using the scale indicated on the right. (C) The usage of some codons is biased independently of their GC content. Two examples are shown encoding Leucine (L) and Glycine (G). (D) The frequency of low usage codons strongly correlates with the GC content of the CDS, independently of their PB localization. The frequency of low usage codons was calculated for mRNAs excluded (PB-out) and enriched (PB-in) in PBs using a PB enrichment threshold of +/- 1 (in log2). It was expressed as a function of the CDS GC content at position 3 (GC3). Note that the slopes of the tendency curves are similar for PB-enriched and PB-excluded transcripts. The difference between the Spearman correlation coefficients (rs) are nevertheless statistically significant (p<0.0001). (E) PB mRNAs have longer CDS than PB-excluded mRNAs. The analysis was performed as in Figure 1E. (F) The number of low usage codons per CDS is a good determinant of both protein yield and PB localization. The protein yield was expressed as a function of the number of low usage codons for PB-enriched (PB-in) and PB-excluded (PB-out) mRNAs. rs, Spearman correlation coefficient.
Figure 2—figure supplement 1
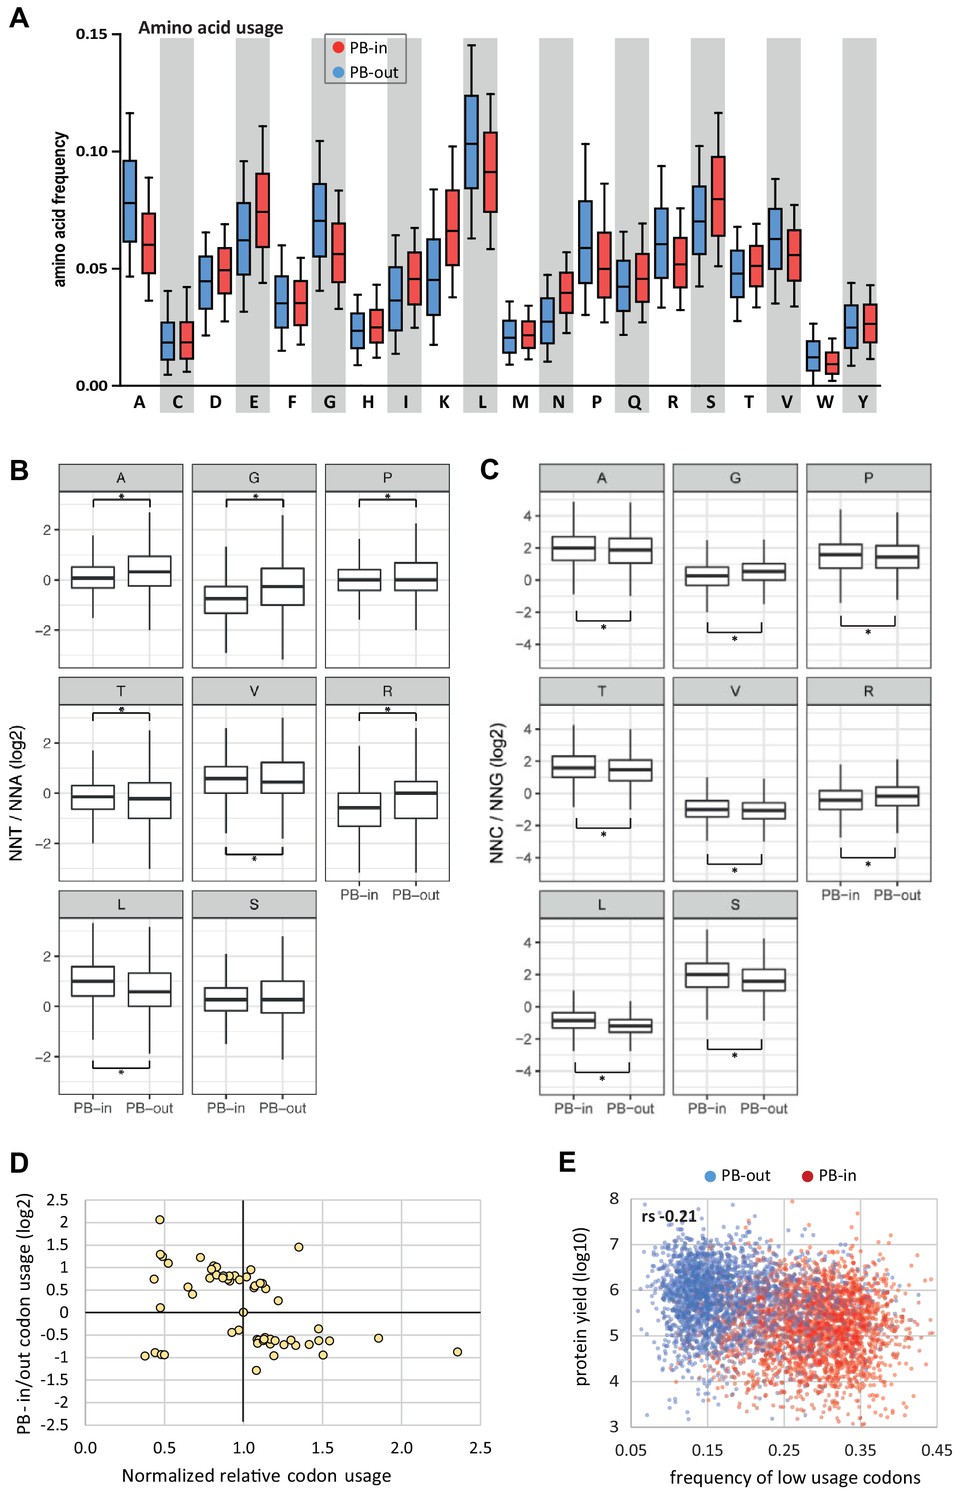
Amino acid usage and codon usage biases in PBs.
(A) PB mRNAs and PB-excluded mRNAs encode proteins with different amino acid usage. The boxplots represent the distribution of the frequency of each amino acid in the proteins encoded by mRNAs enriched (PB-in, n = 5500) or excluded from PBs (PB-out, n = 5104). The boxes represent the 25–75 percentiles and the whiskers the 10–90 percentiles. (B,C) Codon usage biases independent on the GC content. For each amino acid with 4 or six synonymous codons, the ratio of usage of NNU to NNA (B) or NNC to NNG (C) was calculated. The boxplots represent the distribution of these ratios in PB-enriched (PB-in) and PB-excluded (PB-out) mRNAs using a PB enrichment threshold of +/- 1(log2). All differences were statistically significant (*, p<0.05) except for the Serine NNT/NNA ratio. Note the change of scale between (B) and (C). (D) Low usage codons are more frequent in PB mRNAs. The ratio between the relative codon usage in PB-enriched and PB-excluded (PB-in/PB-out) mRNAs was expressed as a function of their global relative usage, after normalization by the number of synonymous codons. (E) The frequency of low usage codons correlates weakly with protein yield. The protein yield was expressed as a function of the frequency of low usage codons for PB-enriched (PB-in) and PB-excluded (PB-out) mRNAs. rs, Spearman correlation coefficient.
Figure 2—figure supplement 2
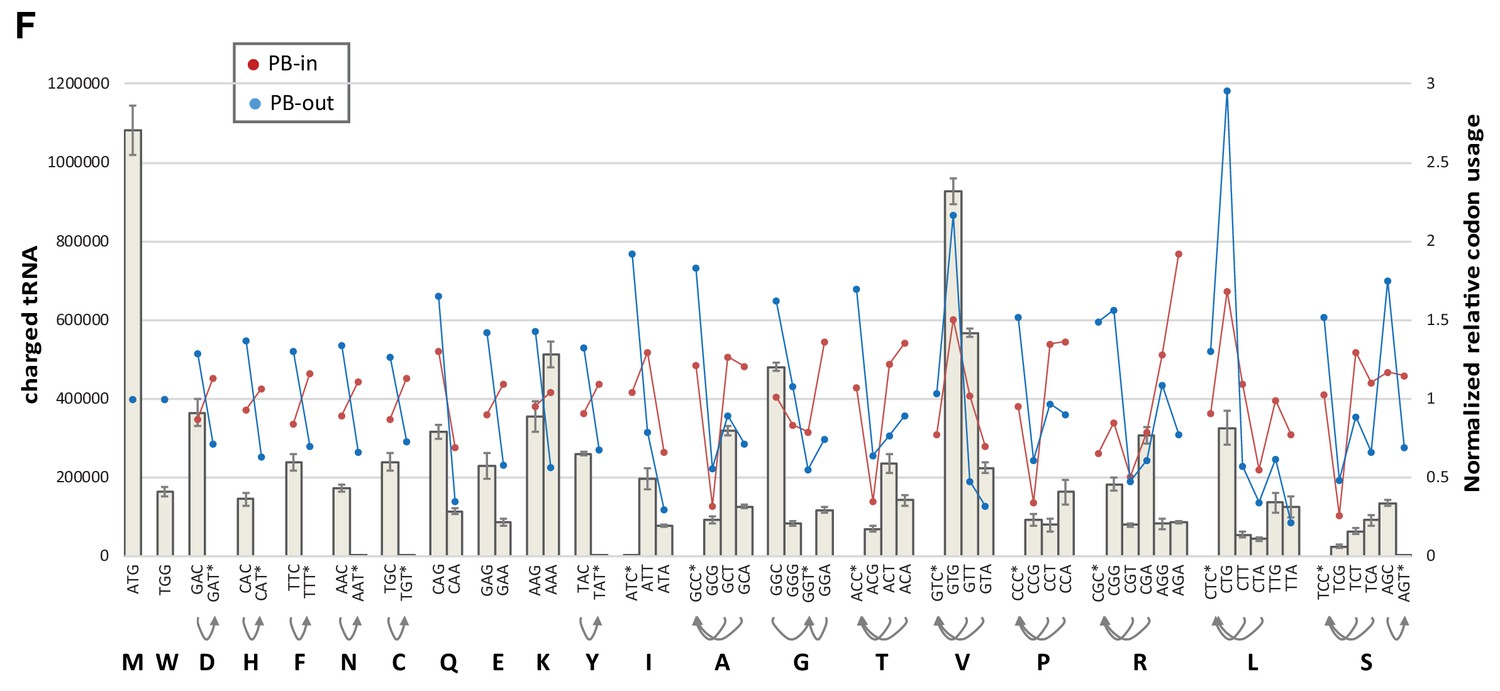
Codon usage biases and abundance of amino-acylated tRNA.
Codon usage in PB-excluded mRNAs does not closely follow amino-acylated tRNA abundance. The abundance of charged tRNA isodecoders in HEK293 cells was taken from Evans et al. (24) and aggregated for each codon (gray bars). Codons with no cognate tRNA are indicated with a star, and their possible decoding by near-cognate tRNAs with arrows. Normalized codon usage in PB-enriched and PB-excluded mRNAs is on the right y axis.
Figure 3 with 3 supplements
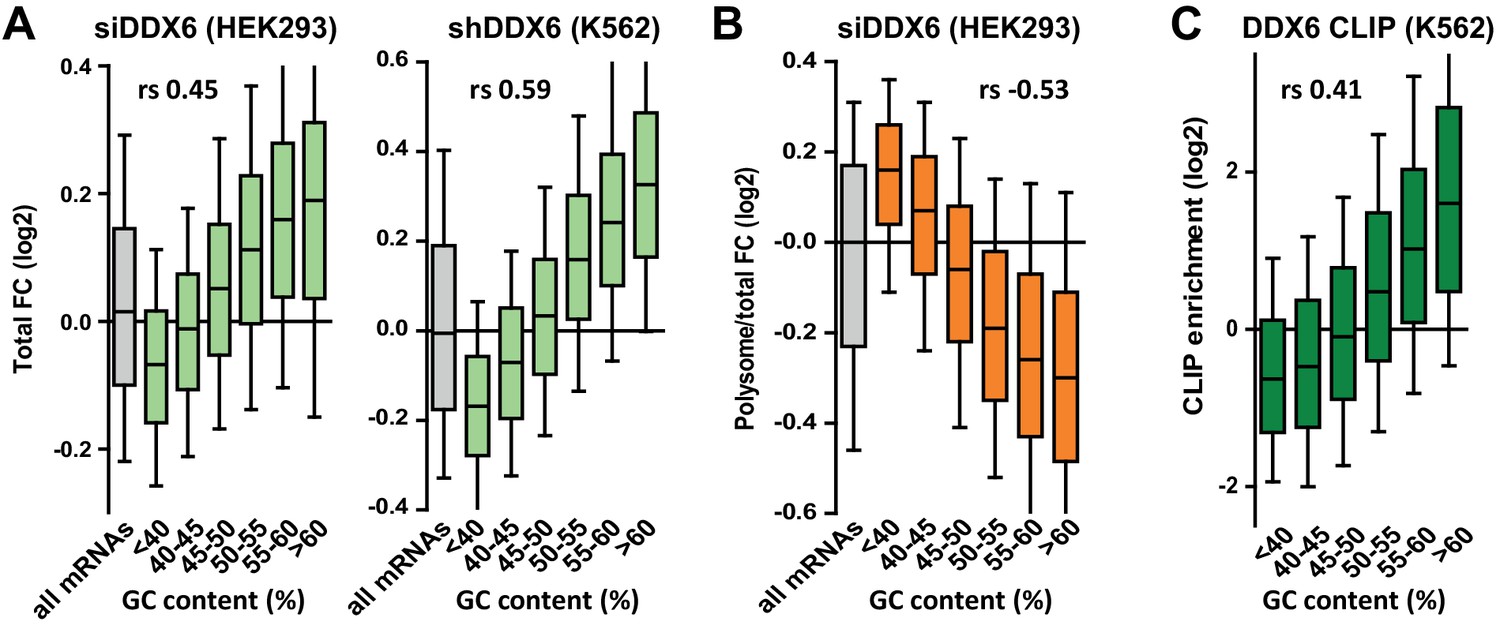
DDX6 silencing has opposite effects on mRNA fate depending on their GC content.
(A) mRNA stabilization after DDX6 silencing in HEK293 and K562 cells applies to GC-rich mRNAs. The fold-changes (FC) in mRNA accumulation were analyzed as in Figure 1B. (B) mRNA translation derepression after DDX6 silencing in HEK293 cells applies to AU-rich mRNAs. The fold-changes in translation rate (polysomal/total mRNA ratio) were analyzed as in (A). (C) GC-rich mRNAs are particularly enriched in the DDX6 CLIP experiment.
Figure 3—figure supplement 1
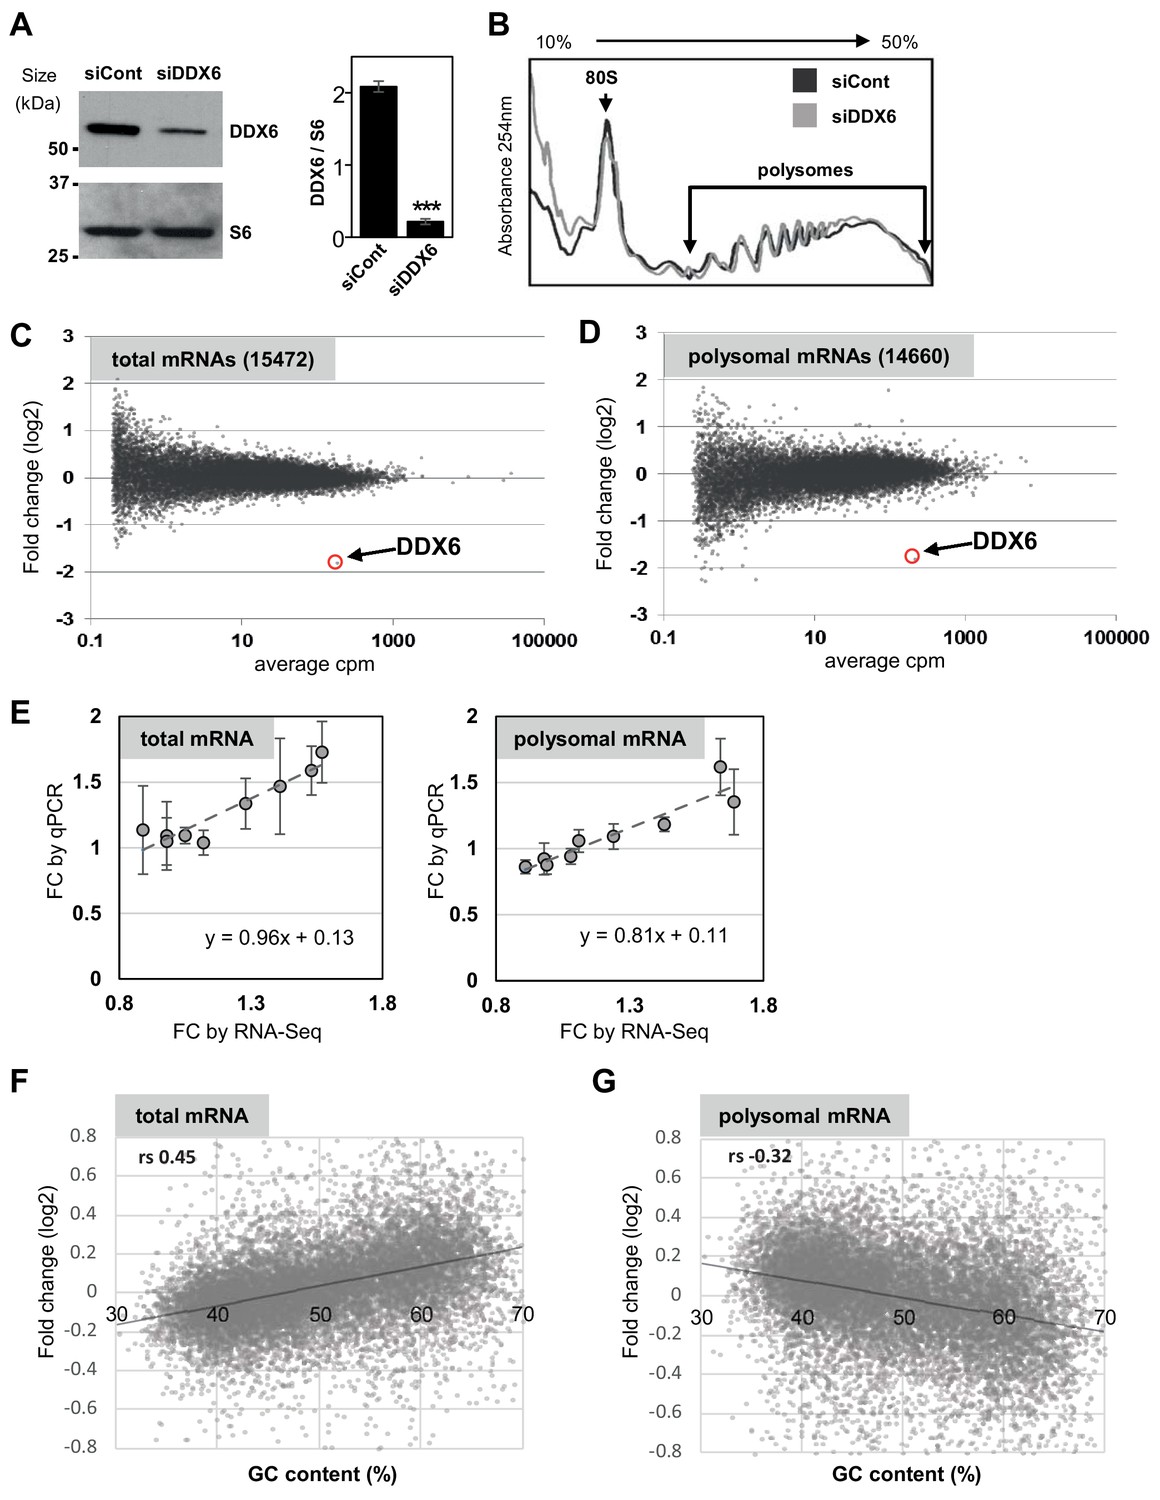
Polysome profiling following DDX6 silencing.
(A) Western blot analysis of DDX6 in siRNA-transfected HEK293 cells. The DDX6 signal, normalized using the ribosomal protein S6, is indicated on the right panel (n = 3; p<0.001; t-test). Error bars, SD. (B) Representative polysome profiles of siRNA-transfected cells. (C,D) MA plots of mRNA fold changes between siRNA-transfected and control cells in total (C) and polysomal (D) mRNA. (E) Correlation between fold changes (FC) of randomly selected mRNAs measured by qPCR and calculated from RNA-Seq data, in total and polysomal fractions (n = 3). Error bars, SD. (F,G) Correlation between total (F) and polysomal (G) mRNA fold-changes and mRNA GC content. Note that correlation is positive for total mRNAs and negative for polysomal mRNAs. rs, Spearman correlation coefficient.
Figure 3—figure supplement 2
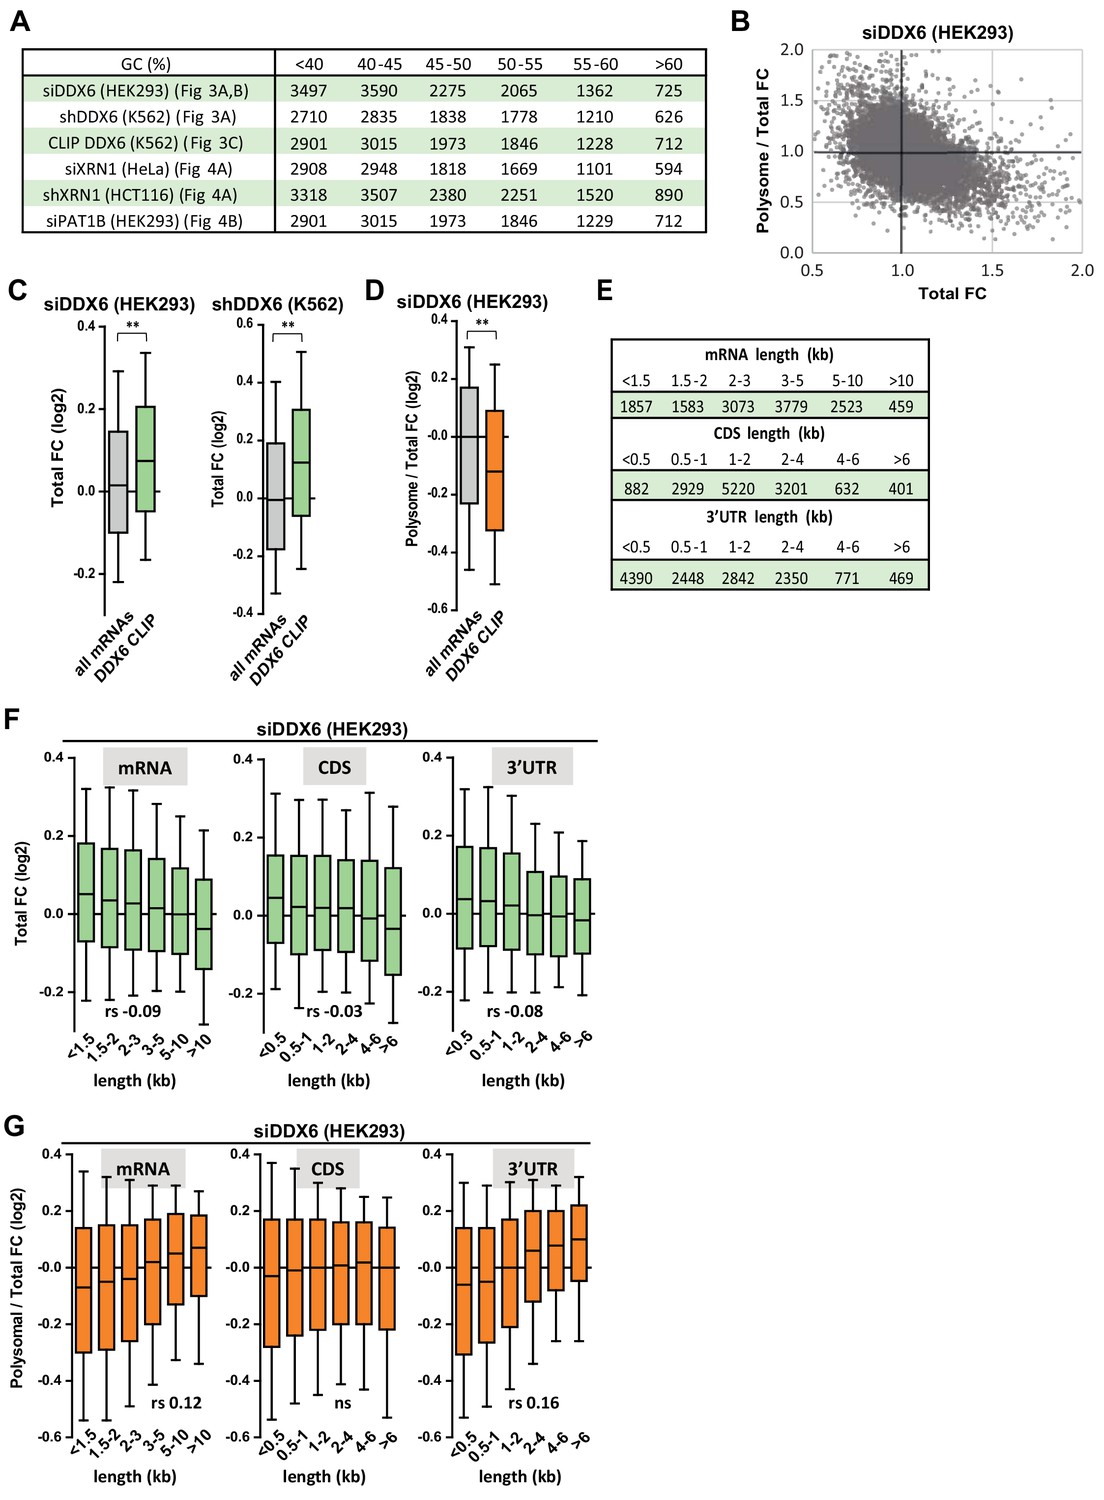
Impact of DDX6 binding and mRNA length on DDX6 dependency.
(A) Number of transcripts in the different classes analyzed in Figures 3 and 4A,B. (B) Dot plot representation of the changes in translation rate (Polysome/Total FC) as a function of changes in mRNA stability (Total FC) after DDX6 silencing. (C,D) DDX6-clipped targets tend to be particularly stabilized after DDX6 silencing in both HEK293 and K562 cells (C), but less affected than other mRNAs in terms of translation rate (D). The difference between DDX6-clipped mRNAs and all mRNAs was statistically different using a two-tail Mann-Whitney test. **, p<0.0001. (E) Number of transcripts in the different classes analyzed in (F) and (G). (F) Transcript length has a weak impact on mRNA abundance following DDX6 silencing. Transcripts were subdivided into six classes depending on their full length (from <1.5 to 10 kb, left panel), the length of their CDS (from <0.5 to 6 kb, middle panel) or 3’UTR (from <0.5 to 6 kb, right panel). The boxplots represent the distribution of their respective fold-changes in total mRNA. The difference between class 1 and 6 was statistically significant using a two tail Mann-Whitney test: p<0.0001 in all panels. rs, Spearman correlation coefficient. (G) The 3’UTR length has an impact on mRNA translation derepression following DDX6 silencing. The polysomal/total mRNA ratio was used as a proxy measurement of translation rate.The data are represented as in (F). Note that the difference between class 1 and 6 was statistically significant in left and right panels only.
Figure 3—figure supplement 3
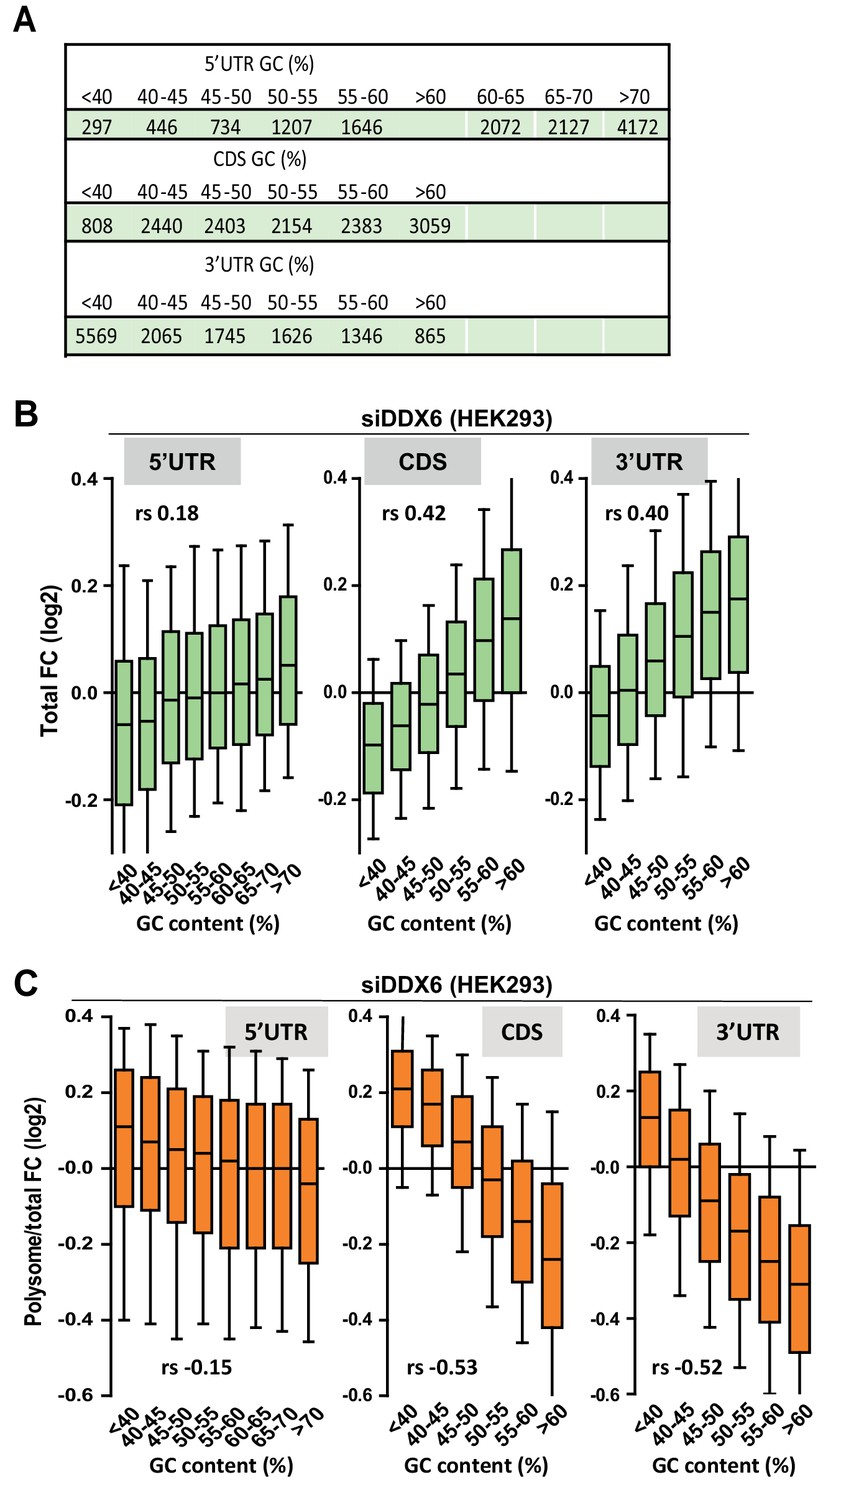
Impact of the GC content on DDX6-dependency.
(A) Number of transcripts in the different classes analyzed in (B) and (C). (B,C) mRNA abundance (B) and translation derepression (C) following DDX6 silencing in HEK293 cells mostly depends on the GC content of their CDS and 3’ UTR. The analysis was performed as in Figure 1D, using the polysomal/total mRNA ratio as a proxy measurement of translation rate. In (B), the Spearman correlation coefficients (rs) 0.40, 0.42 and 0.18 are significantly different from each other (p<0.0001). In (C), −0.52 and −0.15 are significantly different (p<0.0001), while 0.53 and 0.52 are not (p=0.37).
Figure 4 with 1 supplement
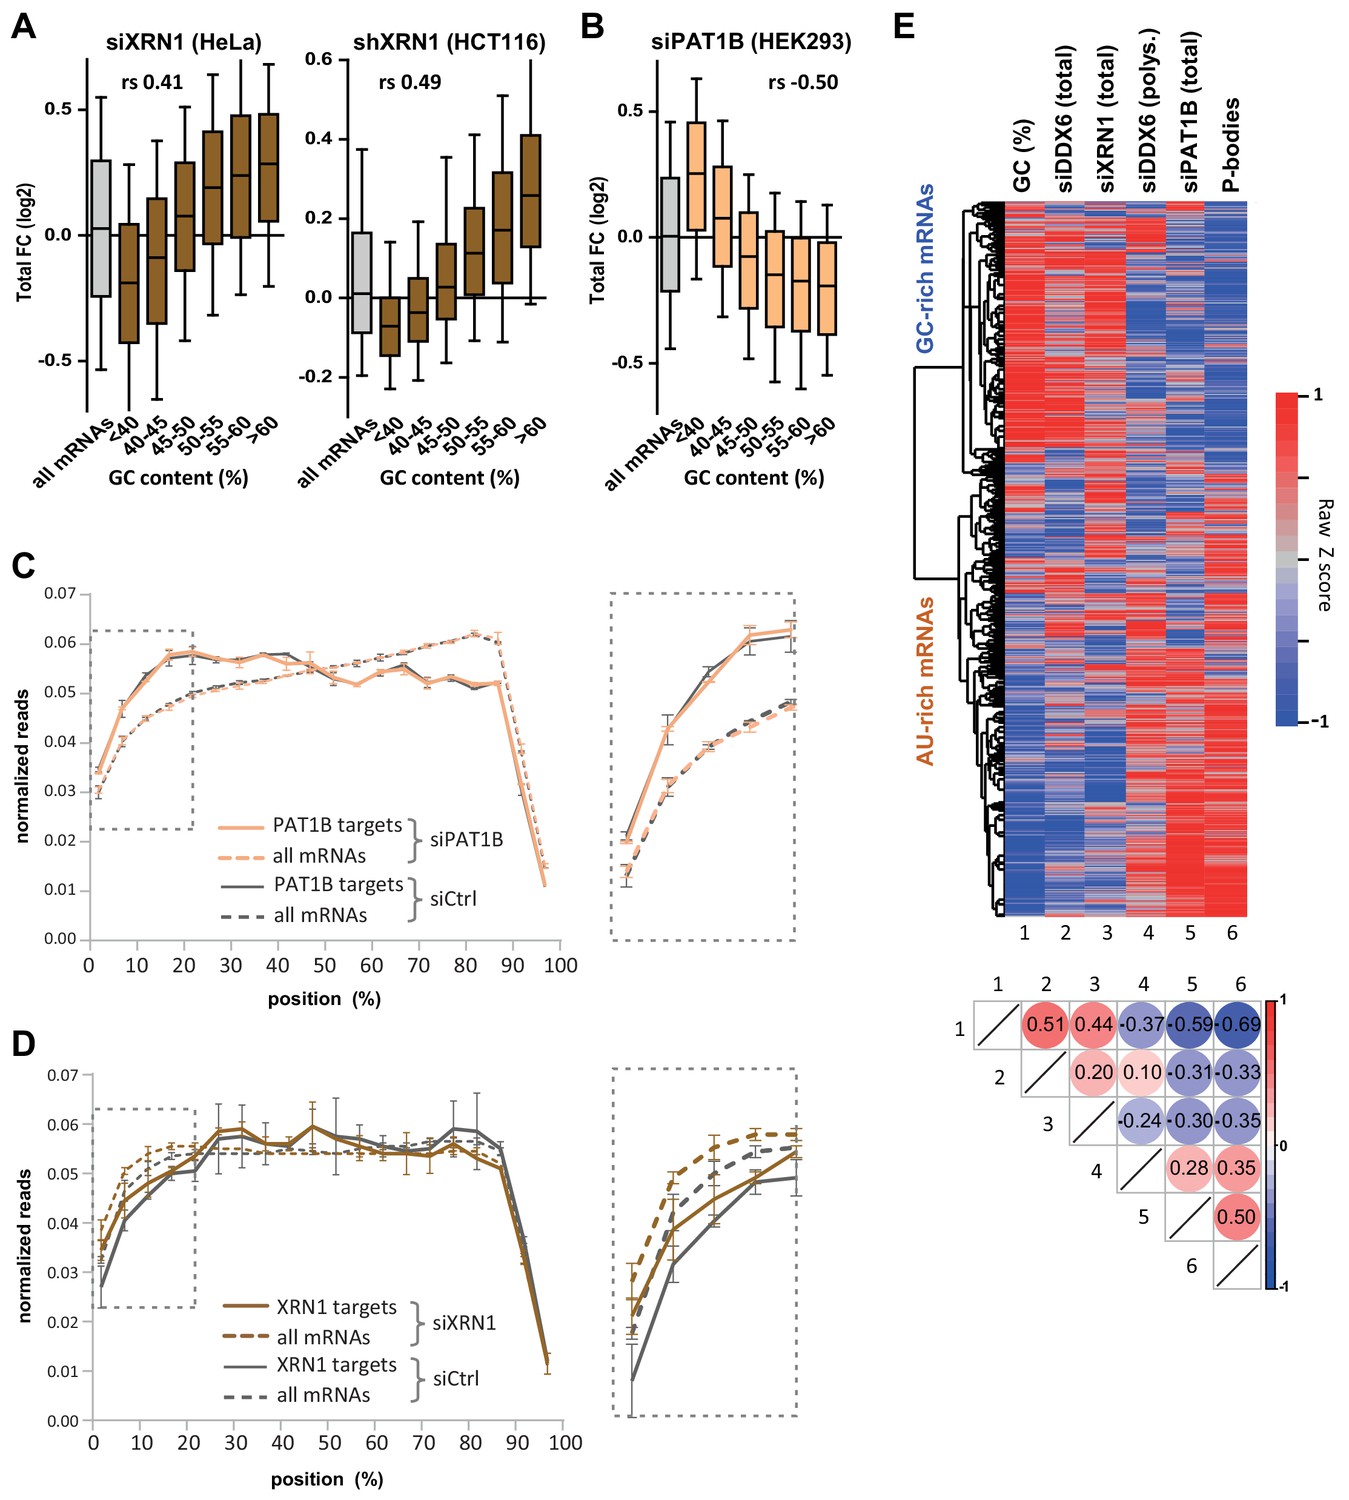
XRN1 and PAT1B targets have distinct GC content.
(A) mRNA stabilization after XRN1 silencing in HeLa and HCT116 cells applies to GC-rich mRNAs. The analysis was performed as in Figure 1B. The GC content distribution for all mRNAs is presented for comparison (in gray). (B) mRNA stabilization after PAT1B silencing in HEK293 cells applies to AU-rich mRNAs. The analysis was performed as in (A). (C) Read coverage of PAT1B targets (FC >0.7, n = 330, solid lines) and all mRNAs (n = 16000, dashed lines) in the siPAT1B dataset. The read coverage was analyzed in each duplicate experiment and normalized as described in Materials and methods. The average value in control cells (gray lines) and after PAT1B silencing (peach lines) was plotted, with the bars representing the duplicate values. An expanded view of the dashed box is presented on the right panel. (D) Read coverage of XRN1 targets (FC >0.8, n = 199, solid lines) and all mRNAs (n = 13760, dashed lines) in the siXRN1 dataset. The data were analyzed as in (C). (E) Clustering analysis of mRNAs depending on their GC content, their differential expression after silencing DDX6, XRN1 or PAT1B, and their enrichment in PBs. Raw GC content and log2 transformed ratio of the other datasets were used for the clustering of both transcripts (lines) and datasets (columns). The values were color-coded as indicated on the right scale, and the Spearman correlation matrix is presented below (all p<10−48). The heatmap highlights the distinct fate of GC-rich and AU-rich mRNAs.
Figure 4—figure supplement 1
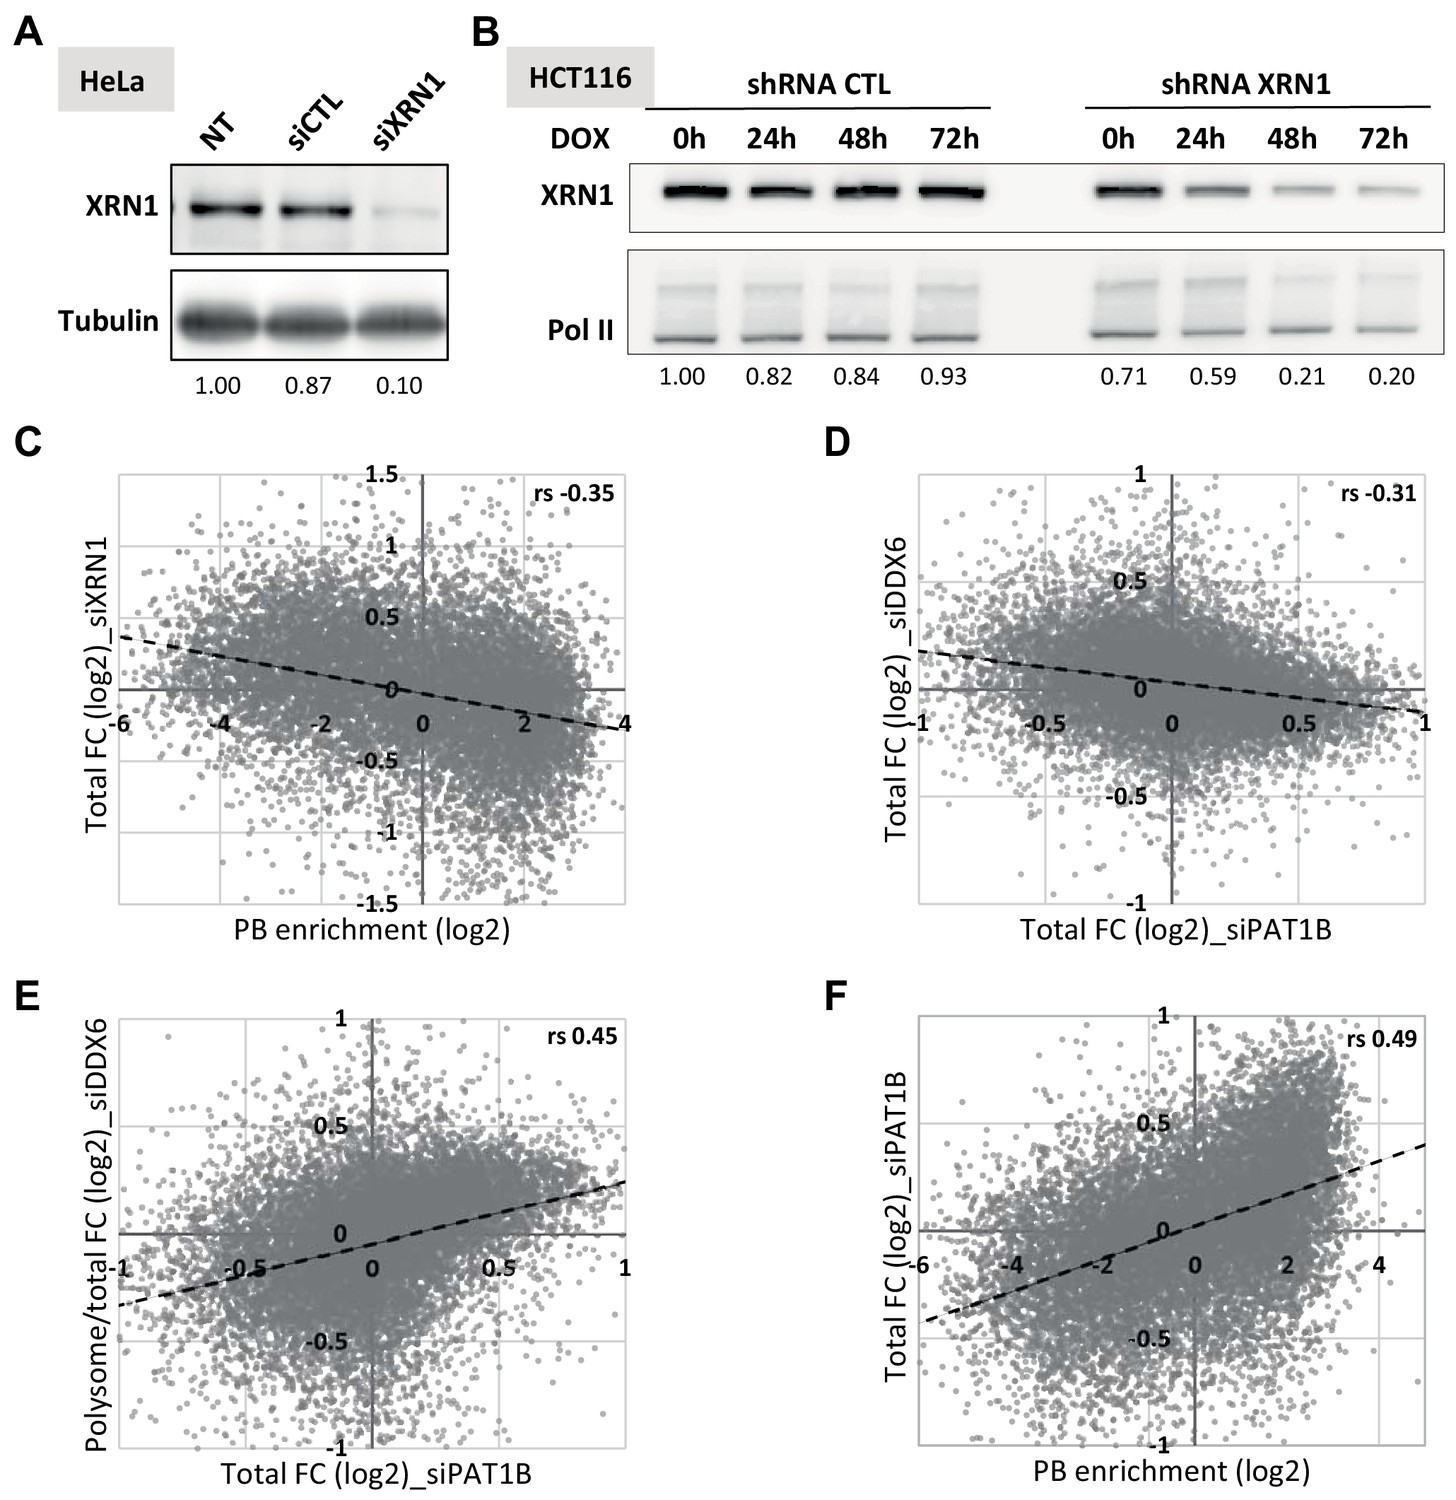
Transcriptome analysis following XRN1 and PAT1B silencing.
(A) Western blot analysis of XRN1 in siRNA-transfected HeLa cells. The XRN1 signal, normalized using tubulin, is indicated below. (B) Western blot analysis of XRN1 in shRNA-transfected HCT116 cells. Cells transfected with the XRN1 or control shRNA were induced for 0 to 72 hr with Doxycycline (DOX). The XRN1 signal, normalized using RNA Pol II, is indicated below. The time point 48 hr was chosen for library preparation. (C) XRN1 targets tend to be excluded from PBs. The fold-changes after XRN1 silencing in HeLa cells were expressed as a function of PB enrichment. (D, E) PAT1B targets are regulated by DDX6 at the level of translation but not decay. The total (D) and polysomal/total (E) mRNA fold-changes (FC) after DDX6 silencing were expressed as a function of fold-changes after PAT1B silencing. (F) PAT1B targets are enriched in PBs. The fold-changes of total RNA after PAT1B silencing were expressed as a function of PB enrichment. rs, Spearman correlation coefficients.
Figure 5 with 5 supplements
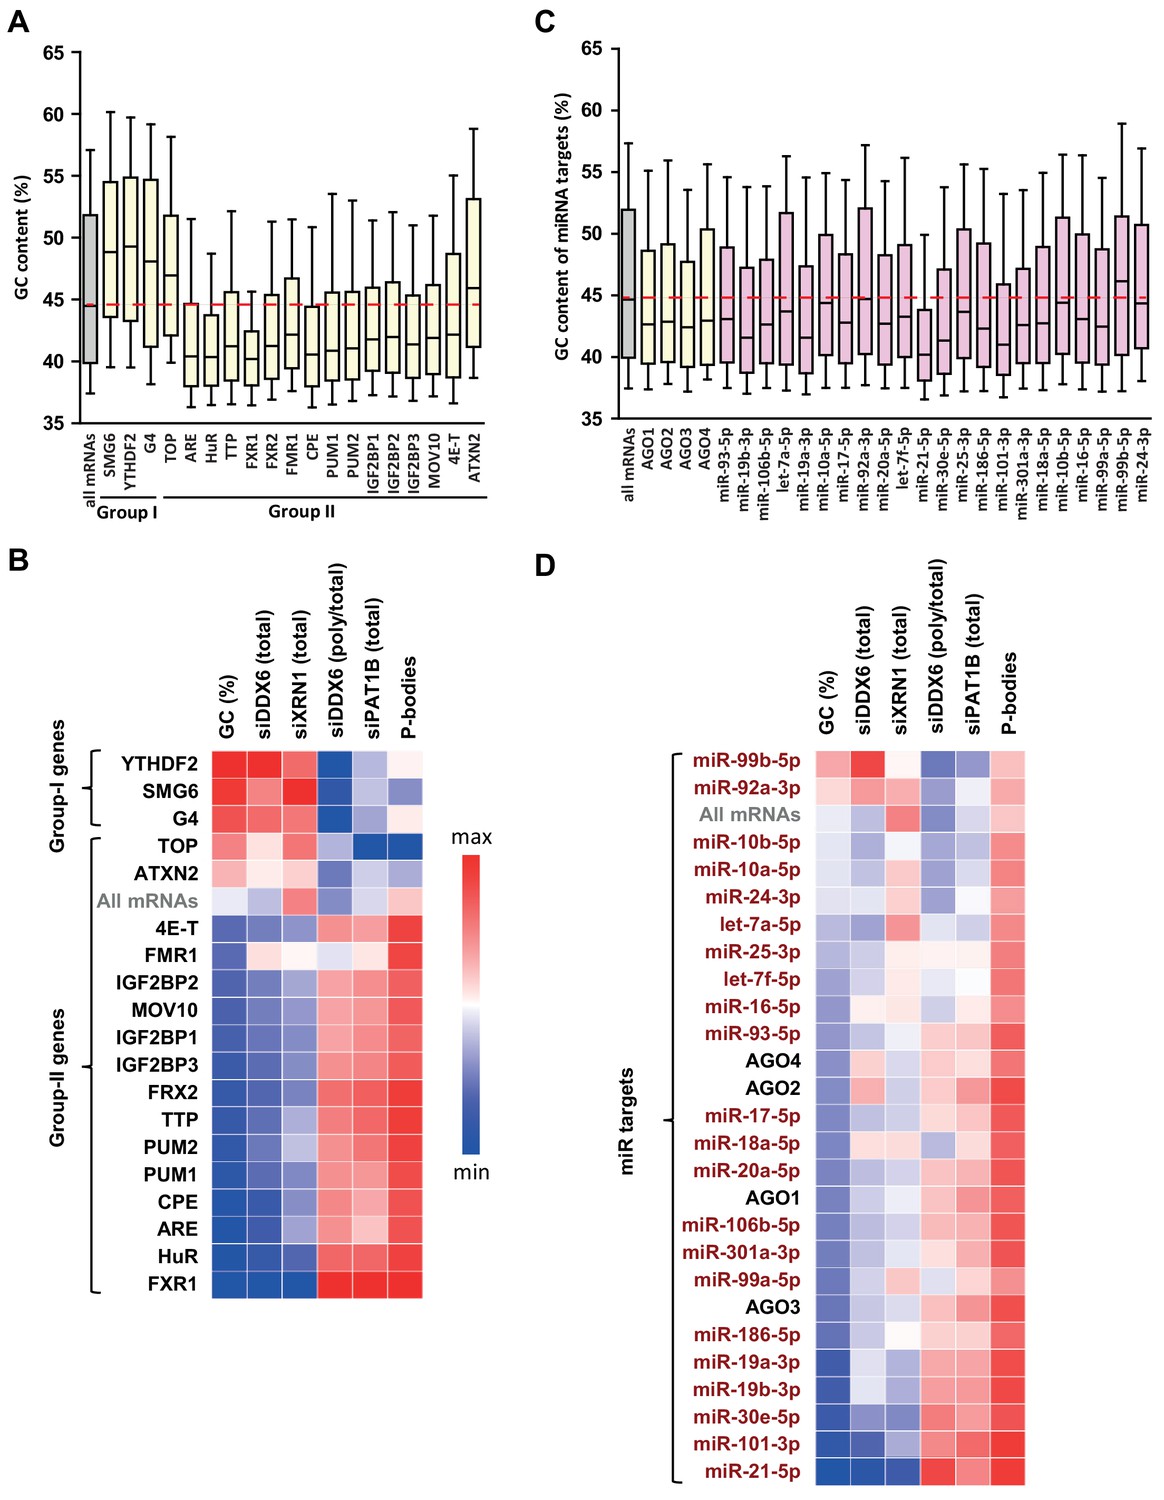
GC biases in the targets of various RNA decay factors, translation regulators and miRNAs.
(A) GC content biases in the targets of various RBPs. The targets of the indicated factors were defined using CLIP experiments or motif analysis (see Materials and methods). The boxplots represent the distribution of the GC content of their gene. The distribution for all mRNAs is presented for comparison (in gray) and the red dashed line indicates its median value. (B) Heatmap representation of the different factors depending on the behavior of their mRNA targets in the different datasets. The lines were ordered by increasing GC content, and the columns as in Figure 4E. (C) GC content biases in the targets of various AGO proteins and miRNAs. The AGO targets (in yellow) were defined using CLIP experiments and the miRNAs targets (in violet) using miRTarbase. The data are represented as in (A). (D) Heatmap representation of AGO and miRNAs depending on the behavior of their mRNA targets in the different datasets. The data were represented as in (B), using the same color code.
Figure 5—figure supplement 1
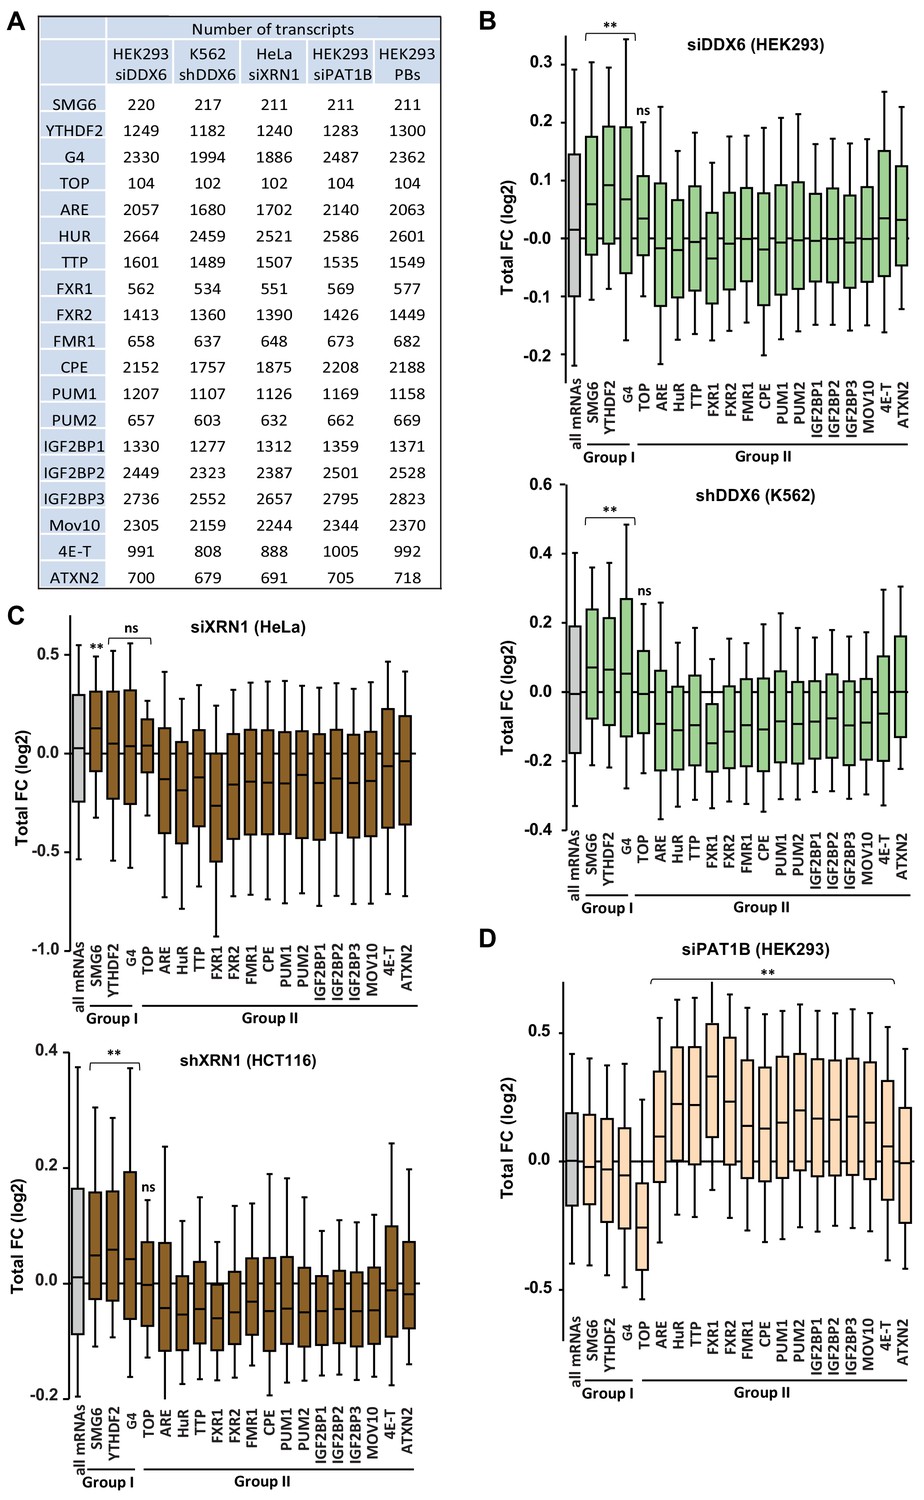
Targets of group I and II regulators (part I).
(A) Number of transcripts in the mRNA subsets analyzed in (B–D) and in Figure 5A,B, Figure 5—figure supplement 2A–D and Figure 5—figure supplement 4. (B) Sensitivity of the different mRNA subsets to DDX6 silencing in HEK293 (upper panel) and K562 cells (lower panel). The behavior of all mRNAs is shown for comparison (in gray). Only the targets of group I factorsaccumulated following DDX6 depletion. While the presented analysis uses the YTHDF2 targets reported in Vindry et al. (2019), the same pattern was observed using the targets reported in Ozgur et al. (2010). (C) Sensitivity of the different mRNA subsets to XRN1 silencing in HeLa (upper panel) and HCT116 cells (lower panel). Only the targets of group I factors accumulated following XRN1 depletion in HCT116 cells, and only SMG6 targets did so in HeLa cells. (D) Sensitivity of the different mRNA subsets to PAT1B silencing in HEK293 cells. Only the targets of group II factors accumulated following PAT1B depletion, except ATXN2. Two-tail Mann-Whitney test was performed with respect to all mRNAs. **, p<0.0001; ns, non-significant.
Figure 5—figure supplement 2
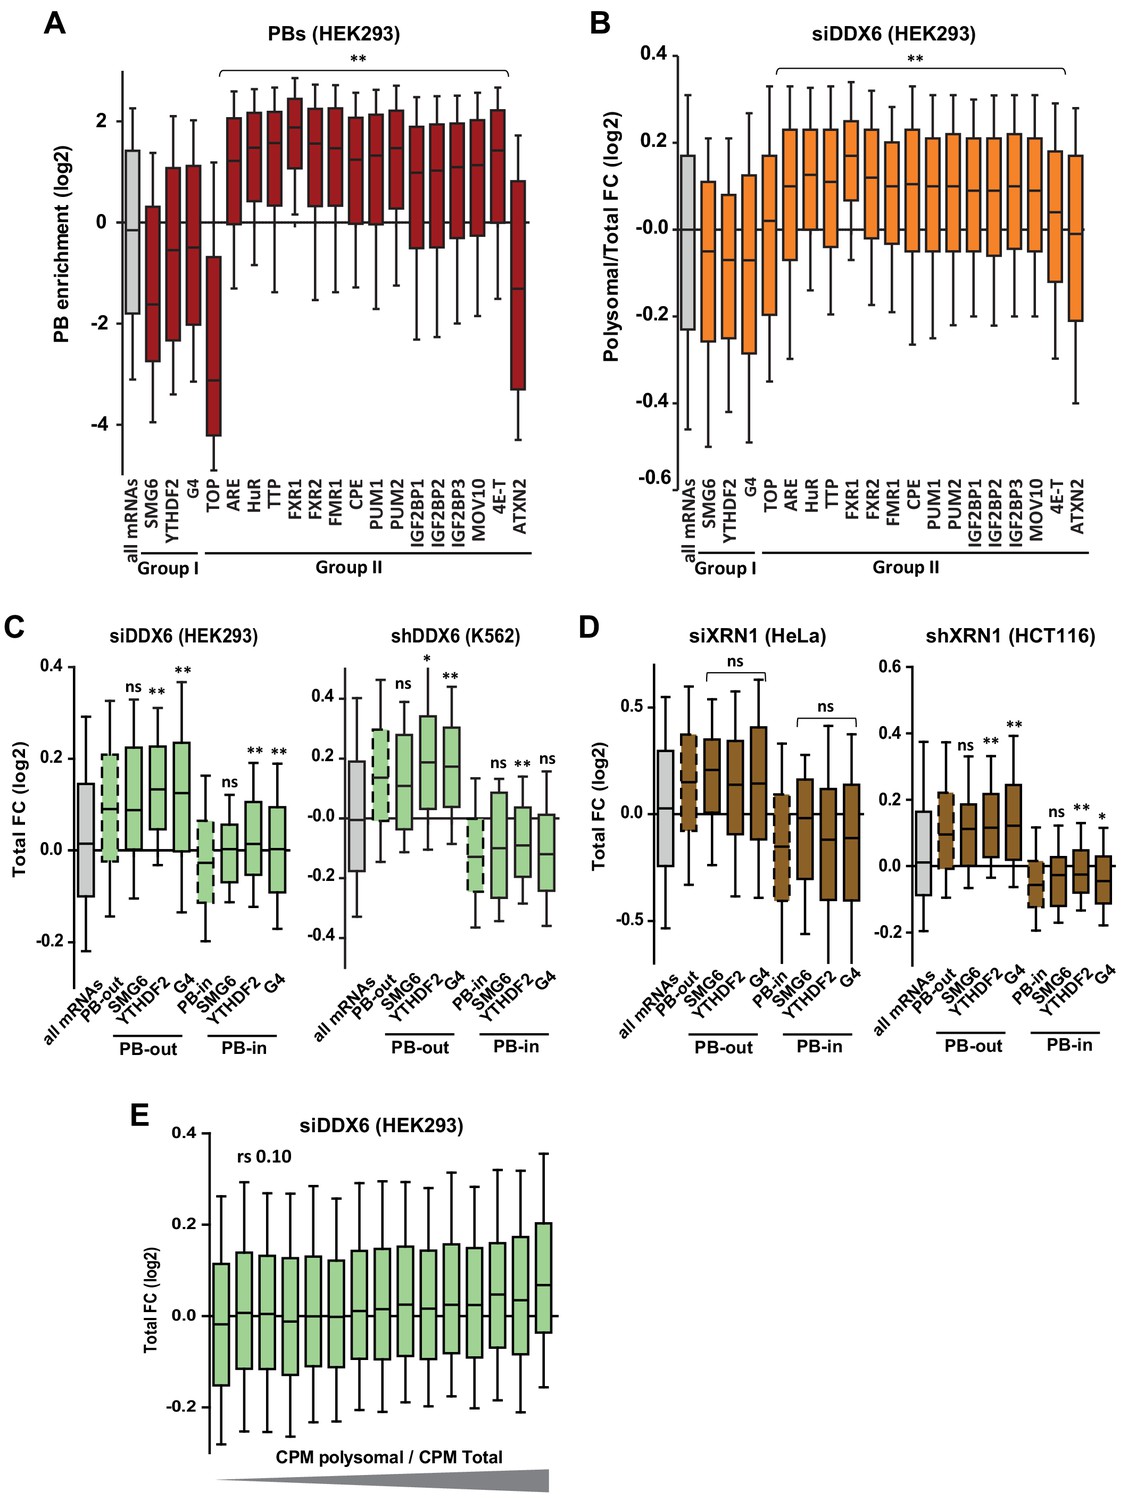
Targets of group I and II regulators (part II).
(A) PB localization of the different mRNA subsets. Only the targets of group II factors were enriched in PBs, except ATXN2. Note also that SMG6 targets and TOP mRNAs were particularly excluded from PBs. (B) Sensitivity of the different mRNA subsets to DDX6 silencing in HEK293 in terms of translation rate(polysomal/total mRNA ratio). Only the targets of group II factors were translationally derepressed, except ATXN2. Two-tail Mann-Whitney test was performed with respect to all mRNAs. **, p<0.0001. (C, D) The targets of group I regulators were stabilized after DDX6 (C) and XRN1 (D) silencing mostly like other PB-excluded mRNAs. The same analysis as in Figure 5—figure supplement 1B and C was conducted separately on PB-excluded (PB-out) and PB-enriched (PB-in) mRNAs. The distribution of all mRNAs (in gray), all PB-out and all PB-in mRNAs (dashed boxes) are shown for comparison. Two-tail Mann-Whitney test was performed with respect to cognate PB-out or PB-in mRNAs. **, p<0.0001; *, p=0.006 for (C) and 0.02 for (D); ns, non-significant. (E) DDX6-dependent mRNA decay does not correlate with polysome engagement. The fraction of mRNAs in polysomes (polysomal/total cpm) was calculated using the RNA-Seq data from control HEK293 cells. Transcripts were subdivided into 15 bins (1000 transcripts each) of increasing value. The boxplot represents their fold-change (FC) distribution in total RNA following DDX6 silencing.
Figure 5—figure supplement 3

Targets of the miRNA pathway.
(A,B) Number of AGO targets (A) and miRNA targets (B) analyzed in (C–H) and in Figure 5C,D. (C–E) AGO targets are enriched in PBs (C), translationally derepressed (D) and little or not stabilized (E) following DDX6 silencing. Two-tail Mann-Whitney test was performed with respect to all mRNAs. **, p<0.0001; *, p=0.002, x, p=0.04; ns, non-significant. (F) AGO targets excluded from PBs accumulate following DDX6 silencing like other PB-excluded transcripts. The analysis was performed as in Figure 5—figure supplement 2C. Two-tail Mann-Whitney test was performed with respect to cognate PB-out or PB-in mRNAs. x, p=0.04; ns, non-significant. (G) AGO targets accumulate following PAT1B silencing. Two-tail Mann-Whitney test was performed with respect to all mRNAs. **, p<0.0001; x, p=0.04. (H) The extent of PB enrichment of miRNA targets depends on the miRNA. Two-tail Mann-Whitney test was performed with respect to all mRNAs. **, p<0.0001; ns, non-significant.
Figure 5—figure supplement 4
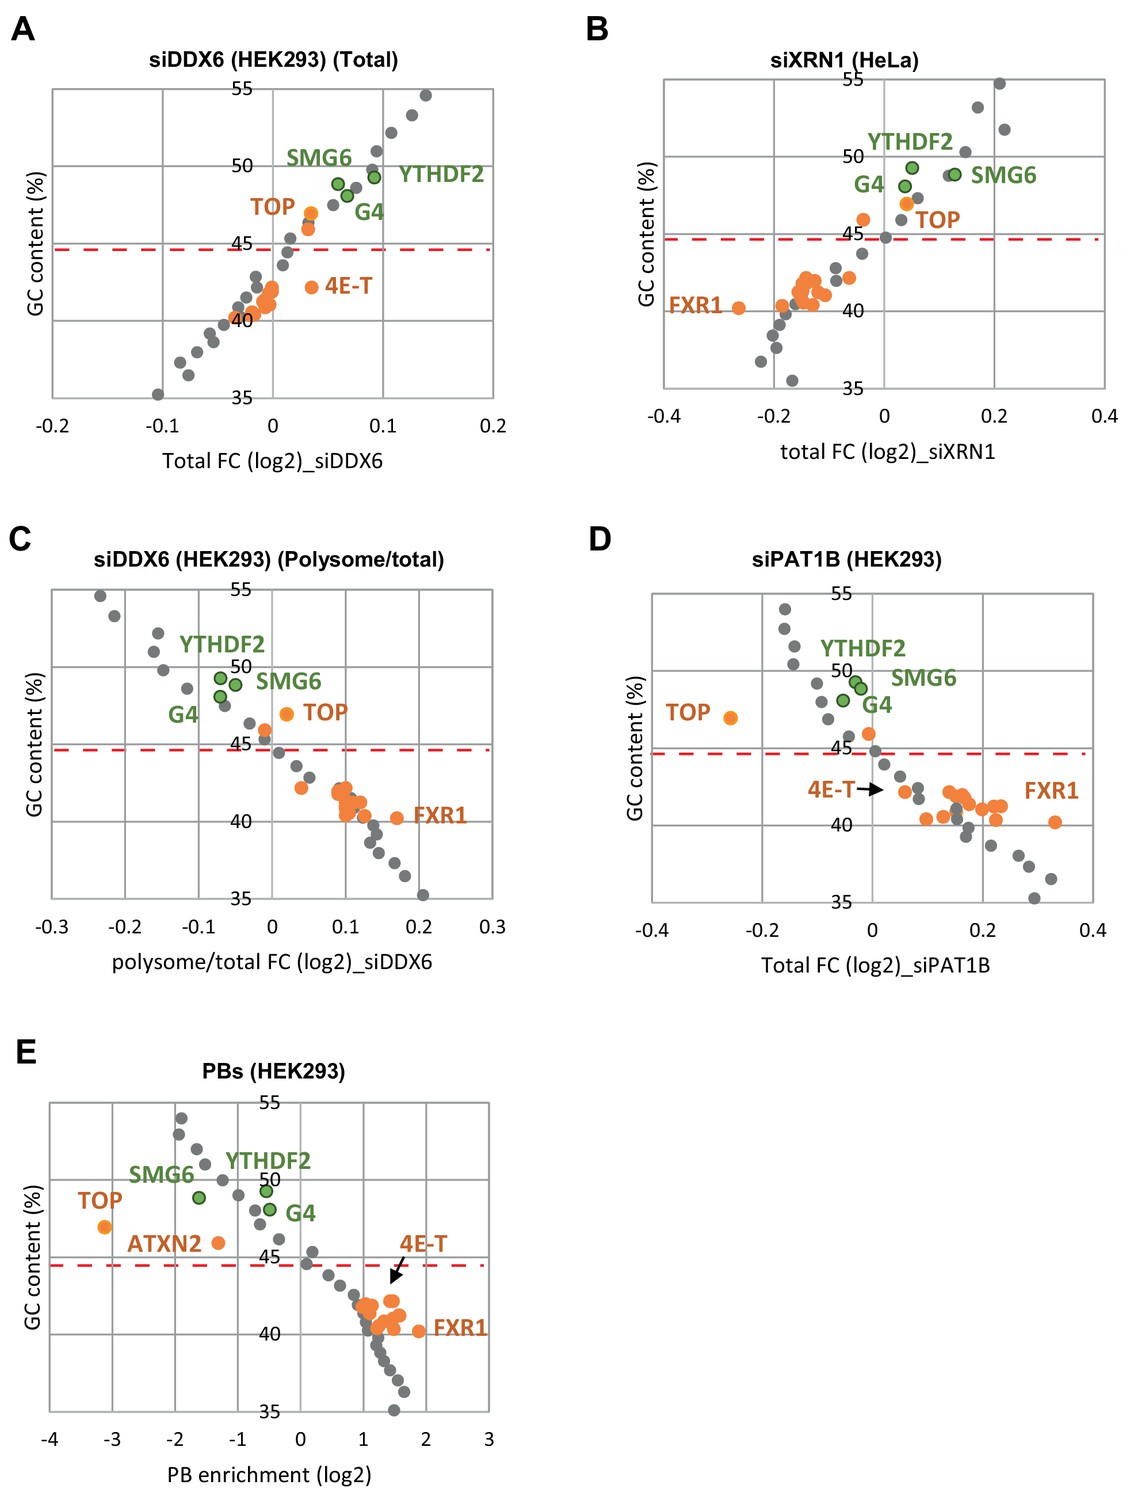
Targets of the group I and II regulators behave like mRNAs of similar GC content.
(A–E) The whole transcriptome was binned depending on its GC content (bin size of 500 mRNAs). The median GC content of each bin was represented as a function of its median fold-change in the various datasets (in gray). The same analysis was performed for the targets of group I (in green) and II (in orange) regulators, and superimposed to the graphs. The dashed line indicates the median GC content for all mRNAs. Overall, in all datasets, the targets of the different regulators behave similarly to mRNAs of same GC content. For figure clarity, only the few regulators leading to distinct behaviors were indicated.
Figure 5—figure supplement 5
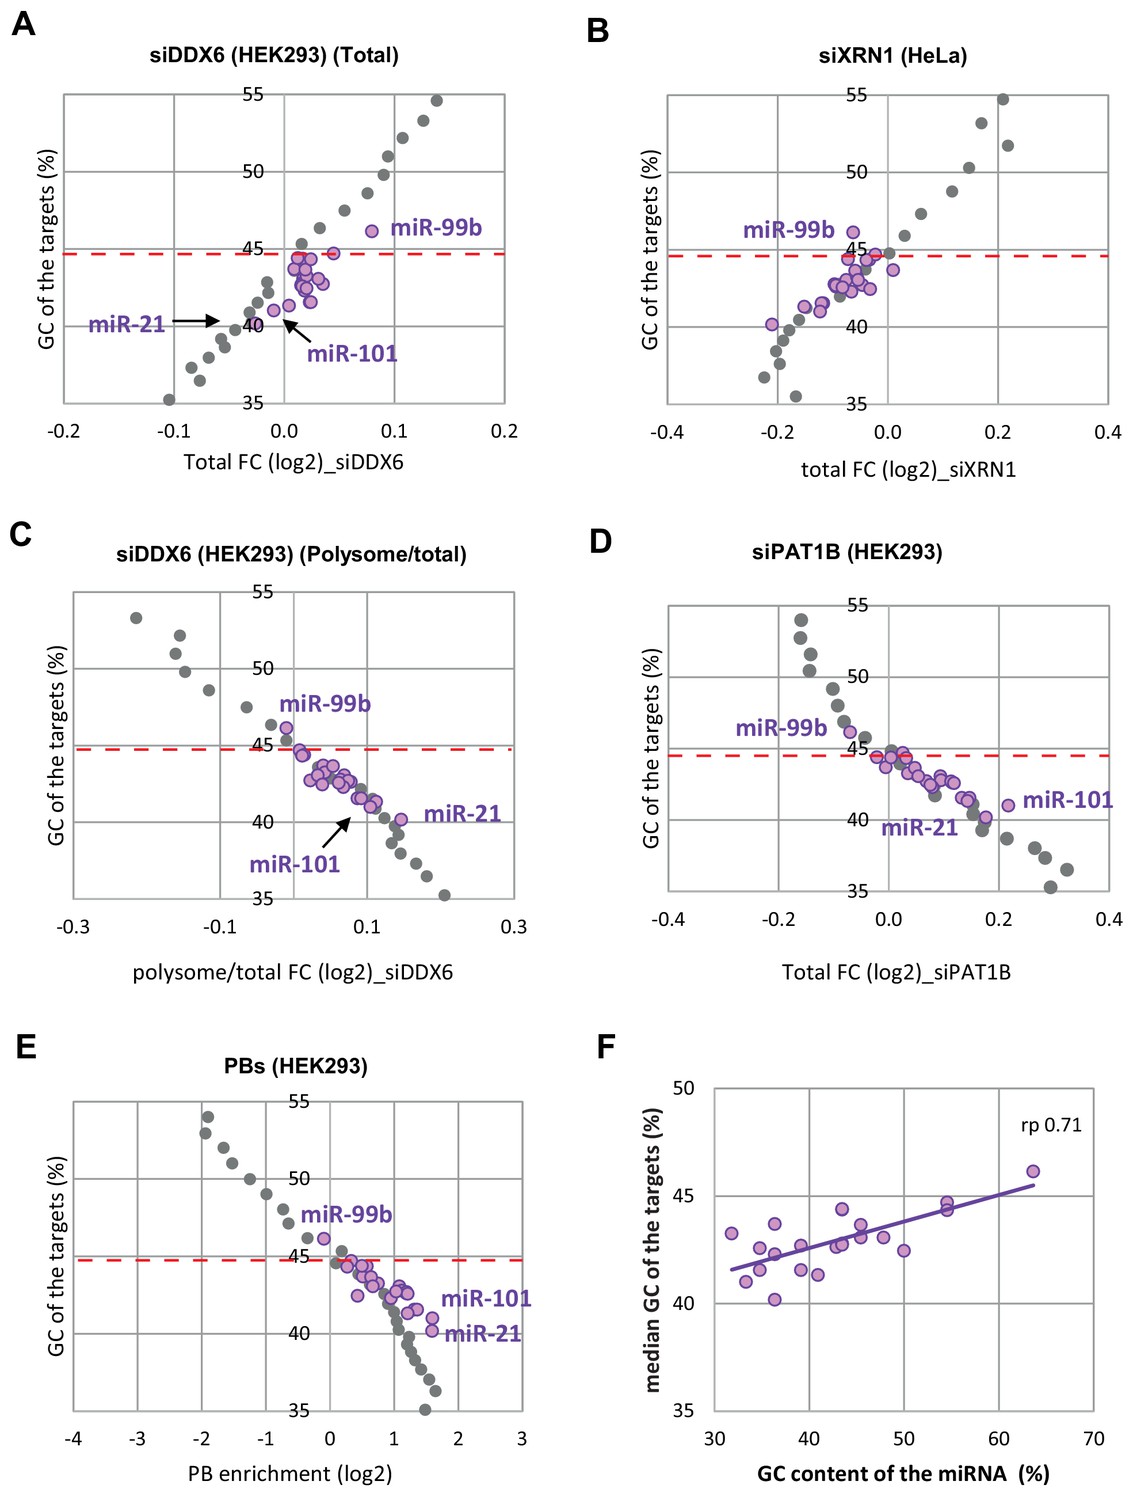
miRNA targets behave like mRNAs of similar GC content.
(A–E) The analysis was conducted as in Figure 5—figure supplement 4. Overall, the targets of the different miRNAs behave similarly to mRNAs of same GC content. (F) The GC content of miRNA targets correlates with the GC content of the miRNA itself. rp, Pearson correlation coefficient.
Figure 6 with 2 supplements
The GC content of the CDS and the 3’UTR both contribute to PB localization.
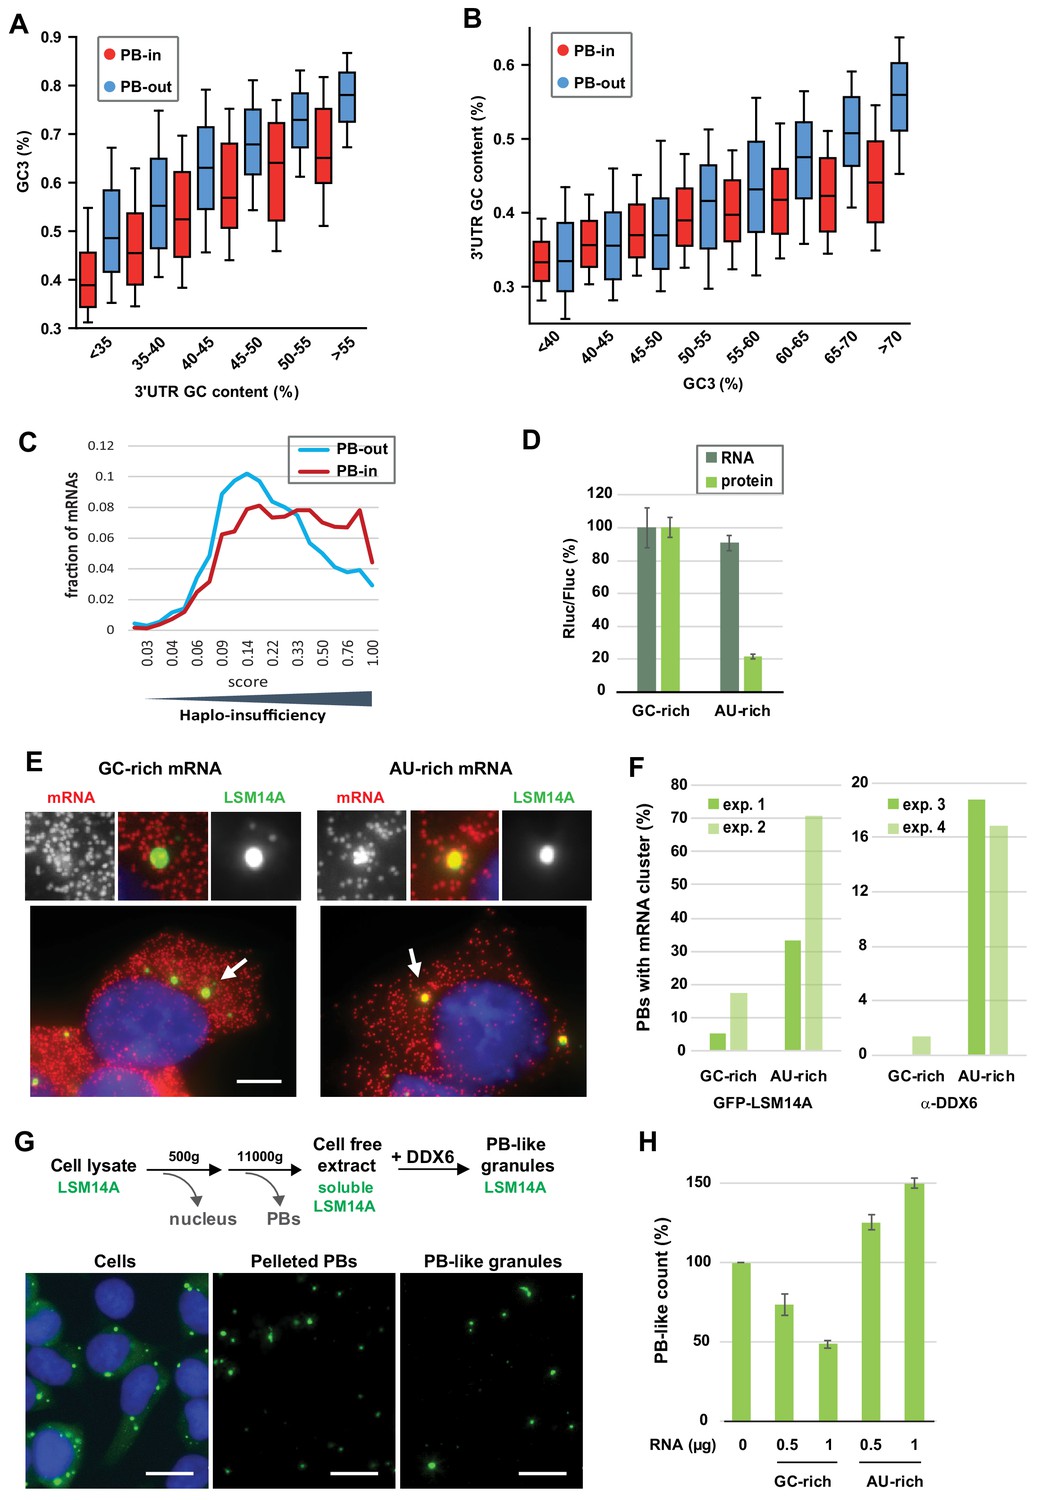
(A) General importance of the CDS. Transcripts were subdivided into six classes depending on the GC content of their 3’UTR (from <40 to >55%). The boxplots represent the distribution of their CDS GC content at position 3 (GC3) in PB-enriched (PB-in) and PB-excluded (PB-out) mRNAs. (B) Importance of the 3’UTR for GC-rich CDSs. Transcripts were subdivided into eight classes depending on their GC3 (from <40 to >70%). The boxplots represent the distribution of their 3’UTR GC content in PB-enriched (PB-in) and PB-excluded (PB-out) mRNAs. (C) The transcripts of haplo-insufficiency genes are enriched in PBs. The haplo-insufficiency score is the probability that a gene is haplo-insufficient, as taken from the Huang et al. (2010) study. The analysis was performed for PB-enriched (PB-in, n = 4646, median score 0.26) and PB-excluded (PB-out, n = 4205, median score 0.17) mRNAs. The difference of distribution of haplo-insufficiency scores was statistically significant using a two tail Mann-Whitney test: p<0.0001. The results were similar using Steinberg et al. (2015) scores. (D) Protein yield is higher from a GC-rich than an AU-rich CDS. HEK293 cells were transfected with Rluc reporters differing by the GC content of their CDS, along with a control Fluc plasmid. After 24 hr, mRNA levels were measured by qPCR and protein levels by luciferase activity. The Rluc to Fluc ratio for the GC-rich reporter was set to 100 (n = 3). Error bars, SD. (E, F) Preferential localization of AU-rich transcripts in PBs. HEK293 cells expressing GFP-LSM14A were transfected with the AU-rich and GC-rich Rluc reporters and the localization of the Rluc transcripts (in red) was analyzed by smiFISH. Representative cells are shown in (E). Bar, 5 µm. Arrows indicate the PBs enlarged above. The experiment was performed in duplicate (exp. 1 and 2) and repeated in HEK293 cells where PBs were immunostained using DDX6 antibodies (exp. 3 and 4). The percentage of PBs containing clusters of Rluc transcripts in the four experiments is represented in (F). Exp.1: 56/75 PBs from 21/27 cells; exp.2: 87/75 PBs from 38/35 cells; exp.3: 31/32 PBs from 15/19 cells; exp.4: 72/83 PBs from 34/41 cells (G) Assembly of PB-like granules in cell-free extracts from HEK293 cells expressing GFP-LSM14A. The scheme recapitulates the main steps of the assay. Fluorescence microscopy images show that PBs in cells, PBs after cell lysis, and reconstituted PB-like granules have similar size. Bar, 10 µm. (H) AU-rich RNA favors the formation of PB-like granules. PB-like granules were assembled in cell-free extracts in the presence of AU-rich or GC-rich RNA, and counted by flow cytometry. Their number in the absence of added RNA was set to 100 (n = 3 experiments in duplicate, using two independent cell-free extracts and RNA preparations). Error bars, SD.
Figure 6—figure supplement 1
Role of PB localization in XRN1 and DDX6 sensitivity and importance of the coding property for PB localization.
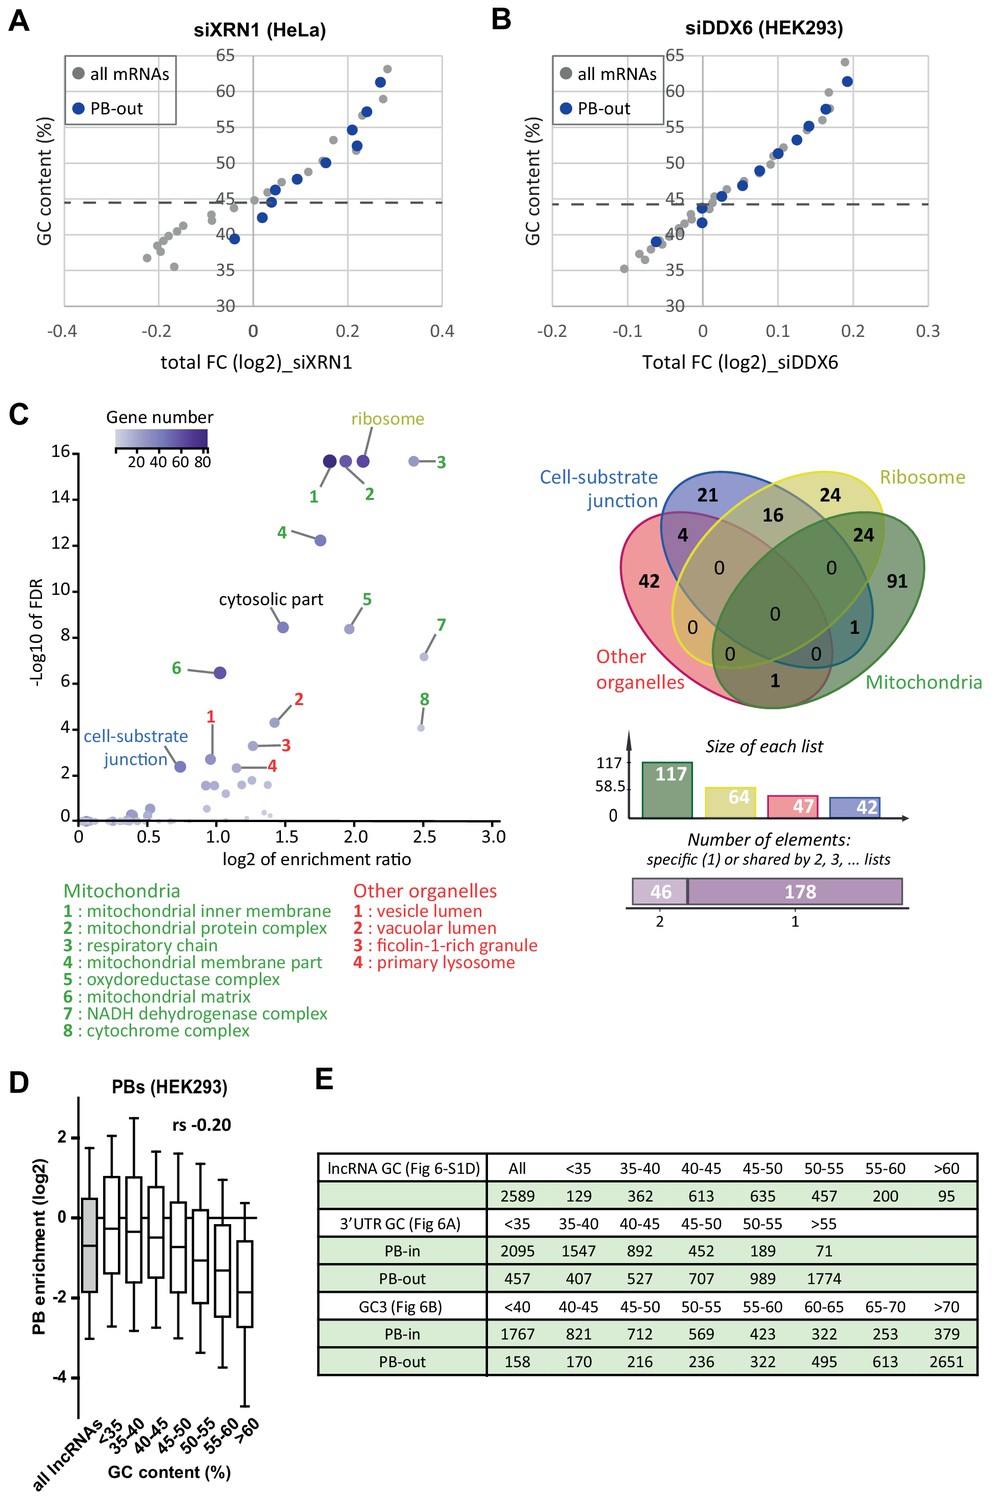
(A) AU-rich mRNAs are better XRN1 targets when excluded from PBs than when enriched in PBs. The analysis was conducted as in Figure 5—figure supplement 4B for all mRNAs (in gray) and for PB-excluded mRNAs (PB-out, in dark blue), except that mRNAs with GC values under 50% were binned by 200 to account for their low number. (B) AU-rich mRNAs are not better DDX6 decay targets when they are excluded from PBs. The dataset after DDX6 silencing in HEK293 cells was analyzed as in (A). (C) AU-rich mRNAs excluded from PBs preferentially encode proteins associated with membranous organelles or secreted. GO analysis was performed using the SLIM categories of cellular components to compare PB-excluded AU-rich mRNAs (GC <49.1%, 556 annotated) to all AU-rich mRNAs (GC <49.1%, 3896 annotated). The Volcano plot (left panel) represents the most enriched categories (FDR < 0.01). Both size and color of the dots are proportional to the size of the category within the query database. Transcripts corresponding to the mitochondria-related categories (green), other membranous organelles (red), secreted proteins (blue) and ribosomal proteins (yellow) were further subjected to a Venn diagram analysis (right panel). (D) LncRNAs poorly accumulate in PBs even when they are AU-rich. LncRNAs (n = 2589) were subdivided into 6 classes of increasing GC content and their accumulation in PBs was represented as for mRNAs in Figure 1B. rs, Spearman correlation coefficient. (E) Number of transcripts in the different classes analyzed in (D) and in Figure 6A,B.
Figure 6—figure supplement 2
The GC content of reporters RNAs is key for PB localization.
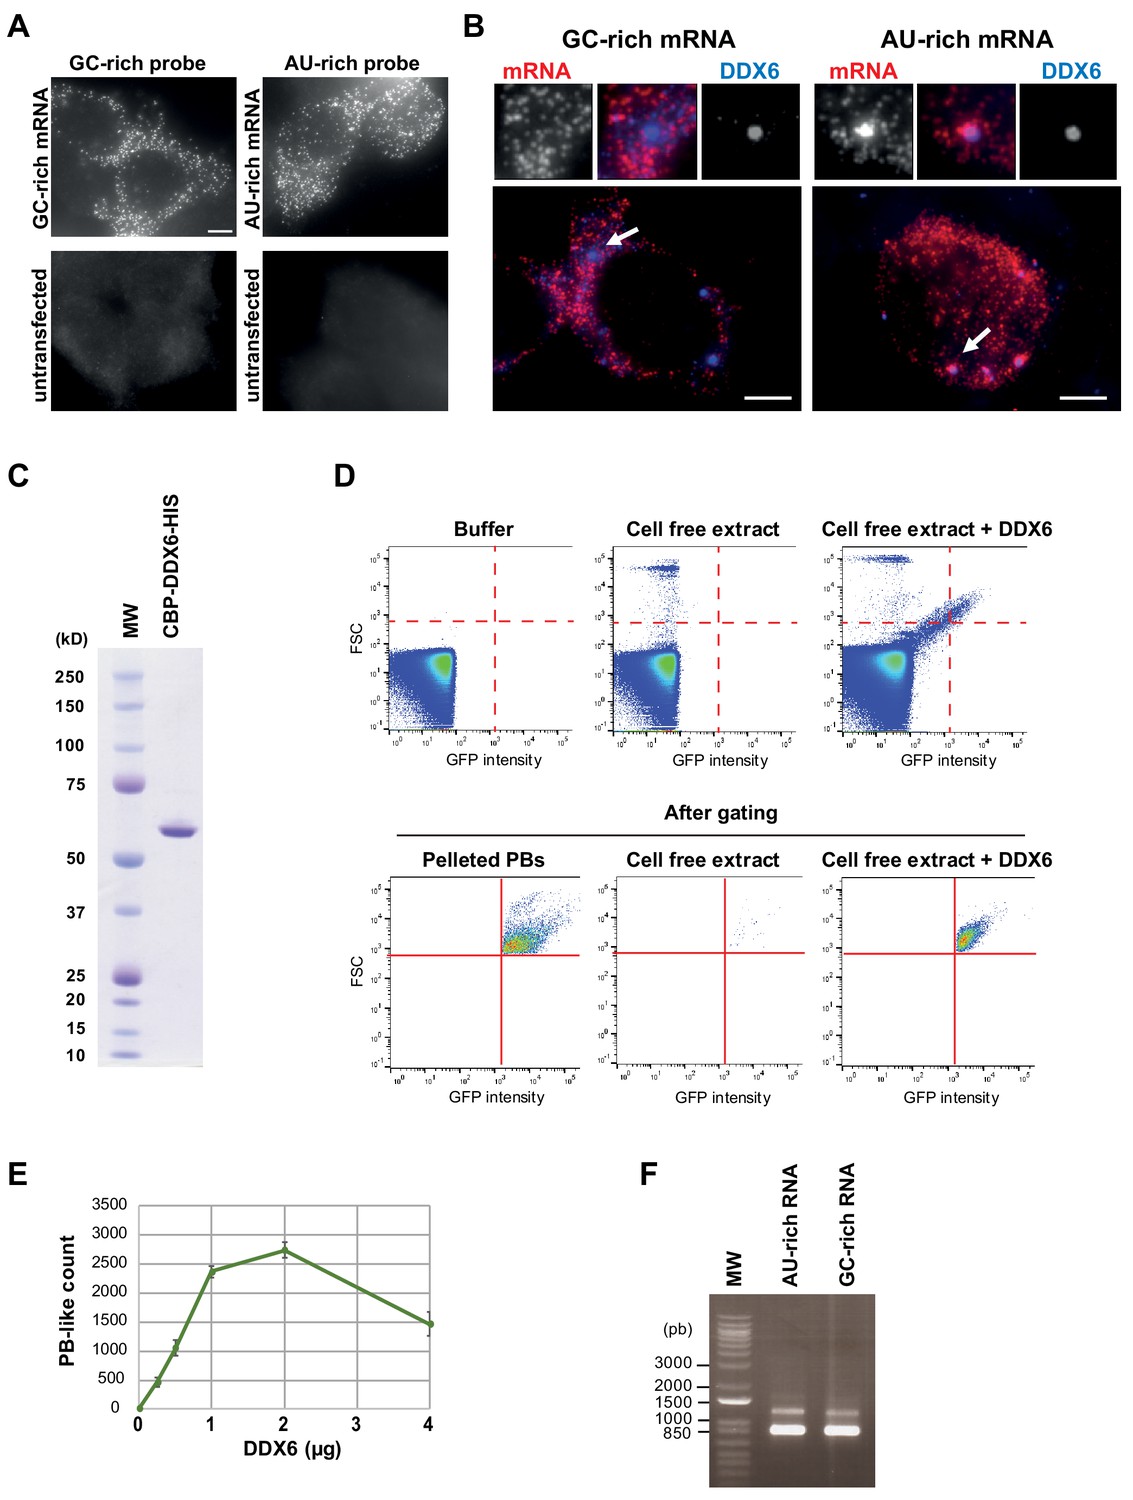
(A) Specificity of the GC-rich and AU-rich Rluc probes. HEK293 cells were transfected or not with the GC-rich and AU-rich Rluc reporter constructs. After 24 hr, cells were analyzed by smiFISH using the GC-rich or AU-rich probes set, as indicated. Bar, 5 µm. (B) AU-rich transcripts localize preferentially in PBs. HEK293 cells transfected with the AU-rich or GC-rich Rluc reporters were subjected to smiFISH analysis, using specific AU-rich or GC-rich probes set to localize the Rluc transcripts (in red), and anti-DDX6 antibody to localize PBs (in blue). Representative cells are shown. Arrows indicate PBs enlarged above. Bar, 5 µm. (C) Recombinant DDX6 protein used in the cell-free assay. The double purified CBP-DDX6-HIS protein was migrated on a polyacrylamide gel along with a molecular weight marker (MW) before Coomassie staining. (D) PB-like granules formed in a cell-free extract can be counted by flow cytometry. The cell-free extract was prepared from HEK293 cells expressing GFP-LSM14A. Without introducing a trigger threshold, the detector was saturated with electronic noise, as illustrated using buffer only (upper panel), and the machine could not be used in the counting mode. After gating as indicated by the red lines (lower panel), PBs were readily detected in the resuspended lysate pellet (pelleted PBs), while almost absent in the supernatant corresponding to the cell free extract. Upon DDX6 addition to the cell-free extract, PB-like granules were detected at a size similar to PBs. Their fluorescence intensity was slightly lower, which likely reflected the limited amount of soluble GFP-LSM14A in the cell-free extract. (E) PB-like granules form in a DDX6-dependent manner. Increasing amount of recombinant DDX6 protein was added to the cell-free extract, and granules were counted by flow cytometry, as described in (D). (F) GC-rich and AU-rich mRNAs used in the cell-free extract. After in vitro transcription from GC-rich and AU-rich plasmids, the RNAs were migrated in an agarose gel to compare their size and concentration. Note that the conditions do not allow for an absolute size estimation, as the gel is non-denaturing and the molecular weight marker (MW) is DNA.
Figure 7 with 1 supplement
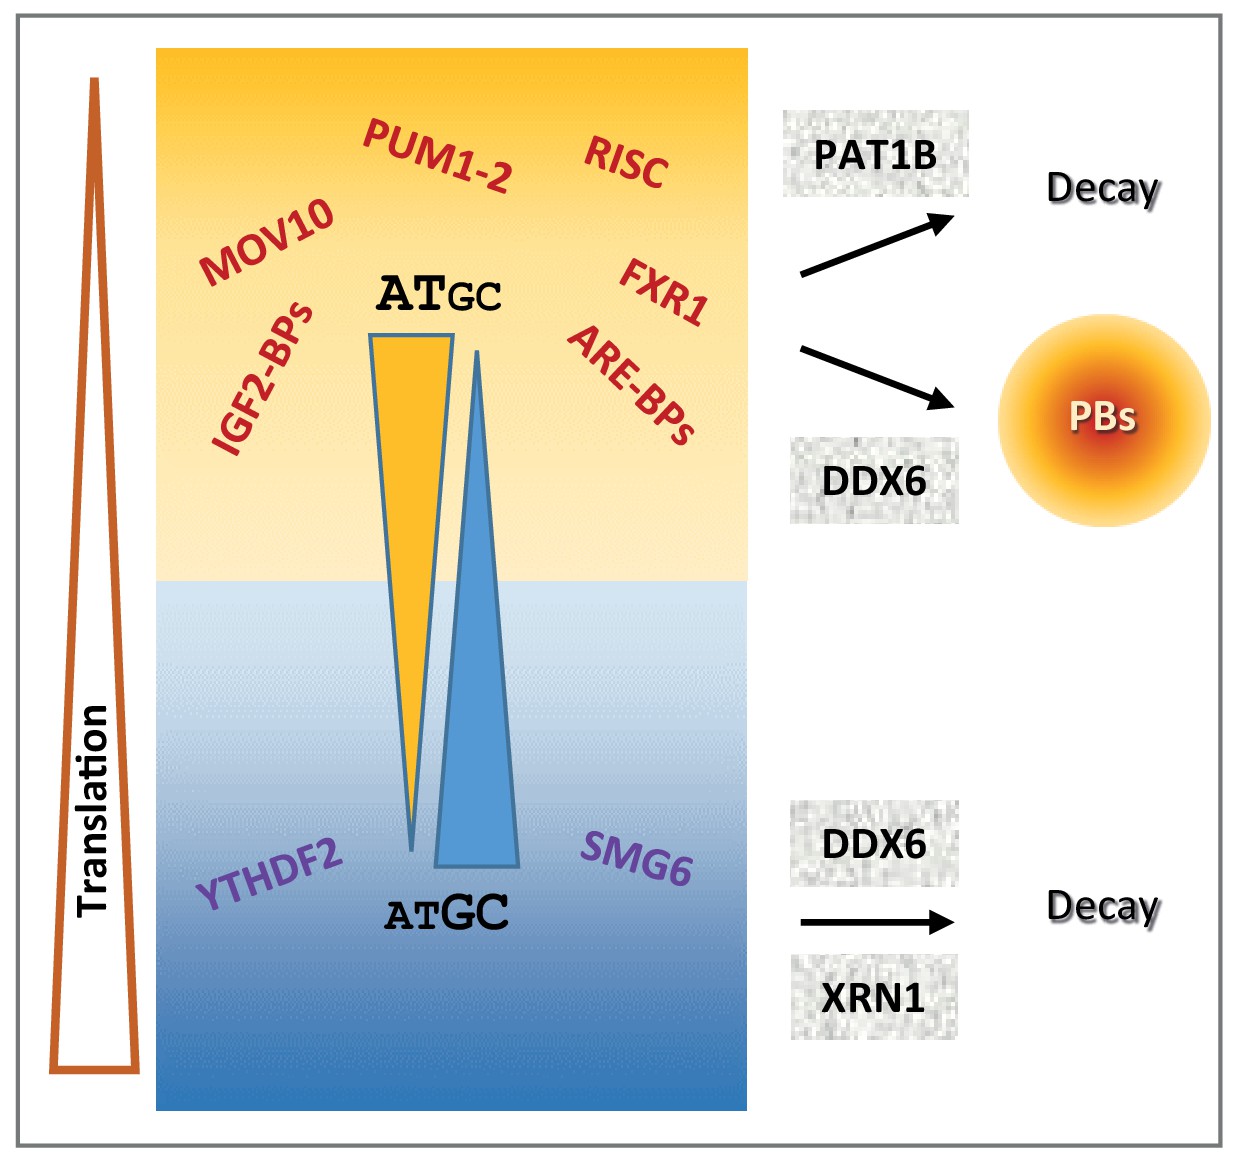
Schematic representation recapitulating the features of mRNA post-transcriptional regulation depending on their GC content.
Figure 7—figure supplement 1
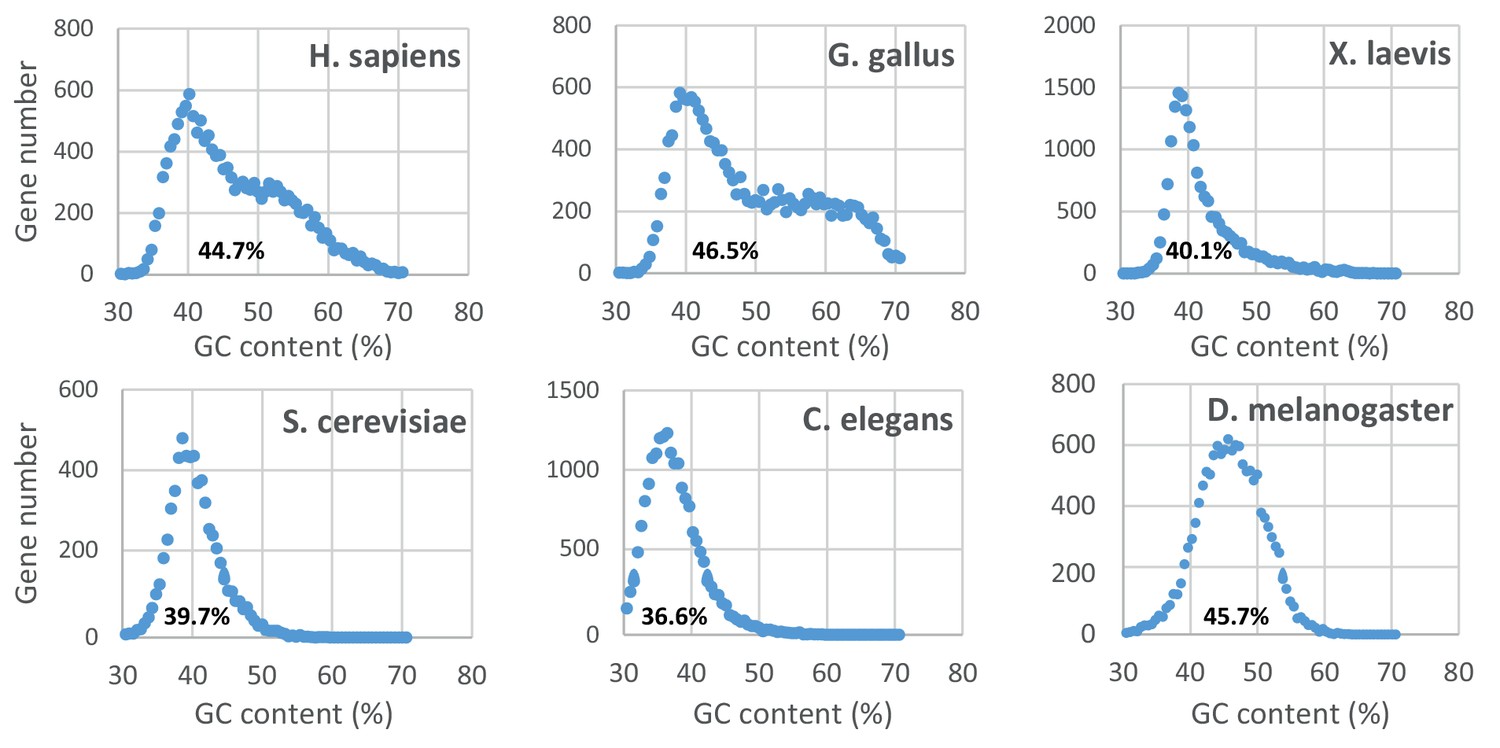
Distribution of the gene GC content in various eukaryotic genomes.
The graphs were constructed as in Figure 1—figure supplement 1F. The median value for each genome is indicated below.
Tables
Key resources table
| Reagent type (species) or resource | Designation | Source or reference | Identifiers | Additional information | |
|---|---|---|---|---|---|
| Cell line (Homo sapiens) | HEK293 | ATCC | Cat# PTA-4488, RRID:CVCL_0045 | ||
| Cell line (Homo sapiens) | HeLa | ATCC | Cat# CCL-2, RRID:CVCL_0030 | ||
| Cell line (Homo sapiens) | HCT116 | ATCC | Cat# CCL-247, RRID:CVCL_0291 | ||
| Cell line (Homo sapiens) | HEK293 expressing GFP-LSM14A | Hubstenberger et al., 2017 | PMID:28965817 | ||
| Transfected construct (rabbit) | siβ-Globin | Serman et al., 2007 | PMID:17604308 | GGUGAAUGUGGAAGAAGUUdTdT siRNA used as negative control for the siDDX6 expt. | |
| Transfected construct (human) | siDDX6 | Minshall et al., 2009 | PMID:19297524 | GGAACUAUGAAGACUUAAAdTdT | |
| Transfected construct (human) | siXRN1 | Thermofisher | Cat# AM16708A | ID125199 | |
| Transfected construct (human) | siRNA negative control | Thermofisher | Cat# 4390843 | siRNA used as a negative control for the siXRN1 expt. | |
| Transfected construct (human) | shXRN1 | Thermofisher | Cat# RHS4696–99704634 | Lentiviral ‘TRIPZ’ construct to transfect and express the XRN1 shRNA. | |
| Transfected construct (human) | Non-silencing shRNA | Thermofisher | Cat# RHS 4743 | Lentiviral ‘TRIPZ’ construct to transfect and express the control shRNA. | |
| Antibody | anti DDX6 (rabbit polyclonal) | Novus biological | Cat# NB200-191, RRID:AB_10003156 | WB (1:15000), IF (1:2000) | |
| Antibody | Anti XRN1 (rabbit polyclonal) | Novus Biosciences | Cat# NB 500–191, RRID:AB_527572 | WB (1:5000) | |
| Antibody | Anti XRN1 (rabbit polyclonal) | Bethyl | Cat# A300-443A, RRID:AB_2219047 | WB (1:1000) | |
| Antibody | Anti ribosomal S6 (rabbit monoclonal) | Cell signalling technologies | Cat# 2217, RRID:AB_331355 | WB (1:5000) | |
| Antibody | Anti Pol II (rabbit polyclonal) | Santa Cruz | Cat# sc-899, RRID:AB_632359 | WB (1:100) | |
| Antibody | Anti tubulin (mouse monoclonal) | Sigma-Aldrich | Cat# T9026, RRID:AB_477593 | WB (1:30000) | |
| Recombinant DNA reagent | hRluc-GFP-GC-rich | This paper | phRL-CMV vector bearing an Rluc-GFP GC-rich insert, used in PB-like reconstitution, smiFISH and luciferase reporter expts. | ||
| Recombinant DNA reagent | Rluc-GFP-AU-rich | This paper | phRL-CMV vector bearing an Rluc-GFP GC-rich insert, used in PB-like reconstitution, smiFISH and luciferase reporter expts. | ||
| Sequence-based reagent | ACTB qPCR primers | This paper | Fwd: TCCCTGGAGAAGAGCTACGA Rev: AGCACTGTGTTGGCGTACAG | ||
| Sequence-based reagent | APP qPCR primers | Gift from R. Blaise | Fwd: acttgcatgactacggc Rev: actcttcagtgtcaaagttgt | ||
| Sequence-based reagent | BACE1 qPCR primers | Gift from R. Blaise | Fwd: ctttgtggagatggtggac Rev: aaagttactgctgcctgtat | ||
| Sequence-based reagent | LSM14A qPCR primers | This paper | Fwd: AGCAGTTTGGTGCTGTTGGT Rev: AACCGCACTACTTTGGGGTA | ||
| Sequence-based reagent | LSM14B qPCR primers | This paper | Fwd: CGACAACATCTCTTCTGAACTCAA Rev: GTGTTGAGCTTCCTCTCTTCG | ||
| Sequence-based reagent | MFN2 qPCR primers | This paper | Fwd: GAACCTGGAGCAGGAAATTG Rev: AACCAACCGGCTTTATTCCT | ||
| Sequence-based reagent | PNRC1 qPCR primers | This paper | Fwd: CCCCCTCAGGAAAGAGGTTTT Rev: ACAAGTGTATACCATGAACAAGCTG | ||
| Sequence-based reagent | TIMP2 qPCR primers | Blaise et al., 2012 | PMID:22260497 | Fwd: gaagagcctgaaccacaggt Rev: cggggaggagatgtagcac | |
| Sequence-based reagent | TRIB1 qPCR primers | This paper | Fwd: ACCTGAAGCTTAGGAAGTTCGT Rev: CTGACAAAGCATCATCTTCCCC | ||
| Sequence-based reagent | HPRT1 qPCR primers | This paper | Fwd: TAATTGACACTGGCAAAACAATGCAGACT Rev: GGGCATATCCTACAACAAACTTGTCTGGA | ||
| Sequence-based reagent | REN-lowGC qPCR primers | This paper | Fwd: CCAGGATTCTTTTCCAATGC Rev: CTTGCGAAAAATGAAGACCTTT | ||
| Sequence-based reagent | REN-highGC qPCR primers | This paper | Fwd: CGAGAACGCCGTGATTTT Rev: GACGTGCCTCCACAGGTAG | ||
| Sequence-based reagent | FIREfly qPCR primers | This paper | Fwd: TGAGTACTTCGAAATGTCCGTTC Rev: GTATTCAGCCCATATCGTTTCAT | ||
| Sequence-based reagent | RenGFP-lowGC-24 DNA probe | This paper | Set of 24 primary probes specific of the RenGFP lowGC mRNA used in smiFISH expts. (See Supplementary file 2) | ||
| Sequence-based reagent | RenGFP-highGC-24 DNA probe | This paper | Set of 24 primary probes specific of the RenGFP highGC mRNA used in smiFISH expts. (see Supplementary file 2) | ||
| Sequence-based reagent | FLAP-Y-Cy3 DNA probe | Tsanov et al., 2016 | PMID:27599845 | AA TGC ATG TCG ACG AGG TCC GAG TGT AA Secondary probe conjugated to two Cy3 moieties at the 5’ and 3’ termini. Used in smiFISH expts. | |
| Peptide, recombinant protein | CBP-DDX6-HIS | Ernoult-Lange et al., 2012 | PMID:22836354 | ||
| Commercial assay or kit | miRNeasy Mini kit | Qiagen | Cat# 217004 | ||
| Commercial assay or kit | TruSeq Stranded Total RNA kit | Illumina | Cat# RS-122–2201 | ||
| Commercial assay or kit | Dual-Glo Luciferase assay system | Promega | Cat# E2920 | ||
| Chemical compound, drug | Micrococcal Nuclease | Thermo Scientific | Cat# 88216 | ||
| Software, algorithm | Cluster 3.0 | http://www.eisenlab.org/eisen/?page_id=42 | RRID:SCR_013505 | ||
| Software, algorithm | Java Treeview | https://sourceforge.net/projects/jtreeview/ | RRID:SCR_016916) | ||
| Software, algorithm | Morpheus | https://software.broadinstitute.org/morpheus | RRID: SCR_017386 | ||
| Software, algorithm | Icy | http://icy.bioimageanalysis.org/ | RRID:SCR_010587 | ||
| Software, algorithm | WebGestalt | http://www.webgestalt.org/ | RRID:SCR_006786 | ||
Additional files
-
Supplementary file 1
Transcriptome datasets.
Sheet1: polysome profiling after siDDX6 in HEK293 cells. Sheet2: transcriptome after shDDX6 in K562 cells. Sheet3: DDX6 CLIP in K562 cells. Sheet4: transcriptome after siXRN1 in HeLa cells. Sheet5: transcriptome after shXRN1 in HCT116 cells. Sheet6: transcriptome after siPAT1B in HEK293 cells.
- https://cdn.elifesciences.org/articles/49708/elife-49708-supp1-v2.xlsx
-
Supplementary file 2
SmiFISH probes sets.
Sheet1: AU-rich probes Sheet2: GC-rich probes.
- https://cdn.elifesciences.org/articles/49708/elife-49708-supp2-v2.xlsx
-
Transparent reporting form
- https://cdn.elifesciences.org/articles/49708/elife-49708-transrepform-v2.docx
Download links
A two-part list of links to download the article, or parts of the article, in various formats.
Downloads (link to download the article as PDF)
Open citations (links to open the citations from this article in various online reference manager services)
Cite this article (links to download the citations from this article in formats compatible with various reference manager tools)
GC content shapes mRNA storage and decay in human cells
eLife 8:e49708.
https://doi.org/10.7554/eLife.49708


