Excitatory neurons are more disinhibited than inhibitory neurons by chloride dysregulation in the spinal dorsal horn
- The Hospital for Sick Children, Canada
- University of Toronto, Canada
Figures
Figure 1

Disinhibition causes receptive fields to expand.
(A) Cartoon depicts how narrowly tuned excitation combined with broadly tuned inhibition produces a receptive field (RF) with an excitatory center and inhibitory surround. (B) Firing rate histograms from a typical neuron responding to brush stimulation (black bars) applied to the RF center (orange) or surround (green) before (left) and after (right) blockade of KCC2 by intrathecal DIOA. (C) Summary of spike rates evoked by brush stimulation in the RF center or surround 10 and 30 min after application of 100 µM DIOA (n = 10) or 50 µM VU (n = 22) to block KCC2; data for DIOA and VU were pooled based on the absence of any significant differences. KCC2 blockade had a significant effect on brush-evoked firing (F2,62 = 17.78, p<0.001, two-way repeated measures ANOVA). Results of Wilcoxon tests are reported on graphs. Firing rates were stably elevated for at least 20 min, thus allowing for other effects of disinhibition (e.g. on RF size) to be measured. (D) To quantify the excitatory drive originating from each RF zone, average evoked firing rate (± sem) was plotted against average surface area (± sem) of the RF zone in which the stimulus was applied. Each data point demarcates a rectangle (colored) whose area is proportional to excitatory drive from that RF zone. (E) By calculating the product of RF zone area and firing rate on a cell-by-cell basis (n = 22), disinhibition was found to significantly increase total drive (F1,21 = 139.17, p<0.001; two-way repeated measures ANOVA on log-transformed data) but this depended on the RF zone (interaction, F1,21 = 49.81, p<0.001): the RF surround contributed significantly greater drive than the RF center after KCC2 blockade. Results of Student-Newman-Keuls (SNK) tests are reported on graphs.
-
Figure 1—source data 1
Numerical values for data plotted in Figure 1.
- https://cdn.elifesciences.org/articles/49753/elife-49753-fig1-data1-v2.xlsx
Figure 2
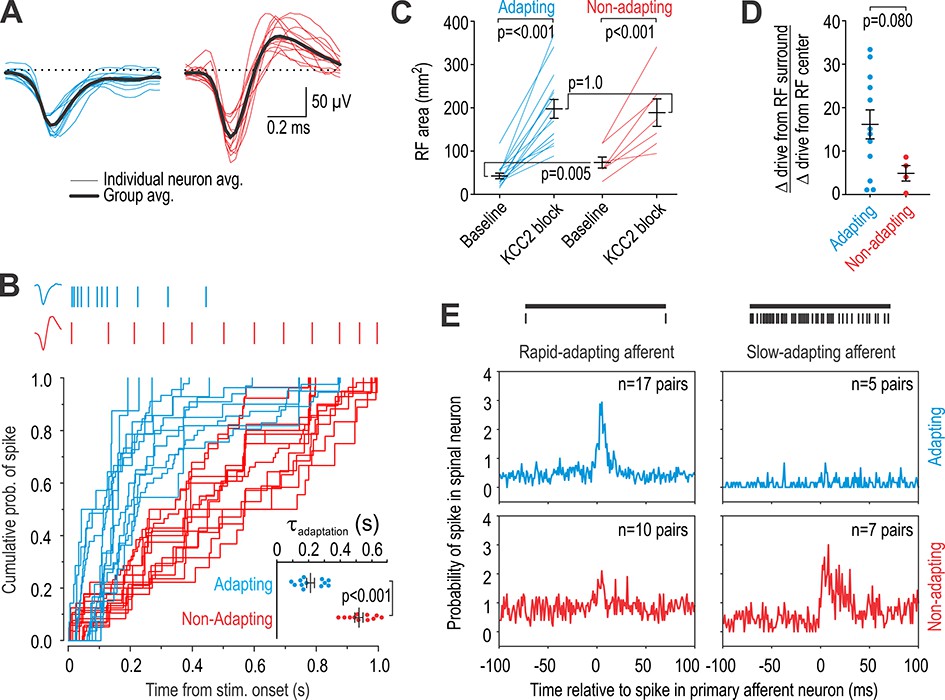
Units recorded in vivo can be divided into two groups.
(A) Spike waveforms were separated according to their monophasic (blue) or biphasic (red) shape. (B) Units subdivided by spike waveform also differed in their adaptation pattern, as illustrated by sample rasters showing responses to 1 s-long 10 g von Frey stimulation (top). The cumulative probability of spiking was fit for each unit with the curve y = 1/(1-e-t/τ). The adaptation time constant τ differed significantly between groups (T23 = 8.58, p<0.001; unpaired t-test). Units are henceforth referred to as adapting (blue) or non-adapting (red). (C) Adapting units had a significantly smaller RF than non-adapting units at baseline (Q21 = 17.5, p=0.013; Mann-Whitney test) but there was no difference in RF size after KCC2 blockade (Q21 = 49.0, p=0.83). RF size was significantly affected by KCC2 blockade in both type of units (F1,20 = 66.10, p<0.001; two-way repeated measures ANOVA). Results of SNK tests are reported on graphs. (D) KCC2 blockade caused a larger, though not quite significant, increase in drive from the RC center relative to the RF surround in adapting units compared with non-adapting units (T14 = 1.89, p=0.080; unpaired t-test). (E) Cross-correlograms were calculated from all pairs of simultaneously recorded primary afferent neurons and spinal neurons with overlapping RFs. The number of pairs is reported on each panel. Primary afferents were classified as rapid-adapting (RA, left) or slow-adapting (SA, right); rasters show sample responses to 1 s-long 10 g von Frey stimulation (top). Adapting units displayed an increased probability of spiking after RA spikes (top left) but not after SA spikes (top right) whereas non-adapting units displayed a large increase in spike probability after SA spikes (bottom right) and a modest increase after RA spikes (bottom left). In other words, adapting units receive input exclusively from RA afferents whereas non-adapting units receive input preferentially from SA afferents.
-
Figure 2—source data 1
Numerical values for data plotted in Figure 2.
- https://cdn.elifesciences.org/articles/49753/elife-49753-fig2-data1-v2.xlsx
Figure 3

Adapting and non-adapting units correspond to excitatory and inhibitory neurons, respectively.
(A) Sample firing rate histograms from a typical adapting unit (blue) and non-adapting unit (red) during brush stimulation (bars) before and after intrathecal application of 200 μM 3,5-dihydroxyphenylglycine (DHPG). Adapting units were disproportionately affected (χ2 = 9.95, p=0.007), consistent with them being excitatory neurons, which selectively express metabotropic glutamate receptor 5. (B) Sample firing rate histograms before and after intrathecal application of 50 μM somatostatin (SST). Non-adapting units were disproportionately affected (χ2 = 16.85, p=0.001), consistent with them being inhibitory neurons, which selectively express the sst2a receptor. Some adapting units exhibited reduced spiking (see Results). Spontaneous firing was increased by SST selectively in non-adapting units. (C) Distribution of recording depths for units responsive to light touch at baseline (left) and for units that became responsive after KCC2 blockade (right).
-
Figure 3—source data 1
Numerical values for data plotted in Figure 3.
- https://cdn.elifesciences.org/articles/49753/elife-49753-fig3-data1-v2.xlsx
Figure 4 with 1 supplement
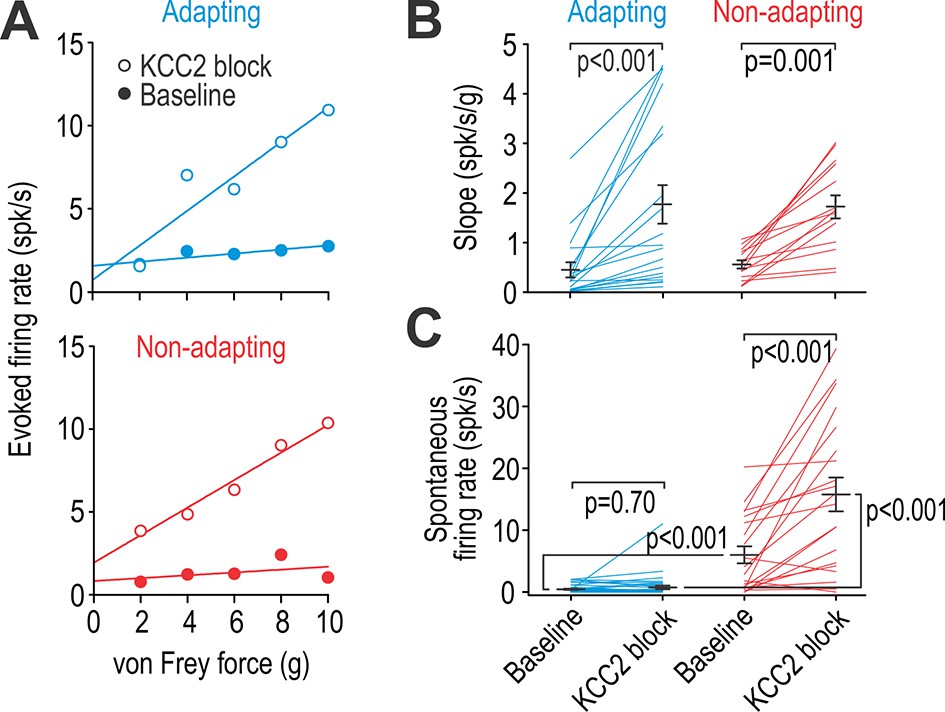
Adapting and non-adapting units are differentially affected by KCC2 blockade.
(A) Input-output (i–o) curves show firing rate evoked by increasing force applied by von Frey hairs to the RF surround in a typical adapting unit (blue) and non-adapting unit (red) before and after blockade of KCC2. (B) KCC2 blockade had a significant effect on slope (F1,31 = 35.68, p<0.001; two-way repeated measures ANOVA). That effect did not differ between cell types (interaction, F1,31 = 0.15, p=0.71) although the largest increases were observed in adapting units. Results of Wilcoxon tests are reported on graphs. (C) KCC2 blockade also had a significant effect on spontaneous firing (F1,57 = 58.60, p<0.001; two-way repeated measures ANOVA) but that effect differed between cell types (F1,57 = 33.79, p<0.001): non-adapting units experienced a significant increase in spontaneous firing (Z19 = 3.58, p<0.001; Wilcoxon test) whereas adapting units did not (Z38 = 0.39, p=0.70). Spontaneous firing differed significantly between cell types at baseline (U58 = 116.5, p<0.001; Mann-Whitney test) and after KCC2 blockade (U58 = 55.5, p<0.001). See also Figure 4—figure supplement 1 for the effect of glycine receptor blockade on spontaneous firing.
-
Figure 4—source data 1
Numerical values for data plotted in Figure 4.
- https://cdn.elifesciences.org/articles/49753/elife-49753-fig4-data1-v2.xlsx
Figure 4—figure supplement 1
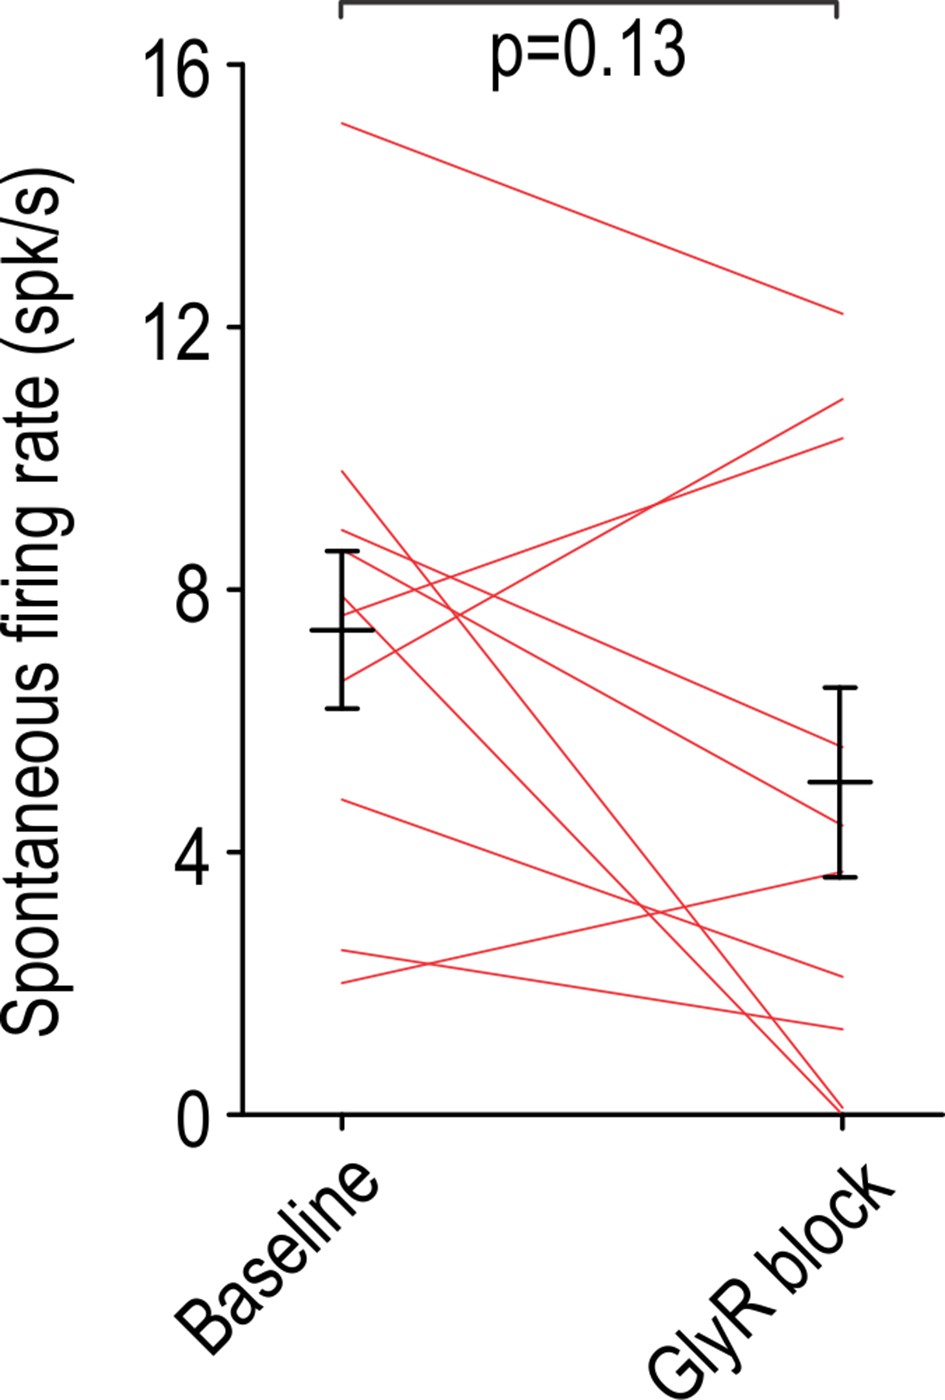
Intrathecal strychnine (50 μM) had no significant effect on the rate of spontaneous firing in non-adapting units (T9 = 1.65, p=0.13; paired t-test).
Figure 5
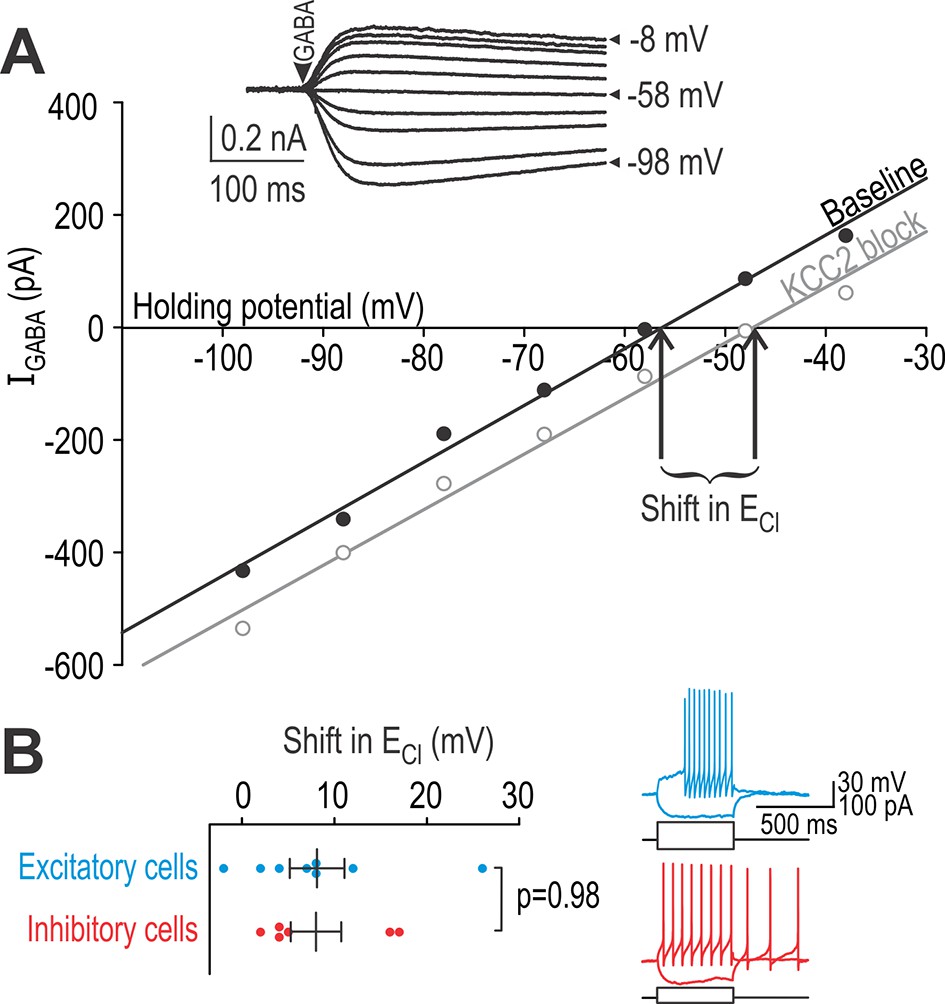
Excitatory and inhibitory neurons have equivalent chloride extrusion capacity.
(A) Responses to 5–10 ms-long puffs of 1 mM GABA (arrowhead) were measured in voltage clamp at different holding potentials (inset) in neurons patched with a high-chloride (25 mM) pipette solution. Chloride reversal potential ECl, which corresponds to where the I-V curve intersects the x-axis, was measured before (black) and after (gray) blockade of KCC2 with 15 µM bath-applied VU. The shift in ECl reflects chloride extrusion capacity, which is not equivalent to the change in ECl caused by KCC2 blockade under natural conditions (i.e. without intracellular chloride loading). (B) Neurons identified as excitatory or inhibitory based on spiking pattern (inset) displayed no difference in chloride extrusion capacity (T12 = 0.030, p=0.98; unpaired T-test).
-
Figure 5—source data 1
Numerical values for data plotted in Figure 5.
- https://cdn.elifesciences.org/articles/49753/elife-49753-fig5-data1-v2.xlsx
Figure 6 with 1 supplement
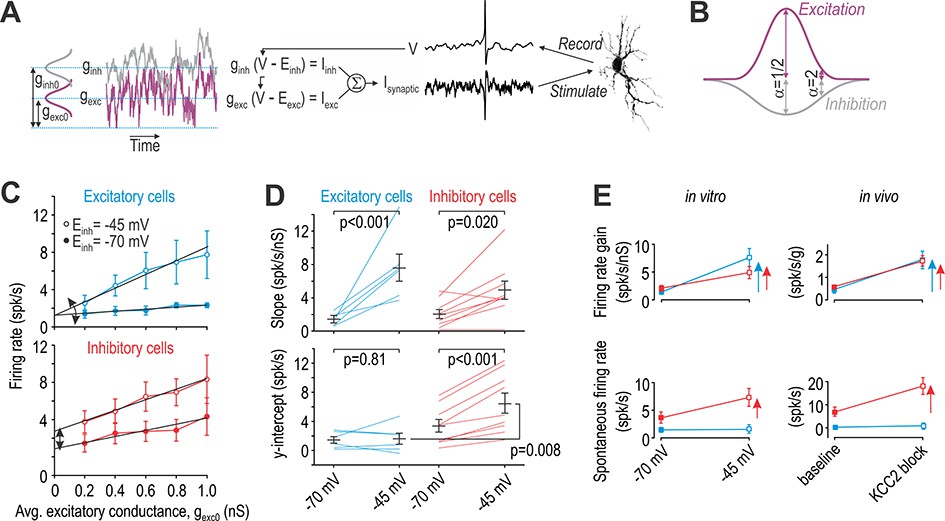
Excitatory and inhibitory neurons are differentially affected by virtual disinhibition.
(A) Cartoon depicts dynamic clamp experiments: noisy excitatory and inhibitory conductances were generated through separate Ornstein-Uhlenbeck processes, converted to currents based on recorded voltage, and applied to the neuron. Average excitatory conductance, gexc0, was systematically varied to plot input-output (i–o) curves. (B) Average inhibitory conductance, ginh0, was co-varied with gexc0 according to α = ginh0/gexc0, where α = 0.5 for virtual stimulation in the RF center and α = 2 for virtual stimulation in the RF surround. (C) Average i-o curves (± sem) for excitatory cells (blue, n = 6) and inhibitory cells (red, n = 8) for α = 2; see Figure 6—figure supplement 1 for results with α = 0.5. Each neuron was tested with normal inhibition (Einh = −70 mV) and again after virtual disinhibition (Einh = −45 mV). Disinhibition affected the i-o curve slope of both cell types but shifted the i-o curve only in inhibitory cells. (D) Einh had a significant effect on slope (F1,13 = 28.12, p<0.001, two-way repeated measures ANOVA). That effect did not differ significantly between cell types (interaction, F1,13 = 3.81, p=0.073) but there was a trend towards a larger increase in excitatory cells. Einh also had a significant effect on the y-intercept (F1,13 = 14.48, p=0.002) but only in inhibitory neurons (interaction, F1,13 = 11.75, p=0.004). Results of SNK tests are reported on graphs. (E) Summary of disinhibitory effects in vitro (data from panels C and D) for comparison with disinhibitory effects in vivo (data from Figure 4). Data are summarized as mean ± sem. Each colored arrow indicates a significant effect of disinhibition (p<0.05). Disinhibition significantly increased firing rate gain in all neuron types but increased spontaneous firing selectively in inhibitory neurons and non-adapting units.
-
Figure 6—source data 1
Numerical values for data plotted in Figure 6.
- https://cdn.elifesciences.org/articles/49753/elife-49753-fig6-data1-v2.xlsx
Figure 6—figure supplement 1

Effects of virtual disinhibition for α = 0.5 (virtual stimulation in RF centre).
(A) Average i-o curves (± sem) for excitatory neurons (blue) and inhibitory neurons (red). (B) Einh had a significant effect on slope (F1,13 = 8.82, p=0.011, two-way repeated measures ANOVA) but only in excitatory cells. Results of SNK tests are reported on graphs. The effect of Einh on the y-intercept differed significantly between excitatory and inhibitory cells (interaction, F1,13 = 5.67, p=0.033), with only inhibitory cells experiencing a significant change. Like for virtual stimulation in the RF surround (Figure 6), the y-intercept differed significantly (p=0.017; SNK test) between excitatory and inhibitory cells for Einh = −45 mV.
Figure 7
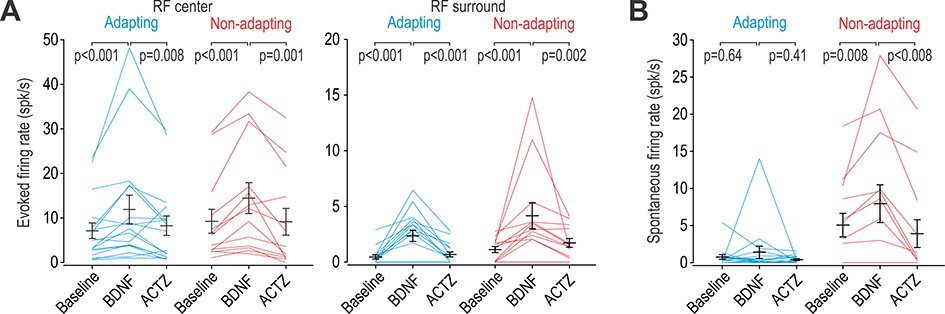
BDNF causes disinhibition in both adapting and non-adapting units.
(A) Intrathecal BDNF (70 µg) and ACTZ (10 mM) had a significant effect on the firing evoked by brush stimulation of the RF center (F2,56 = 15.41, p<0.001; two-way repeated measures ANOVA) or surround (F2,56 = 17.92, p<0.001). BDNF significantly increased evoked firing and subsequent application of ACTZ significantly reduced firing in adapting (blue) and non-adapting (red) units. Results of SNK tests are reported on graphs. (B) BDNF and ACTZ also had a significant effect on spontaneous firing (F2,56 = 6.76, p=0.002; two-way repeated measures ANOVA) but that effect differed between cell types (interaction, F1,56 = 8.10, p=0.008). Only non-adapting units responded to BDNF with significantly increased spontaneous firing, which was entirely reversed by ACTZ. Results of SNK tests are reported on graphs.
-
Figure 7—source data 1
Numerical values for data plotted in Figure 7.
- https://cdn.elifesciences.org/articles/49753/elife-49753-fig7-data1-v2.xlsx
Figure 8
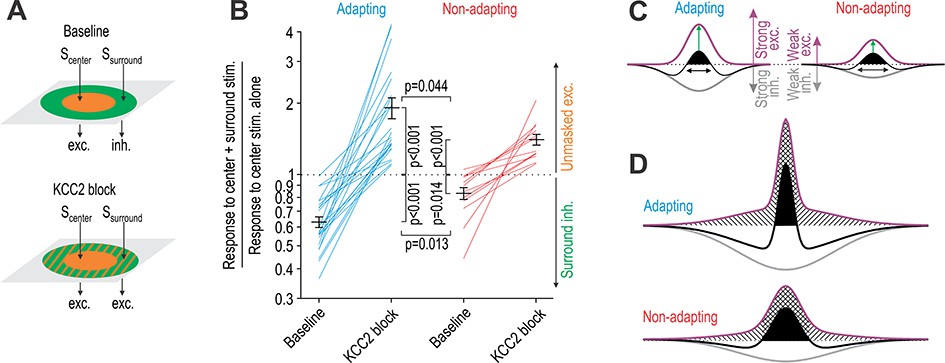
KCC2 blockade unmasks significantly more excitation in adapting units than in non-adapting units.
(A) Stimulation of the RF center (Scenter) evokes net excitation whereas stimulation of the RF surround (Ssurround) normally evokes net inhibition but evokes excitation after KCC2 blockade. (B) Responses to brush co-stimulation, Scenter + Ssurround, expressed as a ratio of the response to Scenter alone. A ratio <1 means that Ssurround evoked inhibition whereas a ratio >1 means that Ssurround contributed to excitation. KCC2 blockade had a significant effect on the ratio (F1,33 = 83.93, p<0.001; two-way repeated measures ANOVA) but that effect differed between cell types (interaction, F1,33 = 8.89, p=0.005). Specifically, co-stimulation had a significantly stronger inhibitory effect under baseline conditions (Q33 = 3.61, p=0.013; SNK test) and a significantly stronger excitatory effect after disinhibition (Q33 = 2.92, p=0.044) in adapting units compared with non-adapting units. (C) A simple model can explain data in panel B: adapting units rely on strong inhibition to counterbalance strong touch-evoked excitation whereas non-adapting units require less inhibition to counterbalance weaker excitation. The RF (black) is defined by the summation of spatially distributed excitatory (purple) and inhibitory (gray) input; RF size is highlighted by black arrows while net excitatory drive is proportional to the area of the black region. However, this version of the model incorrectly predicts that disinhibition (i) increases drive from the RF center more in adapting units than in non-adapting units (green arrows) and (ii) causes a greater increase in drive from the RF center than from the RF surround (see D). (D) The two discrepancies identified in C were resolved through changes to the spatial distribution of excitatory input. Crosshatched and hatched areas show the disinhibition-mediated increase in drive from the RF center and surround, respectively.
-
Figure 8—source data 1
Numerical values for data plotted in Figure 8.
- https://cdn.elifesciences.org/articles/49753/elife-49753-fig8-data1-v2.xlsx
Additional files
Download links
A two-part list of links to download the article, or parts of the article, in various formats.
Downloads (link to download the article as PDF)
Open citations (links to open the citations from this article in various online reference manager services)
Cite this article (links to download the citations from this article in formats compatible with various reference manager tools)
Excitatory neurons are more disinhibited than inhibitory neurons by chloride dysregulation in the spinal dorsal horn
eLife 8:e49753.
https://doi.org/10.7554/eLife.49753


