Actin assembly ruptures the nuclear envelope by prying the lamina away from nuclear pores and nuclear membranes in starfish oocytes
- European Molecular Biology Laboratory (EMBL), Germany
- Max Planck Institute for Biophysical Chemistry, Germany
Figures
Figure 1
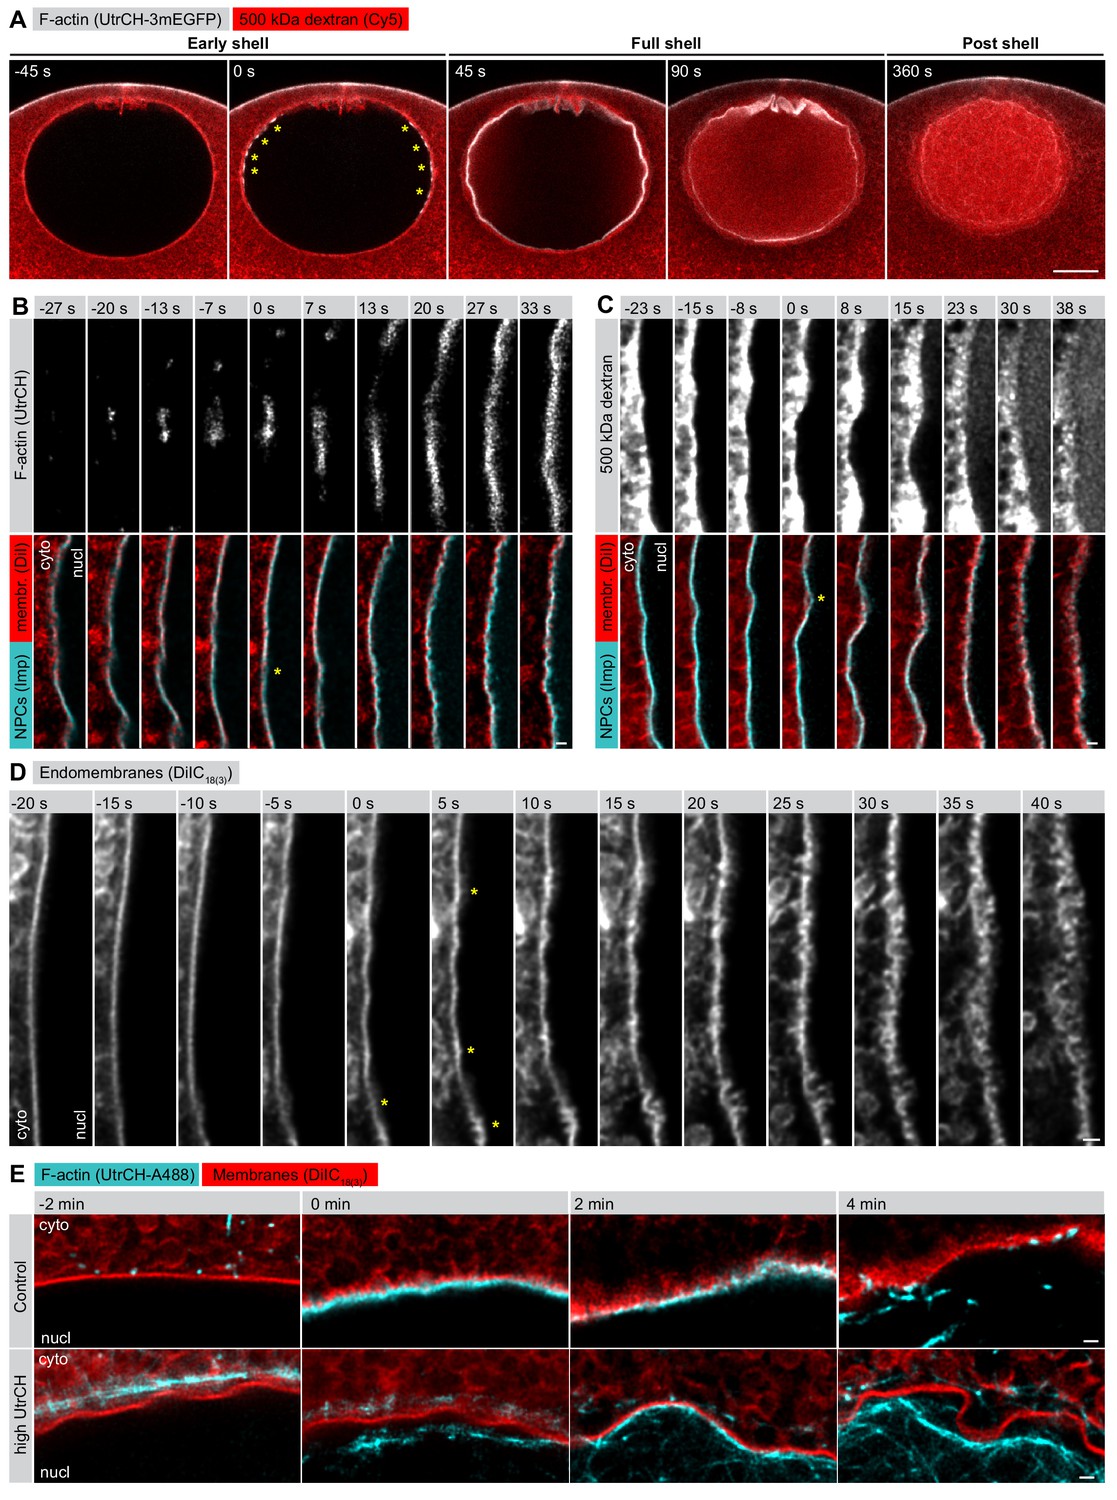
F-actin-driven membrane reorganization precedes NE rupture.
(A) Live imaging of UtrCH-3mEGFP (white) and Cy5-labeled Dextran-500 kDa (red) in a starfish oocyte undergoing NEBD. Selected single confocal sections are shown from a time series. scale bar: 20 µm. Yellow asterisks mark F-actin foci. (B) Live imaging of a section of the rupturing NE in an oocyte injected with recombinant AlexaFluor488-labeled UtrCH, AlexaFluor647-labeled importin-β (45-462) (Imp), and DiIC18(3) (Dil). Selected frames are shown from a deconvolved AiryScan time series. Scale bar: 1 µm. Yellow asterisks mark the first visible sites of membrane reorganization. (C) As in panel (B) except that the oocyte was injected with a 500 kDa dextran instead of UtrCH. (D) Similar to panel (B) except that the oocyte was injected with DiIC18(3) alone and imaged at the highest possible frame rate and resolution. (E) In an experiment similar to that shown in panel (B), oocytes were injected with either low (~1 µM) or a very high amount (~20 µM) of UtrCH-AlexaFluor488 and equal amounts of DiIC18(3). At high concentrations, UtrCH depletes the available actin monomers by stabilizing cytoplasmic F-actin networks, and thereby efficiently prevents Arp2/3-driven assembly and NE rupture.
Figure 2
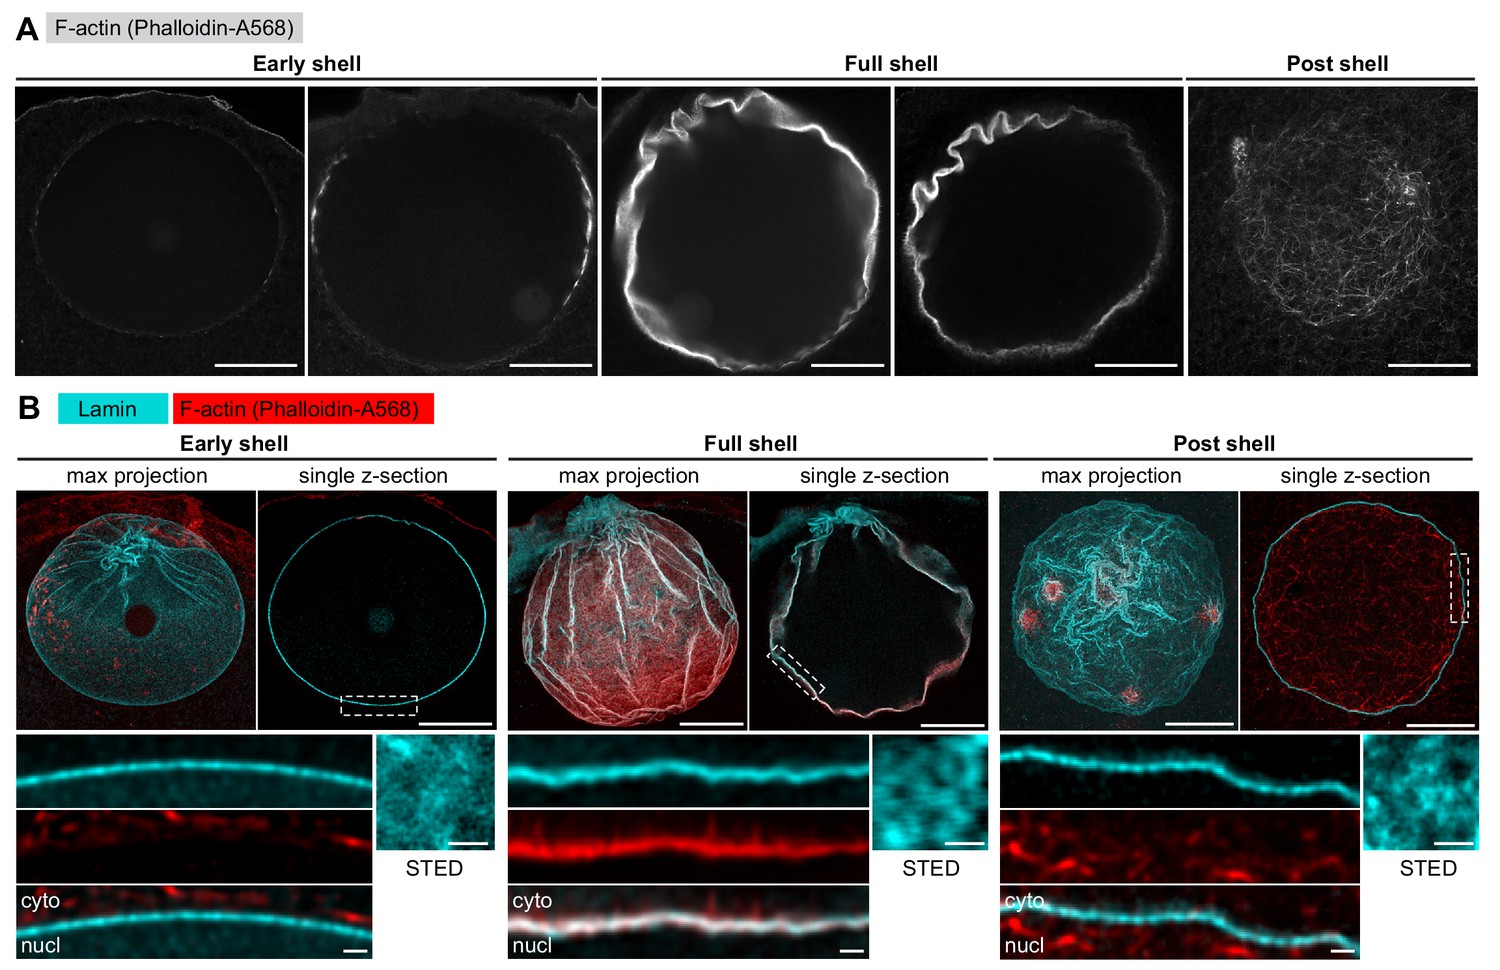
The lamina remains intact during NE rupture.
(A) Fixed samples with F-actin labeled by phalloidin-AlexaFluor568. Individual confocal sections are shown and ordered to match the live time series shown in Figure 1A. Scale bar: 20 µm. (B) Immunostained starfish oocytes with anti-lamin antibody shown in cyan and phalloidin-AlexaFluor568 in red. The images show three time-points: early shell, full shell and post shell. Each panel shows a maximum projection of the whole z-stack (left), a single selected optical section across the equatorial plane (right), and a close-up of the area in the single section highlighted with dashed rectangle (bottom). The small insets on the bottom right show en face views of the lamina in oocytes stained with the anti-lamin antibody and imaged by stimulated emission depletion (STED) microscopy at the corresponding stages. Scale bars: 20 µm (top), 5 µm (bottom left) and 0.5 µm (bottom right).
Figure 3
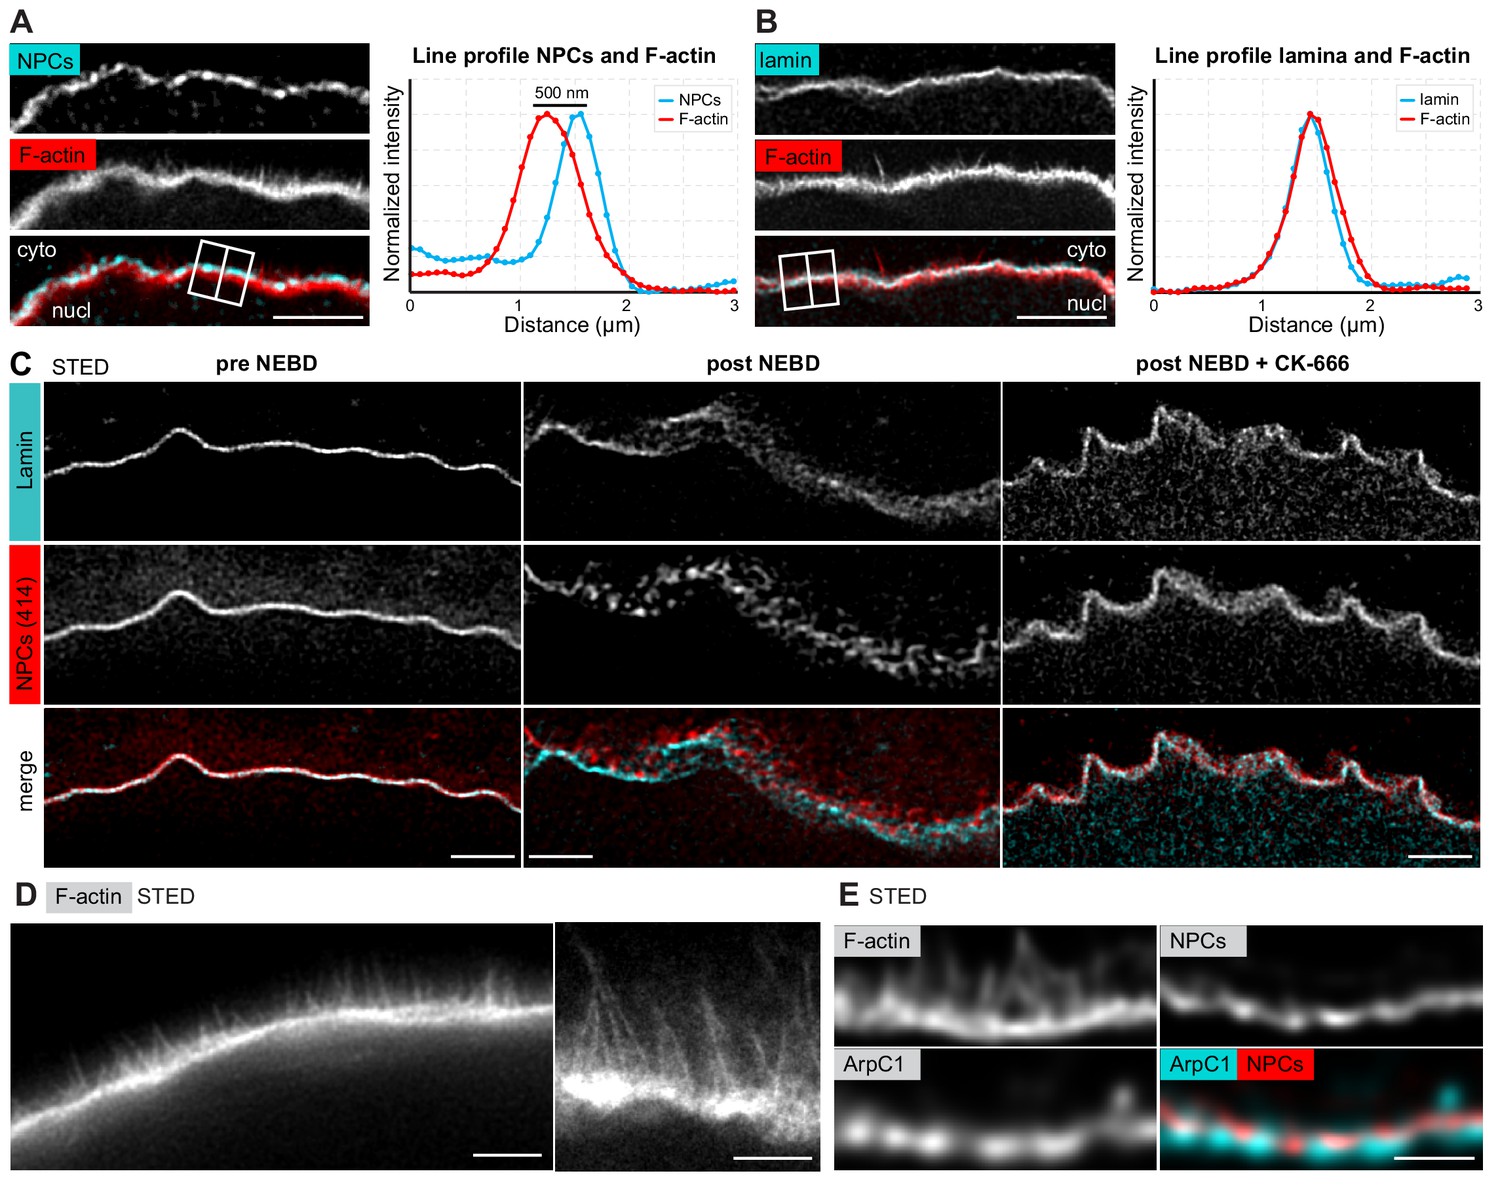
The F-actin shell separates the lamina and the nuclear membranes during NEBD.
(A) Left: portion of the NE undergoing rupture immunostained with mAb414 for NPCs (cyan) and phalloidin-AlexaFluor568 for F-actin (red). A crop of a portion of NE from a confocal Z-section is shown. Scale bar: 2 µm. Right: plot of a line profile over the region marked with a white rectangle; normalized intensities of both channels are shown. (B) Same as panel (A) but stained with anti-lamin antibody and phalloidin-AlexaFluor568. (C) Portions of the NE stained with anti-lamin antibody (cyan) and mAb414 (red) and imaged by STED. Left, before NEBD; middle, after NEBD; right, after NEBD but first treated with CK-666 to inhibit the formation of the F-actin shell. Scale bars: 2 µm. (D) Phalloidin-Abberior Star RED staining of the F-actin shell imaged by STED microscopy. Scale bars: 5 µm (left) and 2 µm (right). (E) F-actin shell stained with mAb414 to label NPCs, an anti-ArpC1 antibody to label the Arp2/3 complex, and Phalloidin-Abberior Star RED to label F-actin, imaged by STED microscopy. Scale bar: 2 µm.
Figure 4 with 3 supplements
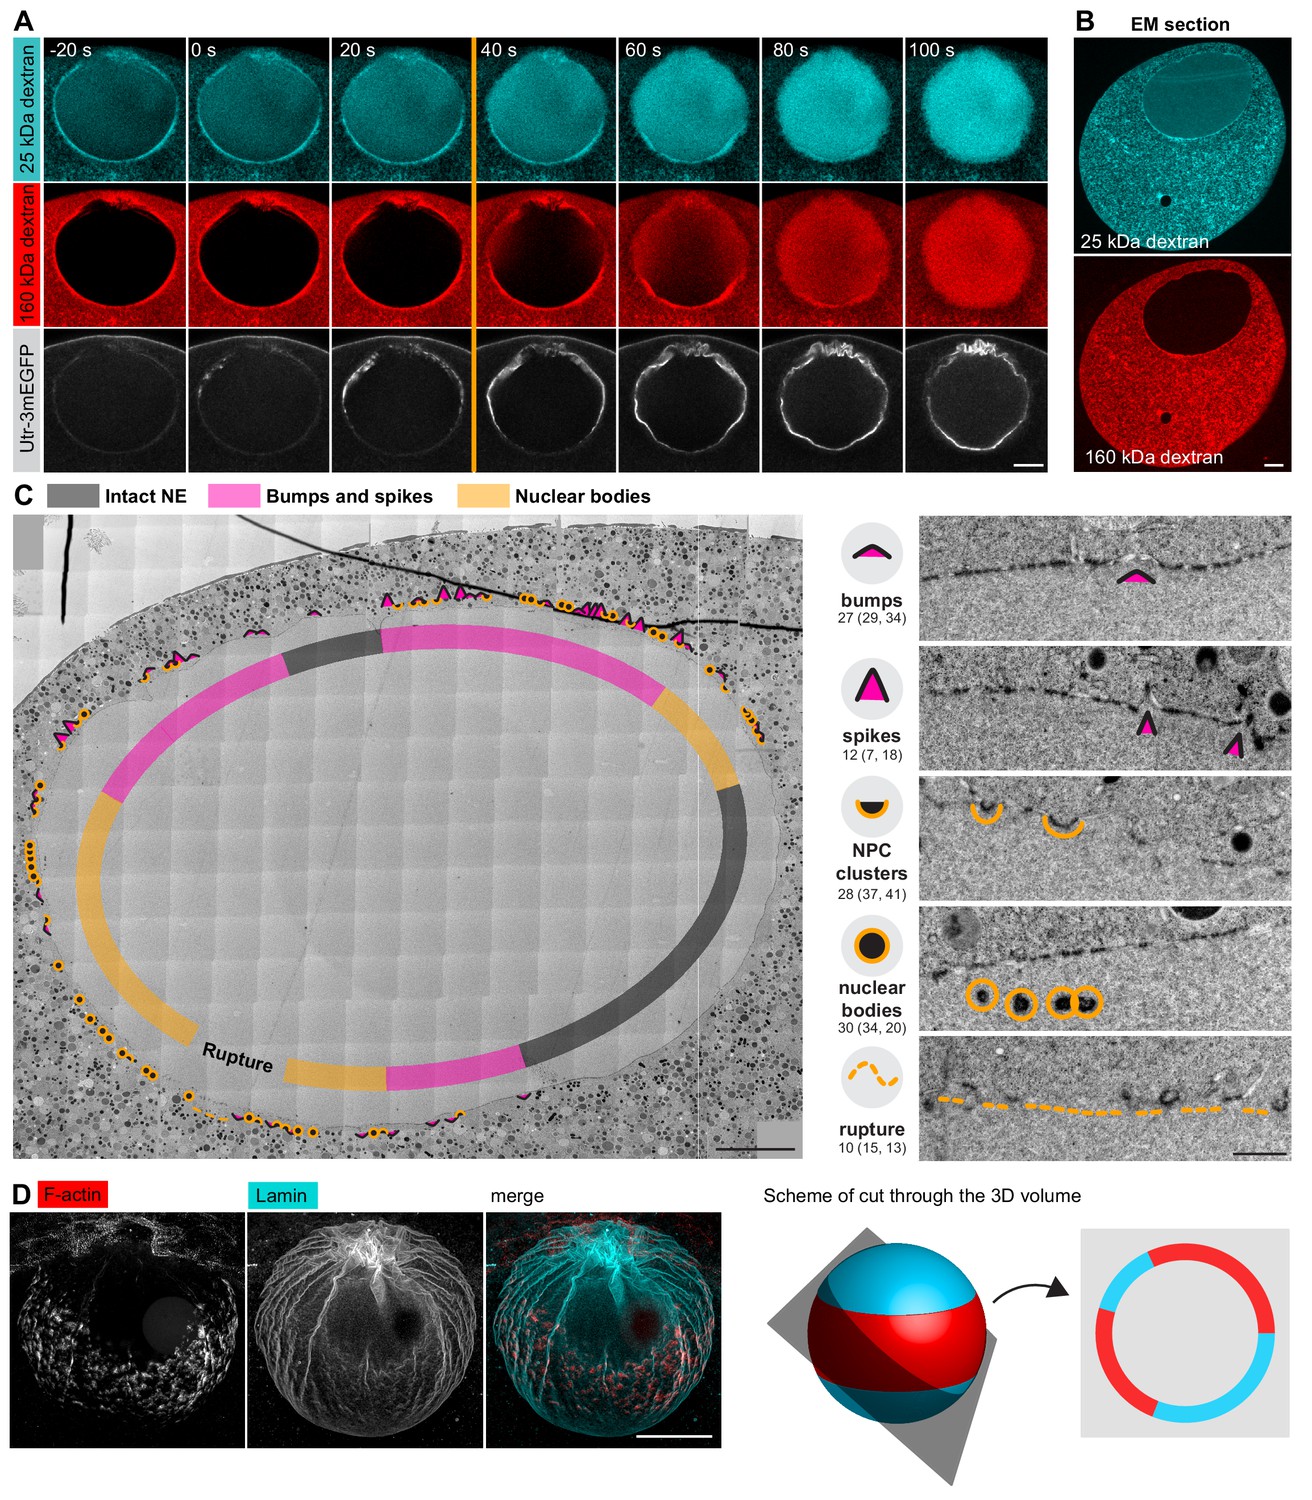
Correlative EM approach captures NE rupture intermediates.
(A) Live imaging of a starfish oocyte undergoing NEBD and injected with a 25-kDa Cy5-labeled dextran (cyan), a 160-kDa TRITC-labeled dextran (red) and UtrCh-3mEGFP (white).Selected 2-frame projections from a confocal time-series imaged at one frame per second are shown. The orange line marks the moment immediately before rupture of the membrane, corresponding to the predicted time for the EM sample shown in panels (B) and (C). Scale bar: 20 µm. (B) Wide-field fluorescence image of a 70-nm section of a Lowicryl-embedded oocyte undergoing NEBD and injected with a 25-kDa Cy5-labeled dextran (cyan) and a 160-kDa TRITC-labeled (red) dextran. Scale bar: 20 µm. (C) A whole-nucleus tile of transmission EM images stitched automatically for the oocyte section shown in panel (B). Symbols around the nucleus correspond to NE rupture intermediates. A symbol legend with examples (crops from the tiled image) is shown to the right. Under each symbol, numbers correspond to the count of these events in the section shown, and the count in two adjacent sections is given in parentheses (shown in Figure 4—figure supplements 1–3). The band that traces the NE within the nuclear space demarcates areas with color-code for predominant membrane features. For a full resolution image, see Figure 4—figure supplement 1. Scale bar: 10 µm. (D) An oocyte fixed and stained with anti-lamin antibody (cyan) and phalloidin-AlexaFluor568 at early shell formation. A maximal Z projection is shown. Right: scheme illustrating the 3D geometry of the EM section. Scale bar: 20 µm.
Figure 4—figure supplement 1
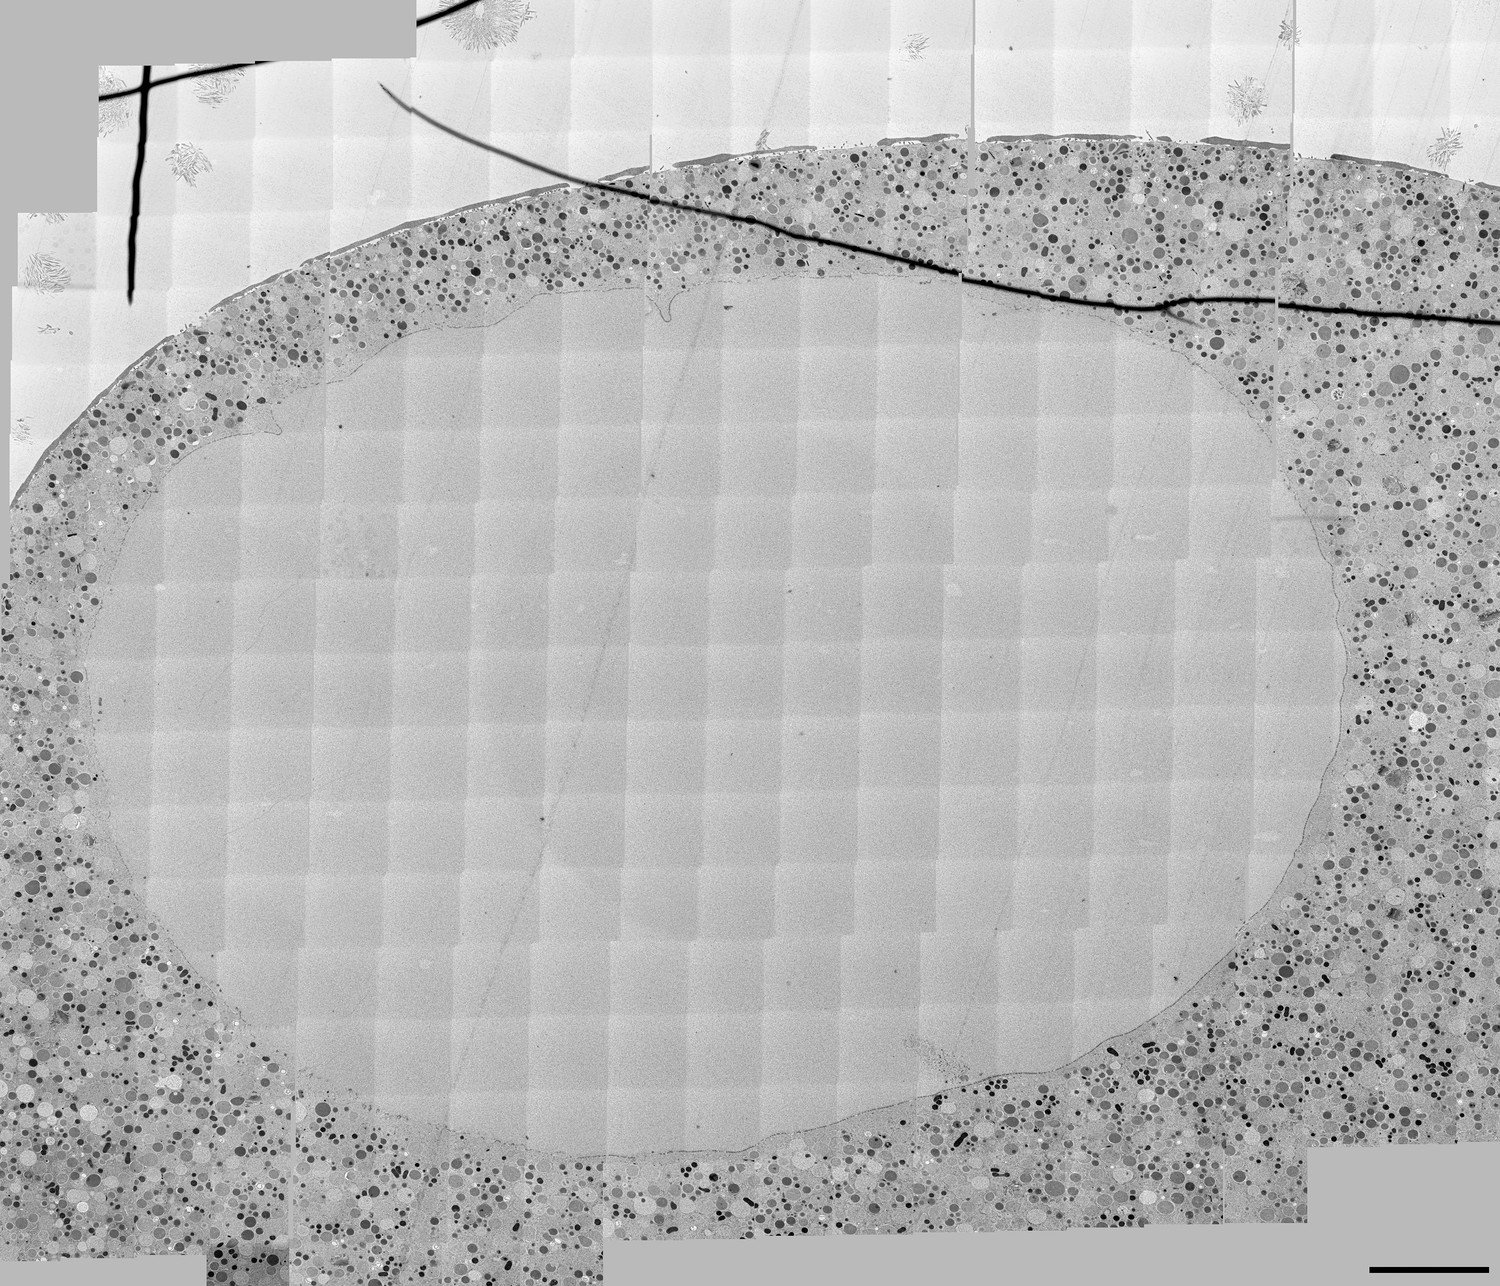
High-resolution transmission electron microscropy (TEM) montage of a section through the nuclear region of an oocyte undergoing NEBD (shown on Figure 3C).
Scale bar: 10 µm.
Figure 4—figure supplement 2
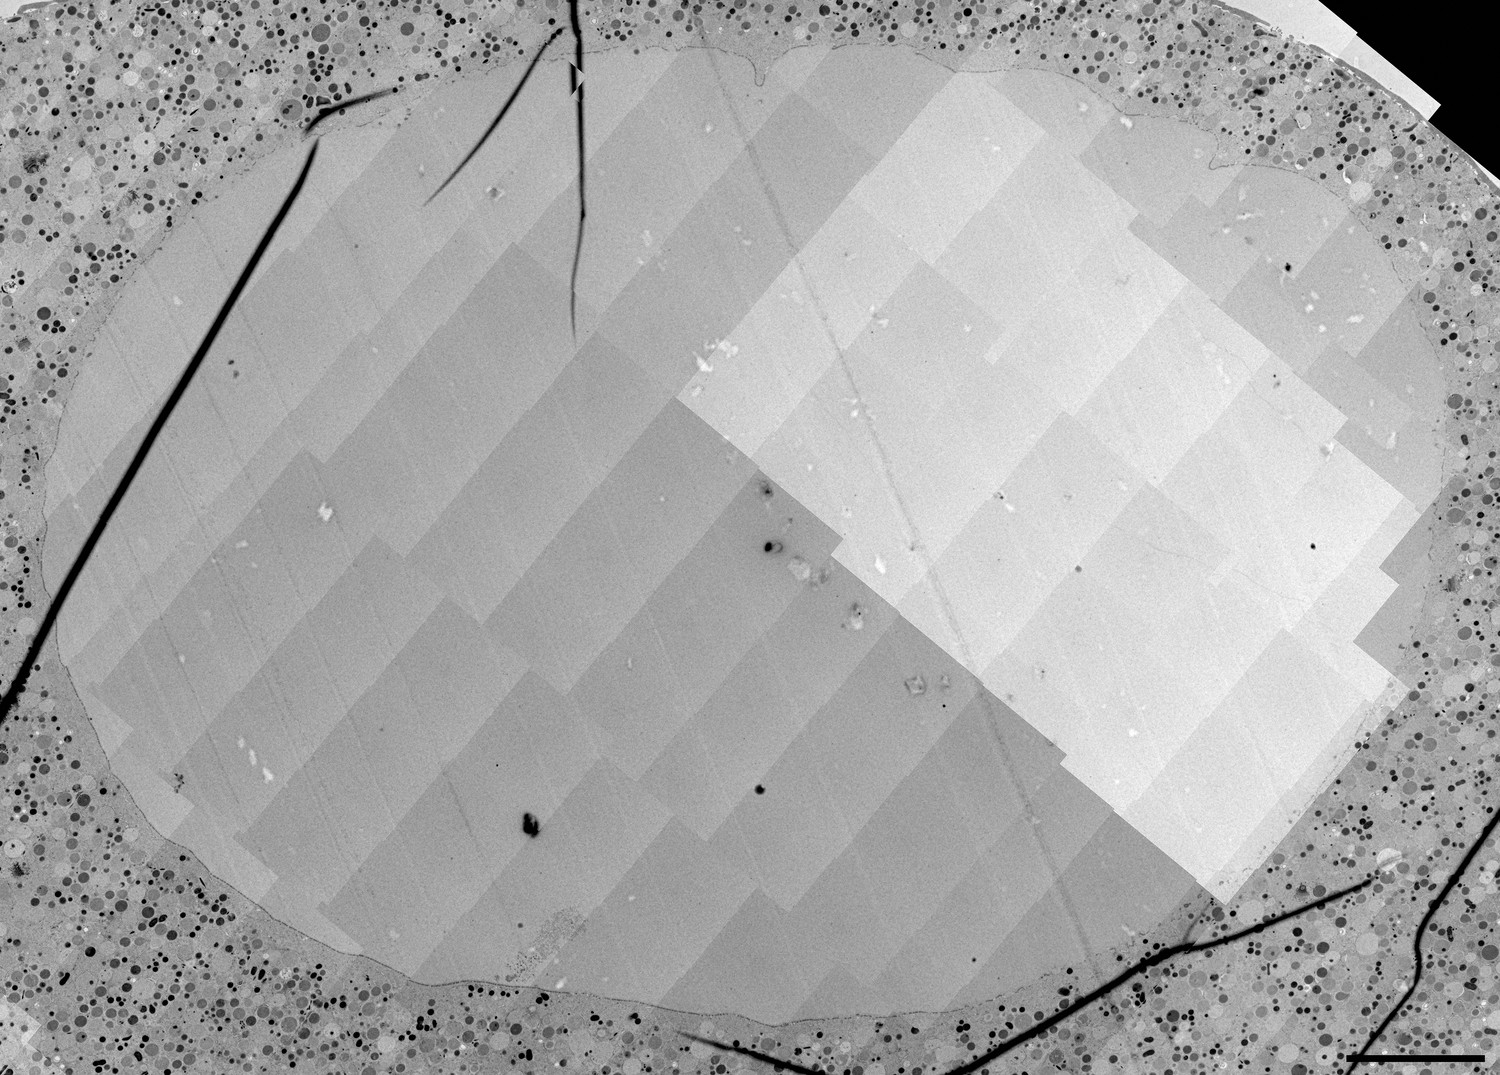
High-resolution TEM montage of a section through the nuclear region of an oocyte undergoing NEBD, section adjacent to that shown in Figure 4—figure supplement 1..
Scale bar: 10 µm.
Figure 4—figure supplement 3
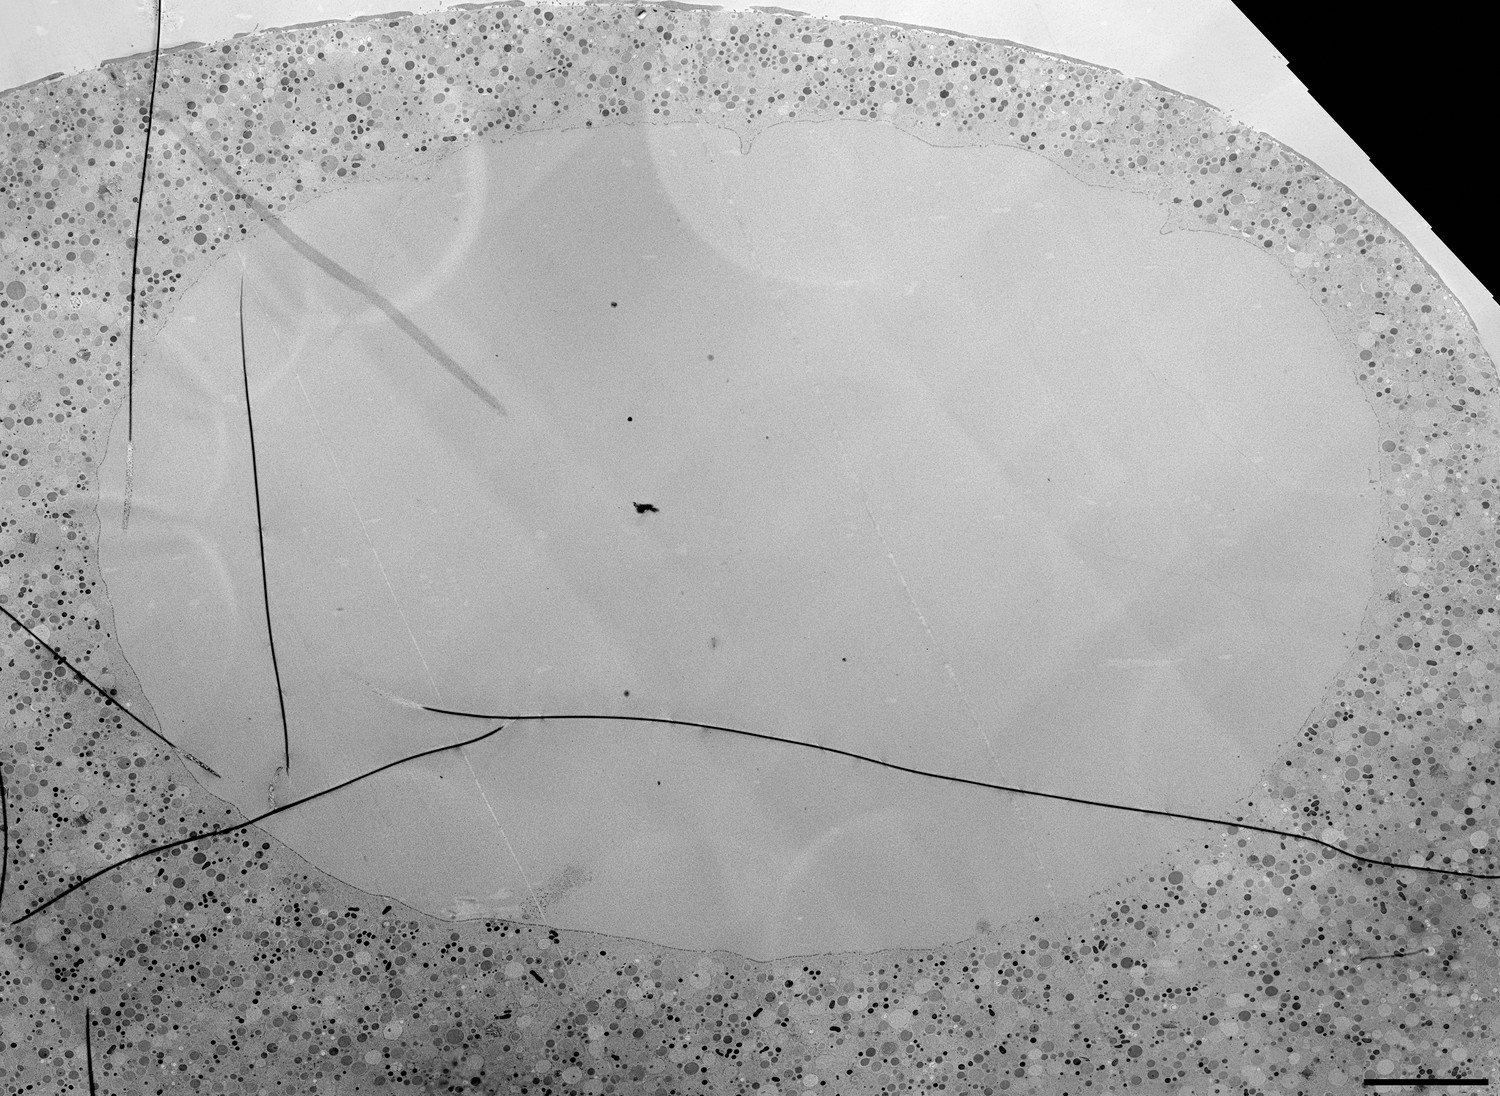
High-resolution TEM montage of a section through the nuclear region of an oocyte undergoing NEBD, section from the oocyte also shown in Figure 4—figure supplement 1. Scale bar: 10 µm.
Figure 5 with 1 supplement

Spikes protrude bare nuclear membranes.
(A–D) Transmission EM images from the oocyte shown in Figure 4C showing intermediates of NE rupture. Transparency coloring distinguishes the cytoplasm (green) from the nuclear area (pink) on the basis of the presence of ribosomes. Scale bars are 1 µm, except in the zooms, where they are 250 nm. In panel (D) arrows point to nucleoplasmic bodies. Zooms of the areas outlined with white rectangles are shown below. (E) Tomogram of a NE spike from a 300-nm thick section of the oocyte shown in Figure 4C, with model overlay segmented manually. Scale bar: 200 nm. (F) Selected single frame from a deconvolved 3D Airyscan recording at the time of NE rupture. F-actin is labeled with recombinant UtrCH-AlexaFluor488, and endomembranes are stained by DiIC18(3). Arrows mark prominent F-actin spikes. Scale bar: 1 µm. (G) STED image of the NE at the shell stage stained for NPCs (mAb414), lamina and phalloidin-Abberior Star Red. Separate channels and overlays are shown in the combinations indicated. Arrows point at nucleoplasmic bodies. Scale bars: 1 µm and 0.5 µm.
Figure 5—figure supplement 1
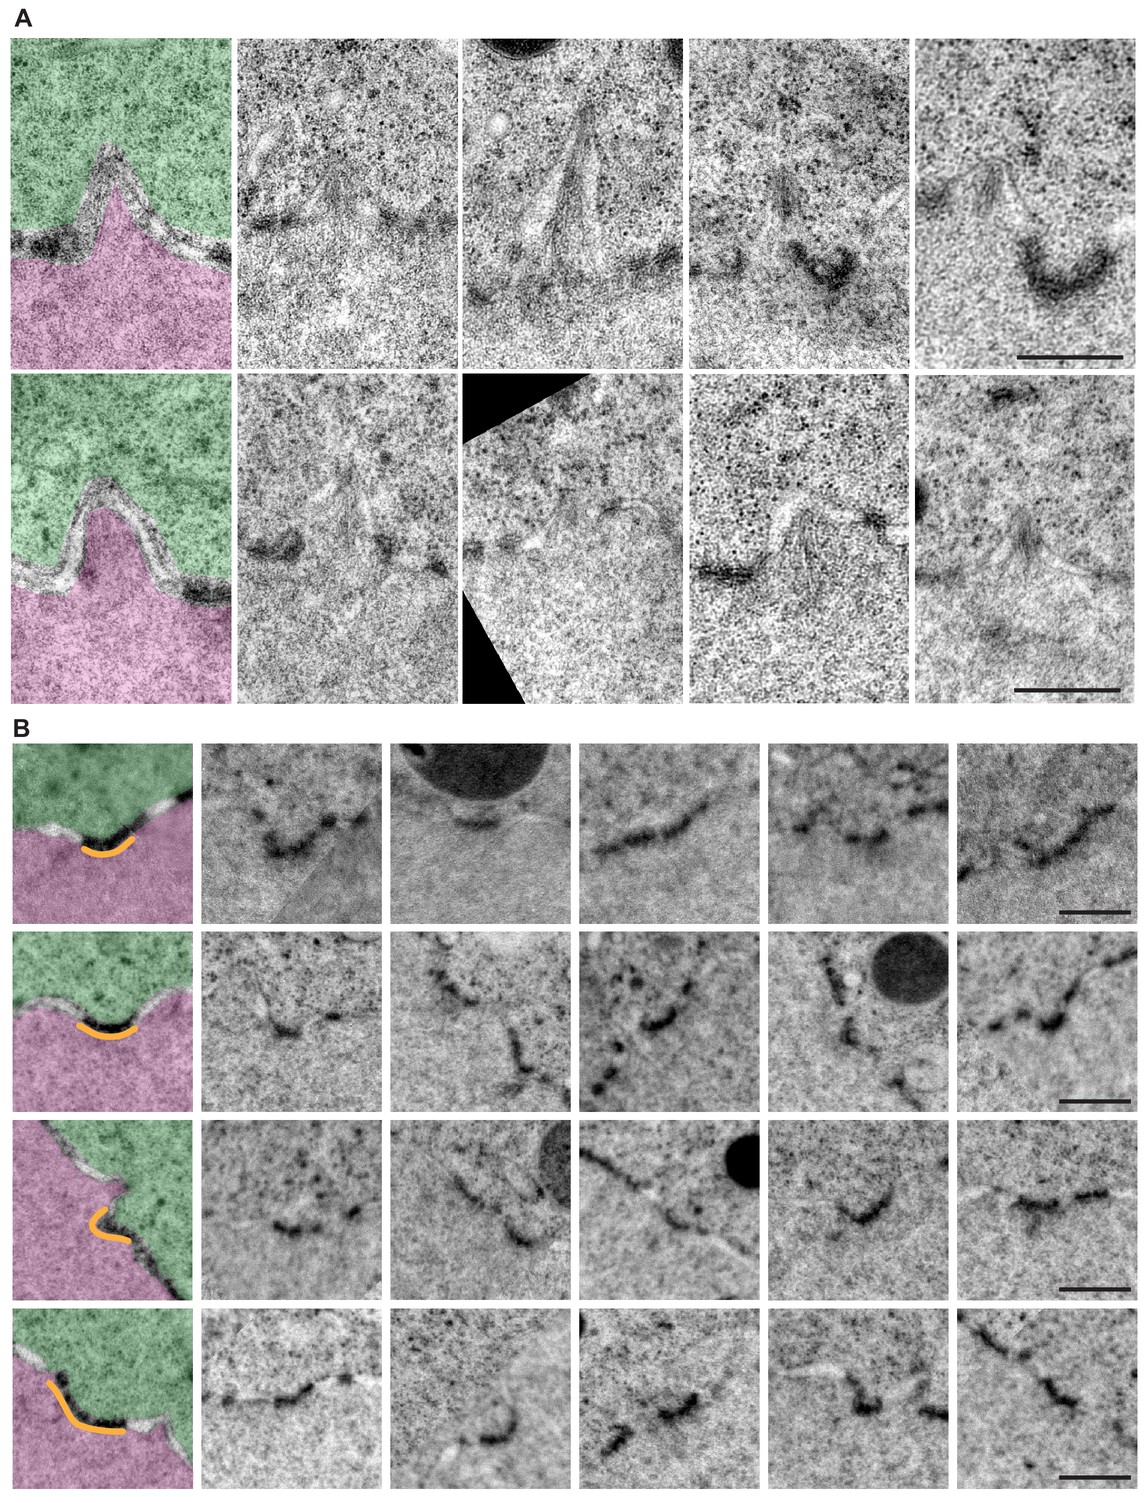
Examples of NPC-rich clusters.
(A) Crops from an EM montage of membrane evaginations containing actin filaments. (B) Crops each show a membrane feature identified as NPC clusters: a concave NE-membrane portion that is rich in NPCs. To help orientation, the first crop in each row is pseudo-colored for cytoplasm (green), nucleus (pink) and NPC-rich cluster (orange). Scale bar: 500 nm.
Figure 6
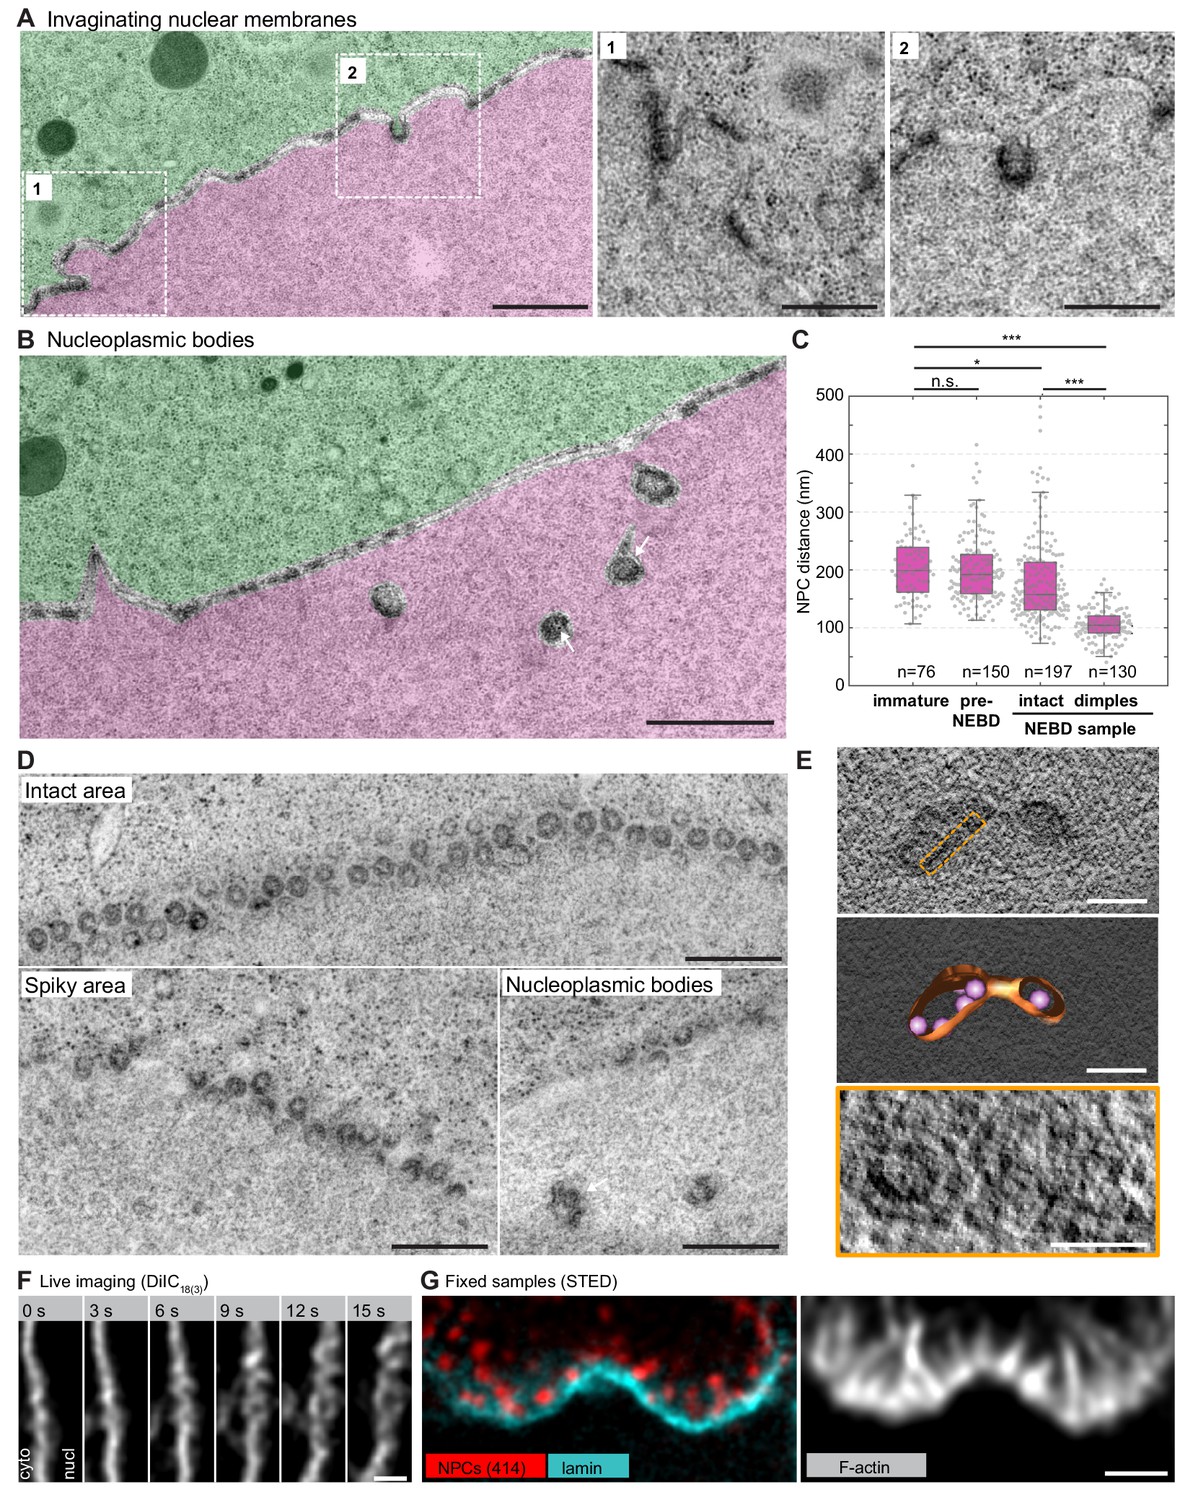
NPC clusters invaginate to form nucleoplasmic bodies.
(A) Transmission EM images from the oocyte shown in Figure 4C and colored as in Figure 5A–D, showing invaginating NPC clusters. Zooms of portions outlined with white rectangles are shown below without color transparencies. Scale bars: 1 µm (left) and 500 nm(zooms). See Figure 5—figure supplement 1A for more examples. (B) Transmission EM images as in panel (A) showing an area with nucleoplasmic bodies. Arrows point at ribosomes that are present within nucleoplasmic bodies. Scale bar: 1 µm. (C) Quantification of pore-to-pore distance on electron micrographs similar to those shown in Figure 4—figure supplements 1–3. n refers to the number of pore-pairs measured in each of the respective samples or regions. n.s. denotes no significant difference, *, p≤0.05, ***, p≤0.001, as calculated by Student’s T-test. (D) En face views of NPCs in the indicated regions along the NE. Scale bars: 500 nm. (E) Tomogram of a nucleoplasmic body (left), with a model overlaid (middle). Right: re-slicing of the volume perpendicular to the view on the left corresponding to the area outlined with an orange dashed rectangle in the top panel. Scale bars: 200 nm (top and middle) and 100 nm (bottom). (F) Selected frames from a live-cell recording of an oocyte injected with DiIC18(3) undergoing NE rupture. Scale bar: 1 µm. (G) STED image of the NE at the shell stage stained for NPCs (mAb414) (red), lamina (cyan) and phalloidin-AlexaFluor488 (gray). Scale bar: 1 µm.
Figure 7
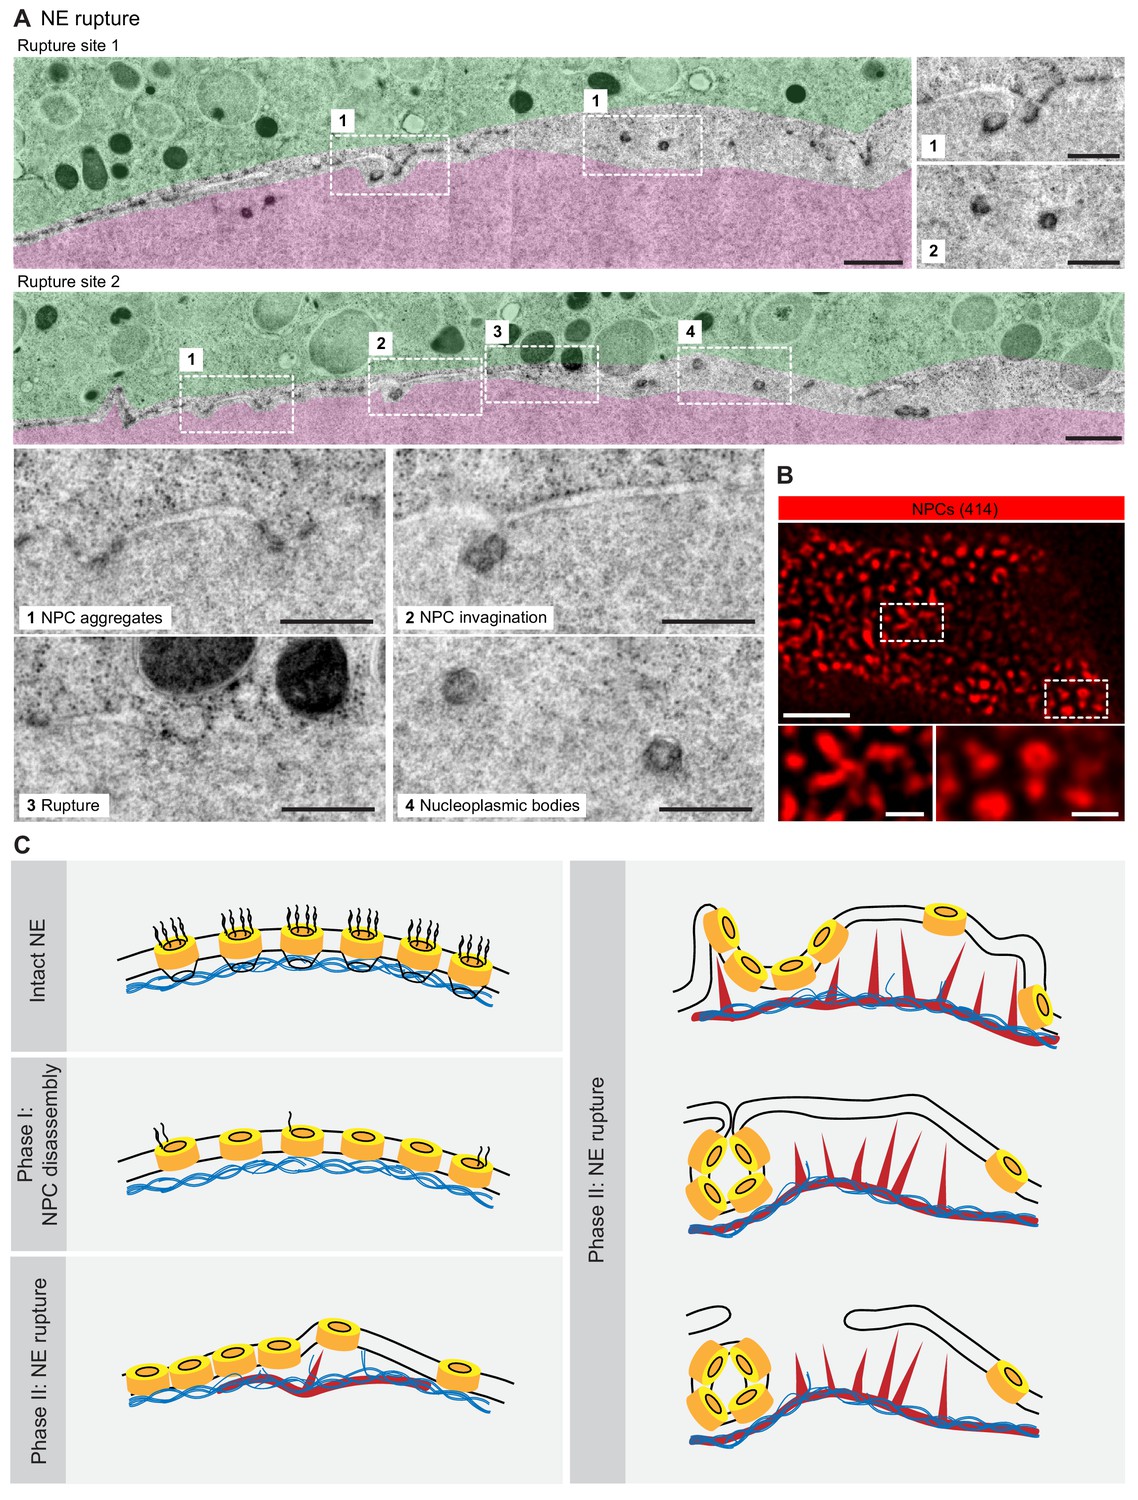
NE rupture occurs in pore-free regions.
(A) Transmission EM images like those in Figure 6A showing examples of NE rupture events. Zooms of the areas outlined with white squares are shown below. Scale bars: 1 µm, and 500 nm for zooms. (B) En face STED image of the NE at the shell stage stained for NPCs (mAb414) (red). Scale bars: 1 µm (top) and 0.5 µm (bottom). (C) Model of F-actin-driven NE rupture. Intact NE: interphase organization of nuclear membranes (black lines) with regularly spaced NPCs (yellow cylinders) featuring cytoplasmic filaments and nuclear baskets. Nuclear baskets are embedded in the lamin network (blue filaments). Phase I of NEBD: peripheral NPC components are gradually released, but the NPC core and the overall NE structure remains intact. Phase II: NE rupture. First, small patches of F-actin (red) form within the lamina. F-actin patches grow and merge to form a shell, pushing apart NPCs that are still partially anchored in the lamina. As frequent F-actin spikes further sever the lamin-to-NE attachments, NPCs segregate into conglomerates, leaving stretches of unstable bare membrane, where breaks appear.
Tables
Key resources table
| Reagent type or resource | Designation | Source or reference | Identifiers | Additional information |
|---|---|---|---|---|
| Biological sample (Patiria miniata) | starfish oocytes | https://scbiomarine.com/ http://www.marinusscientific.com/ | ||
| Biological sample (Patiria pectinifera) | starfish oocytes | Kazuyoshi Chiba, Ochanomizu University, Tokyo, Japan | ||
| Sequence-based reagent | mEGFP3-UtrCH, 3mCherry-UtrCH | doi:10.1002/cm.20226 | synthetic mRNA (Utrophin CH domain (human)) | |
| Peptide, recombinant protein | Importin | doi: 10.1093/emboj/16.6.1153 | (Importin-ß (45-462)) | |
| Peptide, recombinant protein | UtrCH | doi:10.1002/cm.20226 | (Utrophin CH domain (human)) | |
| Antibody, mouse (mAb414) | mAb414, mouse monoclonal | Sigma, BioLegend | Sigma #N8786, Biologend #902907 | 1:250 |
| Antibody, rabbit (lamin) | lamin, rabbit polyclonal | see 'Materials and methods' for details | 1:250 | |
| Commercial assay or kit | AmpliCap-Max T7 High Yield Message Maker | CellScript | C-ACM04037 | |
| Commercial assay or kit | Poly(A) tailing kit | CellScript | C-PAP5104H | |
| Commercial assay or kit | Alexa Fluor 647 maleimide | ThermoFisher | A20347 | |
| Commercial assay or kit | Alexa Fluor 488 maleimide | ThermoFisher | A10254 | |
| Commercial assay or kit | Alexa Fluor 647 NHS Ester | ThermoFisher | A20006 | |
| Commercial assay or kit | Alexa Fluor 488 NHS Ester | ThermoFisher | A20000 | |
| Commercial assay or kit | Cy5 NHS Ester | discontinued | ||
| Chemical compound, drug | DiIC18(3) | ThermoFisher | D282 | |
| Chemical compound, drug | 1-methyladenine (1-MA) | ACROS organics | ||
| Commercial assay or kit | Phalloidin-AlexaFluor 488 | ThermoFisher | A12379 | |
| Commercial assay or kit | Phalloidin-AlexaFluor 568 | ThermoFisher | A12380 | |
| Commercial assay or kit | Phalloidin-AlexaFluor 647 | ThermoFisher | A22287 | |
| Commercial assay or kit | Abberior STAR RED phalloidin | Abberior | ||
| Chemical compound, drug | CK-666 | Merck | 182515 | |
| Chemical compound, drug | Amino-dextran 500,000 MW | ThermoFisher | D7144 | |
| Chemical compound, drug | Amino-dextran 70,000 MW | ThermoFisher | D1862 | |
| Chemical compound, drug | TRITC–Dextran 155,000 MW | Sigma | T1287 |
Additional files
Download links
A two-part list of links to download the article, or parts of the article, in various formats.
Downloads (link to download the article as PDF)
Open citations (links to open the citations from this article in various online reference manager services)
Cite this article (links to download the citations from this article in formats compatible with various reference manager tools)
Actin assembly ruptures the nuclear envelope by prying the lamina away from nuclear pores and nuclear membranes in starfish oocytes
eLife 9:e49774.
https://doi.org/10.7554/eLife.49774


