Selective clearance of the inner nuclear membrane protein emerin by vesicular transport during ER stress
- University of California, San Francisco, United States
- Chan Zuckerberg Biohub, United States
- The Salk Institute for Biological Studies, United States
Figures
Figure 1 with 1 supplement
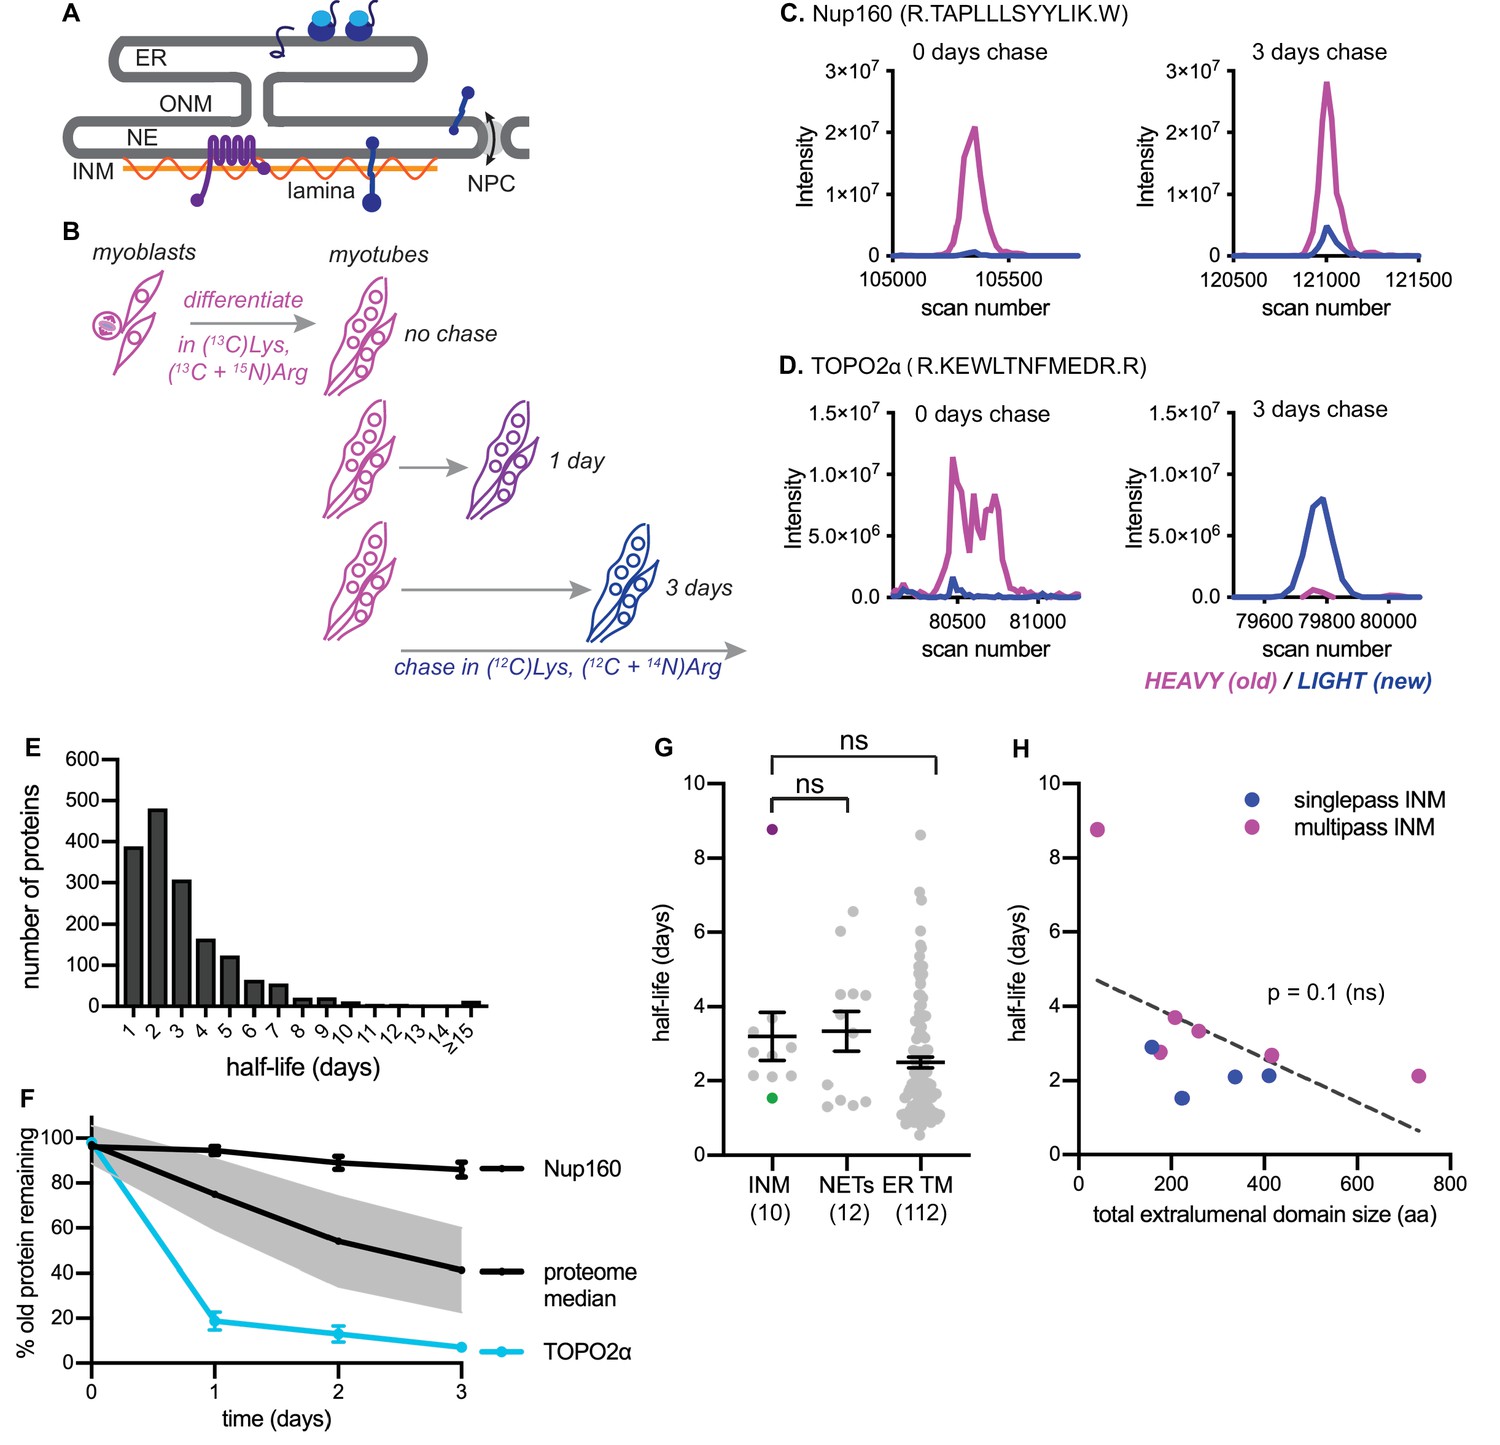
Dynamic proteomic analysis of inner nuclear membrane protein turnover.
(A) Diagram of the ER with associated ribosomes, the NE composed of the ONM and INM, the NPCs, and the underlying nuclear lamina. INM proteins are synthesized in the ER, pass through the NPC, and enrich at the INM. (B) Overview of dynamic SILAC labeling experimental design. C2C12 mouse myoblasts were cultured for five population doublings in medium containing 13C6-lysine and 13C6, 15N4-arginine to completely label the proteome. After 3 days of culturing under differentiating conditions to generate non-dividing myotubes, cultures were switched to chase medium containing 12C-lysine and 12C, 14N-arginine for 1 to 3 days. Nuclear extracts were prepared at day 0, day 1, day 2, and day three for proteomic identification. (C,D) Representative peptide scans for a slowly degraded protein (Nup160) and (D) for a rapidly degraded protein (Topo2α) at the starting and ending points of the experiment outlined in (B). (E) Histogram of calculated half-lives for 1677 proteins with a median half-life of 2.4 days. (F) Features of nuclear proteome turnover. Median turnover behavior of 1677 proteins detected in at least three timepoints with at least one peptide (black line) with one standard deviation (gray); compared to turnover of the slowly exchanged protein Nup160 (black) and the rapidly exchanged protein Topo2α (blue). Error bars indicate SEM. (G) Calculated half-lives of 10 bona fide INM proteins, ranging from slowly degraded (nurim, purple) to rapidly degraded (emerin, green); 12 nuclear envelope transmembrane proteins (NETs) identified as NE residents by subtractive proteomics (see Schirmer et al., 2003); and 112 ER membrane proteins. ns indicates lack of statistical significance by Mann-Whitney test. Error bars indicate SEM. (H) There is no significant correlation between extraluminal domain size of INM proteins and their half-lives. See also Source Data 1–2, Supplementary files 1–3, and Figure 1—figure supplement 1.
Figure 1—figure supplement 1
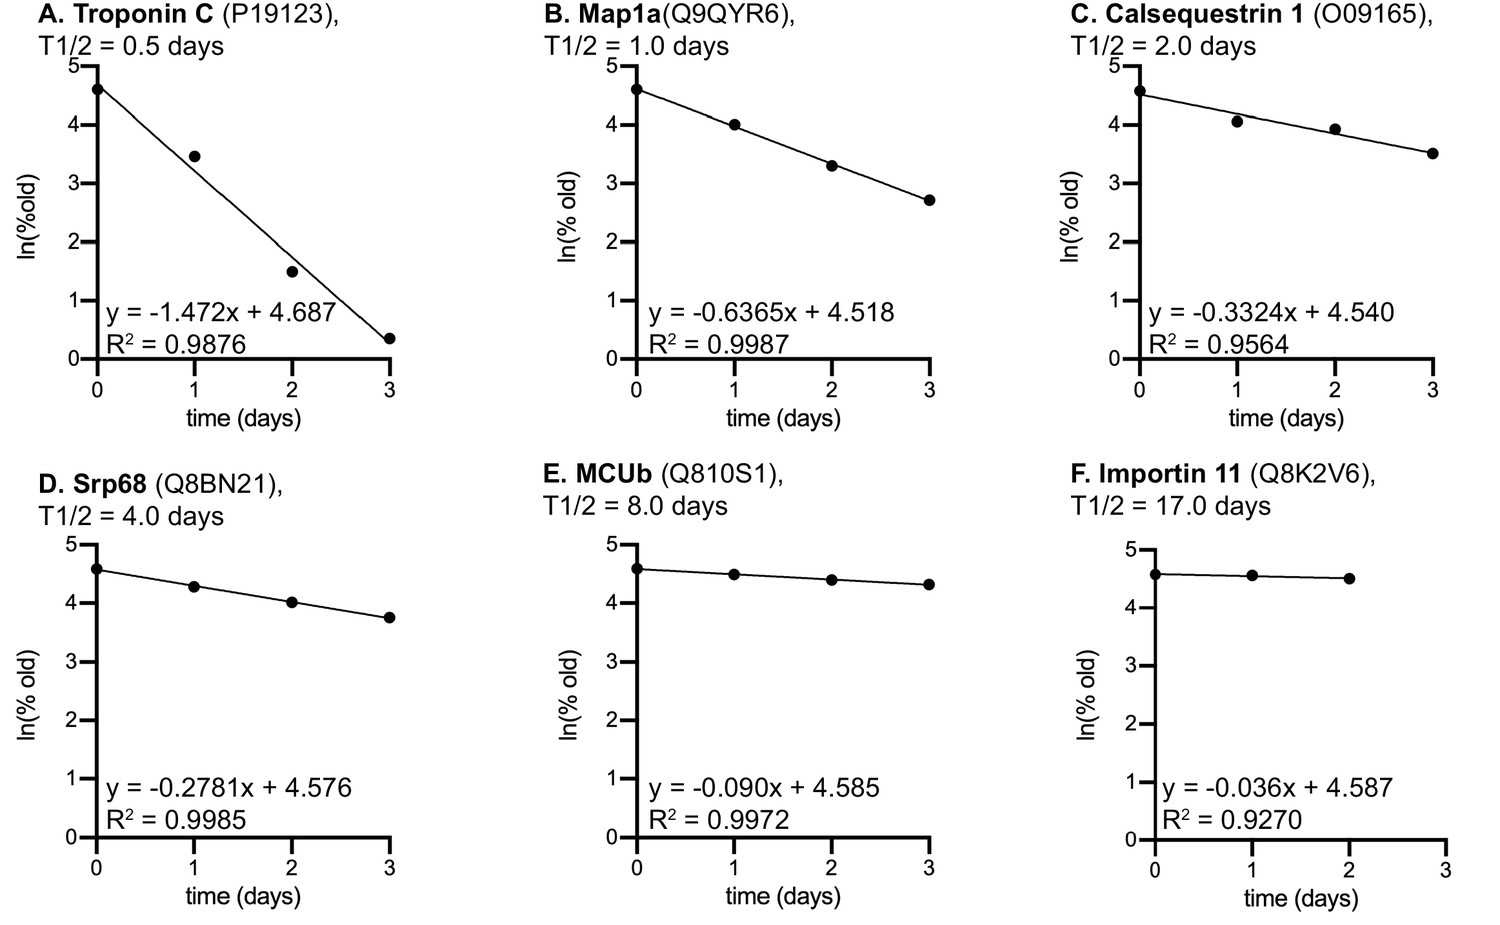
Example half life fits.
Examples of half-life fits for proteins with predicted half-lives of 0.5 days (A), 1 day (B), 2 days (C), 4 days (D), 8 days (E), and 17 days (F).
Figure 2 with 1 supplement
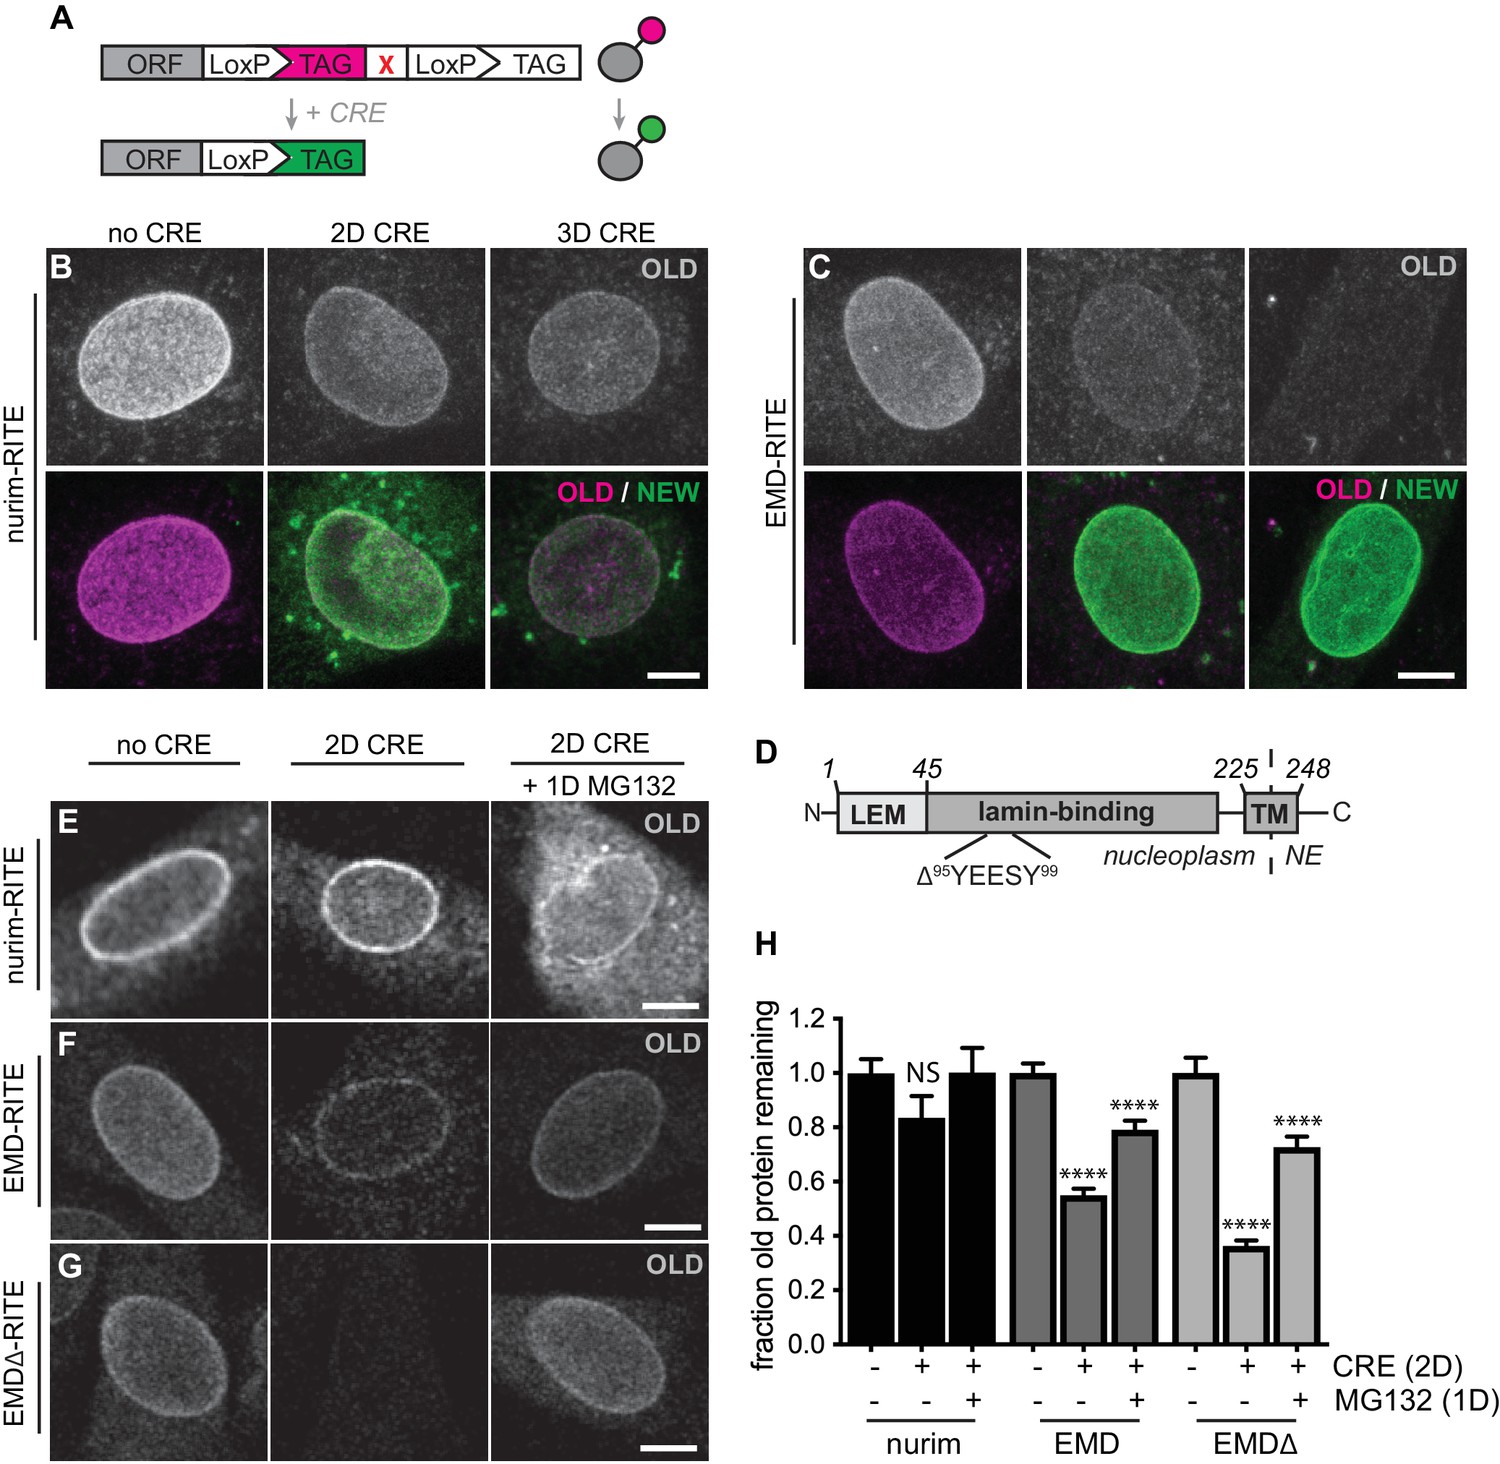
RITE analysis of INM proteins enables visualization of proteasome-dependent turnover.
RITE analysis of INM proteins corroborates protein turnover determined by proteomics. (A) Schematic of recombination-induced tag exchange (RITE) expression cassette for visualizing protein turnover using Cre recombinase-mediated tag switching. (B-C) RITE timecourses of nurim-RITE (B) and EMD-RITE (C) in quiescent C2C12 cells. Maximum intensity projections of confocal z-series shown. (D) Diagram of emerin domain organization and position of EDMD-linked deletion mutant (EMDΔ95-99) within the lamin-binding domain. (E-G) RITE timecourses of nurim-RITE (E), EMD-RITE (F), and EMDΔ-RITE (G) with or without 1 day of cotreatment with the proteasome inhibitor MG132 (right panels). Single confocal z-slices shown. (H) Quantification of normalized intensity of old NE-localized RITE-tagged protein in maximum intensity projections of confocal z series acquired across the conditions shown in (E-G). Bars indicate average values with error bars indicating SEM for N > 42 cells per condition from 2 independent experiments. **** indicates p-value < 0.0001 (by t-test) for comparison between untreated and treated conditions. Scale bar, 10 mm. See also Figure 2—figure supplement 1.
Figure 2—figure supplement 1
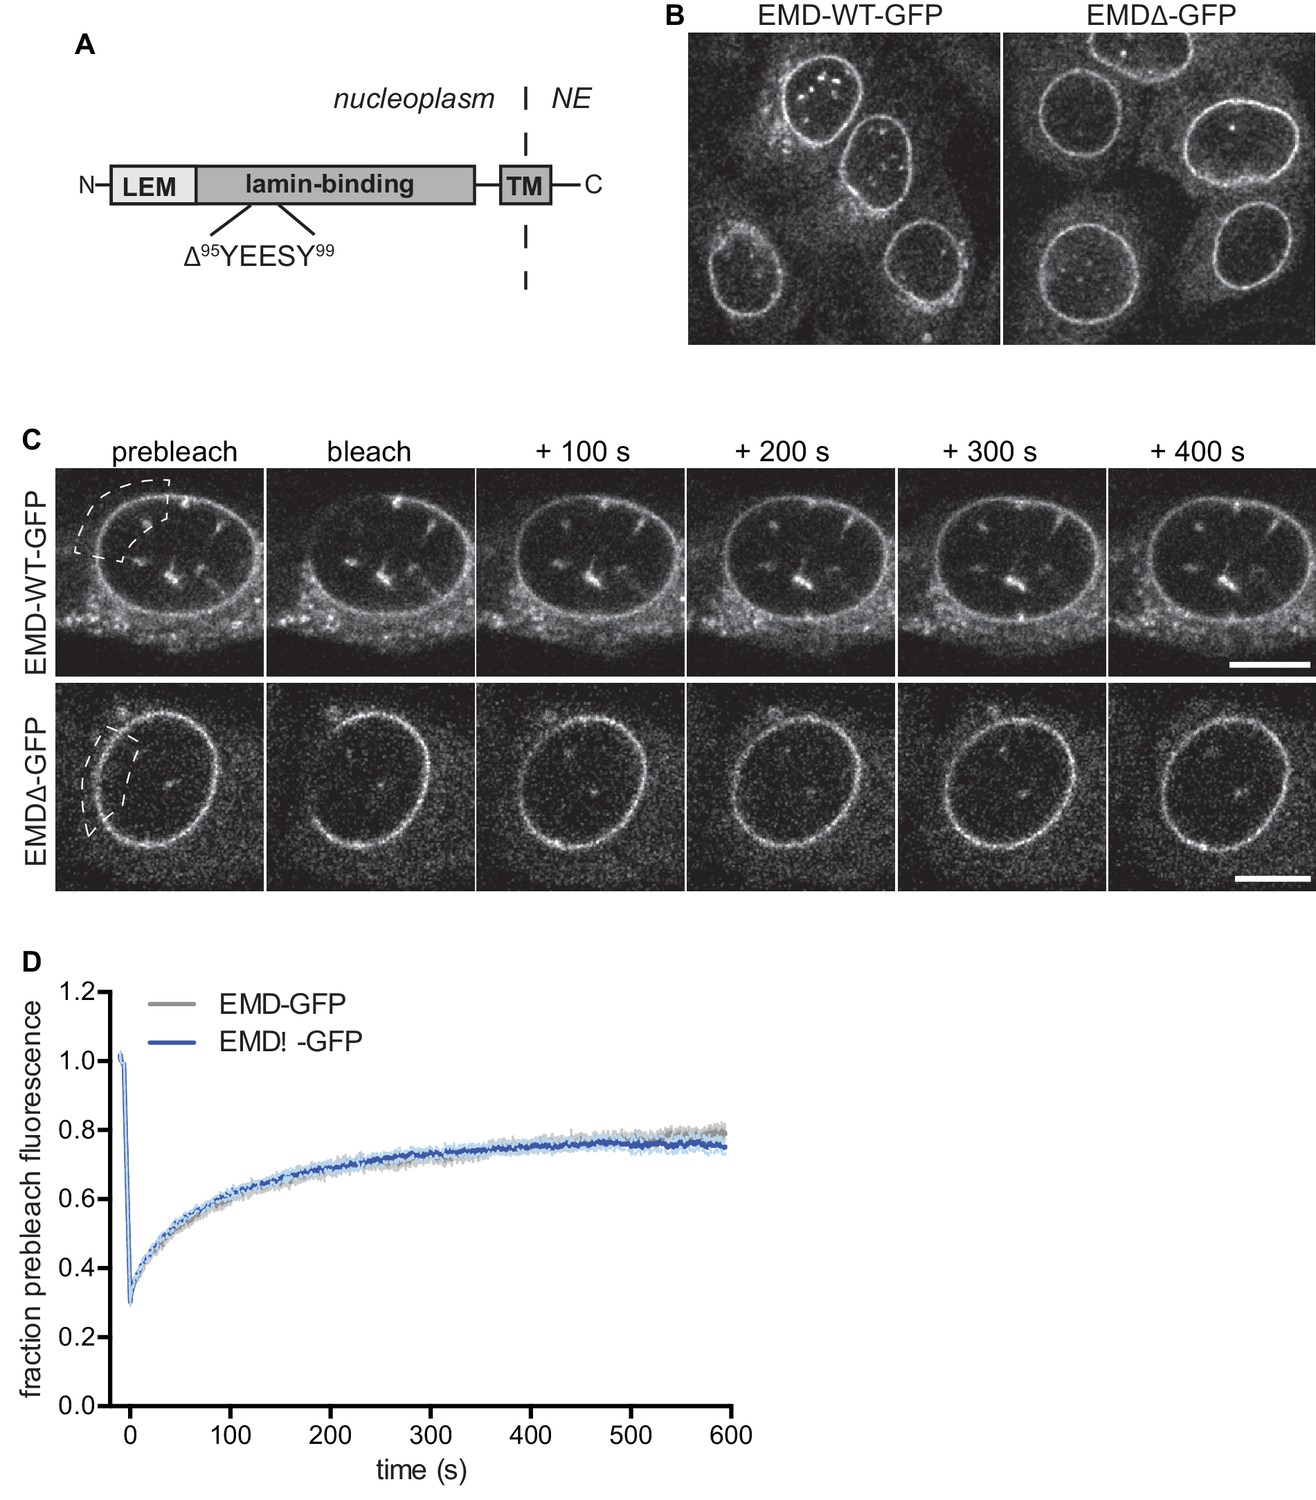
Identification of a disease-linked emerin mutant with normal NE localization.
(A) EMDΔ95–99-GFP (EMDΔ-GFP) has normal localization at the NE (B) and normal residence time at the NE, based on fluorescence recovery after photobleaching timecourse at the NE (C,D).
Figure 3 with 3 supplements
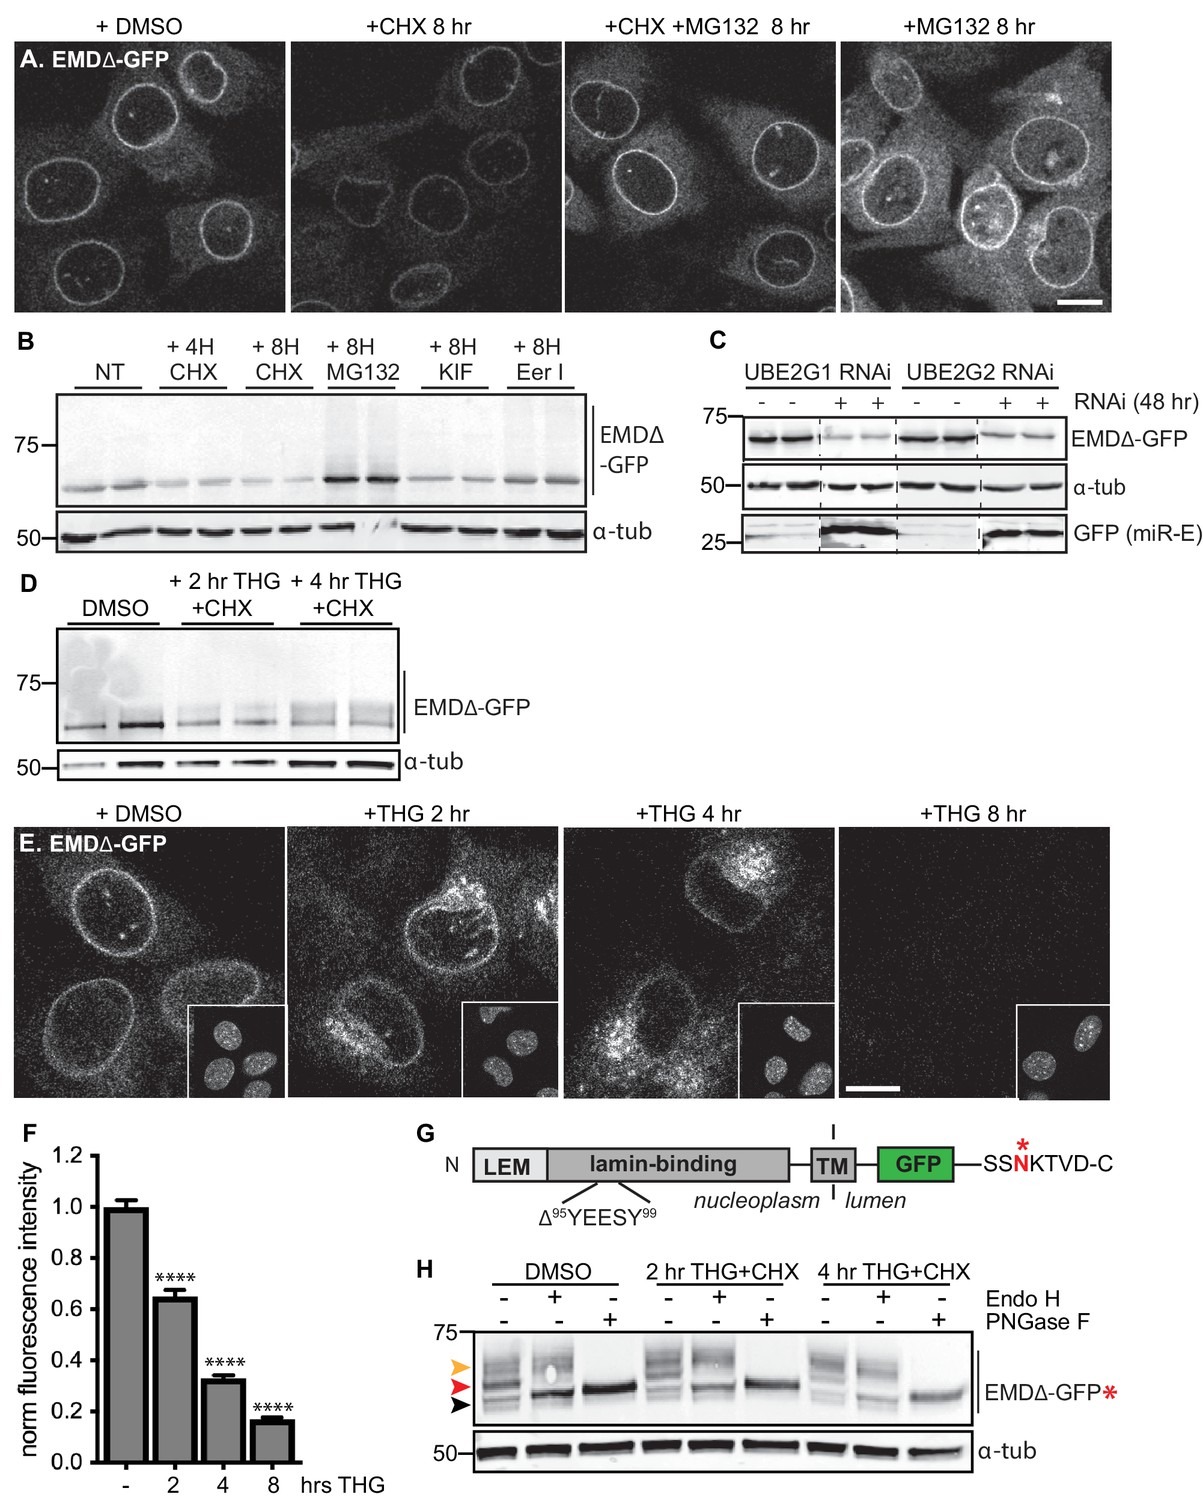
Acute stressors destabilize mutant emerin protein levels.
(A) C2C12 cells stably expressing EMDΔ-GFP and treated with DMSO vehicle control, CHX alone, CHX and MG132, or MG132 alone for 8 hours. All images were acquired using the same laser power and detector gain settings. Single confocal z slices shown. (B) Western blot analysis of protein levels in C2C12 cells stably expressing EMDΔ-GFP and treated with DMSO vehicle, the translation inhibitor CHX, the proteasome inhibitor MG132, the p97 ATPase inhibitor eeyarestatin, or the glycosylation trimming inhibitor kifunensine for the time periods shown. a-tubulin shown as loading control. (C) Western blot analysis of U2OS cells stably expressing EMDΔ-GFP and doxycycline-inducible RNAi targeting the E2 ubiquitin ligases UBE2G1 and UBE2G2 and treated with DMSO vehicle control (-) or with doxycycline (+) for 48 hours. Free GFP indicates RNAi induction. a-tubulin shown as loading control. (D) Western blot detection of EMDΔ-GFP levels in cells treated with DMSO vehicle, or co-treated with CHX and the ER stress inducer THG for the time periods shown. a-tubulin shown as loading control. (E) C2C12 cells stably expressing EMDΔ-GFP and treated with vehicle control or with THG for the time periods shown. Insets show nuclei in the same ~50 µm field of view stained with Hoechst. All images acquired using the same laser power and detector gain settings; single confocal z slices shown. (F) Quantification of total NE-localized GFP fluorescence in maximum intensity projections of confocal z slices acquired across the conditions shown in (E) for N > 410 cells per condition. (G) Diagram of emerin domain organization and the sequence of an inserted C-terminal glycosylation sequence derived from the opsin protein, with glycosylation acceptor site marked (*). (H) Analysis of EMDΔ-GFP* glycosylation state in cells subjected to treatment with DMSO vehicle control or CHX and THG cotreatments for the times indicated. Red arrowhead indicates EndoH-sensitive glycosylated state of EMDΔ-GFP*; orange arrowhead indicates EndoH-resistant states of EMDΔ-GFP*; black arrowhead indicates deglycosylated EMDΔ-GFP*. a-tubulin shown as loading control. Numbers to left of blots indicate molecular weights in kDa. Scale bars in micrographs indicate 10 mm. See also Figure 3 – figure supplement 1, 2, and 3.
Figure 3—figure supplement 1
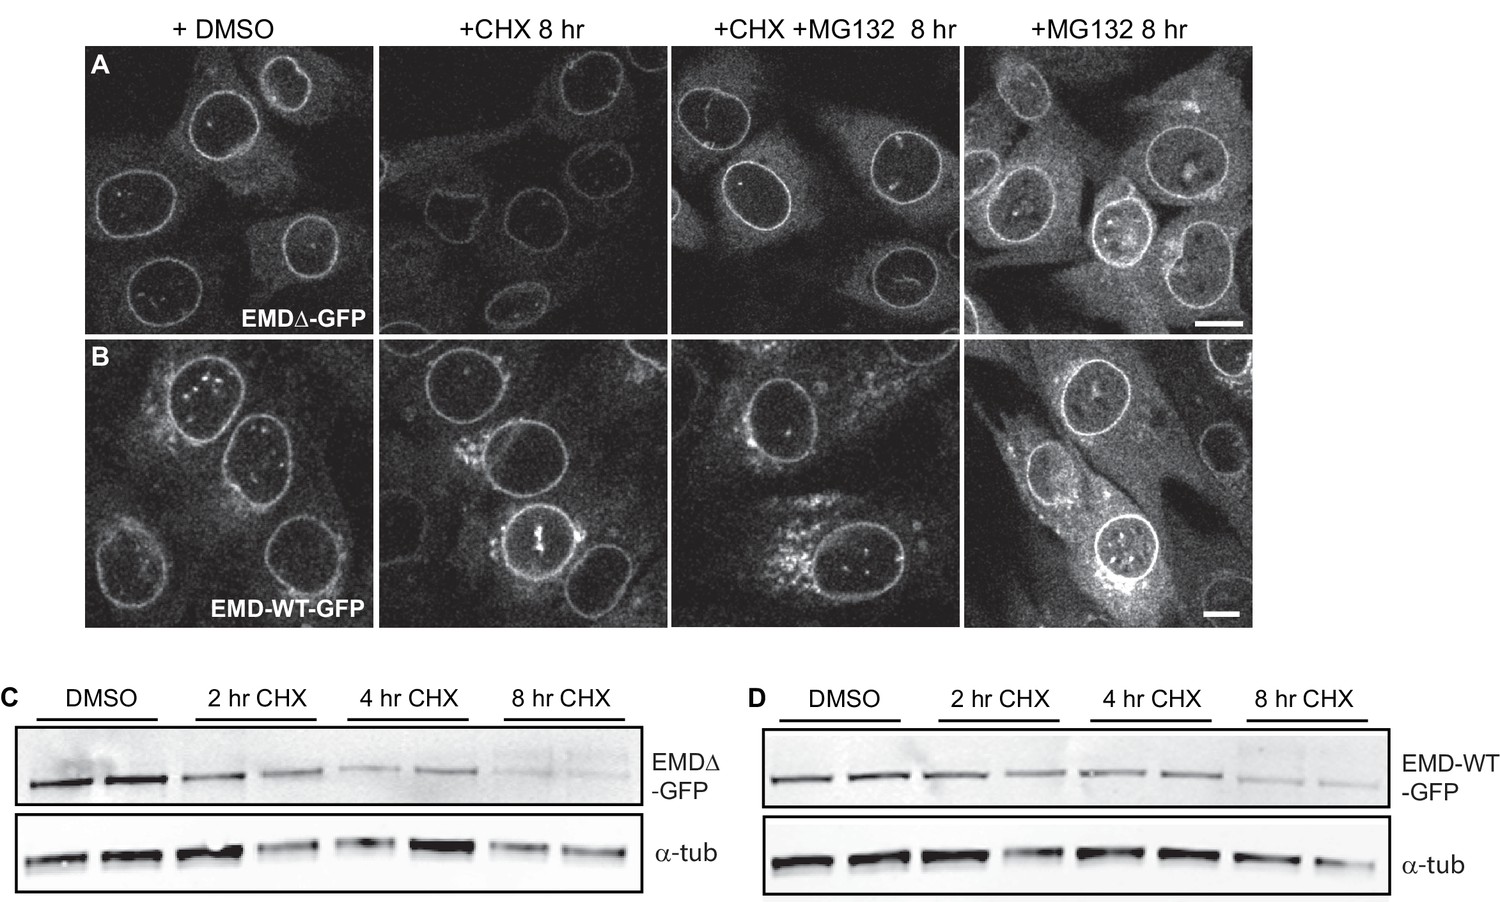
Localization and stability of a disease-linked emerin variant.
(A–B) C2C12 cells stably expressing EMDΔ-GFP (A) or EMD-WT-GFP (B) and treated with DMSO vehicle control, CHX alone, CHX and MG132, or MG132 alone for 8 hr. All images were acquired using the same laser power and detector gain settings. Single confocal z slices shown. Scale bar, 10 μm. (C–D) Western blot analysis of EMDΔ-GFP (C) or EMD-WT-GFP (D) protein levels after treatment with CHX for the indicates times.
Figure 3—figure supplement 2
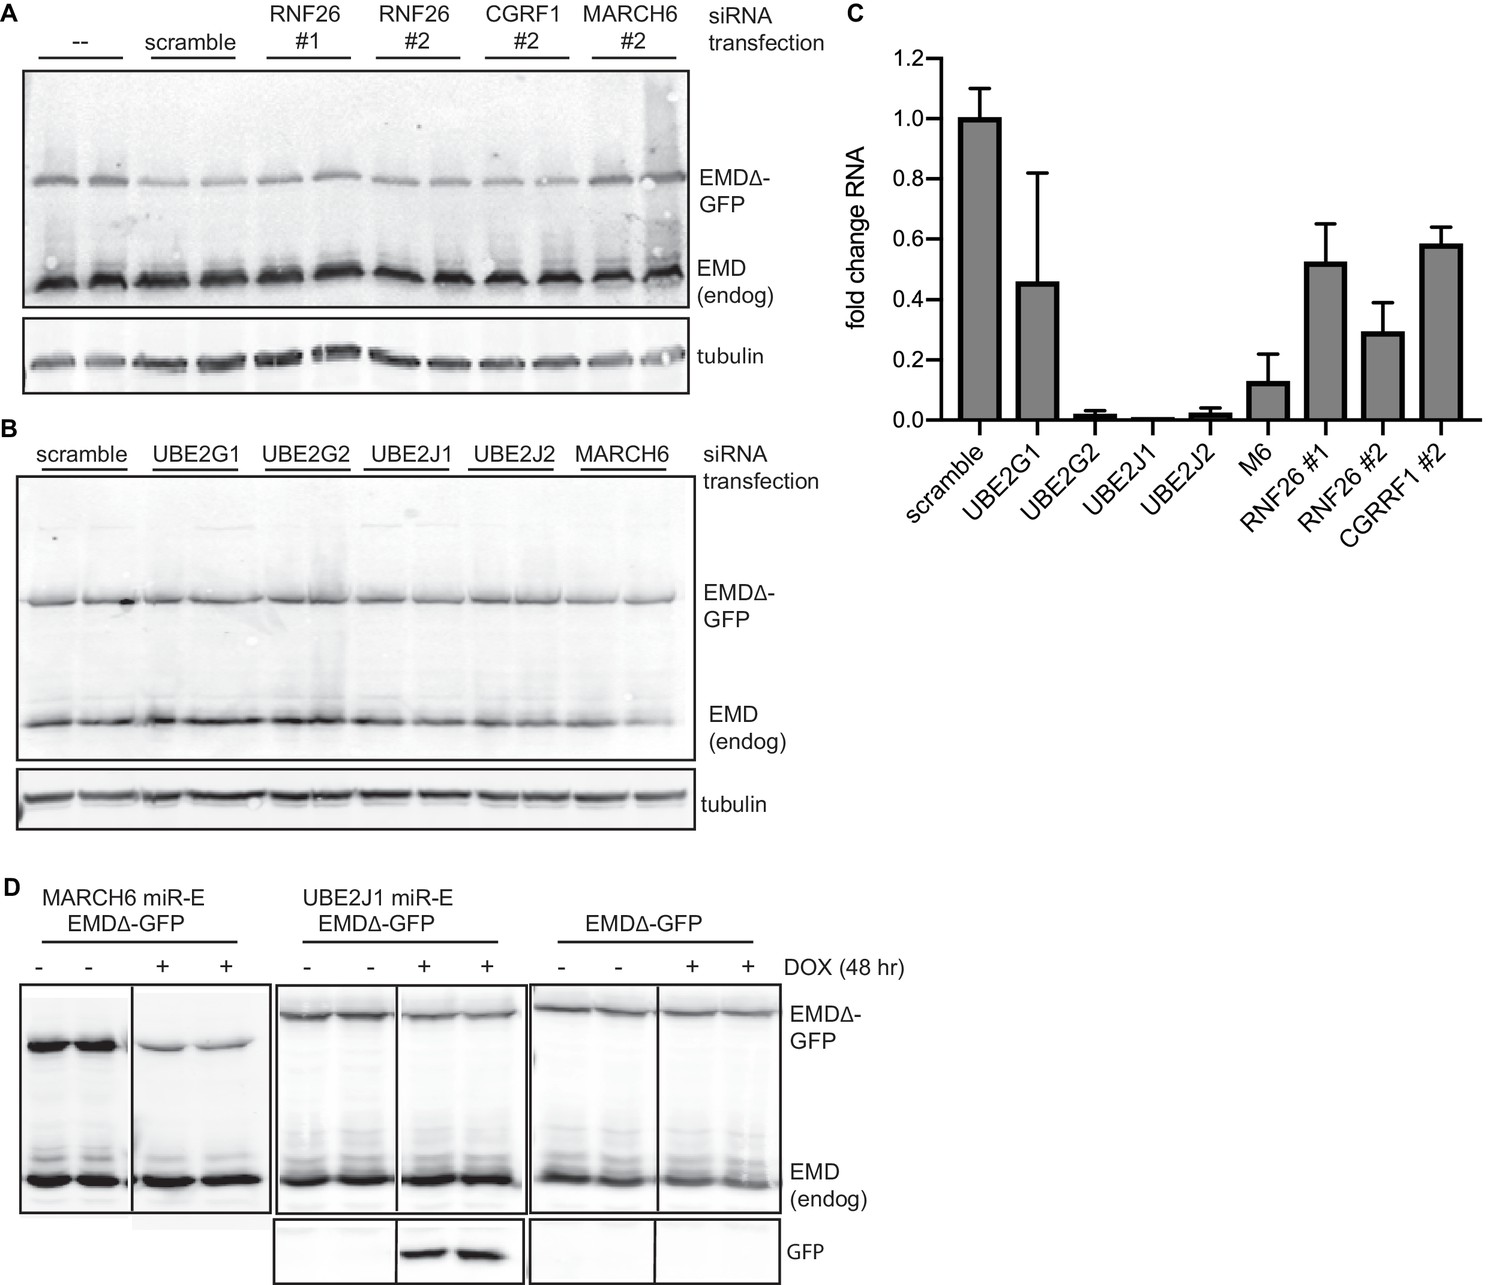
siRNA-mediated E2 or E3 ubiquitin ligase knockdowns do not stabilize EMDΔ-GFP.
(A–B) EMDΔ-GFP protein levels do not change in C2C12 cells stably expressing EMDΔ-GFP and transfected in duplicate with 50 nM RNAi targeting the E3 ubiquitin ligases Rnf26, CGRRF1, MARCH6, or a scrambled control (A), or targeting the E2 ubiquitin conjugating enzymes UBE2G1, UBE2G2, UBE2J1, and UBE2J2, or MARCH6 (B). (C) qPCR quantification of RNAi knockdown efficiency for conditions shown in (A–B). (D) EMDΔ-GFP protein levels either decrease or do not change in U2OS cells stably expressing EMDΔ-GFP and induced to express a miR-E RNAi cassette targeting the E3 ubiquitin ligase MARCH6 or the E2 ubiquitin conjugating enzyme UBE2J1 for 48 hr. Free GFP is also expressed from this cassette and indicates RNAi expression. miR-E RNAis used were from a validated set described in Knott et al. (2014).
Figure 3—figure supplement 3
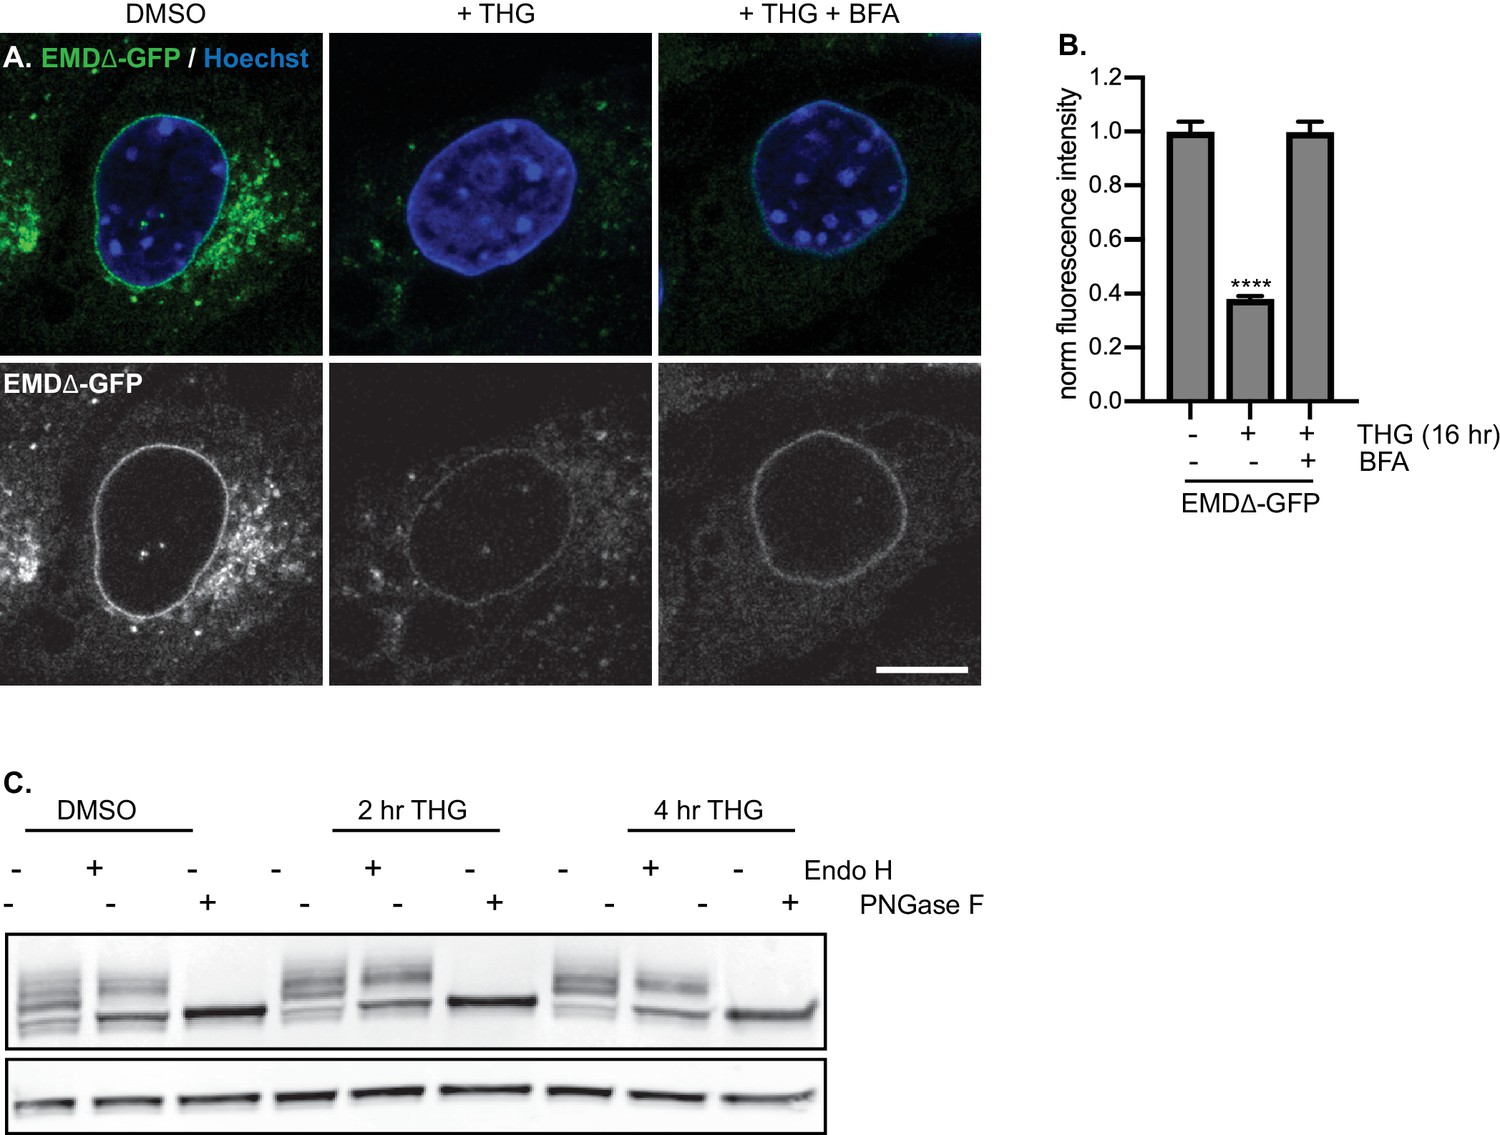
Glycosylation reporter variants are destabilized by ER stress and recovered by BFA treatment.
Glycosylation reporter variant of EMDΔ-GFP localizes normally to the NE and responds to ER stress induced by THG and secretory pathway disruption caused by BFA (A–B). (C) Pattern of glycosylation modifications in DMSO vehicle control treated cells or cells treated with THG for 2–4 hr. A larger proportion of EMDΔ-GFP becomes Endo H-resistant during acute ER stress.
Figure 4 with 1 supplement

Stress-induced clearance of mutant emerin from the ER and NE involves the secretory pathway.
(A-C) Representative confocal slices of cells stably expressing EMDΔ-GFP, treated with DMSO or THG for the indicated times and costained for giantin to mark the Golgi (magenta). All images were acquired using the same laser power and detector gain settings. (A’-C’) Are contrast-adjusted to show relative levels of EMDΔ-GFP in NE and Golgi. Dotted lines mark positions of linescans in (A’’-C’’). (D) Quantification of GFP fluorescence intensity abundance ratio in Golgi versus NE in single, non-contrast-adjusted z slices over THG treatment timecourse. Columns indicate average with error bars indicating SEM for N > 37 cells from two independent experiments. **** indicates p-value<0.0001 compared to untreated (by t-test). (E-F) Representative confocal slices of cells stably expressing EMDΔ-GFP (F) after 16 hr of treatment with DMSO vehicle control, THG, BFA, or co-treatment with THG and BFA. All images were acquired using the same laser power and detector gain settings. Insets show nuclei in the same ~ 50 µm field of view stained with Hoechst. (E) Quantification of GFP fluorescence intensity at the NE in maximum intensity projections of confocal z series acquired across the conditions represented in (F). Columns indicate average with error bars indicating SEM for N > 386 cells from three independent experiments. **** indicates p-value<0.0001 compared to untreated (by t-test). Scale bars in micrographs indicate 10 μm. See also Figure 4—figure supplement 1.
Figure 4—figure supplement 1
Colocalization of emerin with the Golgi.
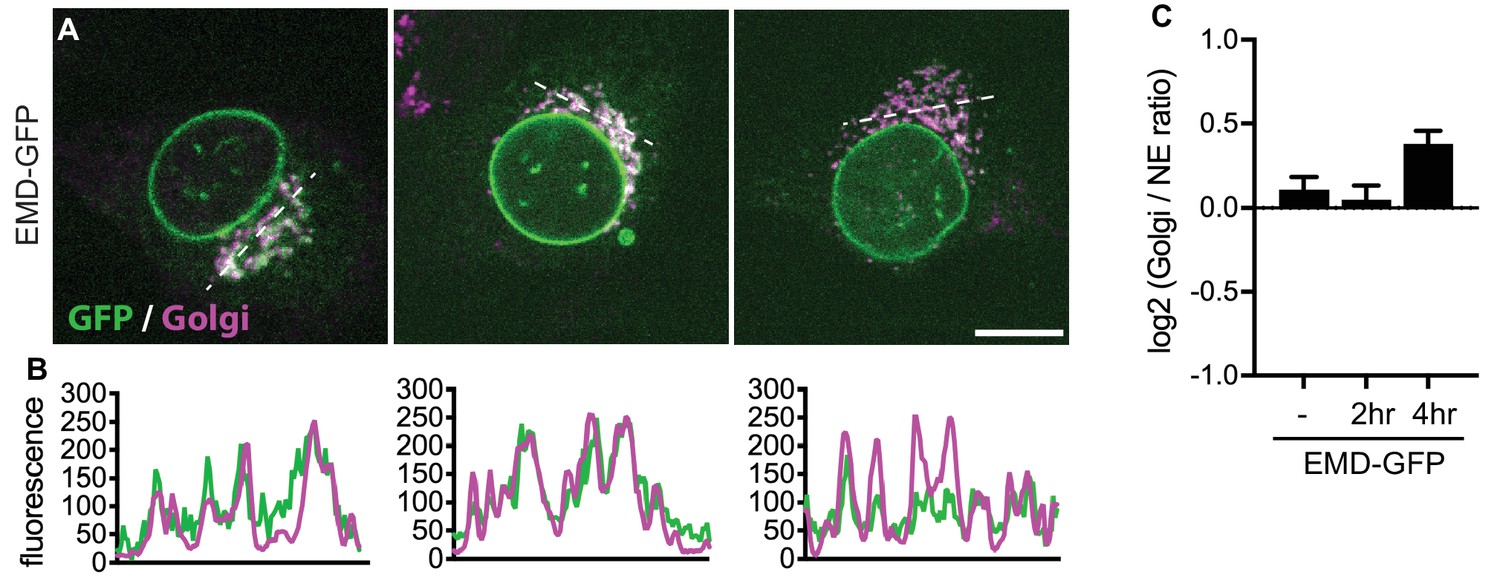
(A–B) Representative confocal slices of cells stably expressing EMD-WT-GFP, treated with DMSO or THG for the indicated times and costained for giantin to mark the Golgi (magenta). All images were acquired using the same laser power and detector gain settings. Dotted lines mark positions of linescans shown in (B). (C) Quantification of GFP fluorescence intensity abundance ratio in Golgi versus NE in single, non-contrast-adjusted z slices over THG treatment timecourse. Columns indicate average with error bars indicating SEM for N > 47 cells from two independent experiments. **** indicates p-value<0.0001. Scale bars in micrographs indicate 10 μm.
Figure 5
Mutant emerin trafficking is dependent on lysosomal but not autophagosomal function.
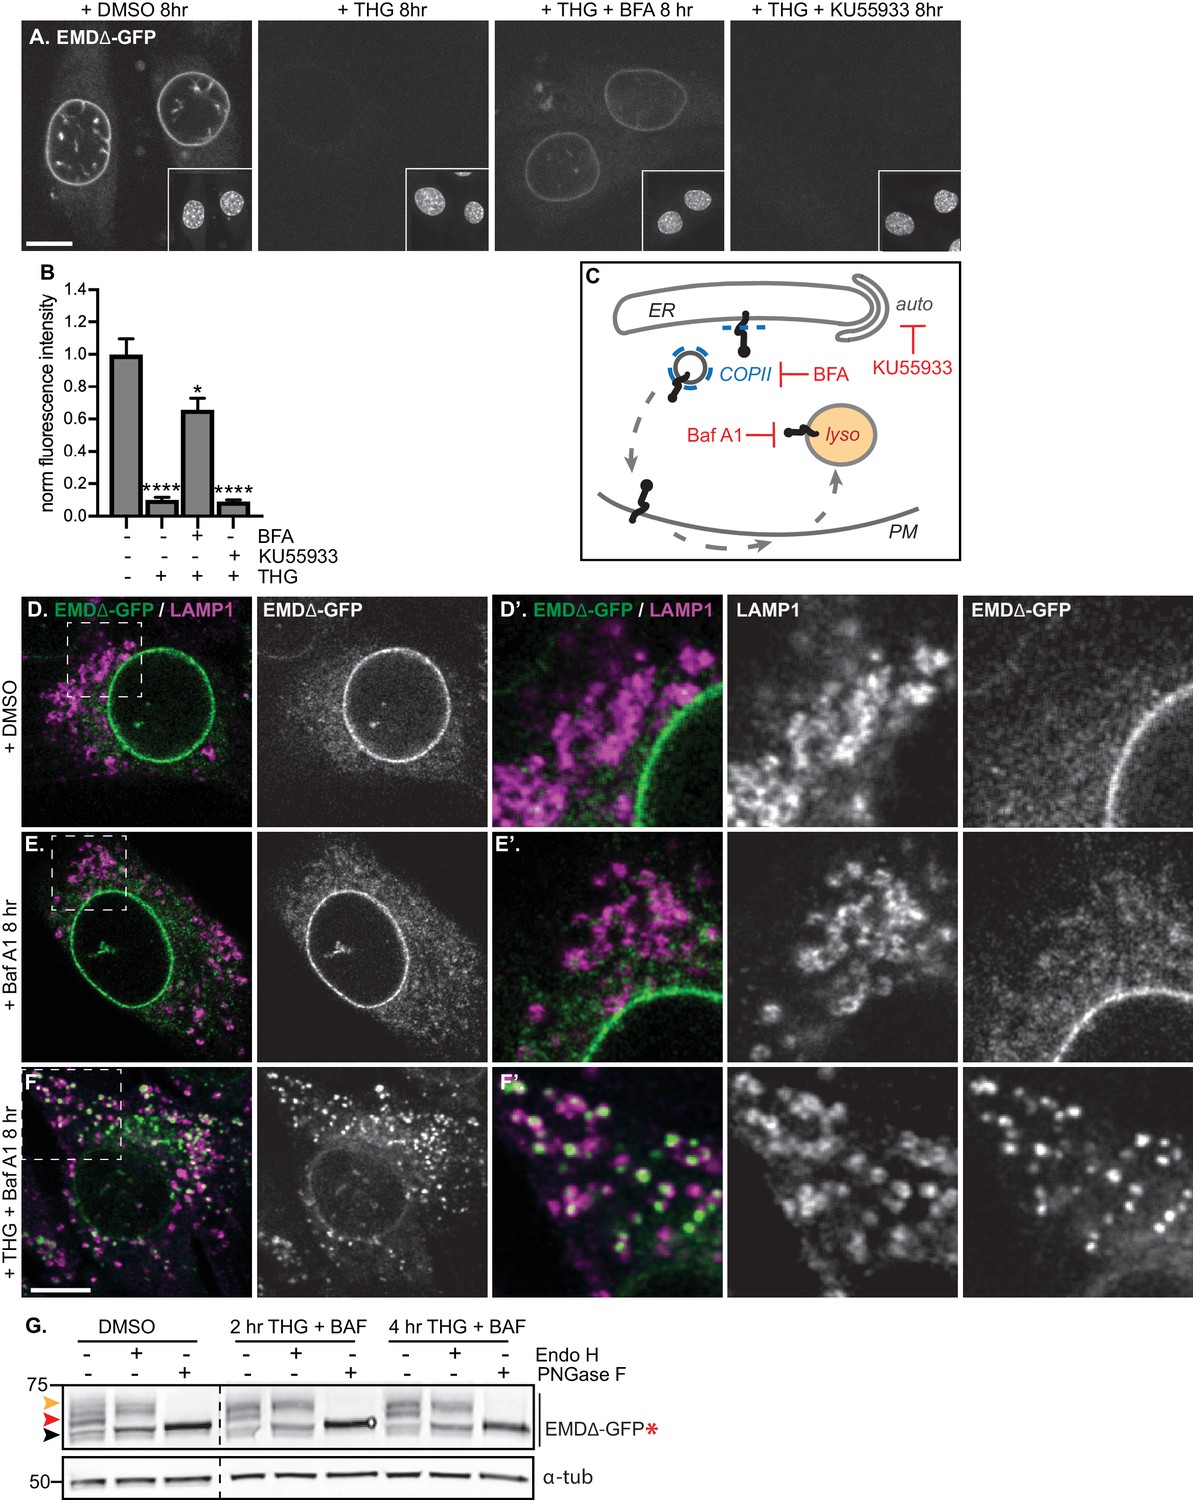
(A) Representative confocal slices of cells stably expressing EMDΔ-GFP after 8 hr of treatment with DMSO vehicle control, THG, co-treatment with THG and BFA, or co-treatment with THG and KU55933. Insets show nuclei in the same field of view stained with Hoechst. (B) Quantification of NE-localized GFP fluorescence intensity in maximum intensity projections of confocal z series acquired across the conditions shown in (A). Columns indicate average and error bars indicate SEM for N > 56 cells from three independent experiments. **** indicates p-value<0.0001 compared to untreated (by t-test). (C) Diagram of processes perturbed by KU55933, BFA, and Baf A1 treatment. (D-F) Representative confocal slices of C2C12 cells stably expressing EMDΔ-GFP and costained for LAMP1 after treatment with DMSO vehicle control (D), Baf A1 (E), or co-treatment with THG and Baf A1 (F) for the indicated times. (D’-F’) Insets show GFP-LAMP1 colocalization within ~ 15 µm field of view demarcated by dashed rectangles in (D-F). (G) Analysis of EMDΔ-GFP* glycosylation state in cells subjected to treatment with DMSO vehicle control or THG and Baf A1 cotreatments for the times indicated. Red arrowhead indicates EndoH-sensitive glycosylated state of EMDΔ-GFP*; orange arrowhead indicates EndoH-resistant states of EMDΔ-GFP*; black arrowhead indicates deglycosylated EMDΔ-GFP*. α-tubulin shown as loading control. Numbers to left of blots indicate molecular weights in kDa. Scale bars in micrographs indicate 10 μm.
Figure 6 with 1 supplement
Mutant emerin traffics through the plasma membrane upon ER stress.
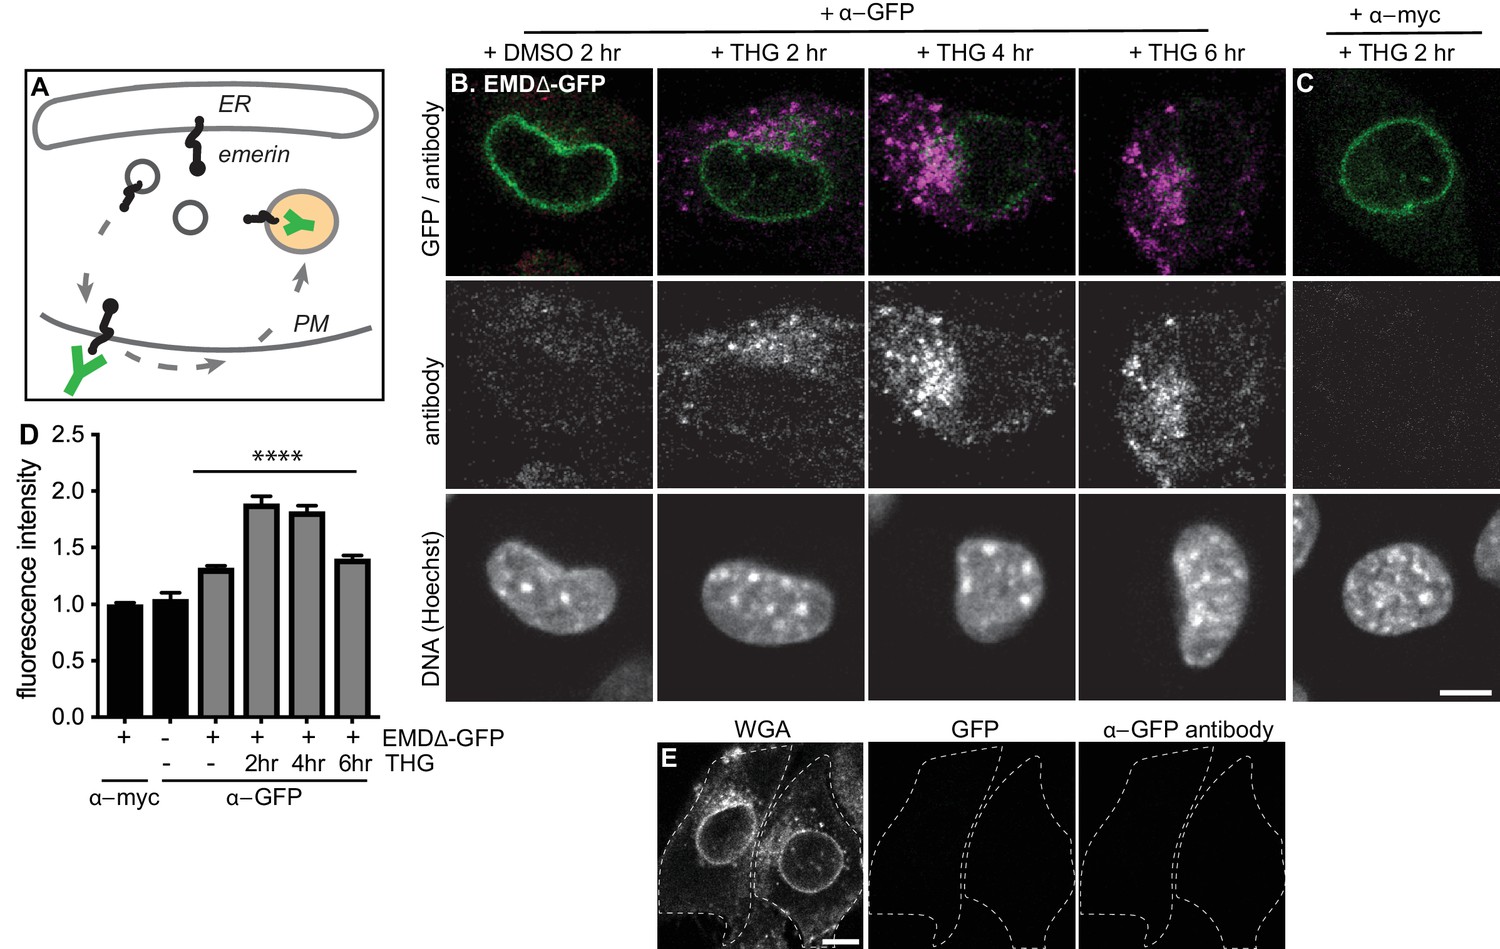
(A) Schematic of antibody uptake assay experimental design. If emerin accesses the plasma membrane (PM), it will be detected by anti-GFP antibody (green), which will bind the surface-exposed GFP tag. (B) Uptake of anti-GFP antibody (magenta) by cells stably expressing EMDΔ-GFP and treated with DMSO vehicle control or THG for 2, 4, or 6 hours. Cells were incubated with anti-GFP antibody for the final hour of these treatment periods before fixation and imaging. (C) Control demonstrating lack of uptake of anti-myc antibody by cells stably expressing EMDΔ-GFP and treated with THG for 2 hours. (D) Quantification of internalized antibody signal in EMDΔ-GFP expressing cells. Columns indicate average and error bars indicate SEM for N > 235 cells from 3 independent experiments. **** indicates p-value < 0.0001 (t-test) compared to untreated. (E) Control demonstrating lack of uptake of anti-GFP antibody by untreated C2C12 cells that do not express a GFP fusion protein. WGA is used to define cell boundaries. All images were acquired using the same laser power and detector gain settings. Scale bars in micrographs indicate 10 µm. See also Figure 6—figure supplement 1.
Figure 6—figure supplement 1
Access of emerin to the plasma membrane.
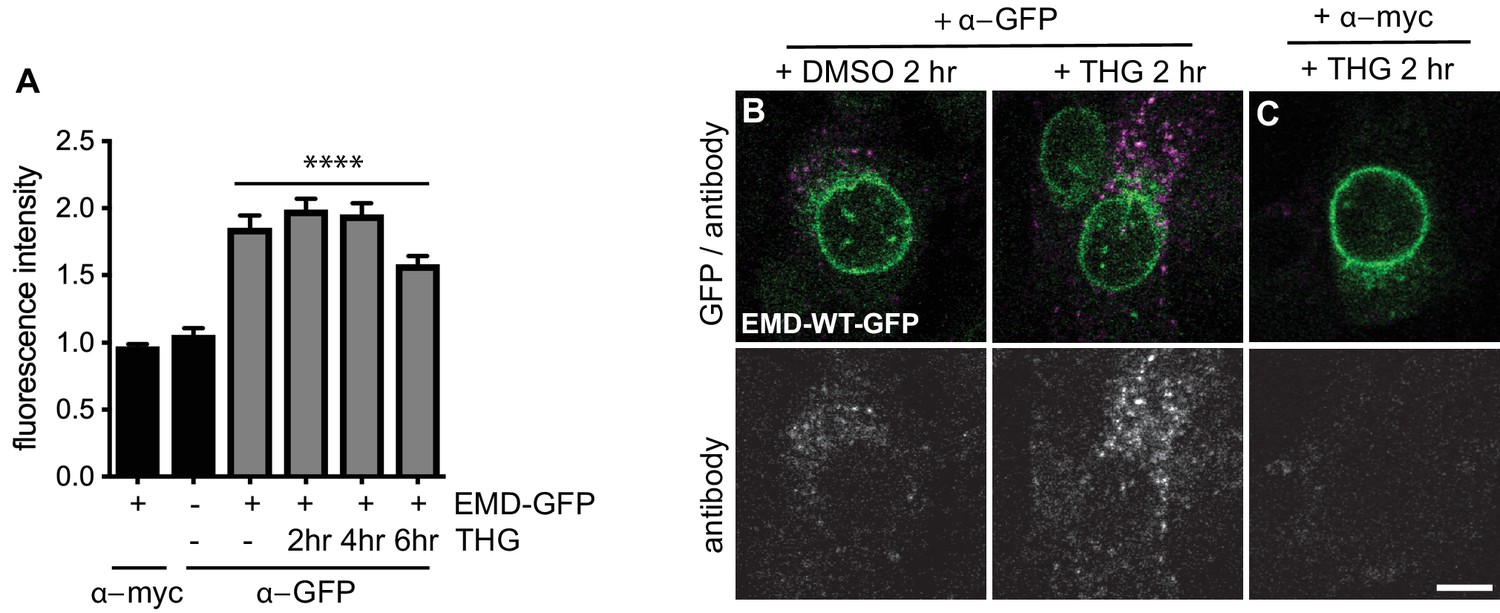
(A) Uptake of anti-GFP antibody (magenta) by cells stably expressing EMD-WT-GFP and treated with DMSO vehicle control or THG for the indicated times. Cells were incubated with anti-GFP antibody for the final hour of the treatment period before fixation and imaging. (B) control demonstrating lack of uptake of anti-myc antibody by cells stably expressing EMD-WT-GFP and treated with THG for 2 hr. (D) Quantification of internalized antibody signal in EMD-WT-GFP expressing cells. Columns indicate average and error bars indicate SEM for N > 66 cells from two independent experiments. **** indicates 2-value < 0.0001 (t-test) compared to untreated.
Figure 7 with 1 supplement
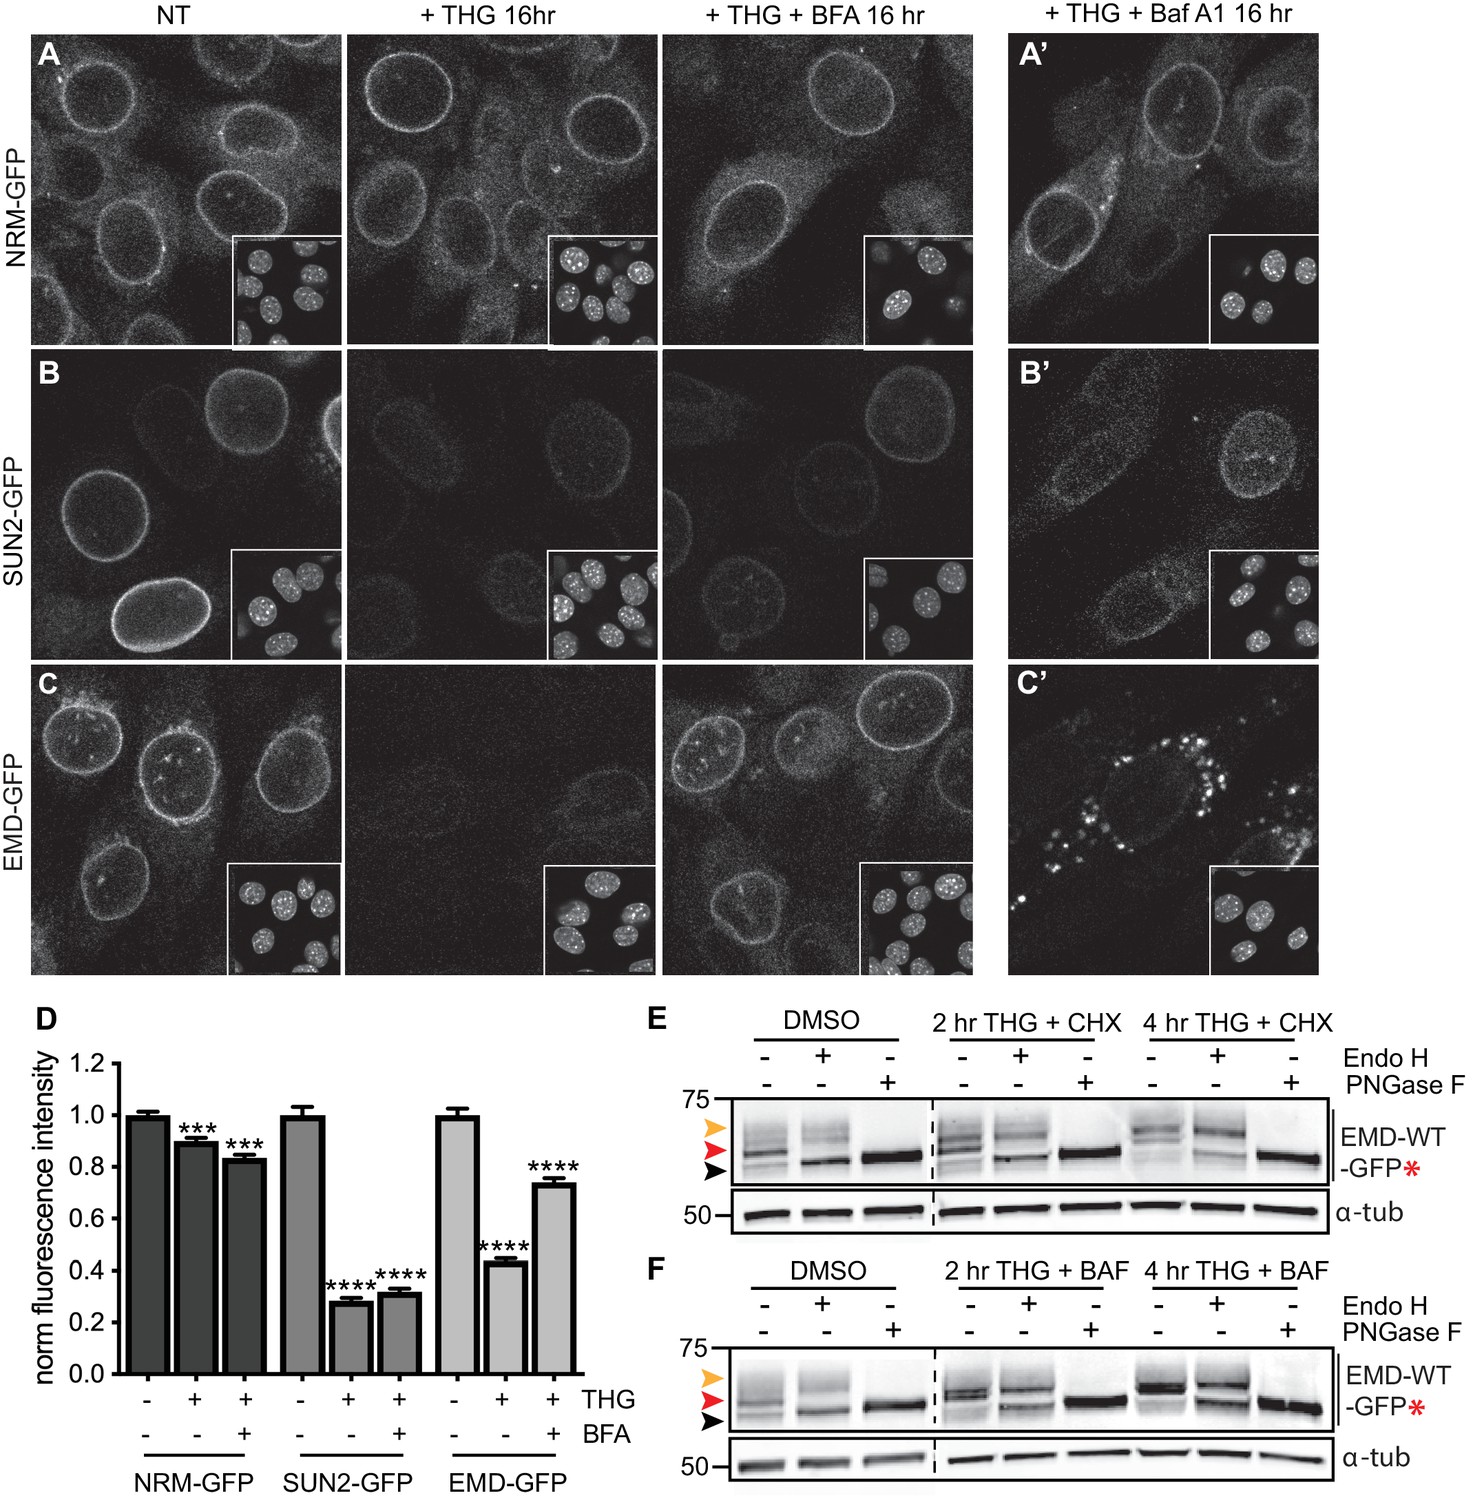
Emerin, but not other INM proteins, undergoes stress-dependent clearance from the NE and ER and accesses lysosomes.
(A-C) Representative confocal slices of cells stably expressing NRM-GFP (A), Sun2-GFP (B), or EMD-GFP (C) after 16 hr of treatment with DMSO vehicle control, THG, or co-treatment with THG and BFA. Insets show nuclei in the same ~ 50 µm field of view stained with Hoechst. (A’-C’) Representative confocal slices of cells co-treated with THG and Baf A1. All images were acquired using the same laser power and detector gain settings. (D) Quantification of GFP fluorescence intensity at the NE in maximum intensity projections of confocal z series acquired across conditions represented in (A-C). Columns indicate average and error bars indicate SEM for N > 690 cells from three independent experiments. **** indicates p-value<0.0001 compared to untreated (t-test). (E-F) Analysis of EMD-WT-GFP* glycosylation state in cells subjected to treatment with DMSO vehicle control or THG and CHX (E) or THG and Baf A1 (F) cotreatments for the times indicated. Red arrowhead indicates EndoH-sensitive glycosylated state of EMD-WT-GFP*; orange arrowhead indicates EndoH-resistant states of EMD-WT-GFP*; black arrowhead indicates deglycosylated EMD-WT-GFP*. α-tubulin shown as loading control. Numbers to left of blots indicate molecular weights in kDa. Scale bars in micrographs indicate 10 μm. See also Figure 7—figure supplement 1.
Figure 7—figure supplement 1
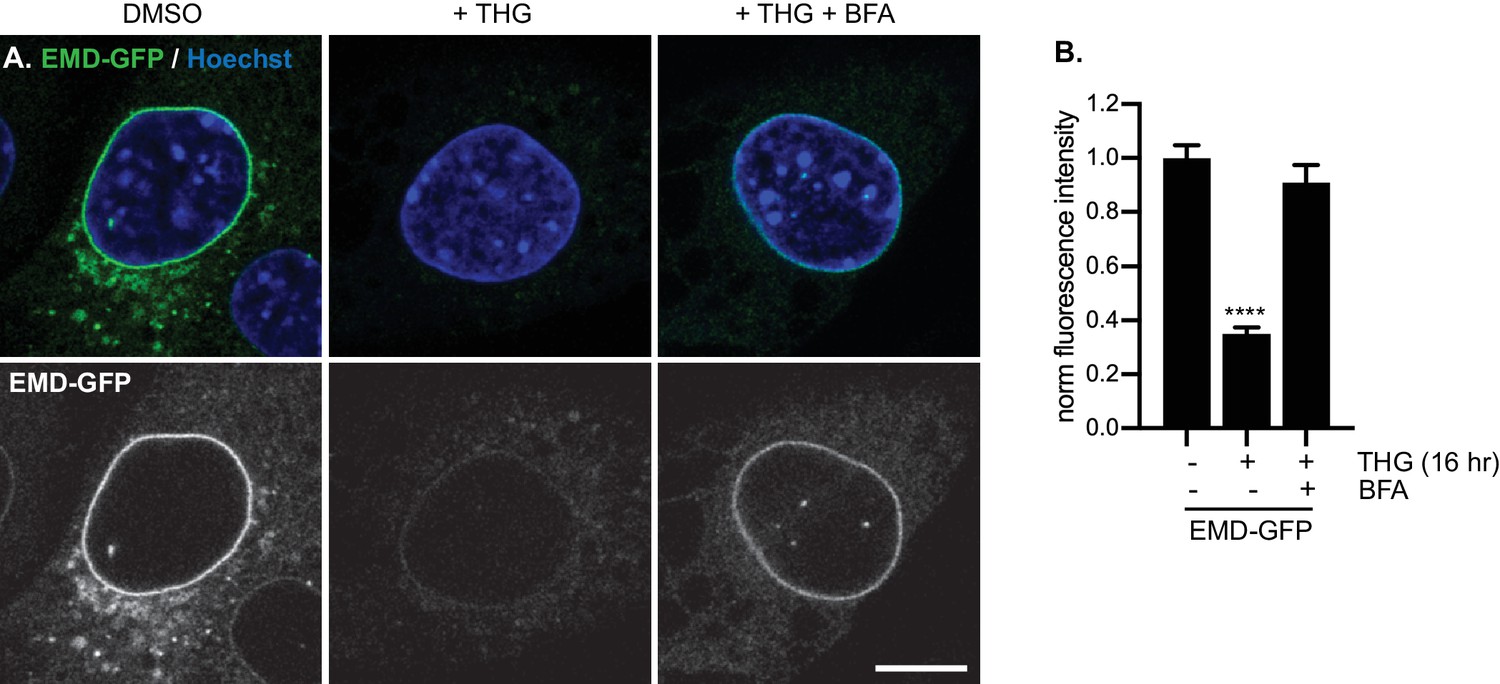
Glycosylation reporter variants are destabilized by ER stress and recovered by BFA treatment.
(A–B) Glycosylation reporter variant of EMD-WT-GFP localizes normally to the NE and responds to ER stress induced by THG and secretory pathway disruption caused by BFA.
Figure 8 with 2 supplements
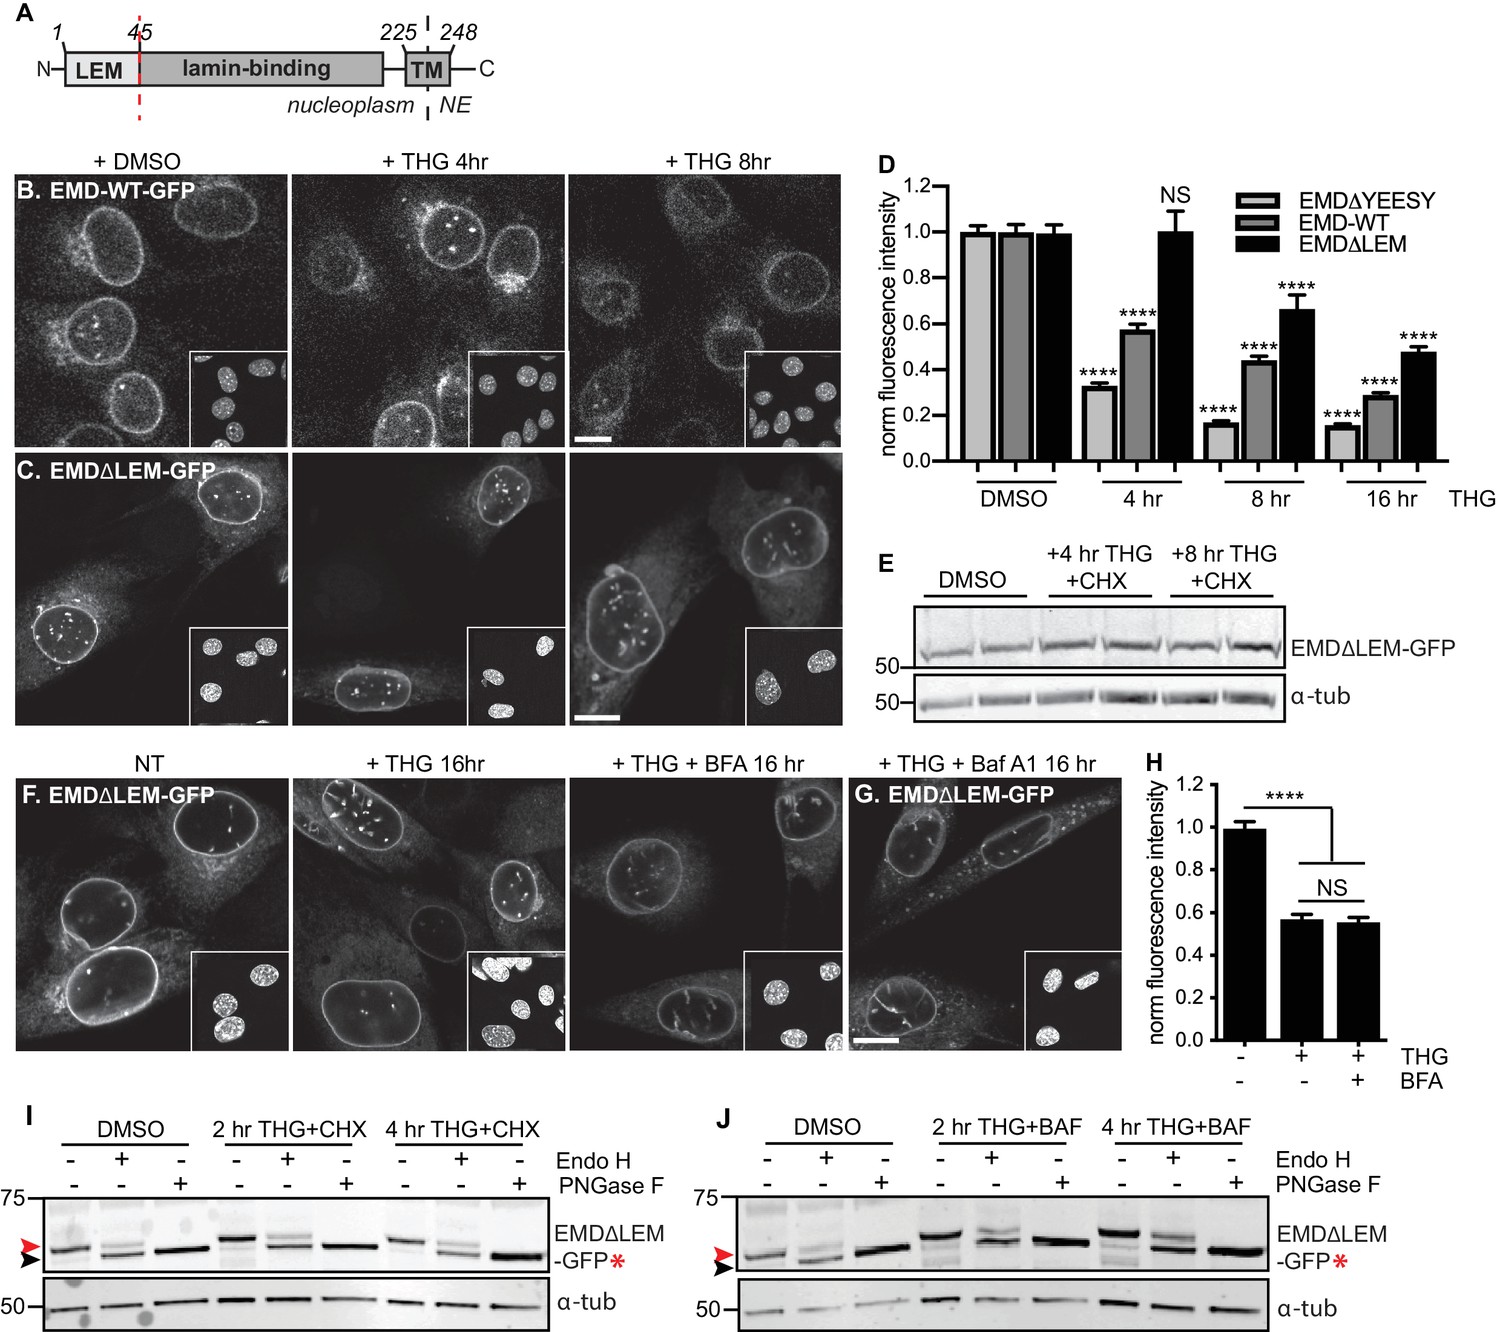
A signal within emerin’s.
LEM domain is required for stress-dependent clearance from the NE and ER (A) Diagram of emerin domain organization with N-terminal LEM domain deletion indicated (amino acids 1-45). (B-C) Representative confocal slices of C2C12 cells stably expressing EMD-WT-GFP (B) or EMDΔLEM-GFP (C) after treatment with DMSO vehicle control or THG for the indicated times. Insets show nuclei in the same ~50 µm field of view stained with Hoechst. (D) Quantification of EMDΔ95-99-GFP (as also shown in Figure 3F), EMD-WT-GFP, and EMDΔLEM-GFP fluorescence intensity at the NE in maximum intensity projections of confocal z series acquired across the timecourse shown in (B-C). Columns indicate average and error bars indicate SEM for N > 146 cells from 3 independent experiments. **** indicates p-value < 0.0001 compared to untreated (t-test). (E) Western blot of EMDΔLEM-GFP in cells treated with DMSO vehicle control or co-treated with THG and CHX for the indicated times. (F-G) Representative confocal slices of C2C12 cells stably expressing EMDΔLEM-GFP after treatment with (F) DMSO vehicle control, THG, THG + BFA, or (G) THG + Baf A1. (H) Quantification of GFP fluorescence intensity at the NE across the conditions shown in (F). Columns indicate average and error bars indicate SEM for N > 776 cells from 3 independent experiments. **** indicates p-value < 0.0001 compared to untreated (t-test). (I-J) Analysis of EMD-ΔLEM-GFP* glycosylation state in cells subjected to treatment with DMSO vehicle control or THG and CHX (I) or THG and Baf A1 (J) cotreatments for the times indicated. Red arrowhead indicates EndoH-sensitive glycosylated state of EMDΔLEM-GFP*; black arrowhead indicates deglycosylated EMDΔLEM-GFP*. a-tubulin shown as loading control. Numbers to left of blots indicate molecular weights in kDa. Scale bars in micrographs indicate 10 mm. See also Figure 8—figure supplements 1 and 2.
Figure 8—figure supplement 1
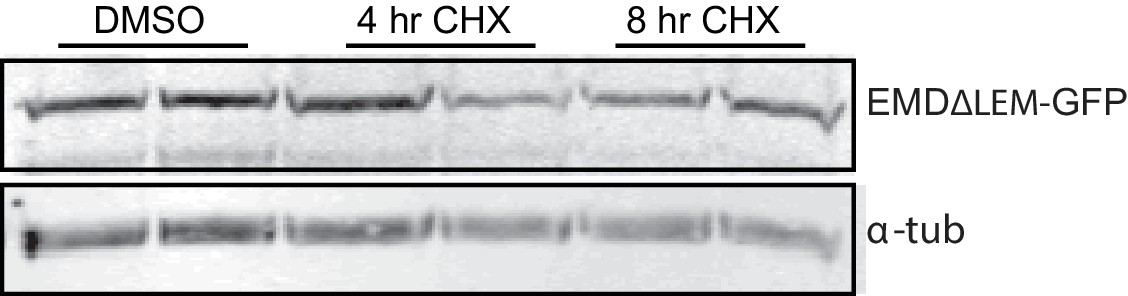
Stability of EMDΔLEM-GFP over time of cycloheximide treatment.
Western blot detection of EMDΔLEM-GFP protein levels in cells treated with DMSO vehicle control or CHX for the indicated times.
Figure 8—figure supplement 2
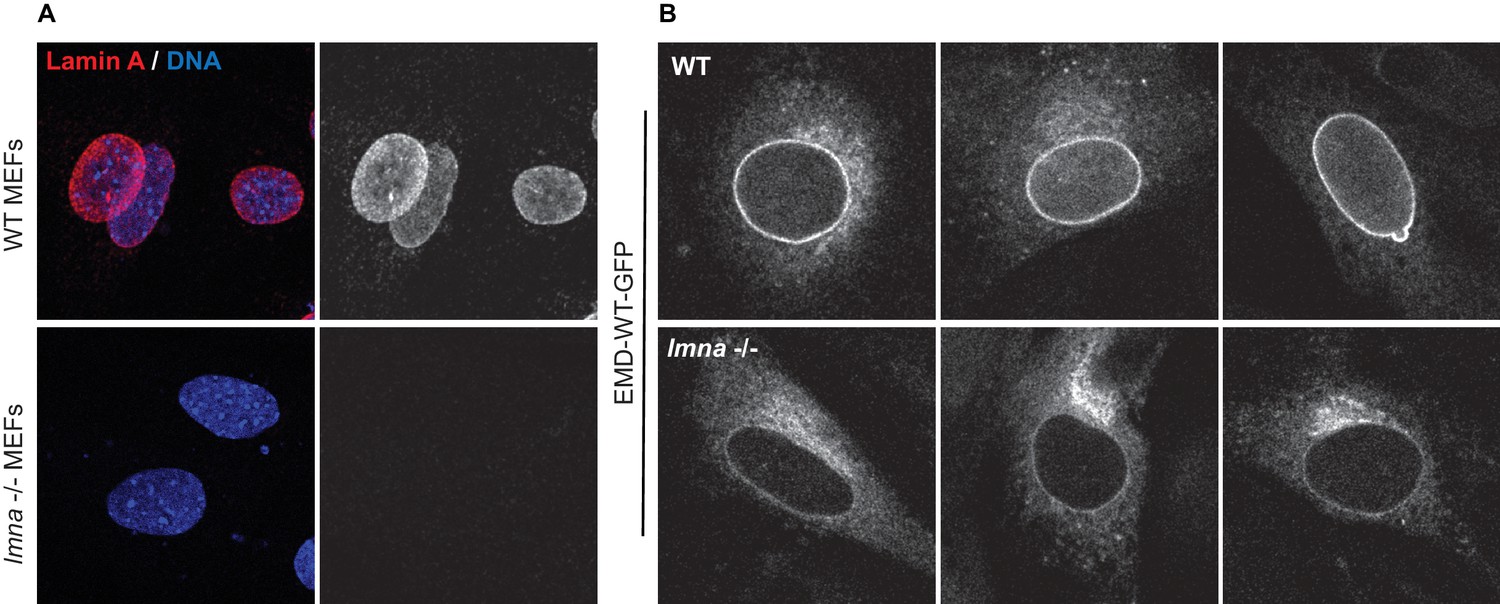
Emerin is mislocalized to the ER, but not degraded in lmna - /- MEFs.
(A) representative immunostaining of WT MEFs or of lmna - /- MEFs with lamin A antibody (red) and Hoechst (blue). (B) Representative immunofluorescence of EMD-GFP stably expressed in WT MEFs (top panel) or lmna - /- MEFs (bottom panel).
Figure 9
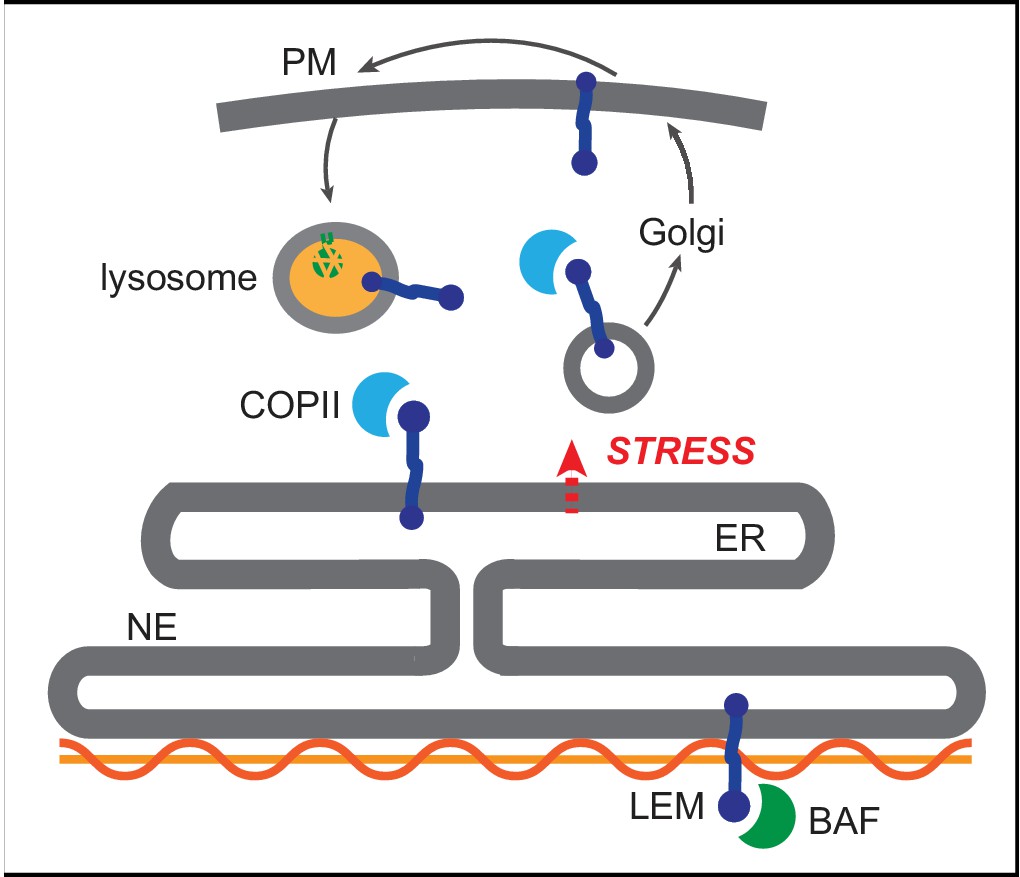
Competition model for emerin sorting via its LEM domain competitively binding to BAF or to the ER export machinery.
https://doi.org/10.7554/eLife.49796.020Tables
Key resources table
| Reagent type (species) or resource | Designation | Source or reference | Identifiers | Additional information |
|---|---|---|---|---|
| Gene (Mus musculus) | emerin | NCBI RefSeq NM_007927 | ||
| Gene (Mus musculus) | nurim | NCBI RefSeq NM_134122 | ||
| Gene (Mus musculus) | Sun2 | NCBI RefSeq NM_001205346 | ||
| Cell line (Mus musculus) | C2C12 | ATCC | CRL-1772 | |
| Cell line (Homo sapiens) | U-2-OS | ATCC | HTB-96 | |
| Recombinant DNA reagent (plasmid) | pQCXIB vector | Campeau et al. (2009) Addgene | Retroviral construct for stable expression | |
| Recombinant DNA reagent (plasmid) | Myc/FLAG RITE vector | Toyama et al. (2019) | Lentiviral contruct for stable expression of RITE-tagged protein | |
| Recombinant DNA reagent (plasmid) | pQCXIB emerin-GFP | This paper | Retroviral construct for stable expression | |
| Recombinant DNA reagent (plasmid) | pQCXIB emerin-D95-99-GFP | This paper | Retroviral construct for stable expression | |
| Recombinant DNA reagent (plasmid) | pQCXIB emerin-DLEM-GFP | This paper | Retroviral construct for stable expression | |
| Recombinant DNA reagent (plasmid) | pQCXIB emerin-GFP-SSNKTVD | This paper | Retroviral construct for stable expression | |
| Recombinant DNA reagent (plasmid) | pQCXIB emerin-Δ95–99-GFP-SSNKTVD | This paper | Retroviral construct for stable expression | |
| Recombinant DNA reagent (plasmid) | pQCXIB emerin-ΔLEM-GFP-SSNKTVD | This paper | Retroviral construct for stable expression | |
| Recombinant DNA reagent (plasmid) | pQCXIB Sun2-GFP | This paper | Retroviral construct for stable expression | |
| Recombinant DNA reagent (plasmid) | pQCXIB nurim-GFP | This paper | Retroviral construct for stable expression | |
| Recombinant DNA reagent (plasmid) | Emerin-RITE | This paper | Lentiviral contruct for stable expression of RITE-tagged protein | |
| Recombinant DNA reagent (plasmid) | Nurim-RITE | This paper | Lentiviral contruct for stable expression of RITE-tagged protein | |
| Recombinant DNA reagent (plasmid) | Emerin-Δ95–99-RITE | This paper | Lentiviral contruct for stable expression of RITE-tagged protein | |
| Antibody | Rabbit polyclonal anti-emerin | Santa Cruz Biotechnology | Sc-15378 | WB (1:1000) |
| Antibody | GFP | Abcam | ab290 | Ab uptake (1:500); WB (1:1000) |
| Antibody | Mouse monoclonal anti-FLAG | Sigma-Aldrich | F1804 | IF (1:1000) |
| Antibody | Mouse monoclonal anti-Myc | Cell Signaling | 2233 | IF (1:1000); Ab uptake (1:500) |
| Antibody | Mouse monoclonal anti-tubulin | Sigma-Aldrich | T5168 | WB (1:2500) |
| Antibody | giantin | BioLegend | PRB-114C | IF (1:1000) |
| Antibody | LAMP1 | Abcam | ab24170 | IF(1:100) |
| Other | Alexa-647 WGA | Life Technologies | W32466 | IF (5 ug/ml) |
| Commercial assay or kit | PNGase F | NEB | P0704 | |
| Commercial assay or kit | Endo H | NEB | P0702 | |
| Chemical compound, drug | Thapsigargin | Thermo Fisher | T7459 | Used at 100 nM |
| Chemical compound, drug | MG132 | Cayman Chemical | 1211877-36-9 | Used at10 uM |
| Chemical compound, drug | Bafilomycin A1 | BioViotica | BVT-0252 | Used at100 nM |
| Chemical compound, drug | Brefeldin A | Tocris | 1231 | Used at2.5 uM |
| Chemical compound, drug | Leupeptin | Sigma-Aldrich | L5793 | Used at 125 uM |
| Chemical compound, drug | cycloheximide | Sigma-Aldrich | C-7698 | Used at200 ug/ml |
| Other | 13C6-Lysine | Cambridge Isotopes | CLM-2247 | |
| Other | 13C6, 15N4-Arginine | Cambridge Isotopes | CNLM-539 | |
| Other | Lysine/arginine free DMEM | Thermo Fisher | 88364 | |
| Other | Dialyzed fetal bovine serum | Thermo Fisher | 26400044 | |
| Other | Hoechst stain | Molecular Probes | H1399 | Used at 10 ug/ml |
| Recombinant DNA reagent (plasmid) | UBE2G1 miR-E LT3GEPIR | Knott et al., 2014 | TGCTGTTGACAGTGAGCGAAAGACAGCTGGCAGAACTCAATAGTGAAGCCACAGATGTATTGAGTTCTGCCAGCTGTCTTCTGCCTACTGCCTCGGA | |
| Recombinant DNA reagent (plasmid) | UBE2G2 miR-E LT3GEPIR | Knott et al., 2014 | TGCTGTTGACAGTGAGCGAACCGGGAGCAGTTCTATAAGATAGTGAAGCCACAGATGTATCTTATAGAACTGCTCCCGGTCTGCCTACTGCCTCGGA | |
| Recombinant DNA reagent (plasmid) | UBE2J1 miR-E LT3GEPIR | Knott et al., 2014 | TGCTGTTGACAGTGAGCGAAAGGTTGTCTACTTCACCAGATAGTGAAGCCACAGATGTATCTGGTGAAGTAGACAACCTTCTGCCTACTGCCTCGGA | |
| Recombinant DNA reagent (plasmid) | MARCH6 miR-E LT3GEPIR | Knott et al., 2014 | TGCTGTTGACAGTGAGCGACTGGATCTTCATTCTTATTTATAGTGAAGCCACAGATGTATAAATAAGAATGAAGATCCAGCTGCCTACTGCCTCGGA | |
| Software, algorithm | Fiji | https://fiji.sc/ | ||
| Software, algorithm | RStudio | https://rstudio.com/ |
Additional files
-
Source data 1
Filtered peptide data for half life calculations.
Peptide turnover data for all peptides passing quality control filters. See R script and Materials and methods for details.
- https://doi.org/10.7554/eLife.49796.021
-
Source data 2
Filtered protein data for half life calculations.
Filtered and averaged protein turnover data. See R script and Materials and methods for details.
- https://doi.org/10.7554/eLife.49796.022
-
Supplementary file 1
Results of half life fits passing quality filters.
- https://doi.org/10.7554/eLife.49796.023
-
Supplementary file 2
Complete list of half life fits.
- https://doi.org/10.7554/eLife.49796.024
-
Supplementary file 3
Half lives and protein topology data.
Selected data related to Figure 1G-H.
- https://doi.org/10.7554/eLife.49796.025
-
Transparent reporting form
- https://doi.org/10.7554/eLife.49796.026
Download links
A two-part list of links to download the article, or parts of the article, in various formats.
Downloads (link to download the article as PDF)
Open citations (links to open the citations from this article in various online reference manager services)
Cite this article (links to download the citations from this article in formats compatible with various reference manager tools)
Selective clearance of the inner nuclear membrane protein emerin by vesicular transport during ER stress
eLife 8:e49796.
https://doi.org/10.7554/eLife.49796


