Specific lid-base contacts in the 26s proteasome control the conformational switching required for substrate degradation
- University of California, Berkeley, United States
- The Scripps Research Institute, United States
- Howard Hughes Medical Institute, University of California, Berkeley, United States
Figures
Figure 1 with 2 supplements
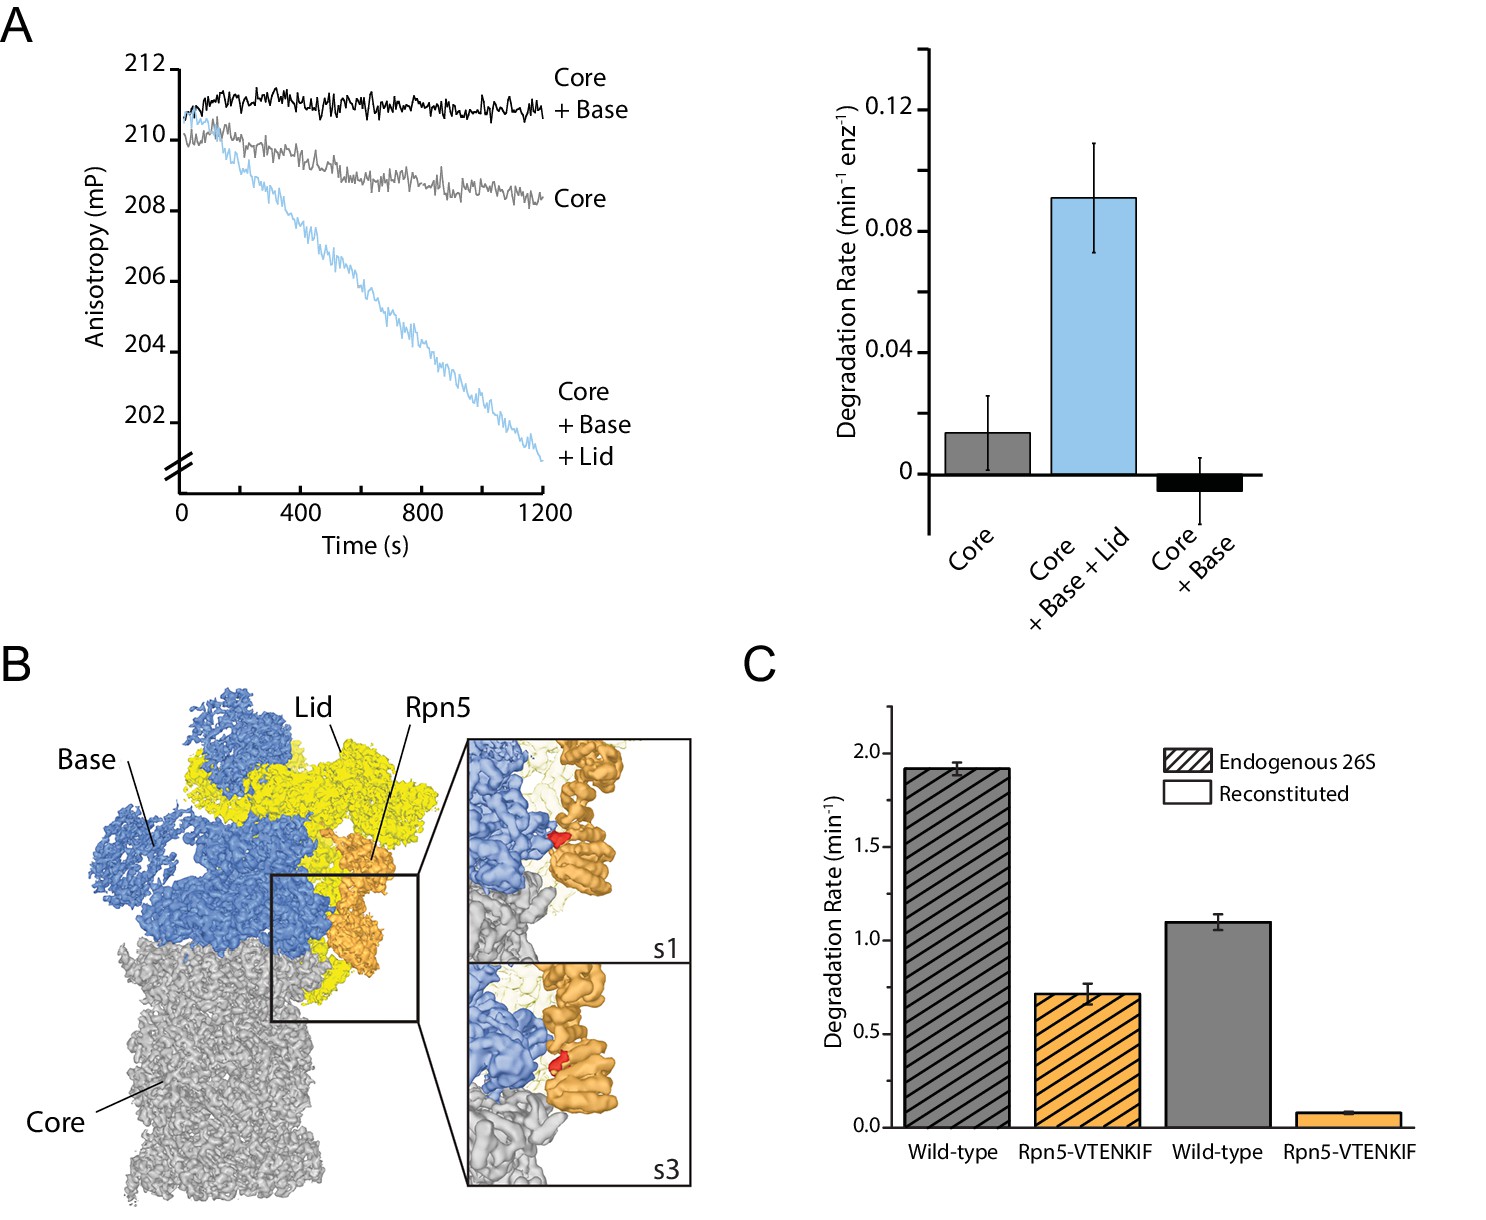
The proteasome lid subcomplex is required for proteasome function through direct contacts with the AAA+-motor.
(A) Ubiquitin-independent degradation of fluorescein-labeled, ssrA-tagged FAM-titin-I27V15P substrate by in-vitro reconstituted 26S proteasomes with recombinantly produced SspB-fused base in the absence and presence of recombinantly produced lid subcomplex was monitored through fluorescence anisotropy under multiple-turnover conditions. Shown on the left are representative traces of changes in anisotropy, and shown on the right are the rates of degradation calculated from these data (N = 3, technical replicates, error bars plotted are SEM). (B) Cryo-EM structure of the 26S proteasome from S. cerevisiae (EMDB code: 3534) highlights contacts between the lid (yellow and orange), base (blue), and core (grey). The lid subunit Rpn5 (orange) uses a VTENKIF-sequence-containing loop (red) to interact with the small AAA+ subdomain of the base subunit Rpt3 in the substrate-free s1 conformation, but not in any other conformation, like s3 shown here (EMDB: 4321). (C) Rates for the single-turnover degradation of a ubiquitinated, TAMRA-labeled G3P substrate with 54 amino acid tail derived from cyclin-b sequence (TAMRA-G3P) by wild-type and Rpn5-VTENKIF mutant proteasomes that were purified from S. cerevisiae (shaded) or in-vitro reconstituted using recombinant lid and base (solid) (N = 3, technical replicates, error bars plotted are SEM).
Figure 1—figure supplement 1
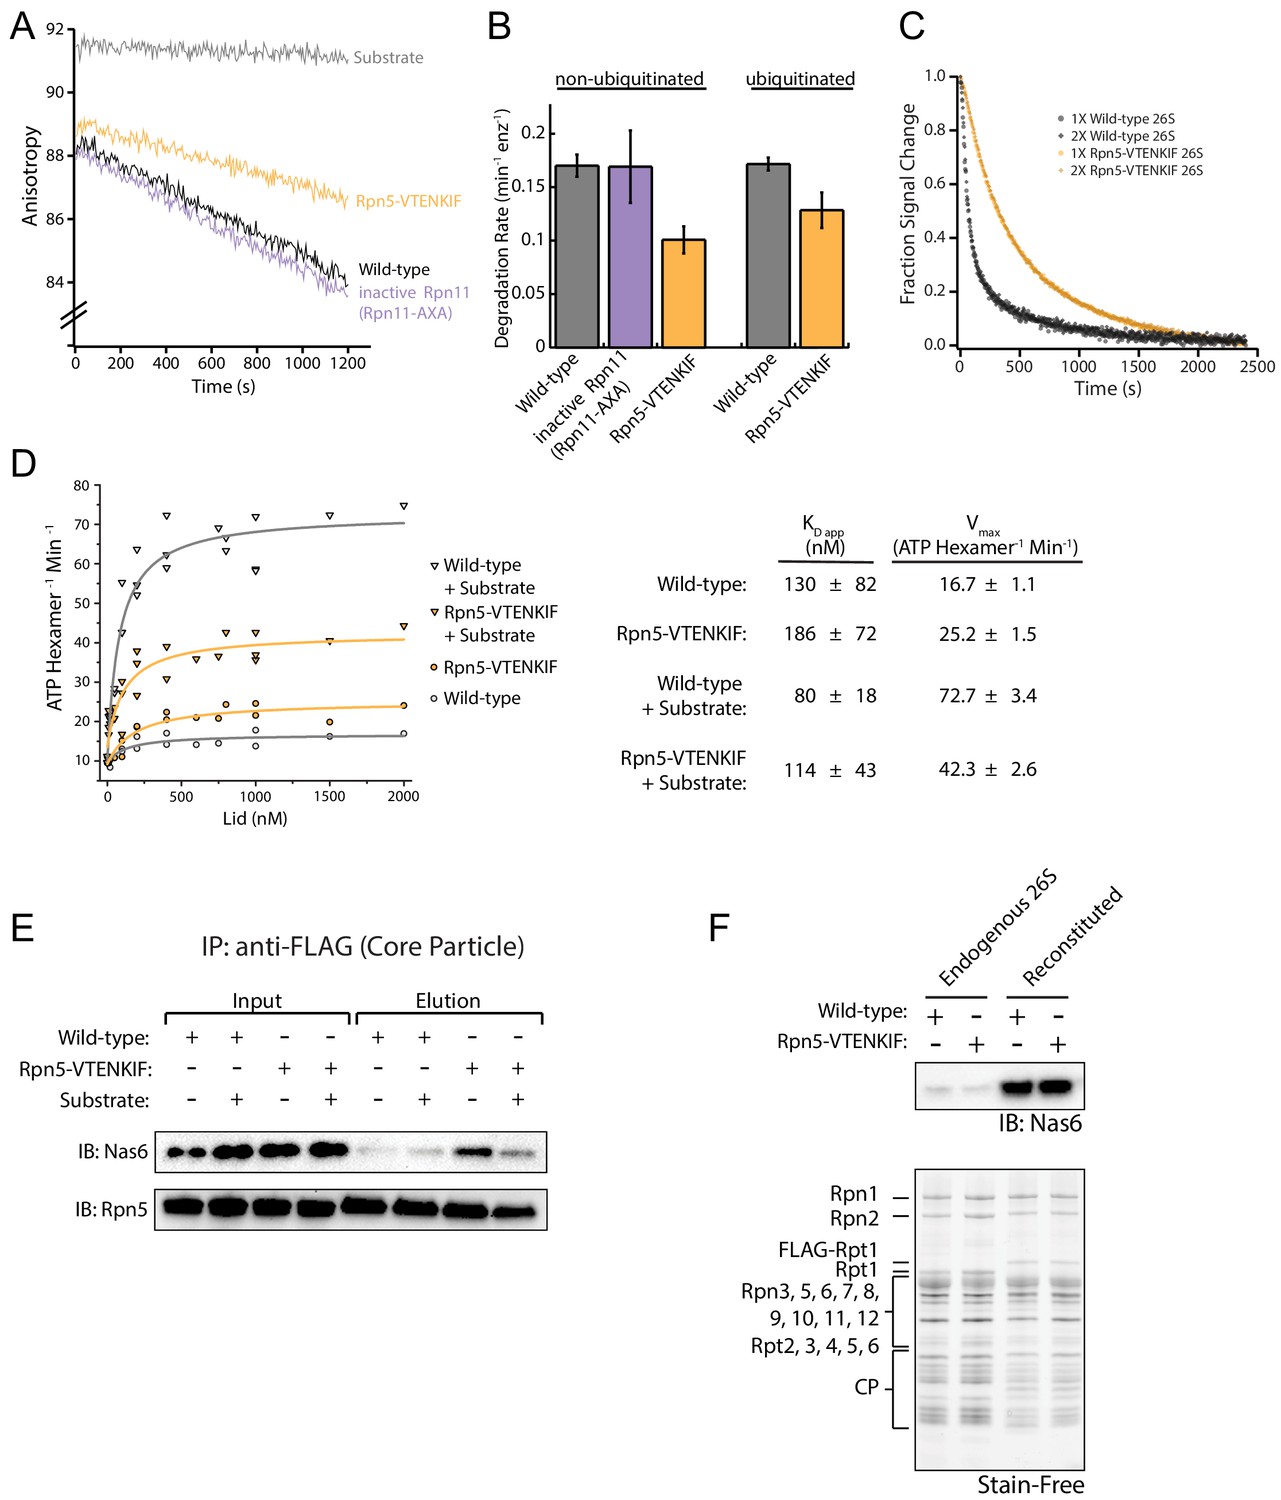
Presence of the lid subcomplex and Rpn5’s contact with AAA+ are necessary for substrate processing.
(A) Representative traces for the changes in anisotropy upon ubiquitin-independent degradation of FAM-titin-I27V15P by in-vitro reconstituted proteasomes containing recombinantly produced, SspB-fused base and either wild-type lid, Rpn5-VTENKIF mutant lid, or lid with inactive Rpn11 (Rpn11AXA) that were also recombinantly produced. (Matyskiela et al., 2013). (B) Comparison of rates for ubiquitin-dependent and -independent degradation of FAM-titin-I27V15P by wild-type and mutant proteasomes (both reconstituted), as derived from multiple-turnover measurements similar to the traces shown in (A) (N = 3, technical replicates, error bars plotted are SEM). (C) Normalized ubiquitin-dependent single-turnover degradations of ubiquitinated TAMRA-G3P substrate by reconstituted Rpn5-VTENKIF and wild-type proteasomes. Single-turnover conditions were verified by doubling the concentration of proteasome as indicated by 1X and 2X 26S proteasome (N = 2, technical replicates). (D) ATPase rates of the base subcomplex in the presence of core and various concentrations of wild-type or mutant lid subcomplex and excess of ubiquitinated FAM-titin-I27V15P substrate. Data were fit to a Michaelis-Menten model, and the derived values for kcat and KD are shown in the table on the right (error represents SEM of the fit). (E) Anti-FLAG immunoprecipitation of proteasomes reconstituted with 3XFLAG-tagged core, tag-less base, and tag-less lid, and incubated with or without an excess of ubiquitinated FAM-titin-I27V15P substrate. Samples were immunoblotted for Nas6 and lid subunit Rpn5. (F) Top: Immunoblotting for the presence of Nas6 in endogenous proteasomes purified from S. cerevisiae and proteasomes in-vitro reconstituted from recombinant lid, recombinant base, and core purified from S. cerevisiae. Bottom: Stain-free detection of the total protein present on the SDS-PAGE gel used for Nas6 immunoblotting above. Proteasome samples analyzed on this gel were used for the single-turnover degradation experiments shown in Figure 1C.
-
Figure 1—figure supplement 1—source data 1
Source data for substrate degradation by endogenous and reconstituted wild-type and Rpn5-VTENKIF mutant proteasomes.
- https://cdn.elifesciences.org/articles/49806/elife-49806-fig1-figsupp1-data1-v2.xlsx
Figure 1—figure supplement 2

Analysis of proteasome mutant assemblies by Native-PAGE.
(A) The stimulated peptidase activity of the 20S core (CP) upon proteasome holoenzyme formation with reconstituted regulatory particle (RP) components (lid and base) is detected by in-gel cleavage of Suc-LLVY-AMC (left). Free and holoenzyme-incorporated CP is detected by the in-gel Suc-LLVY-AMC cleavage after treatment with 0.02% SDS (middle). The Coomassie stained gel (right) shows the total protein used in the reconstitutions. The left, middle, and right images are visualizations of the same gel. (B) and (C) Technical replicates of the reconstitutions reactions and native-PAGE gel described in (A). Panel B and C show the additional SDS-PAGE analysis of the proteasome-reconstitution reactions, detected by Stain-Free imaging. (D) Native-PAGE analysis of endogenous wild-type and Rpn5-VTENKIF proteasomes visualized by in-gel Suc-LLVY-AMC cleavage after treatment with 0.02% SDS.
Figure 2 with 6 supplements
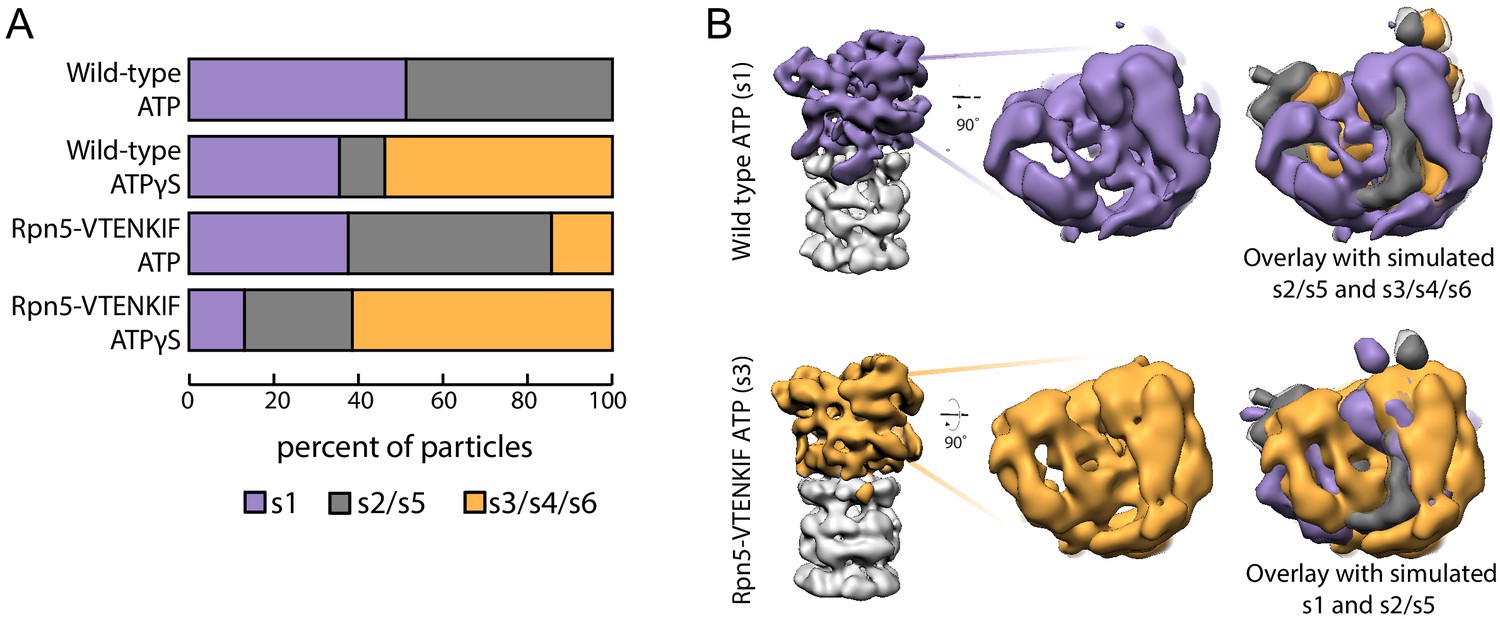
Rpn5 interactions with the AAA+ ring are required for maintenance of the s1 state.
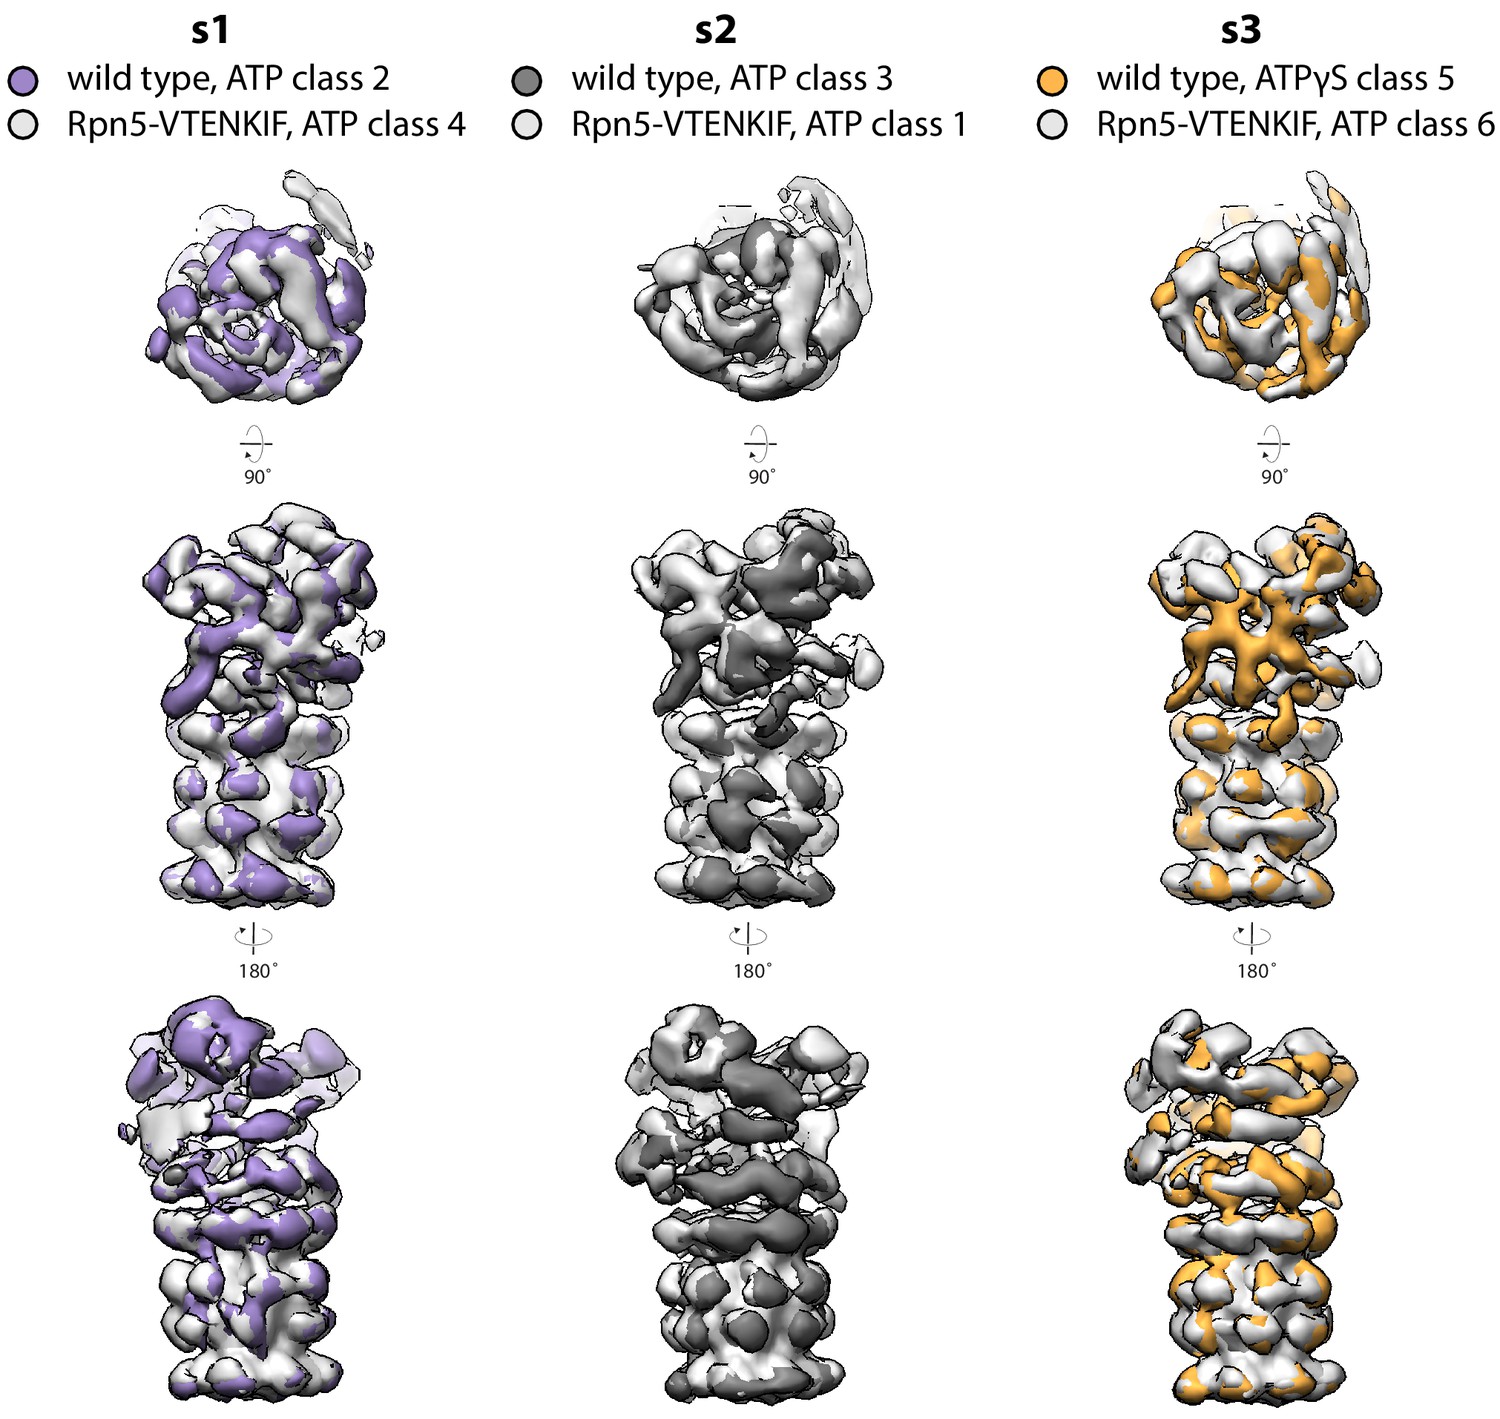
(A) Proportion of each proteasome conformation observed by negative-stain electron microscopy for wild-type or Rpn5-VTENKIF proteasome in the presence of ATP or ATPγS. Designation of substrate-free and engaged-like conformations (s1, s2/s5, s3/s4/s6) was based on best fit to the atomic models provided in Eisele et al. (2018) and more details of the classification are provided in Figure 2—figure supplement 1–6. (B) Representative densities for wild-type proteasome in the s1 conformation (top, purple) and Rpn5-VTENKIF mutant proteasome in the s3/s4/s6 conformation (bottom, orange), overlaid with low-resolution envelopes generated from the atomic models for the given state in Eisele et al. (2018) aligned by their core particles (grey). In the overlay s2/s5 is shown in grey, s3/s4/s6 is shown in orange, and s1 is shown in purple.
-
Figure 2—source data 1
Source data for EM densities of mutant and wild-type proteasomes in the presence of ATP or ATPγS, and comparison with the s1-s6 conformations from Eisele et al. (2018).
- https://cdn.elifesciences.org/articles/49806/elife-49806-fig2-data1-v2.zip
Figure 2—figure supplement 1
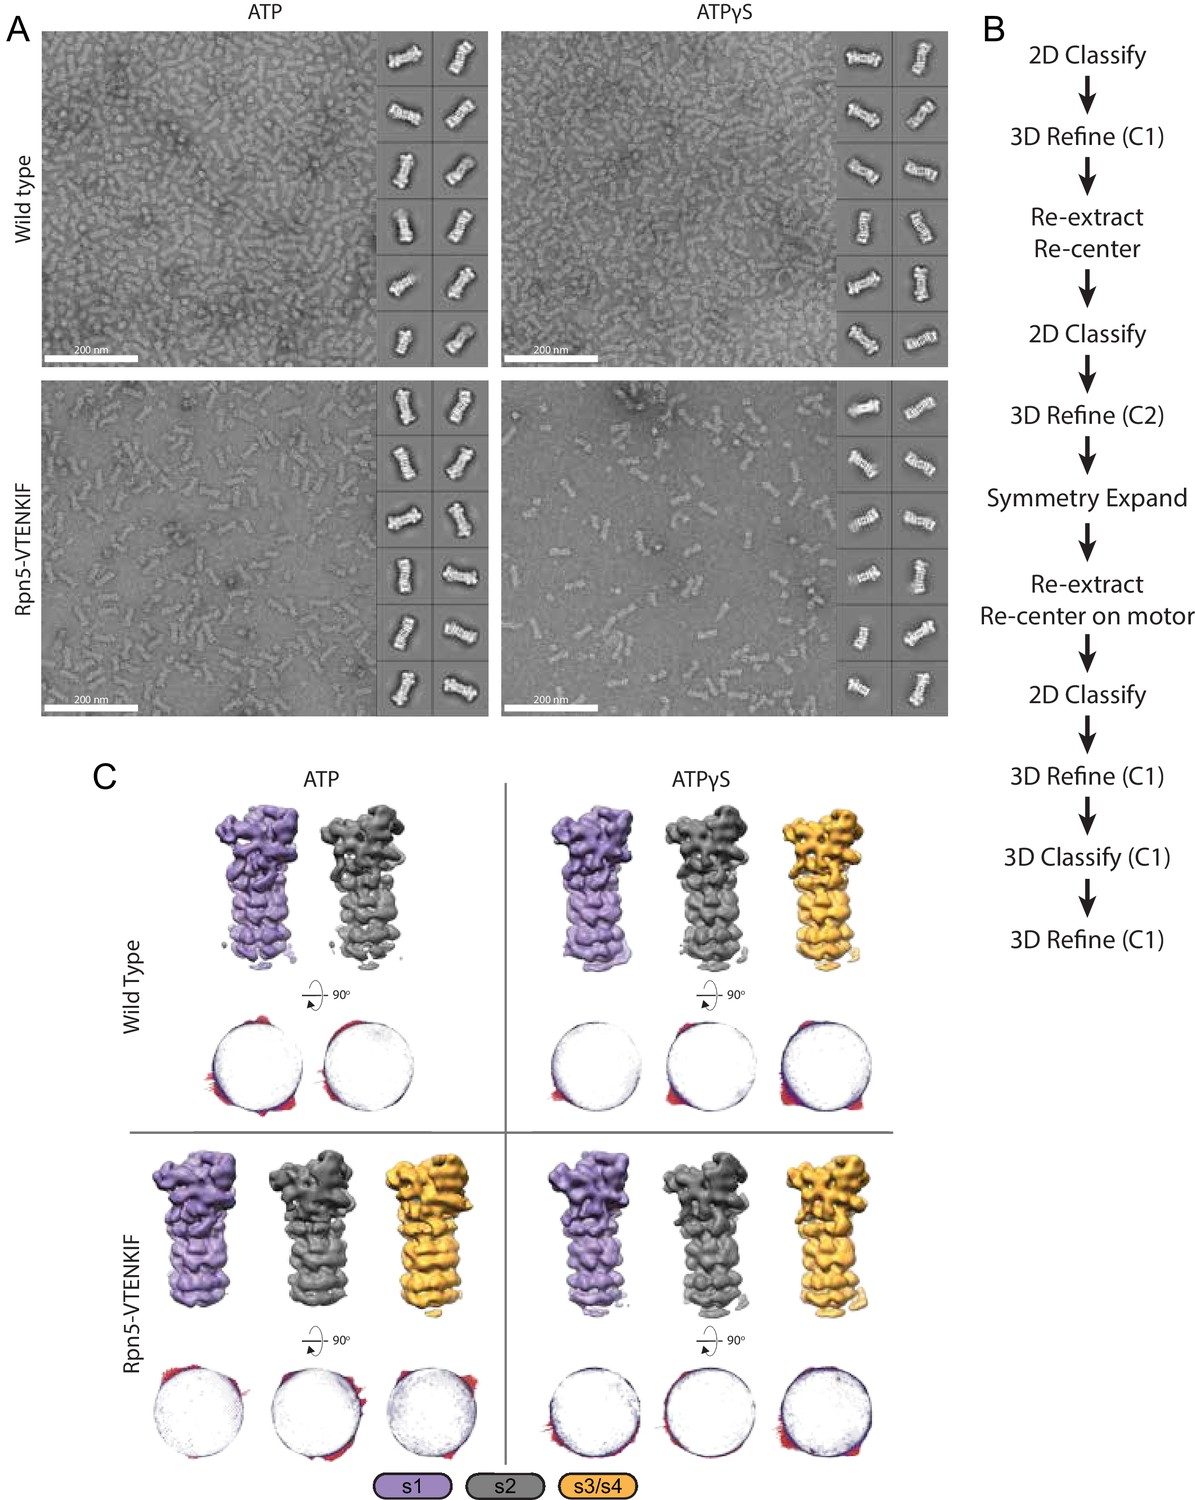
EM processing of Rpn5-VTENKIF and wild-type proteasomes.
(A) Representative images and 2D class averages of wild-type and Rpn5-VTENKIF proteasomes in either nucleotide condition. (B) EM workflow as described in Materials and methods. (C) Representative 3D classes, colored by conformation classification. Below, Euler distributions presented per conformer displayed above.
Figure 2—figure supplement 2
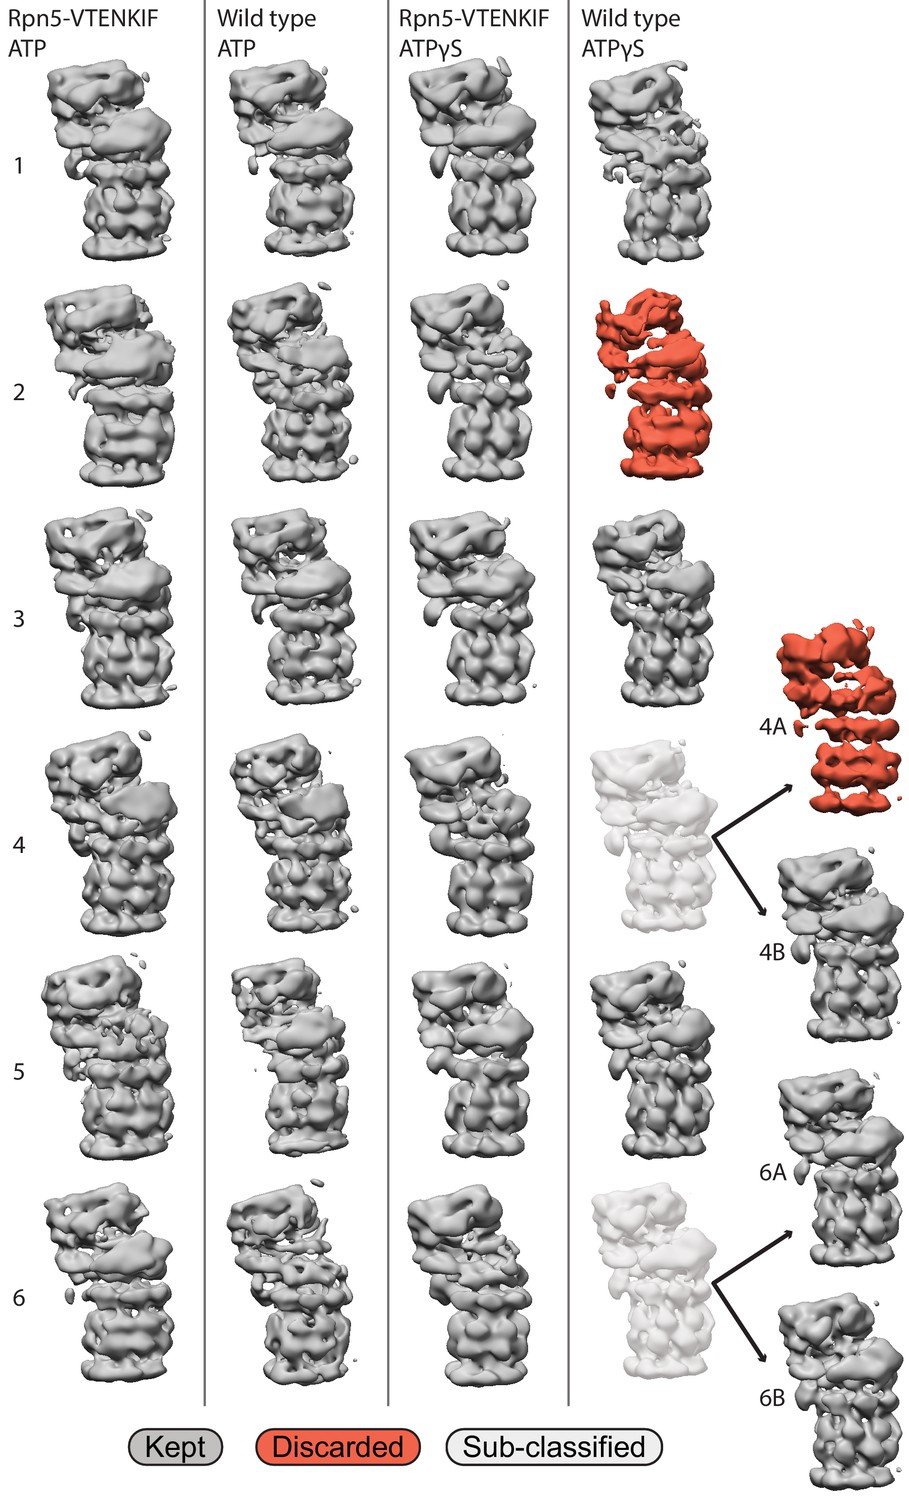
Picking of final 3D classes.
Representative views for all six classes attained per dataset. Classes shown in red were discarded due to incomplete density in stable portions of the proteasome, such as the core particle, and poor alignment to any of the simulated densities generated from Eisele et al. (2018). Classes were subclassified and these subclassifications were retained only when they aligned better to different states.
Figure 2—figure supplement 3
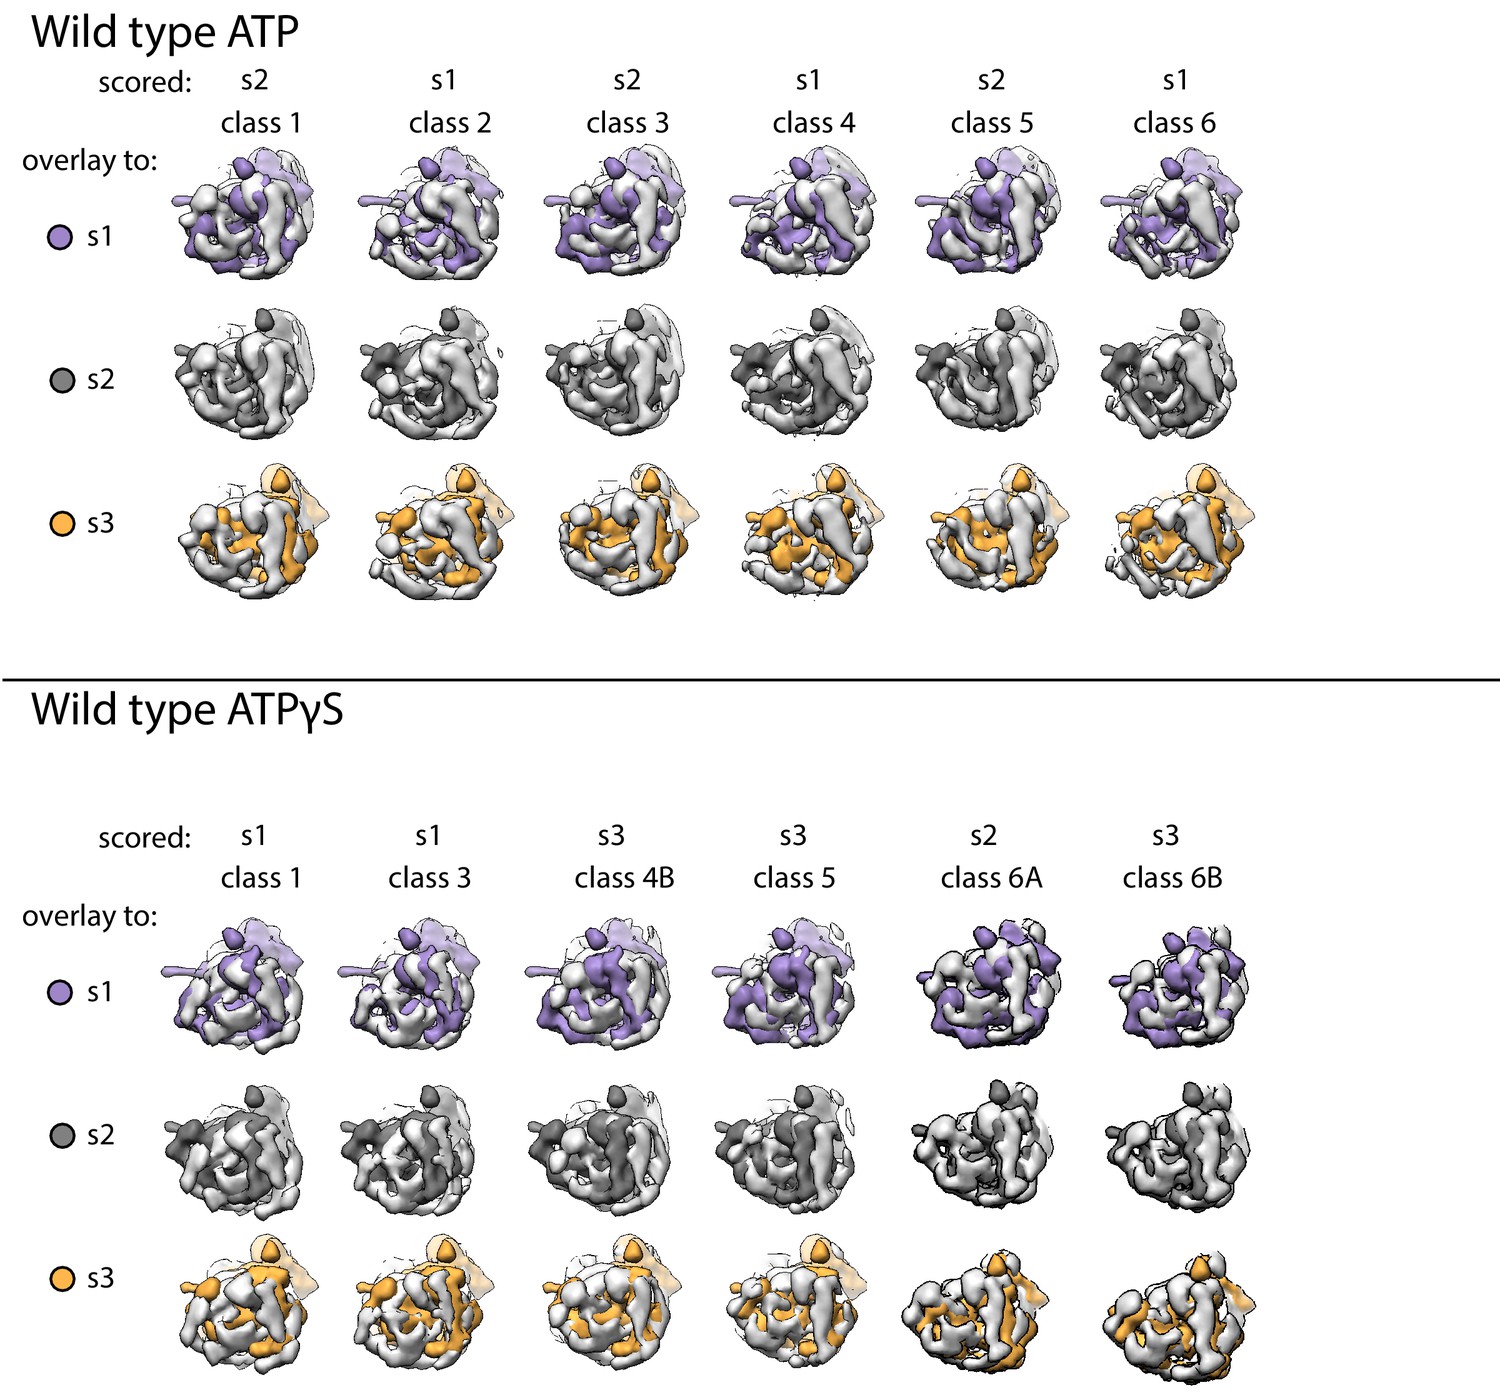
Overlays of each class for wild-type proteasomes to simulated 20 Å maps of s1, s2, and s3 states.
Each negative-stain class is shown in light grey and pairwise aligned to the core particles in the 20Å-simulated maps for the s1 (purple), s2 (dark grey), or s3 (orange). Classes were assigned to the scored state based on the best fit of these alignments.
Figure 2—figure supplement 4
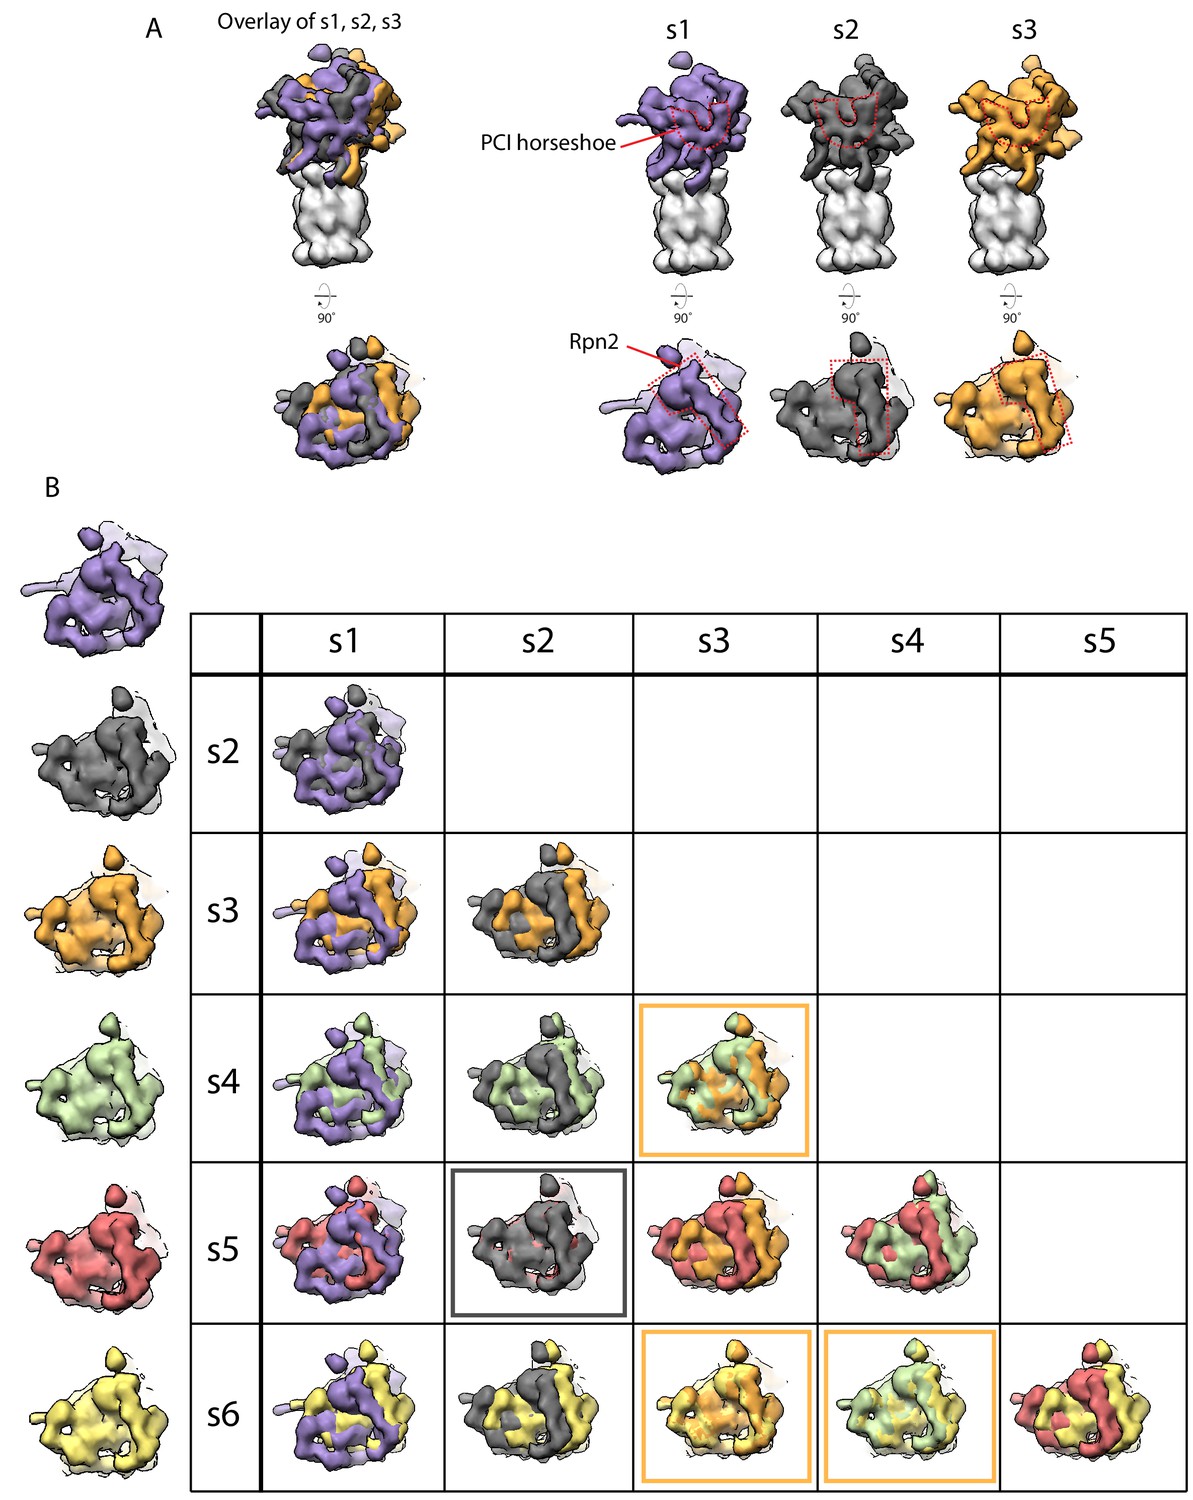
Low resolution simulated maps from Eisele et al. (2018) capture the conformational changes that occur in the regulatory particle.
(A) Low resolution maps simulated at 20 Å were generated from the atomic models of the s1, s2, and s3 states from Eisele et al. (2018). The overlay on the left was aligned by the core particles and shows the positions of the PCI-horseshoe (top) and Rpn2 (bottom) as distinguishable differences between the three states (below). (B) Comparison of all states (s1, purple; s2, dark grey; s3, orange; s4, green; s5, red; and s6, yellow) described in Ref 19, using simulated 20 Å maps generated from the atomic models. At this resolution, s2 and s6 are indistinguishable (boxed in dark grey) as are s3, s4, and s5 (boxed in orange).
Figure 2—figure supplement 5
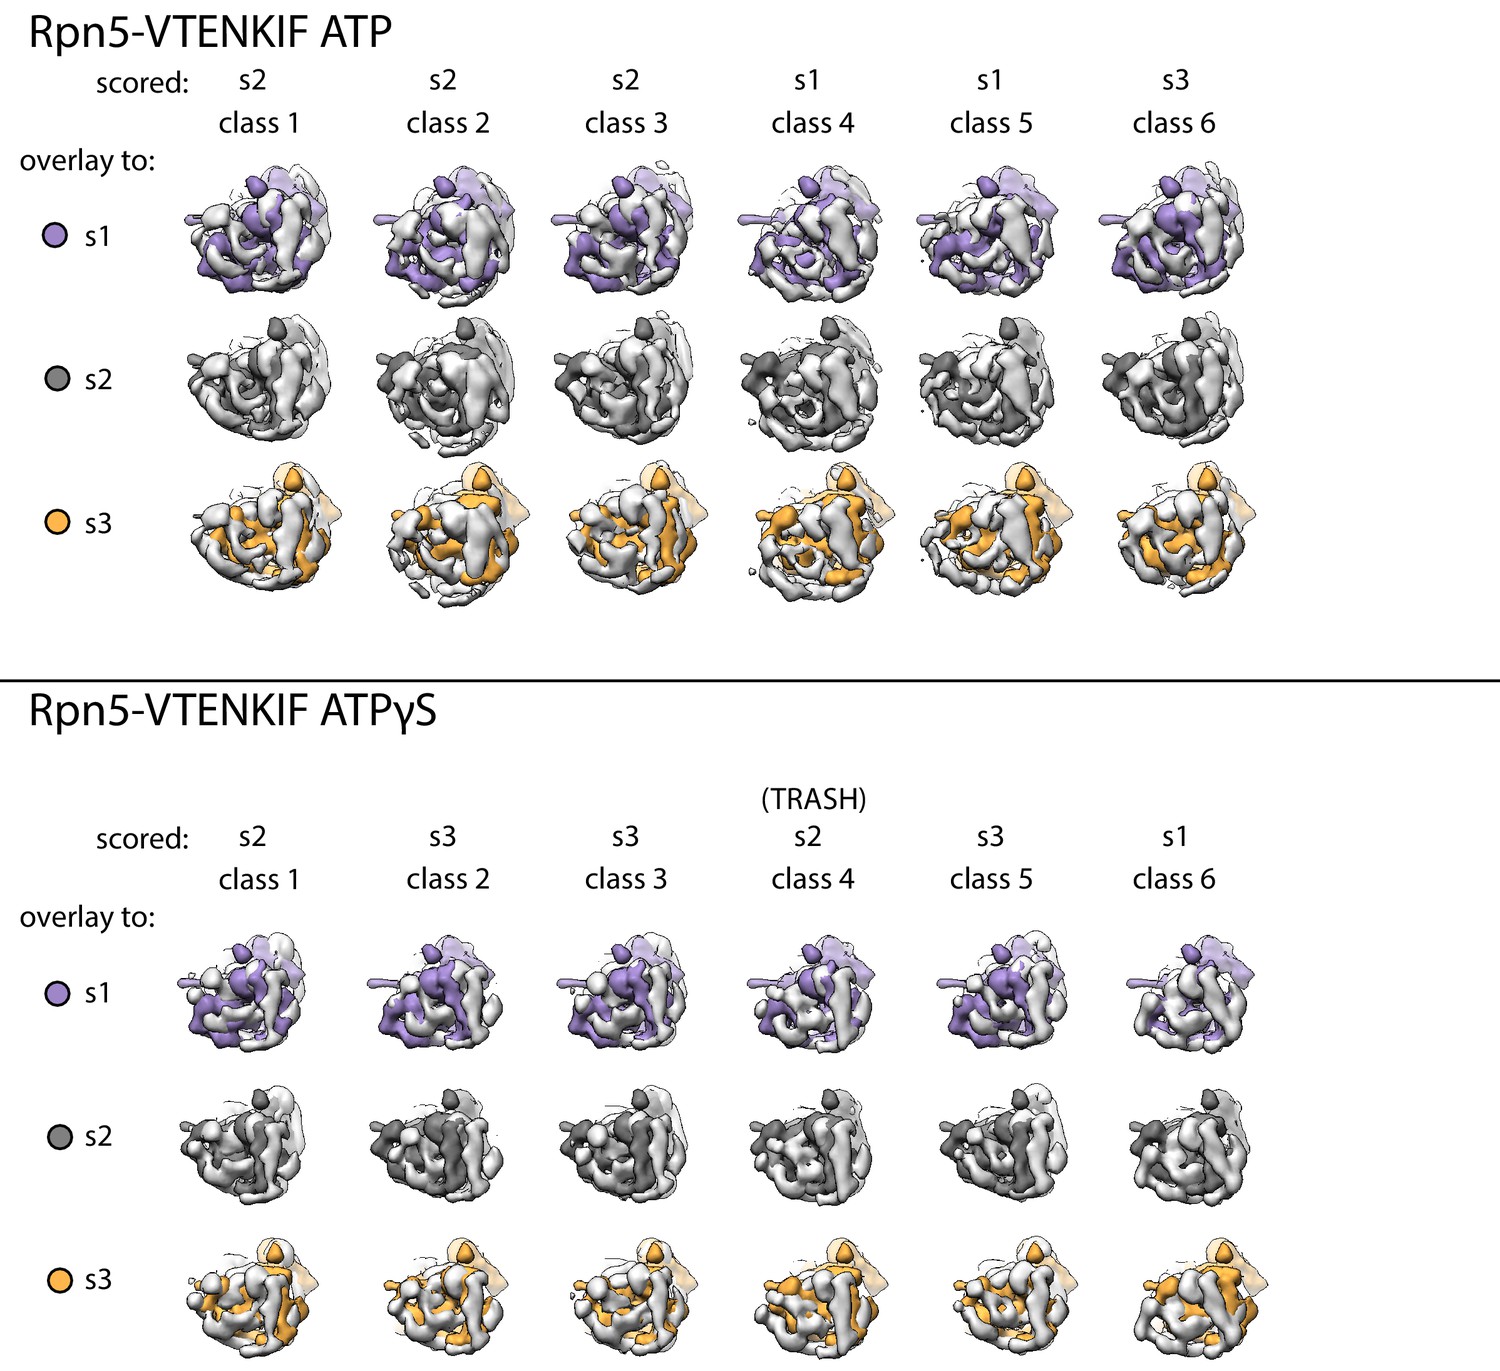
Overlays of each class for Rpn5-VTENKIF-containing proteasomes to simulated 20 Å maps of s1, s2, and s3 states.
Each negative-stain class is shown in light grey and pairwise aligned to the core particles in the 20Å-simulated maps for the s1 (purple), s2 (dark grey), or s3 (orange). Classes were assigned to the scored state based on the best fit of these alignments.
Figure 2—figure supplement 6
Overlays of negative-stain classes.
Classes from wild-type and Rpn5-VTENKIF samples that were assigned the same conformational state (s1, s2, or s3) overlay with each other when aligned to a core peptidase model.
Figure 3 with 2 supplements
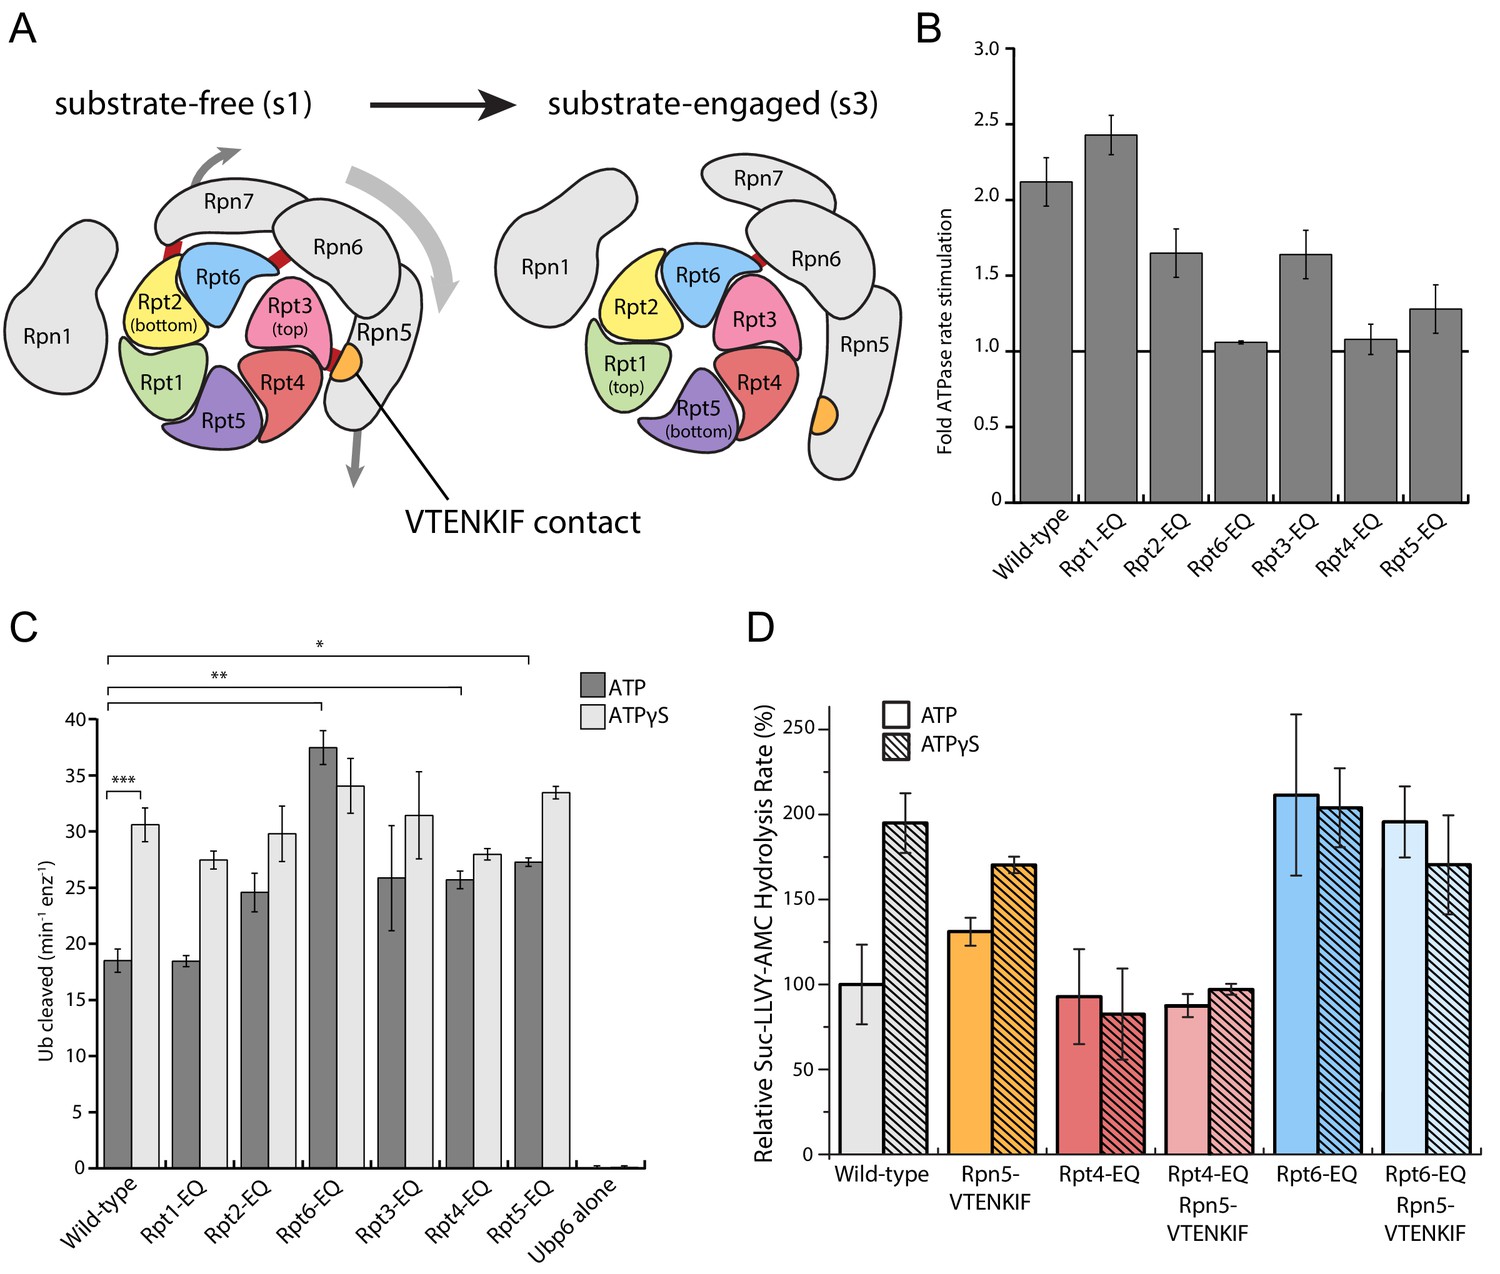
Walker-B mutations in Rpt6 and Rpt4 influence proteasome conformational switching and are dominant over Rpn5-VTENKIF mutation.
(A) Cartoon of the proteasome heterohexameric AAA+-motor and interacting lid subunit as viewed from the top, with the core particle underneath. The base subunit Rpn1 and lid subunits are shown in grey, with red bars indicating the interactions between the VTENKIF region of Rpn5 (orange) and the AAA+ domain of Rpt3 (pink), as well as the Rpn6-Rpt6 and Rpn7-Rpn2 contacts. The ATPase subunits Rpt1, Rpt2, Rpt6, Rpt3, Rpt4, and Rpt5, depicted in rainbow colors, are forming a vertical spiral staircase. In the substrate-free s1 state, Rpt3 is at the top of this staircase, Rpt2 at the bottom, and Rpt6 represents the seam subunit with an open ATPase interface to its neighbor Rpt3. In the substrate-engaged s3 state, Rpt1 is at the top and Rpt5 at the bottom, with an open seam between the two. As the ATPase ring transitions through the various engaged states during ATP hydrolysis, the staircase and the open seam are expected to progress in a counterclockwise manner around the ring (de la Peña et al., 2018). (B) Proteasome ATPase stimulation by ubiquitin-bound Ubp6, with no stimulation indicated by a solid black line (N ≥ 3, technical replicates, error bars plotted are SEM). (C) Ub-AMC cleavage activities of Ubp6 in the context of wild-type or Walker-B mutant proteasomes with ATP or ATPγS (N ≥ 3, technical replicates, error bars plotted are SEM, p values shown for a Student’s T-test). (D) Core gate-opening measured through cleavage of the fluorogenic Suc-LLVY-AMC substrate. Cleavage rates were determined by linear fitting of the AMC-fluorescence increase, normalized to wild-type proteasome in ATP, and plotted as averages with standard deviations (N ≥ 3, technical replicates).
Figure 3—figure supplement 1
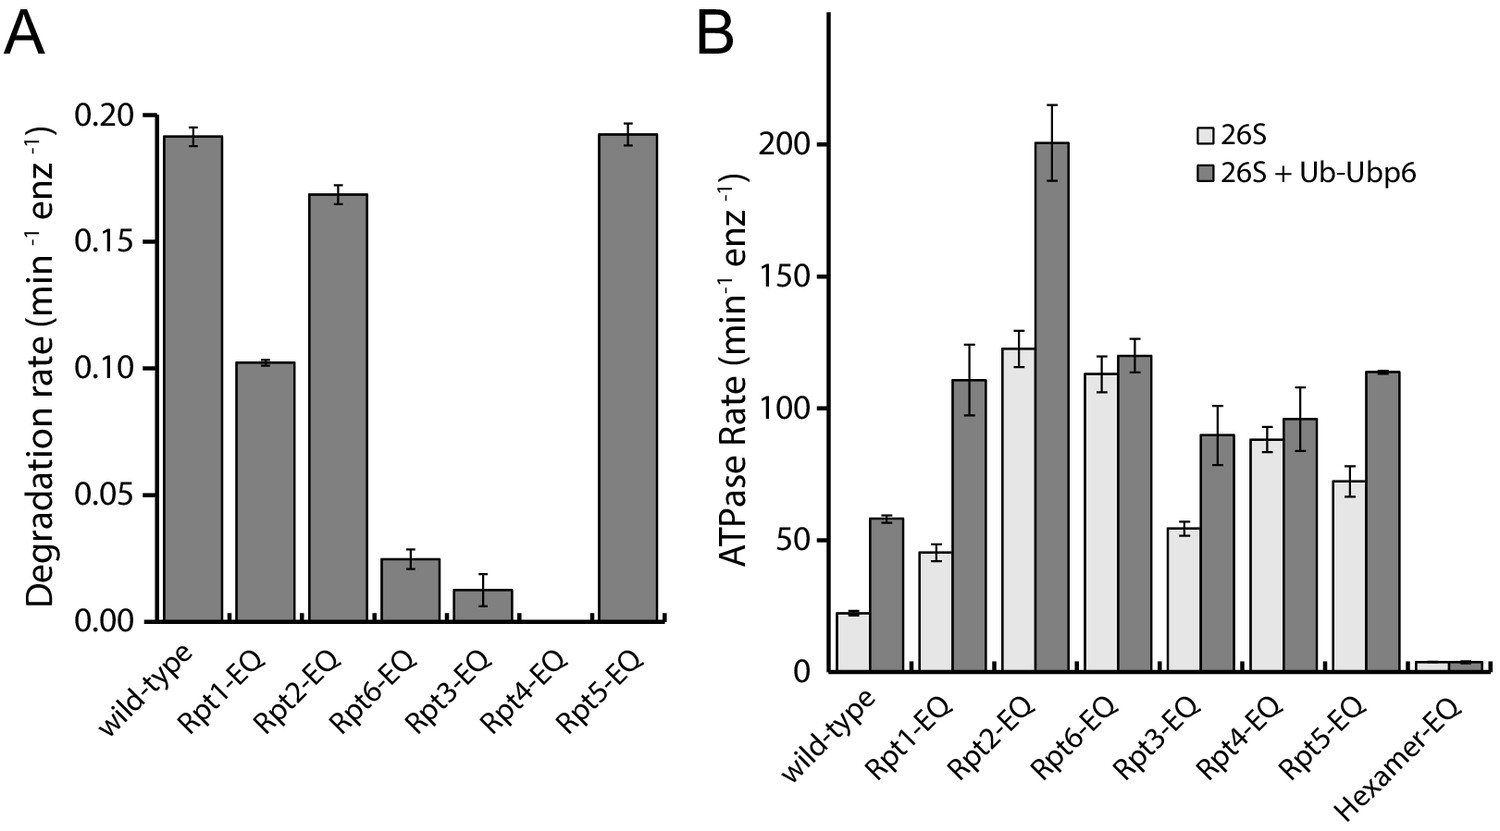
Degradation and ATPase activities of Walker-B mutant proteasomes.
(A) Rates for multiple-turnover ubiquitin-dependent degradation of FAM-titin-I27V15P (N = 3, technical replicates, error bars represent SD). (B) ATPase rates of Walker-B mutant proteasomes in the absence (light grey) and presence (dark grey) of ubiquitin-bound Ubp6, Ub-Ubp6 (N ≥ 3, technical replicates, errors represent SEM).
-
Figure 3—figure supplement 1—source data 1
Source data for ATP-hydrolysis, Ubiquitin-AMC-cleavage, and core-gate-opening activities of wild-type and Walker-B (EQ) mutant proteasomes.
- https://cdn.elifesciences.org/articles/49806/elife-49806-fig3-figsupp1-data1-v2.xlsx
Figure 3—figure supplement 2
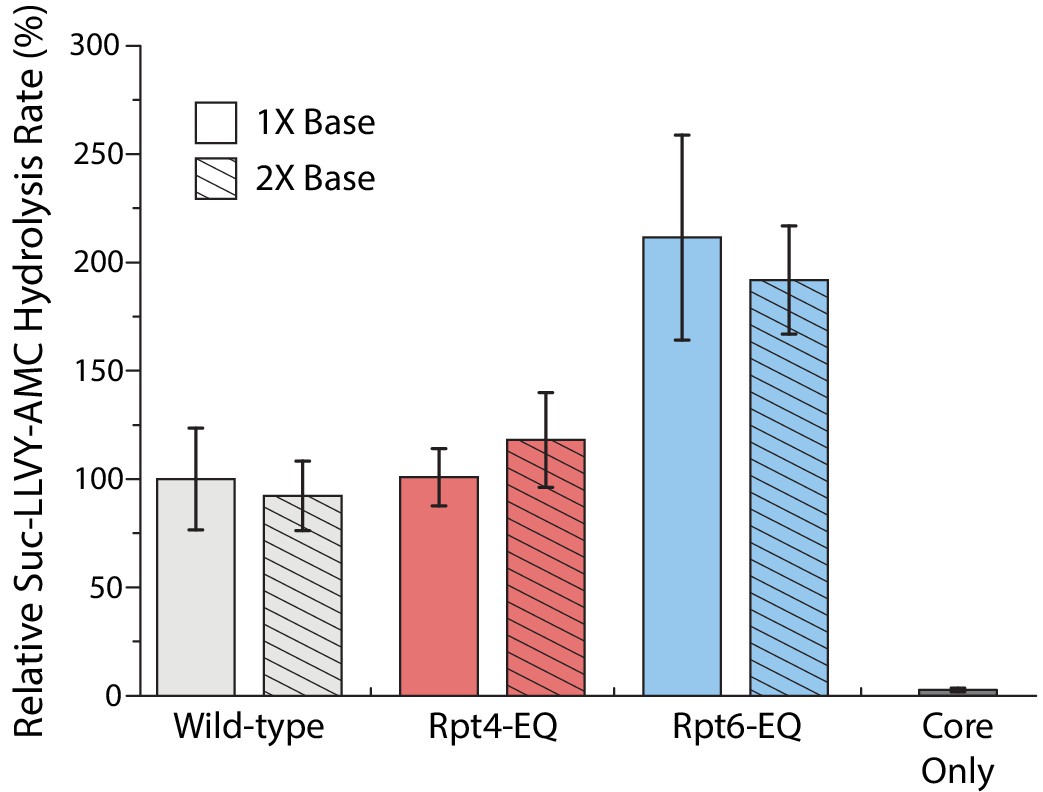
Core-gate opening activities of reconstituted proteasomes.
Gate-opening was measured through cleavage of the fluorogenic Suc-LLVY-AMC substrate. Proteasomes were reconstituted with either stoichiometric amounts (1X base) or a two-fold excess of base (2X base). Cleavage rates were determined by linear fitting of the AMC-fluorescence increase, normalized to wild-type proteasome with 1X base, and plotted as averages with standard deviations (N = 3, technical replicates).
Figure 4 with 1 supplement
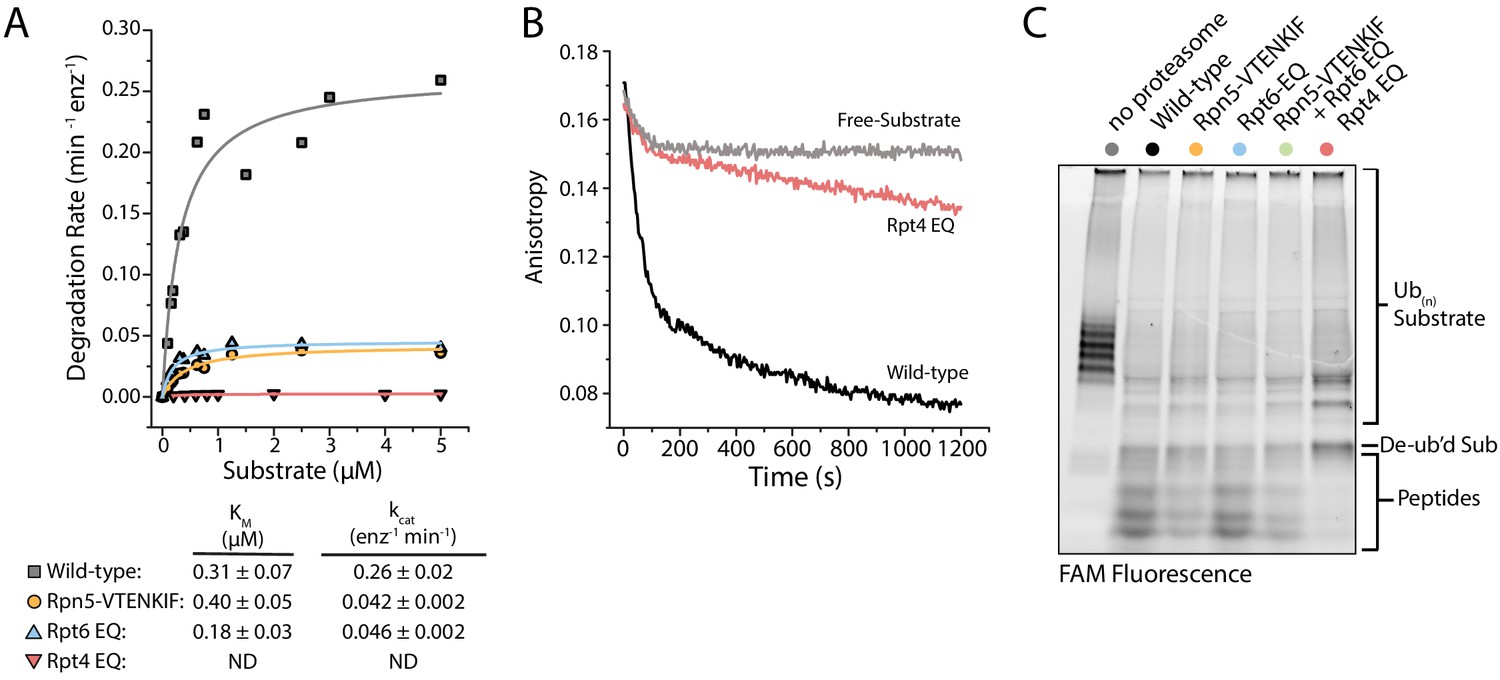
Proteasomes with impaired conformational switching display various degradation defects.
(A) Michaelis-Menten analysis based on initial rates for ubiquitin-dependent degradation of FAM-titin-I27V15P under multiple-turnover conditions. Km and kcat values are shown below with errors representing SEM from the fit. Rpt4-EQ had too low activity to be fit. (B) Representative anisotropy traces for the single-turnover degradation of ubiquitinated FAM-titin-I27V15P by wild-type and Rpt4-EQ mutant proteasomes (C) SDS-PAGE analysis of end-point samples from single-turnover degradation reactions, visualizing fluorescence of the FAM-titin-I27V15P model substrate in its ubiquitinated, de-ubiquitinated, and degraded form.
Figure 4—figure supplement 1

Analysis of substrate processing by free regulatory particle during proteasome degradation.
(A) Normalized fluorescence anisotropy measurements showing the processing of ubiquitinated TAMRA-G3P-substrate by reconstituted Rpt4-EQ regulatory particle (RP) alone, by proteasomes reconstituted with Rpt4-EQ regulatory particle at stoichiometric amounts (2RP:1CP = 1X RP + Core) or in two-fold access (4RP:1CP = 2X RP + Core), and by core particle alone, normalized to the degradation by reconstituted wild-type 26S proteasome (N = 3; error presented = SD). (B) SDS-PAGE analysis of end-point samples from single-turnover degradation reactions performed in (A), visualizing the fluorescence of TAMRA-labeled G3P-substrate (left) and total protein at (right). (C) Normalized fluorescence anisotropy measurements showing the processing of ubiquitinated TAMRA-G3P-substrate by proteasomes reconstituted with mutant regulatory particles, normalized to reconstituted wild-type 26S proteasome. (N = 3; error present = SD). (D) SDS-PAGE analysis of end-point samples from single-turnover degradation reactions performed in (C), visualizing the fluorescence of TAMRA-G3P-substrate (left) and total protein (right). (E) Normalized fluorescence anisotropy measurements showing the processing of ubiquitinated TAMRA-G3P-substrate by wild-type, Rpn5-VTENKIF-, and Rpt6-EQ-mutant proteasomes reconstituted with a stoichiometric amount (2RP:1CP = 1 XRP) or two-fold excess of RP (4RP:1CP = 2 XRP). (N = 3, error presented = SD). (F) SDS-PAGE analysis of end-point samples from single-turnover degradation reactions performed in (D), visualizing the fluorescence of TAMRA G3P-substrate (top) and total protein (bottom).
-
Figure 4—figure supplement 1—source data 1
Source data for Michaelis-Menten analyses of substrate degradation by wild-type, Rpn5-VTENKIF, Rpt4-EQ, and Rpt6-EQ mutant proteasomes, and source data for substrate processing by the corresponding regulatory particles.
- https://cdn.elifesciences.org/articles/49806/elife-49806-fig4-figsupp1-data1-v2.xlsx
Figure 5 with 2 supplements

Disrupting the conformational equilibrium inhibits substrate tail insertion but not later steps of degradation.
(A) Representative traces for the increase in acceptor fluorescence/FRET upon insertion of the ubiquitinated FAM-titin-I27V15P-Cy5 substrate’s flexible initiation into the central pore of wild-type and Rpn5-VTENKIF mutant proteasomes with o-PA inhibited Rpn11, in the presence of ATP or ATPγS. The schematic below depicts the experimental setup, where FRET occurs when a substrate’s flexible initiation region labeled with an acceptor dye (blue star) enters and then stalls in the central pore of a proteasome containing inhibited Rpn11 (red cross) and a donor dye (red star) near the processing channel. The substrate’s ubiquitin modification is represented in pink, the Rpt ring is shown in light blue, the core particle in dark grey, and Rpn5 in orange. (B) Rate constants for the single-turnover, ubiquitin-dependent degradation of ubiquitinated G3P model substrate, either without stalling the proteasome (left) or after stalling translocation for 3 min with o-PA inhibited Rpn11 and restarting by the addition of Zn2+ (right). Rates were determined from single-exponential fits of the appearance of fluorescently tagged peptide products on SDS PAGE gels. Error bars represent SEM for the fit, N ≥ 3, technical replicates. (C) Ubiquitin-dependent degradation rates for wild-type, Rpn5-VTENKIF and Rpt6-EQ mutant proteasomes degrading the destabilized FAM-titin-I27V13P/V15P-35mer tail or the non-destabilized FAM-titin-I27-35mer tail substrate under single-turnover conditions. Shown are the rate constants for the dominant fast phase derived from a double-exponential fit of the degradation kinetics (N = 3, technical replicates, error bars represent SD).
Figure 5—figure supplement 1

Tail insertion can be rate limiting for mutant proteasomes with compromised conformational equilibria.
(A) FRET-based assay monitoring the insertion of the ubiquitinated Cy5-labeled titin-I27V15P substrate tail into the central pore of Cy3 labeled, o-PA-inhibited wild-type or Rpn5-VTENKIF mutant proteasomes. Representative traces (left) show the reciprocal change in Cy3 and Cy5 fluorescence, indicative of FRET, and the dependence of substrate-tail insertion on fully assembled proteasomes. Middle, traces for the substrate-tail insertion of wild-type and Rpn5-VTENKIF mutant proteasomes, monitored through Cy5 fluorescence and fit to Equation 2 (solid line). Residuals of the fit are shown below the traces, and derived kinetic parameters are shown on the right (N = 3, technical replicates, error represents SEM). (B) FRET-based tail-insertion assay, as described in (A), comparing wild-type, Rpn5-VTENKIF, and Rpt6-EQ mutant proteasomes (N ≥ 3, technical replicates, error represents S.E.M.).
-
Figure 5—figure supplement 1—source data 1
Source data for the single-turnover degradation of titin substrates by wild-type, Rpn5-VTENKIF, and Rpt6-EQ mutant proteasomes with or without prior translocation stalling, and source data for substrate-tail insertion into these proteasome variants.
- https://cdn.elifesciences.org/articles/49806/elife-49806-fig5-figsupp1-data1-v2.xlsx
Figure 5—figure supplement 2
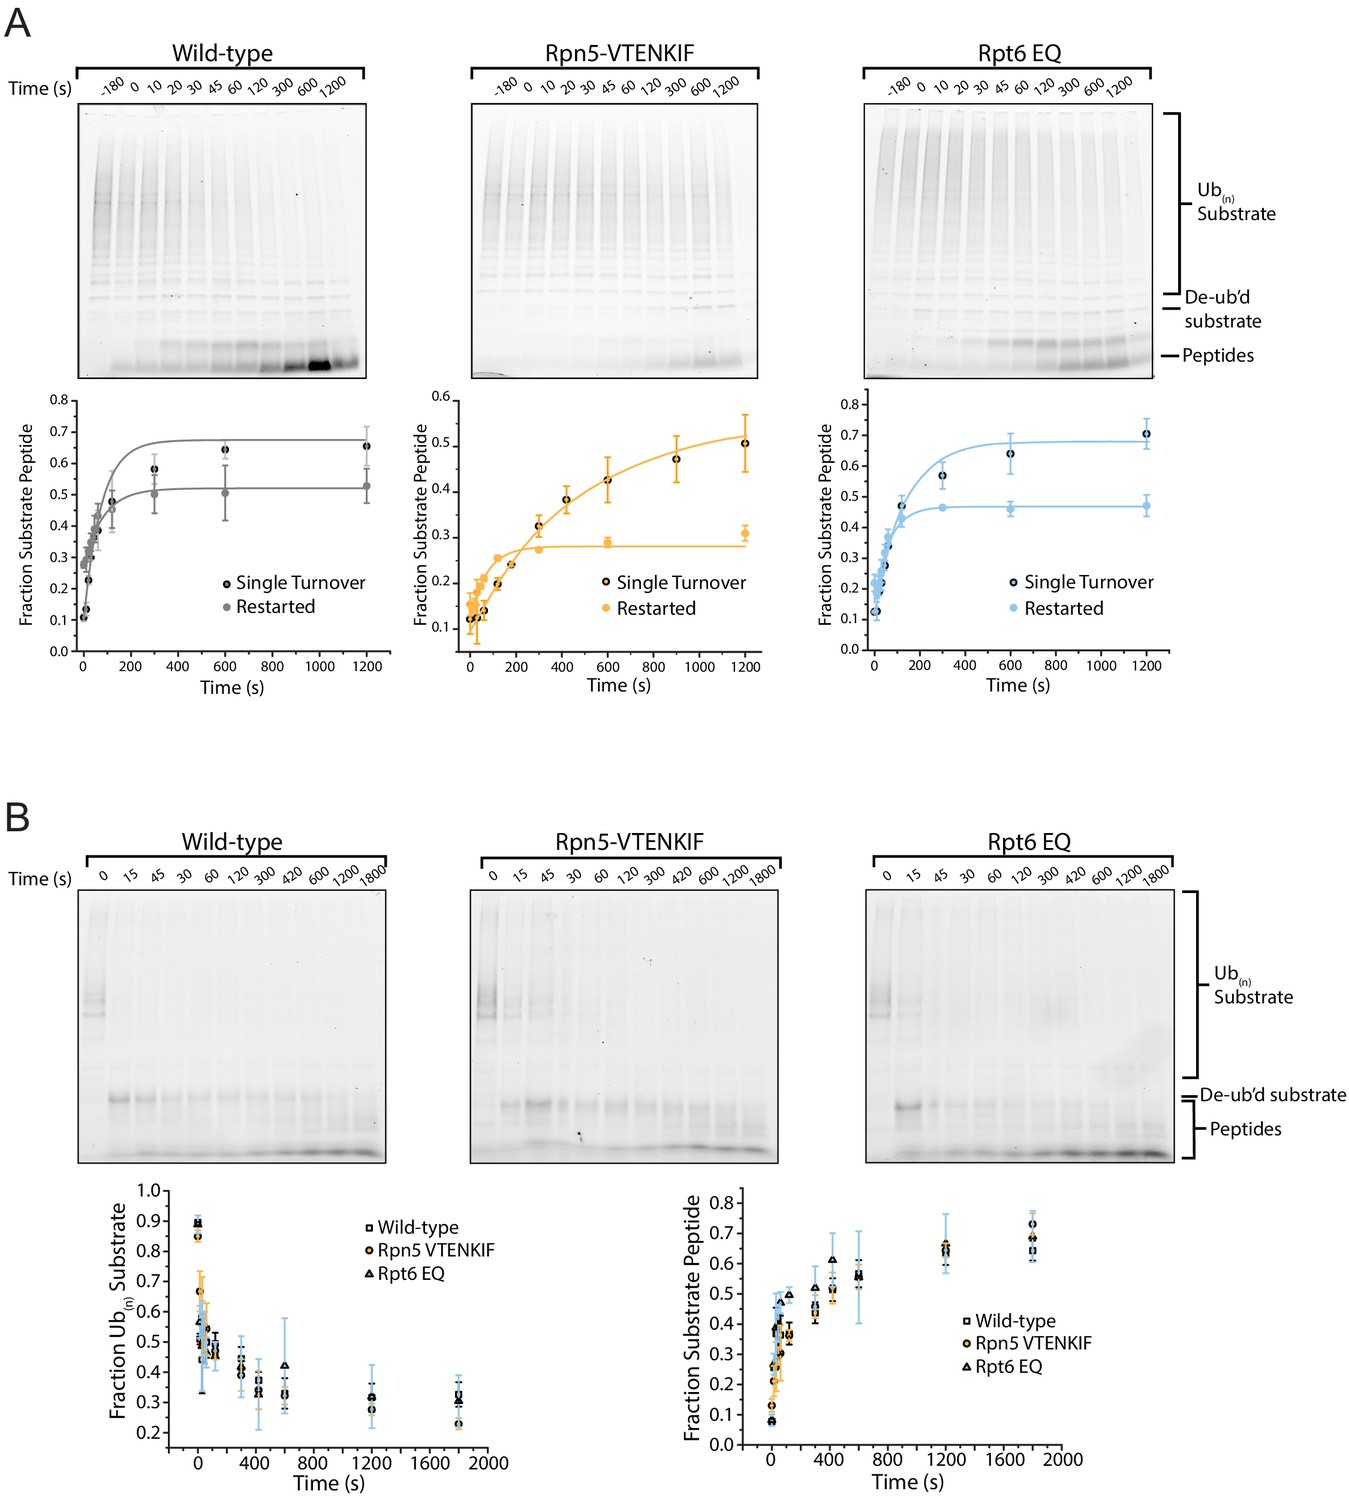
Gel based degradation assay analysis.
(A) Representative SDS-PAGE gels for the end-point analyses of ubiquitinated TAMRA-G3P-degradation reactions by wild-type, Rpn5-VTENKIF, and Rpt6-EQ mutant proteasomes after restart from an o-PA-induced stall. The fluorescence signal of the substrate-attached TAMRA dye was use for in-gel detection and quantifications, which are plotted below the gels. Data were fitted to Equation 3 (N = 3, technical replicates, error bars represent SD). (B) Representative SDS-PAGE gels for the analyses of non-destabilized FAM-titin-I27 degradation by wild-type and mutant proteasomes under single-turnover conditions. Quantified FAM-fluorescence values for ubiquitinated substrate and peptide products are plotted below the gels (N = 3, technical replicates, error bars represent SD).
-
Figure 5—figure supplement 2—source data 1
Source data for titin-substrate degradation by wild-type, Rpn5-VTENKIF, and Rpt6-EQ mutant proteasomes as analyzed by SDS PAGE.
- https://cdn.elifesciences.org/articles/49806/elife-49806-fig5-figsupp2-data1-v2.zip
Figure 6
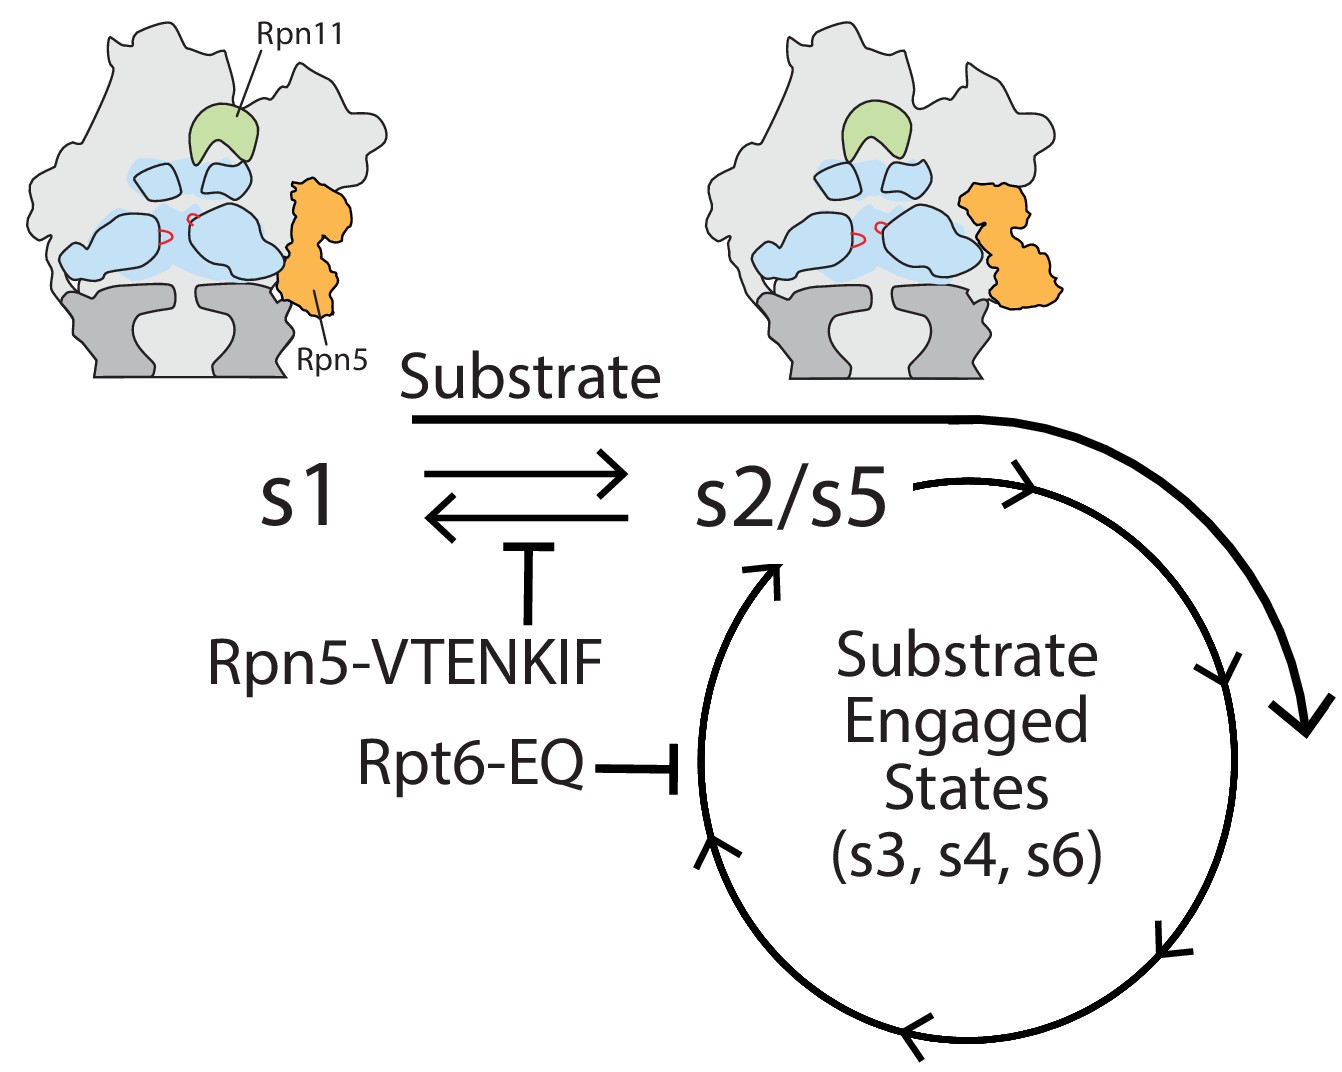
Model for coupling between proteasome conformations and substrate degradation.
In the s1 conformation, Rpn11 is offset from the central pore, which is therefore accessible for substrate entry and engagement by the AAA+ motor. In the s2/s5 and substrate-engaged states of the proteasome, Rpn11 is coaxially aligned with the continuous processing channel and obstructs the entrance to the AAA+ motor, inhibiting access for substrates that are not yet engaged. Insertion of a substrate’s flexible initiation region in the s1 state induces the transition to substrate-engaged conformations. Rpn5-VTENKIF and Rpt6-EQ mutations bias the conformational landscape away from the s1 state, either by destabilizing s1 or trapping substrate-engaged-like states through ATPase inhibition, and therefore interfere with substrate engagement.
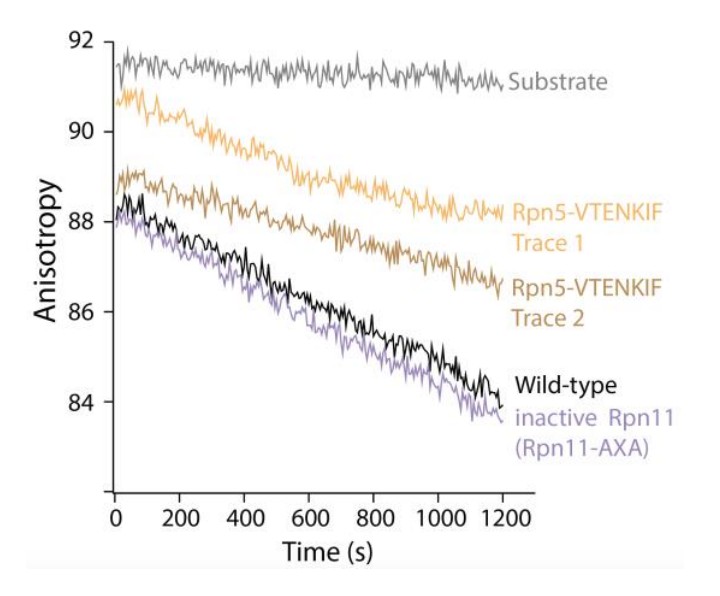
Author response image 1
Tables
Key resources table
| Reagent type (species) or resource | Designation | Source or reference | Identifiers | Additional information |
|---|---|---|---|---|
| Recombinant DNA reagent | pET-Duet Rpn1, Rpn2, Rpn13 | (Beckwith et al., 2013) | pAM81 | |
| Recombinant DNA reagent | pACYC-Duet RIL Nas6, Hsm3, Rpn14, Nas2 | (Beckwith et al., 2013) | pAM83 | |
| Recombinant DNA reagent | pCOLA FLAG-Rpt1, Rpt2, His6-Rpt3, Rpt5, Rpt6, Rpt4 | (Beckwith et al., 2013) | pAM82 | |
| Recombinant DNA reagent | pCOLA FLAG-Rpt1-191TAG, Rpt2, His6-Rpt3, Rpt5, Rpt6, Rpt4 | (Bard et al., 2019) | pAM88 | |
| Recombinant DNA reagent | Synthetase pEVOL mod. | (Bard et al., 2019) (Worden et al., 2017) | pAM183 | |
| Recombinant DNA reagent | pCOLA FLAG-Rpt1, sspB permutant-Rpt2, His6-Rpt3, Rpt5, Rpt6, Rpt4 | (Bashore et al., 2015) | pAM210 | |
| Recombinant DNA reagent | pCOLA FLAG-Rpt1-EQ, Rpt2, His6-Rpt3, Rpt5, Rpt6, Rpt4 | (Beckwith et al., 2013) | pAM204 | |
| Recombinant DNA reagent | pCOLA FLAG-Rpt1, Rpt2-EQ, His6-Rpt3, Rpt5, Rpt6, Rpt4 | (Beckwith et al., 2013) | pAM205 | |
| Recombinant DNA reagent | pCOLA FLAG-Rpt1, Rpt2, His6-Rpt3-EQ, Rpt5, Rpt6, Rpt4 | (Beckwith et al., 2013) | pAM209 | |
| Recombinant DNA reagent | pCOLA FLAG-Rpt1, Rpt2, His6-Rpt3, Rpt5, Rpt6, Rpt4-EQ | (Beckwith et al., 2013) | pAM206 | |
| Recombinant DNA reagent | pCOLA FLAG-Rpt1, Rpt2, His6-Rpt3, Rpt5-EQ, Rpt6, Rpt4 | (Beckwith et al., 2013) | pAM207 | |
| Recombinant DNA reagent | pCOLA FLAG-Rpt1, Rpt2, His6-Rpt3, Rpt5, Rpt6-EQ, Rpt4 | (Beckwith et al., 2013) | pAM208 | |
| Recombinant DNA reagent | pCOLA MBP-HRV3C-Rpt1, Rpt2, His6-HRV3C-Rpt3, Rpt5, Rpt6-EQ, Rpt4 | This study | pAM214 | This plasmid encodes HRV3C cleavable affinity tags to make tagless recombinant base. |
| Recombinant DNA reagent | His6-Ubp6 | (Bashore et al., 2015) | pAM211 | |
| Recombinant DNA reagent | His6-Ubp6 C118A | (Bashore et al., 2015) | pAM212 | |
| Recombinant DNA reagent | MGCS-titin I27 V15P(lysineless)-ssrA-1K-35 amino acid tail including PPPY and His6 | (de la Peña et al., 2018) | pAM213 | |
| Recombinant DNA reagent | titin I27V13P/V15P(lysineless)-PPPY-ssrA-1K-35 amino acid tail containing ssrA | (Bard et al., 2019) | pAM94 | |
| Recombinant DNA reagent | titin I27V15P(lysineless)-PPPY-ssrA-1K-35 amino acid tail | (Bard et al., 2019) | pAM91 | |
| Recombinant DNA reagent | titin I27 (lysineless)-PPPY-ssrA-1K-35 amino acid tail | (Bard et al., 2019) | pAM93 | |
| Recombinant DNA reagent | His6-thrombin-N1-G3P(lysineless)−1 K-54 amino acid tail including ssrA, PPPY, C-terminal lysineless StrepII tag. | (Myers et al., 2018) | pAM77 | |
| Recombinant DNA reagent | His6-SUMO-Ub4 | (Bard et al., 2019) | pAM102 | |
| Recombinant DNA reagent | pET lid wild-type (Rpn5, MBP-HRV3C-Rpn6, Rpn8, Rpn11, Rpn9) | (Bard et al., 2019) | pAM85 | |
| Recombinant DNA reagent | pET lid VTENKIF (Rpn5-VTENKIF, MBP-HRV3C-Rpn6, Rpn8, Rpn11, Rpn9) | This study | pAM203 | This plasmid encodes a cleavable MBP tag on Rpn6 and is used to make tagless Rpn5-VTENKIF lid. |
| Recombinant DNA reagent | pCOLA (His6-HRV3C-Rpn12, Rpn7, Rpn3) | (Bard et al., 2019) | pAM86 | |
| Recombinant DNA reagent | pACYC Sem1, Hsp90 | (Lander et al., 2012) | pAM80 | |
| Recombinant DNA reagent | pRS305 His10-HRV3C-RPN5 | This study | pAM198 | This plasmid encodes an S. cerevisiae integratableRpn5 gene with endogenous promotors and a cleavable N-terminal histidine tag on Rpn5. |
| Recombinant DNA reagent | pRS305 His10-HRV3C-rpn5-vtenkif-aaaaaaa | This study | pAM199 | This plasmid encodes an S. cerevisiae integratable Rpn5-VTENKIF gene with endogenous promotors and a cleavable N-terminal histidine tag on Rpn5. |
| Recombinant DNA reagent | pRS305 3 × FLAG-HRV3C-RPN5 | This study | pAM200 | This plasmid encodes an S. cerevisiae integratable Rpn5 gene with endogenous promotors and a cleavable N-terminal FLAG tag on Rpn5. |
| Recombinant DNA reagent | pRS305 3 × FLAG-HRV3C-rpn5-vtenkif-aaaaaaa | This study | pAM201 | This plasmid encodes an S. cerevisiae integratable Rpn5-VTENKIF gene with endogenous promotors and a cleavable N-terminal FLAG tag on Rpn5. |
| Recombinant DNA reagent | pRS316 RPN6 promoter-RPN5-RPN5 terminator | This study | pAM202 | This plasmid encodes the Rpn5 ORF with a Rpn6 promotor and Rpn5 terminator on anS. cerevisiae counter-selectable, non-integrating plasmid. |
| Strain, strain background E. coli | BL21(DE3) | Thermofisher | Cat#C601003 | |
| Strain, strain background S. cerevisiae | MATa ade2-1 his3-11,15 leu2-3,112 trp1-1 ura3-1 can1-100 bar1 PRE1::PRE1−3 × FLAG(KANMX6) | (Beckwith et al., 2013) | yAM54 | |
| Strain, strain background S. cerevisiae | MATa ade2-1, his3-11,15, LEU2::His10-HRV3C-RPN5, trp1-1, ura3-1, can1-100, RPN11::RPN11-3XFLAG (HIS3) | This study | yAM99 | This strain bears pAM198 integrated at LEU2 in an 3X-FLAG Rpn11 background. |
| Strain, strain background S. cerevisiae | MATa ade2-1, his3-11,15, LEU2::His10-HRV3C-rpn5-vtenkif-aaaaaaa, trp1-1, ura3-1, can1-100, RPN11::RPN11-3XFLAG (HIS3) | This study | yAM100 | This strain bears pAM199 integrated at LEU2 in an 3X-FLAG Rpn11 background. |
| Strain, strain background S. cerevisiae | MATa ade2-1 his3-11,15,112 trp1-1 ura3-1 can1-100 bar1 rpn5∆::NATMX6, pRS316-promoter-RPN6-RPN5-terminator-RPN6 | This study | yAM96 | This strain has endogenous Rpn5 deleted and replaced with NATMX6 with pAM202 as a covering plasmid in a W303 background. |
| Strain, strain background S. cerevisiae | MATa ade2-1 his3-11,15 trp1-1 ura3-1 can1-100 bar1 rpn5∆::NATMX6, LEU2::3 × FLAG-HRV3C-RPN5 | This study | yAM97 | This strain bears pAM200 integrated at LEU2 in a yAM96 background. |
| Strain, strain background S. cerevisiae | MATa ade2-1 his3-11,15 trp1-1 ura3-1 can1-100 bar1 rpn5∆::NATMX6, LEU2::3 × FLAG-HRV3C-rpn5-vtenkif-aaaaaaa | This study | yAM98 | This strain bears pAM201 integrated at LEU2 in a yAM96 background. |
| Antibody | Polyclonal rabbit anti-Rpn5 | Abcam | Cat#ab79773 | Dilution (1:5000) |
| Antibody | Polyclonal rabbit anti-Nas6 | Abcam | Cat#ab91447 | Dilution (1:5000) |
| Antibody | Monoclonal Goat anti-rabbit IgG-HRP | Bio-Rad | 170–6515 | Dilution (1:10000) |
| Peptide, recombinant protein | Fluorescein-HHHHHHLPETGG | Genscript | Custom ordered | |
| Peptide, recombinant protein | Bovine Serum Albumin | Sigma Aldrich | Cat#A9418 | |
| Software | UCSF Chimera | UCSF | https://www.cgl.ucsf.edu/chimera/ | |
| Software | Origin Pro | Origin Lab | https://www.originlab.com/ | |
| Software | ImageQuant | GE | ImageQuant TL 8.1 | |
| Chemical compound | Cy3 DBCO | Click Chemistry Tools | Cat#A140 | |
| Chemical compound | Fluorescein-5-maleimide | ThermoFisher | Cat#62245 | |
| Chemical compound | Cy5 Maleimide | Lumiprobe | Cat#23380 | |
| Chemical compound | 4-azido-L-phenylalanine | Amatek Chemical | Cat#A-7137 | |
| Chemical compound | 1,10-phenanthroline | Sigma Aldrich | Cat#P9375 |
Additional files
Download links
A two-part list of links to download the article, or parts of the article, in various formats.
Downloads (link to download the article as PDF)
Open citations (links to open the citations from this article in various online reference manager services)
Cite this article (links to download the citations from this article in formats compatible with various reference manager tools)
Specific lid-base contacts in the 26s proteasome control the conformational switching required for substrate degradation
eLife 8:e49806.
https://doi.org/10.7554/eLife.49806


