EphrinB2 regulates VEGFR2 during dendritogenesis and hippocampal circuitry development
- University of Frankfurt, Germany
- Max Planck Institute for Brain Research, Germany
- Heidelberg University, Germany
- Cardio-Pulmonary Institute (CPI), Germany
Figures
Figure 1 with 1 supplement
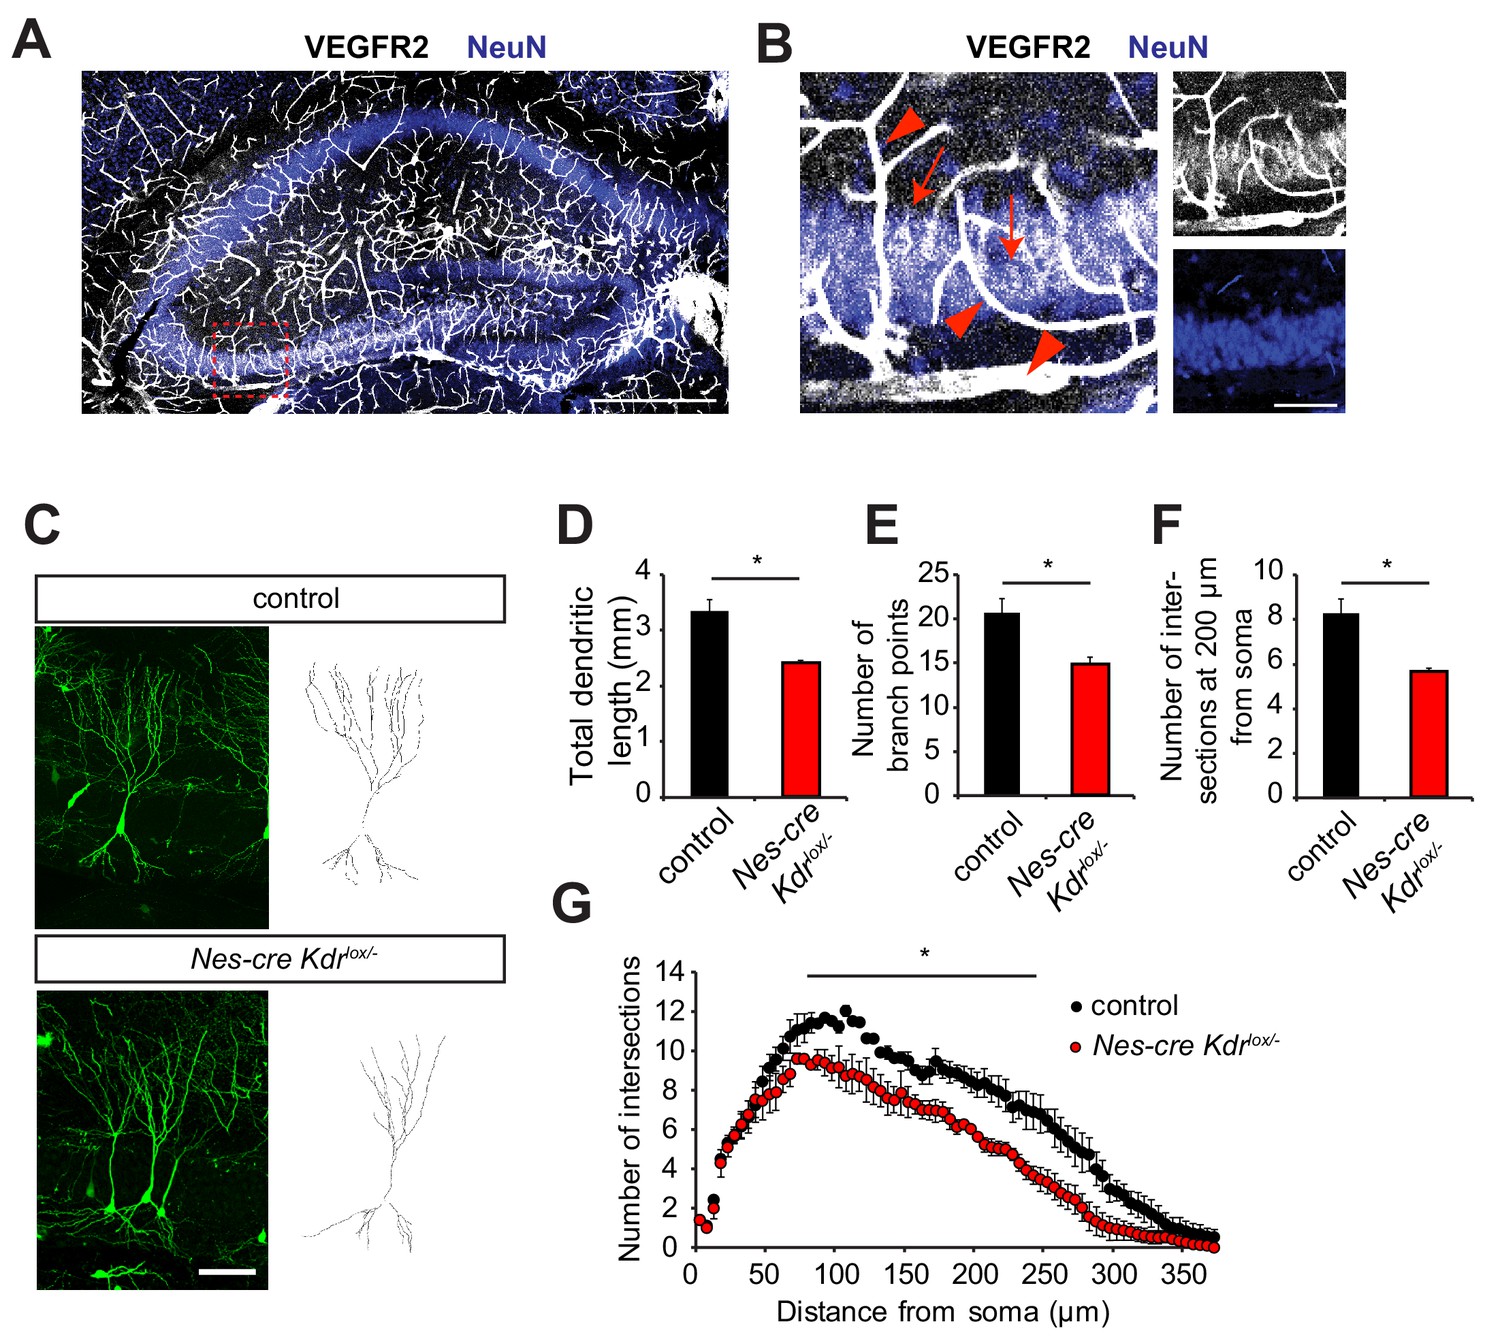
Nervous system specific VEGFR2 loss affects dendritic development in CA3 pyramidal neurons.
(A, B) Immunostainings for VEGFR2 revealed high levels of the receptor in the vessels (arrowheads) and double-labeling with the neuronal marker NeuN shows that the receptor is also expressed in pyramidal neurons (arrows) of the CA3 region in P10 hippocampus. Scale bar: A: 500 µm, B: 100 µm. (C–G) Nervous system specific deletion of VEGFR2 results in reduced dendritic arborization of CA3 pyramidal neurons. Nes-cre Kdrlox/- mice were crossed to Thy1-GFP transgenic mice to visualize whole morphology of pyramidal neurons. Z-projections of confocal images and the corresponding outlined tracings from CA3 neurons of P10 Nes-cre Kdrlox/- and control littermates are shown in (C). Total dendritic length (D), number of branch points (E) and the number of dendrites at 200 µm from the soma (F) were significantly reduced in Nes-cre Kdrlox/- mice compared to control littermates. 3D Sholl analysis of confocal z-stacks shows reduced branching and dendritic complexity of Nes-cre Kdrlox/- CA3 pyramidal neurons (G). Scale bar: 100 µm. n = 3 mice per genotype; SEM; *p<0.05.
Figure 1—figure supplement 1
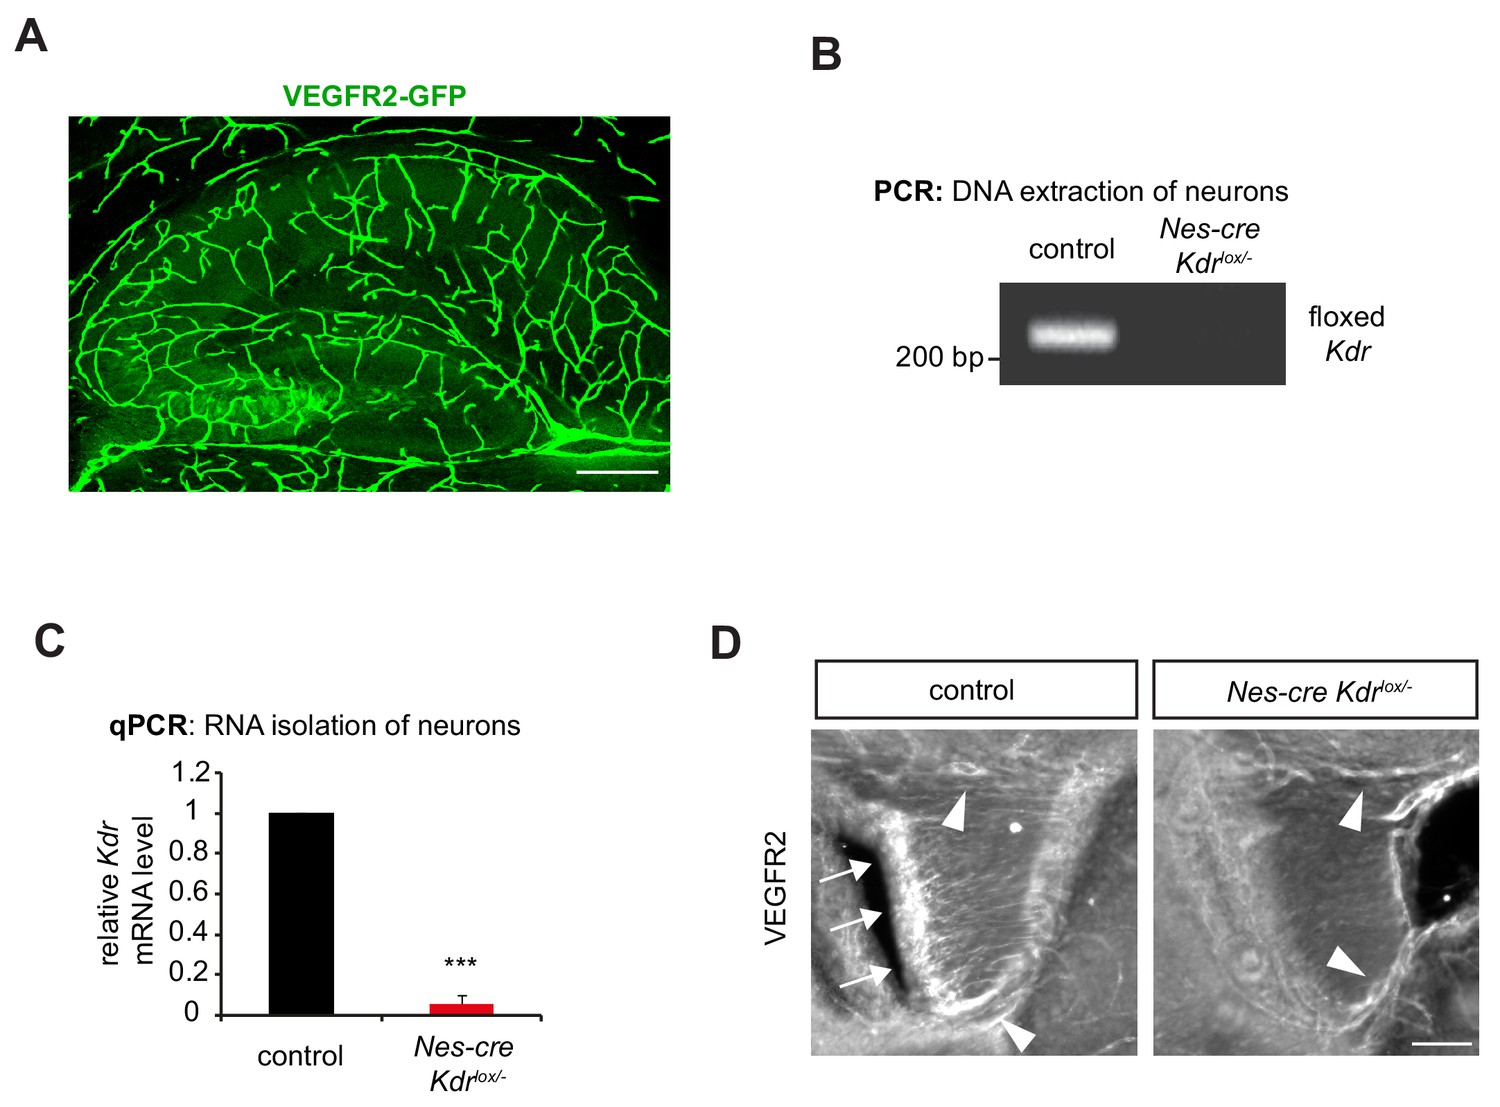
Characterization of a conditional, nervous system specific VEGFR2 knockout mouse.
(A) Kdr-GFP knockin mouse line shows GFP expression in the vessels and CA3 neurons in P8 hippocampus. Scale bar: 200 µm. (B) PCR analysis confirmed the efficient recombination of the floxed Kdr exon one in DNA extracted from Nes-cre Kdrlox/- cultured neurons. (C) Quantitative RT-PCR shows a nearly complete elimination of Kdr mRNA isolated from knockout neurons (n = 3 experiments). Data are represented as mean ± SEM. ***p<0.001. (D) Immunohistochemistry for VEGFR2 shows the absence of the signal in fibers of the fimbria of Nes-cre Kdrlox/- mice (arrows), whereas the vessels normally express the receptor (arrowheads). Scale bar: 100 µm.
Figure 2 with 2 supplements
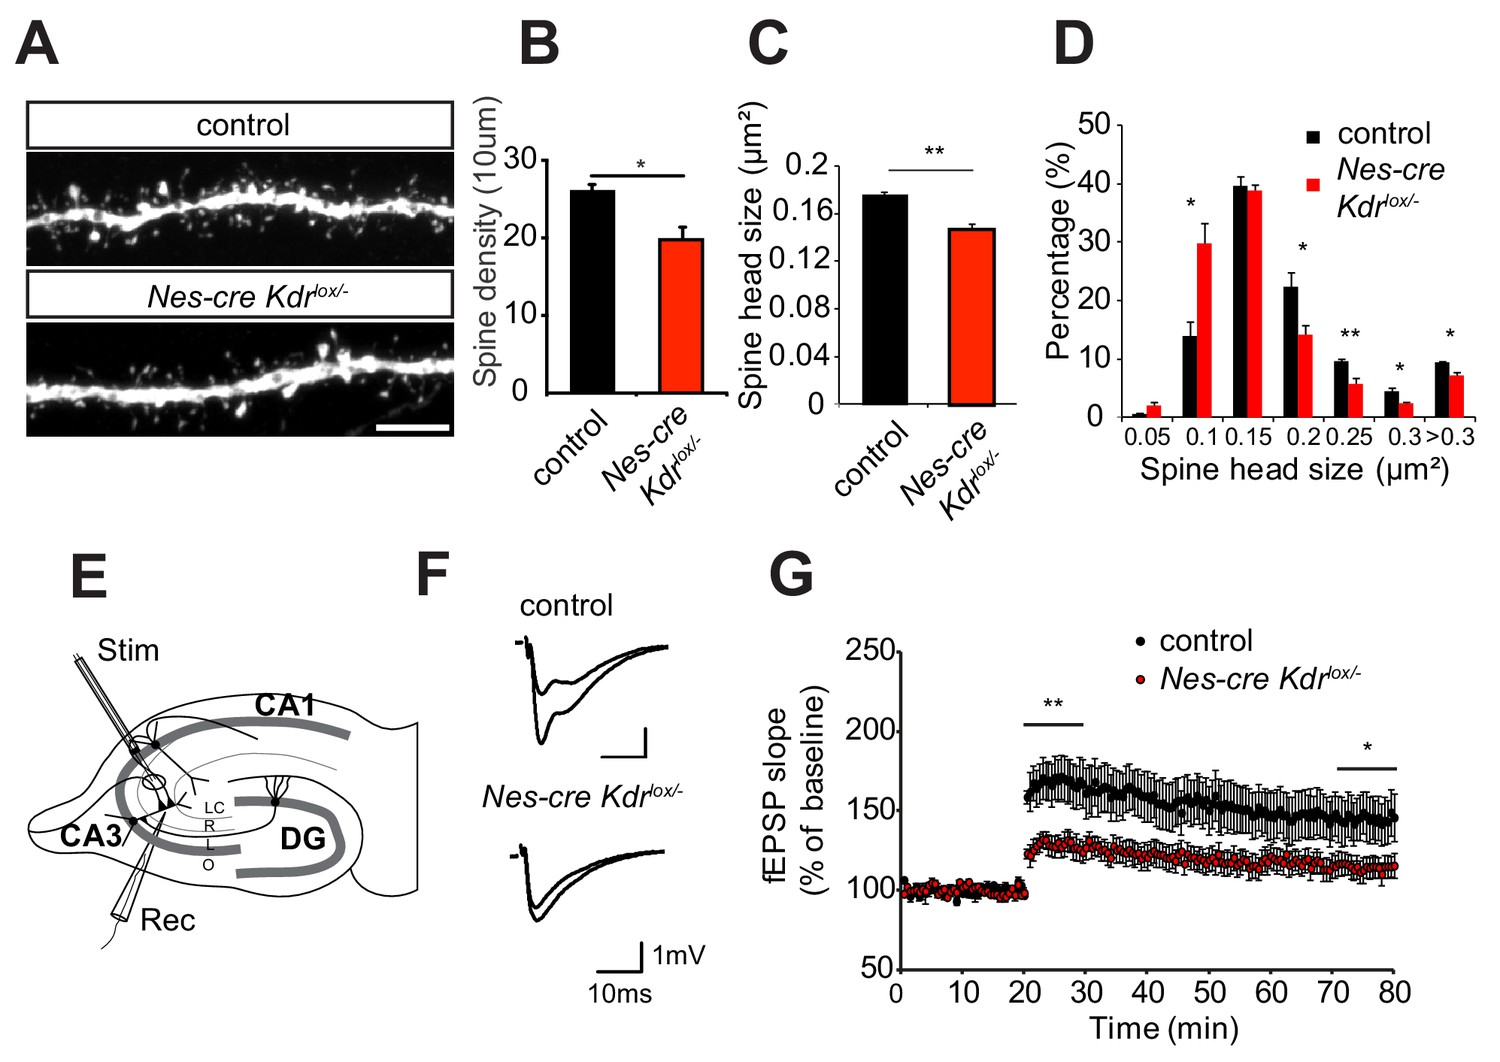
Nervous system specific VEGFR2 loss leads to defects in spine morphology and synaptic plasticity.
(A–D) Spine morphogenesis is affected after VEGFR2 loss. Representative images of dendritic segments acquired in the CA3 stratum radiatum of P15 Nes-cre Kdrlox/- and control littermates crossed to Thy1-GFP transgenic animals. Scale bar: 5 µm (A). Spine density (B) and spine head size (C) is significantly reduced in the Nes-cre Kdrlox/- mice. The distribution of spine head area in Nes-cre Kdrlox/- show a high proportion of smaller spines (<0.15 µm2) compared to control littermates where larger spine heads (>0.15 µm2) are more frequent (n = 3 mice per genotype; SEM; *p<0.05, **p<0.01) (D). (E–G) LTP at the associational/commissural fibers is affected after VEGFR2 neuronal loss. Schematic representation of the hippocampal slice preparation and electrode placement in the CA3 region to activate associational/commissural fibers. Abbreviations: Stim: Stimulation electrode; Rec: Recording electrode; LC: stratum lacunosum-moleculare; R: stratum radiatum; L: stratum lucidum; O: stratum oriens (E). Representative fEPSP traces showing potentiation in hippocampal slices from Nes-cre Kdrlox/- mice and control littermates (upper trace: averaged first 5 min of baseline, lower trace: averaged last 5 min, stimulus artifacts were removed) (F). Theta burst stimulation (TBS) of associational/commissural fibers from CA3 neurons was used to induce LTP after 20 min baseline. Field-EPSP responses were recorded in stratum radiatum of CA3 region. (Control n = 7 mice (10 slices), Nes-cre Kdrlox/- n = 6 mice (13 slices)). Already immediately after LTP induction with the TBS protocol, fEPSPs are significantly reduced in Nes-cre Kdrlox/- mice as compared to littermate controls. The reduced LTP in Nes-cre Kdrlox/- is persistent through the 60 min LTP recording period (SEM, *p<0.05, **p<0.01) (G).
Figure 2—figure supplement 1
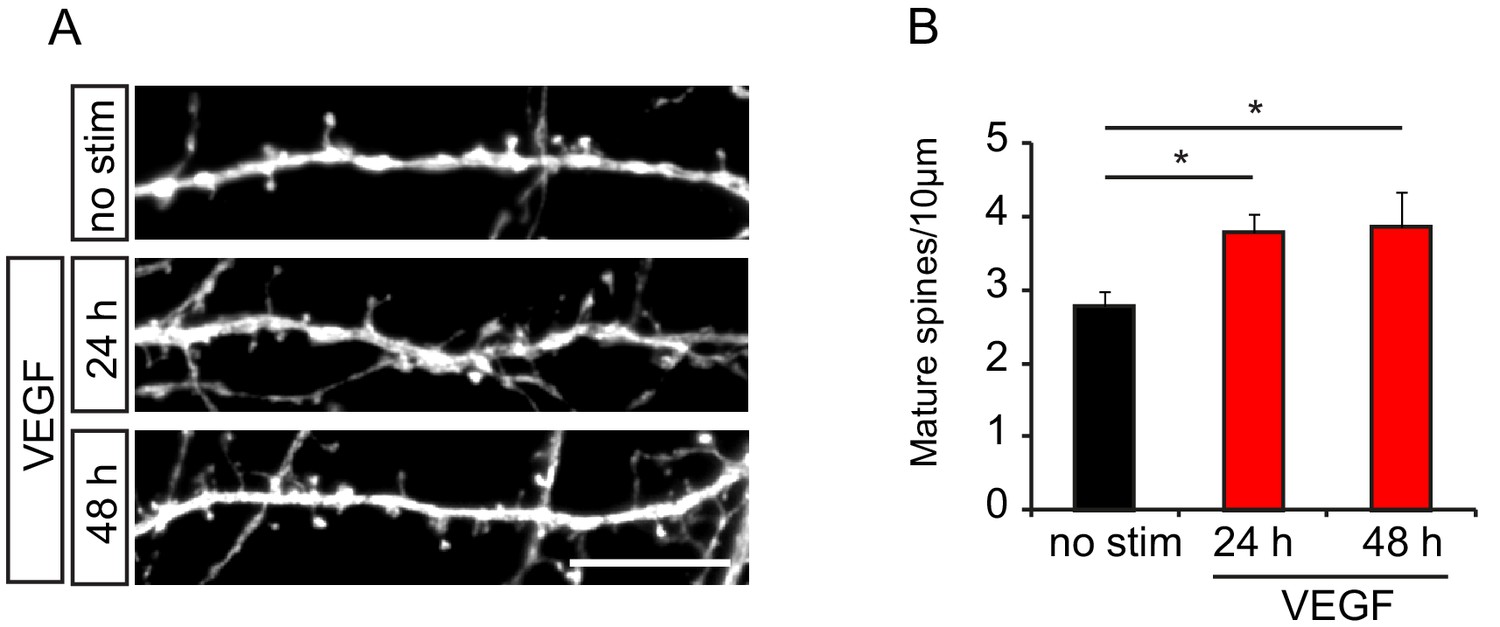
VEGF induces maturation of dendritic spines.
(A–B) Primary hippocampal neurons of wild type mice (E17.5) were transfected with EGFP at 11 DIV, stimulated with VEGF and spine morphology was analyzed at 14 DIV. Representative images of dendritic stretches of EGFP transfected, unstimulated or VEGF-stimulated wild type neurons are shown in (A). Quantification revealed a significant increase in the number of mature spines after 24 hr and 48 hr VEGF stimulation (B) (n = 3 experiments). Scale bar: 5 μm. Data are represented as mean ± SEM. *p<0.05.
Figure 2—figure supplement 2
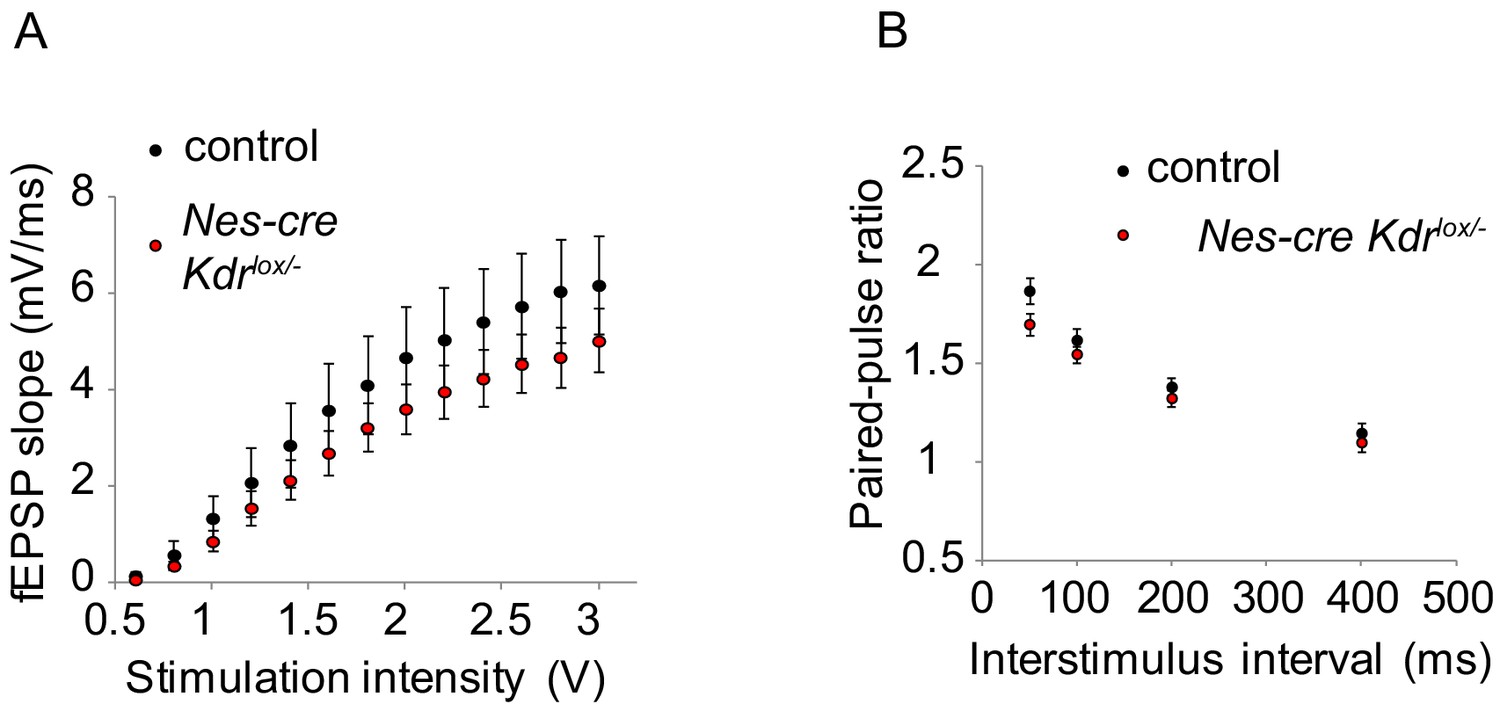
Neuronal VEGFR2 loss does not affect basal synaptic transmission or paired-pulse facilitation.
(A) Basal synaptic transmission was assessed by input-output measurements and revealed no Input-output measurements at various stimulation intensities revealed no significant differences between control and Nes-cre Kdrlox/- fEPSP responses, although a tendency towards lower responses in Nes-cre Kdrlox/- slices was observed. (B) Paired-pulse facilitation was measured to assess presynaptic release probability, but no significant differences were found between control and Nes-cre Kdrlox/- mice.
Figure 3
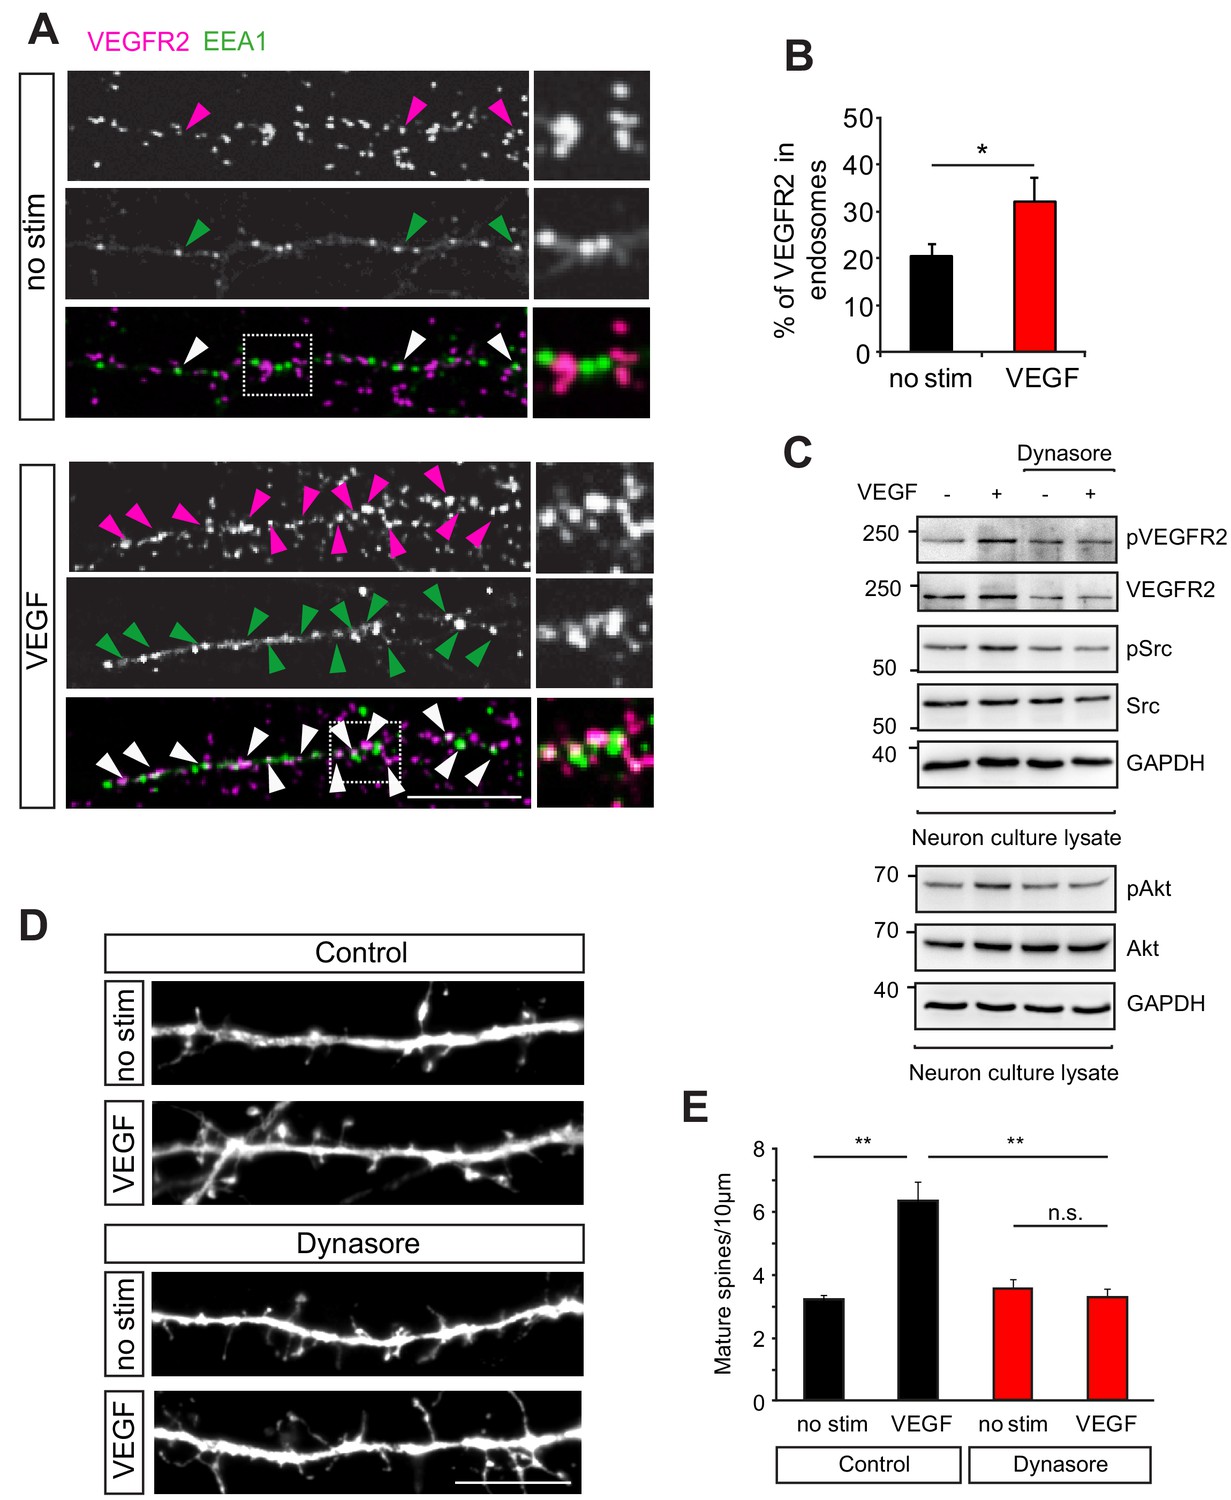
VEGFR2 internalization is required for its function in hippocampal neurons.
(A–B) Primary wild type hippocampal neurons at 14 DIV were stimulated with VEGF for 30 min and PLA was performed to increase the signal for endogenous VEGFR2. Two different antibodies, one against the VEGFR2 extracellular domain and the second recognizing an intracellular epitope were used for PLA. Magenta spots reflect the VEGFR2 localization (PLA signal) and early endosomes were labeled using the early endosomal marker EEA1 (green). Representative images showing colocalization of the VEGFR2 with the early endosomal marker EEA1 (indicated by arrowheads) (A). The percentage of VEGFR2 in the endosomal compartment was quantified by counting the PLA puncta co-localizing with EEA1 staining (n = 3 experiments, SEM, *p<0.05) (B). Scale bar: 10 µm. (C) Wild type hippocampal neurons at 14 DIV were pretreated with the dynamin-specific inhibitor dynasore to block internalization and later stimulated with VEGF. In non-treated cells, VEGF stimulation for 30 min led to phosphorylation of VEGFR2 and Src as well as Akt kinase , while treatment with dynasore led to a reduced phosphorylation of VEGFR2 and its downstream partners. (D–E) Blocking internalization abolishes VEGF-induce synapse maturation. Wild type hippocampal neuron cultures were transfected with EGFP at 11 DIV, pretreated with dynasore and stimulated with VEGF. Representative images of dendrite branches from control and dynasore-treated neurons non-stimulated and stimulated with VEGF are shown in (D). Quantification of dendritic spines showed the VEGF-induced increase in spine number in control neurons which was abolished in dynasore-treated neurons (E) (n = 3 experiments, SEM, **p<0.01, n.s. not significant) Scale bar: 10 μm.
Figure 4
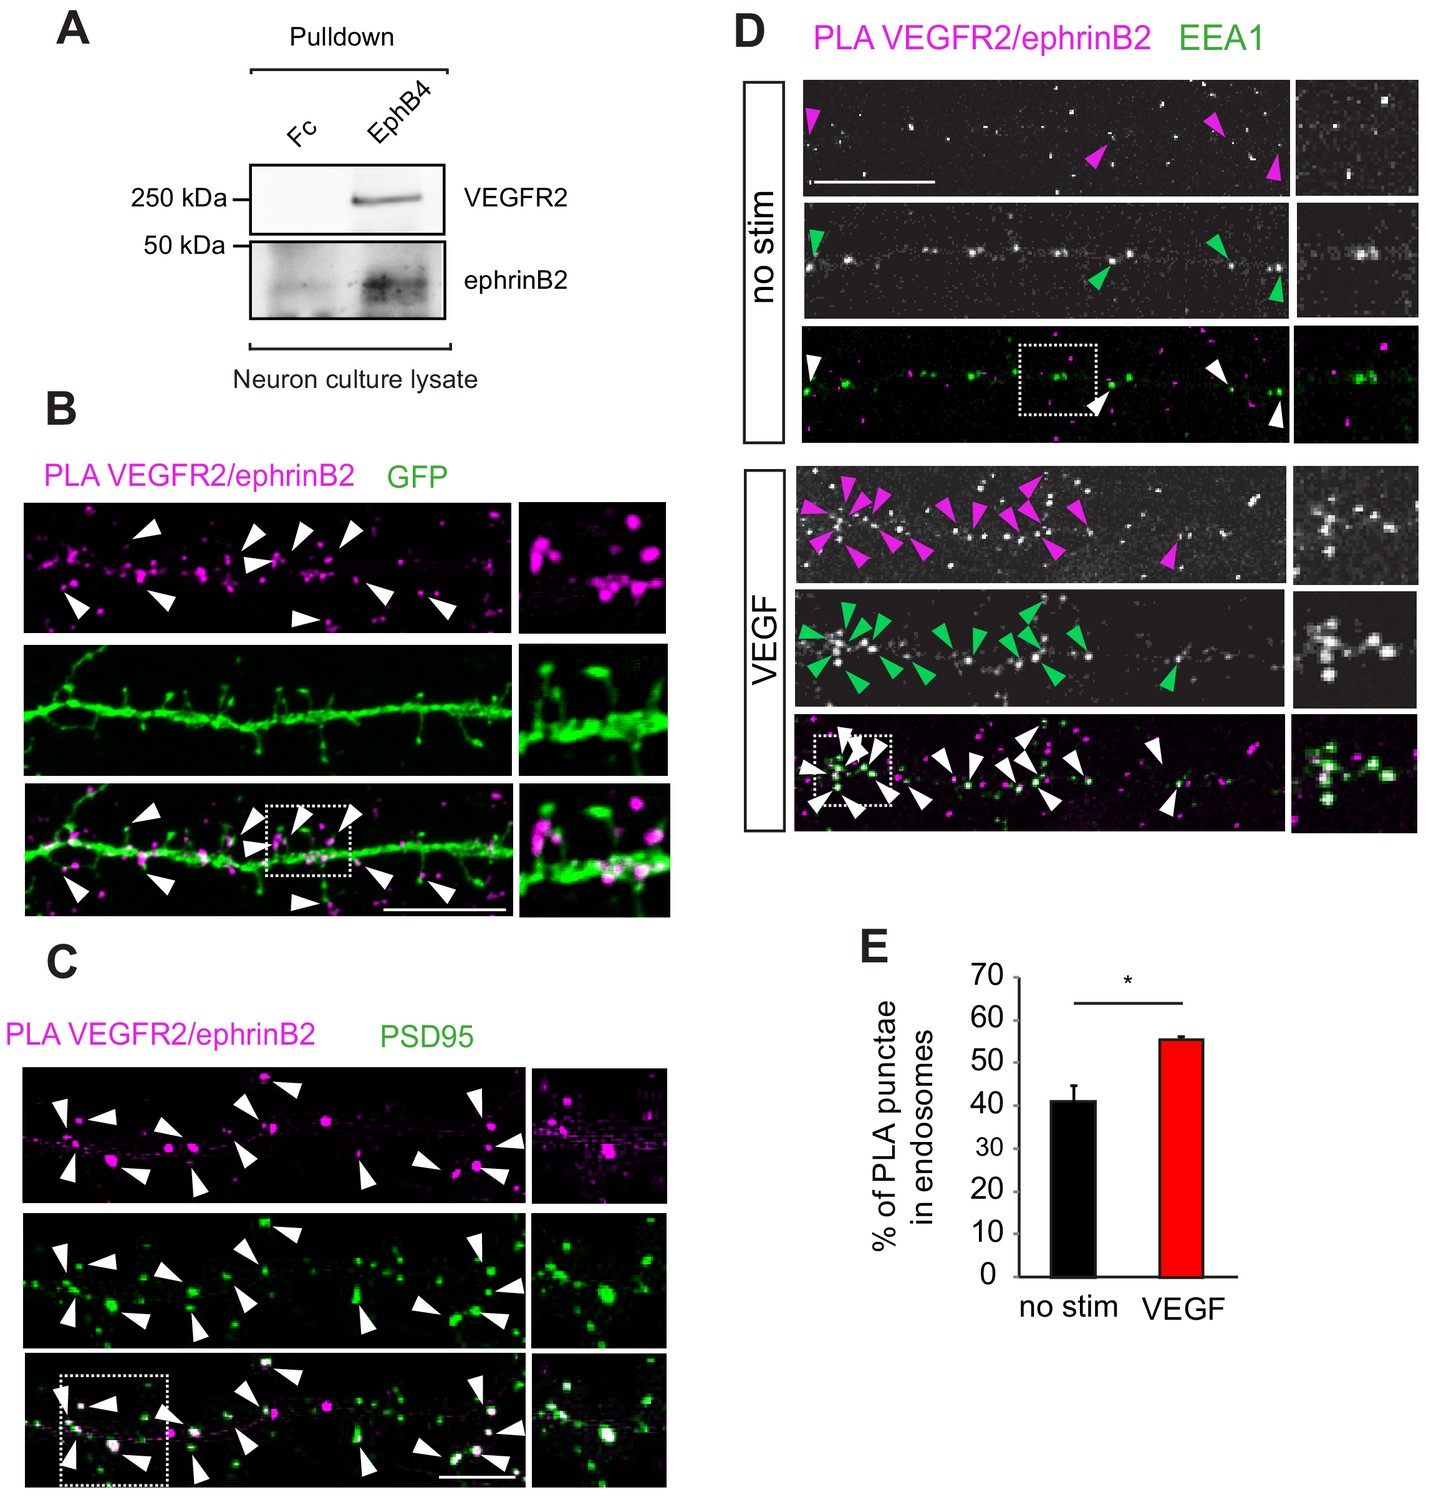
EphrinB2 interacts with VEGFR2 in hippocampal neurons.
(A) Cell lysate from primary wild type hippocampal neurons 14 DIV was used for co-immunoprecipitation. To pulldown ephrinB2, the beads were coupled with EphB4 receptor ectodomain fused to Fc (EphB4-Fc). Fc fragment served as control. Western blots performed using anti-VEGFR2 and anti-ephrinB2 antibodies show interaction of ephrinB2 and VEGFR2. (B) Wild type primary hippocampal neuron cultures were cultured for 14 DIV transfected with EGFP and proximity ligation assay (PLA) was performed using EphB4-Fc and an anti-VEGFR2 specific antibody. Magenta puncta represent amplified PLA signal and reflect the interaction between VEGFR2 and ephrinB2. PLA puncta localize to dendritic spine heads and necks labeled with EGFP (green) (indicated by arrowheads). Scale bar: 10 µm. (C) Labeling of hippocampal neuron cultures at 14 DIV with antibodies against PSD95 (green) revealed localization of the PLA signals representing the VEGFR2-ephrinB2 complex (magenta) to postsynaptic sites (indicated by arrowheads). Scale bar: 10 µm. (D–E) Primary wild type hippocampal neurons at 14 DIV were stimulated with VEGF for 30 min and PLA was performed using the EphB4-Fc and an anti-VEGFR2 specific antibody. VEGFR2-ephrinB2 complex (PLA signal, magenta) localizes to early endosomes labeled using antibodies against the early endosomal compartment protein EEA1 (green) and stimulation with VEGF leads to increased localization of the VEGFR2-ephrinB2 complex to early endosomes. Representative images are shown in (D) and quantification of the percentage of PLA puncta colocalizing with EEA1 labeled endosomes is shown in (E) (n = 3 experiments). Scale bar: 10 µm. Data are represented as mean ± SEM. *p<0.05.
Figure 5 with 1 supplement
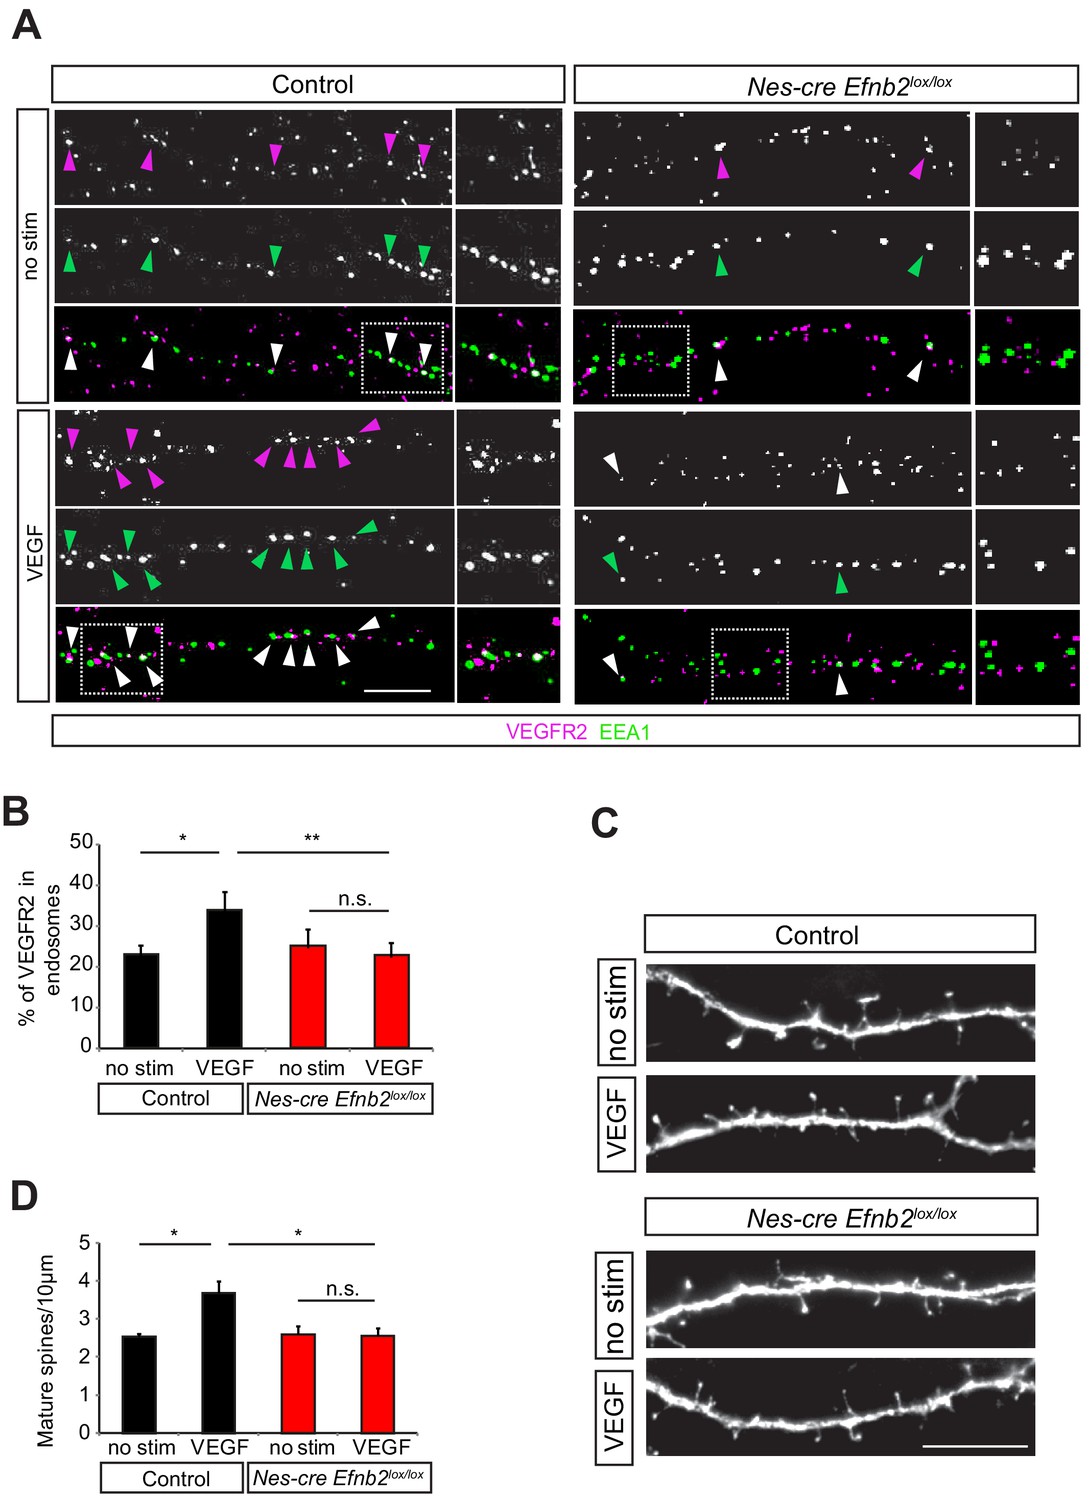
EphrinB2 is required for VEGF-induced VEGFR2 internalization and spine morphogenesis.
(A–B) Primary hippocampal neurons from control (Nes-cre negative) and Nes-cre positive Efnb2lox/lox embryos (E17.5) at 14 DIV were stimulated with VEGF for 30 min and proximity ligation assay (PLA) was performed to detect endogenous VEGFR2 as described in Figure 3. Magenta spots reflect VEGFR2 (PLA signal) and early endosomes were labeled using an anti-EEA1-antibody (green). VEGF-induced internalization of VEGFR2 in early endosomes is impaired in ephrinB2 deficient neurons as reflected by the decrease in PLA puncta colocalizing with EEA1. Representative images are shown in (A) and quantification of the percentage of PLA puncta colocalizing with EEA1 labeled endosomes is shown in (B) (n = 4 experiments). Scale bar: 10 µm. Data are represented as mean ± SEM. *p<0.05, **p<0.01, n.s., not significant. (C–D) Primary hippocampal neurons from control (Nes-cre negative) and Nes-cre positive Efnb2lox/lox embryos (E17.5) were transfected with EGFP plasmid at 11 DIV and stimulated with VEGF 24 hr before fixation at 14 DIV. The VEGF-induce maturation of spines is reduced in neurons lacking ephrinB2. Representative images of dendrite branches from control and Nes-cre Efnb2lox/lox neurons non-stimulated and stimulated with VEGF are shown in (C). Quantification of the mature spines with heads per 10 µm dendritic stretches is shown in (D) (n = 3 experiments). Scale bar: 10 µm. Data are represented as mean ± SEM. *p<0.05, n.s., not significant.
Figure 5—figure supplement 1
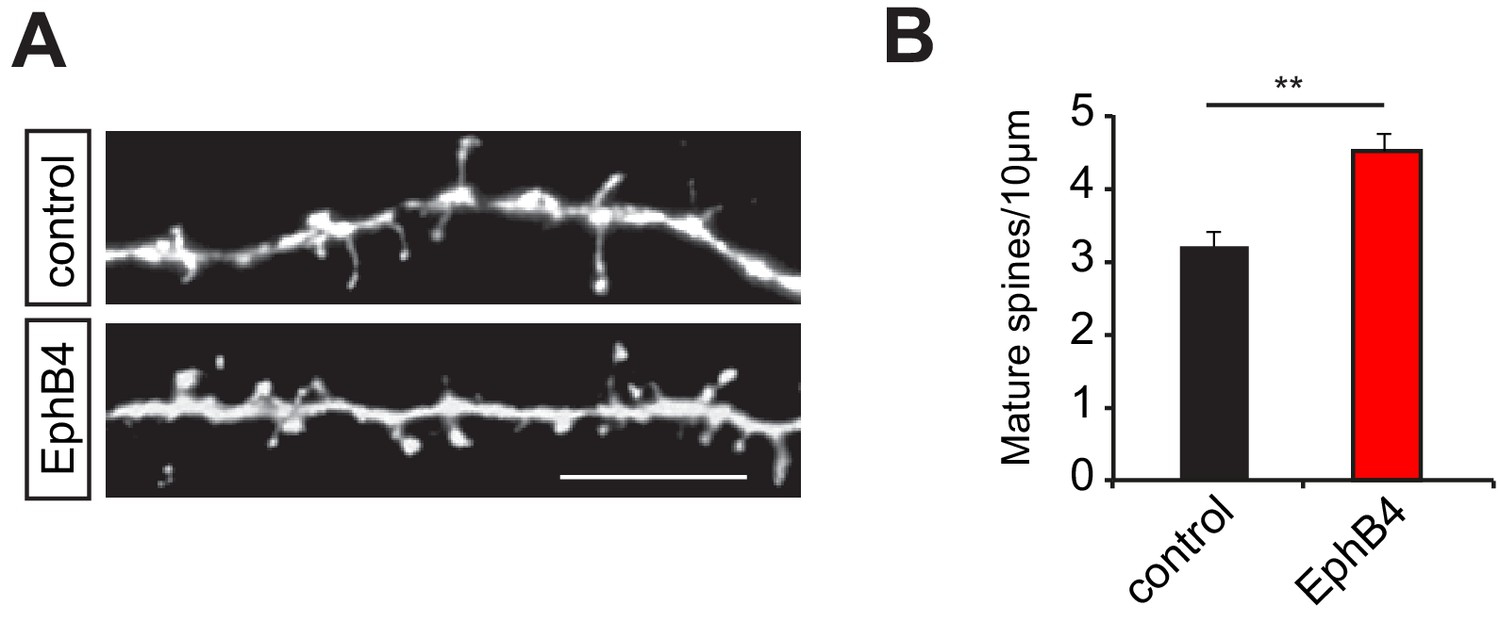
EphrinB2 activation induces maturation of dendritic spines.
(A–B) Primary wild type hippocampal neurons at 14 DIV were stimulated with EphB4-Fc and the density of mature spines with heads was analyzed. Representative dendritic stretches are shown in (E) and the quantification of mature spines with heads per 10 µm dendritic stretches is shown in (F) (n = 6 experiments) Scale bar: 10 µm. Data are represented as mean ± SEM. **p<0.01.
Figure 6 with 2 supplements
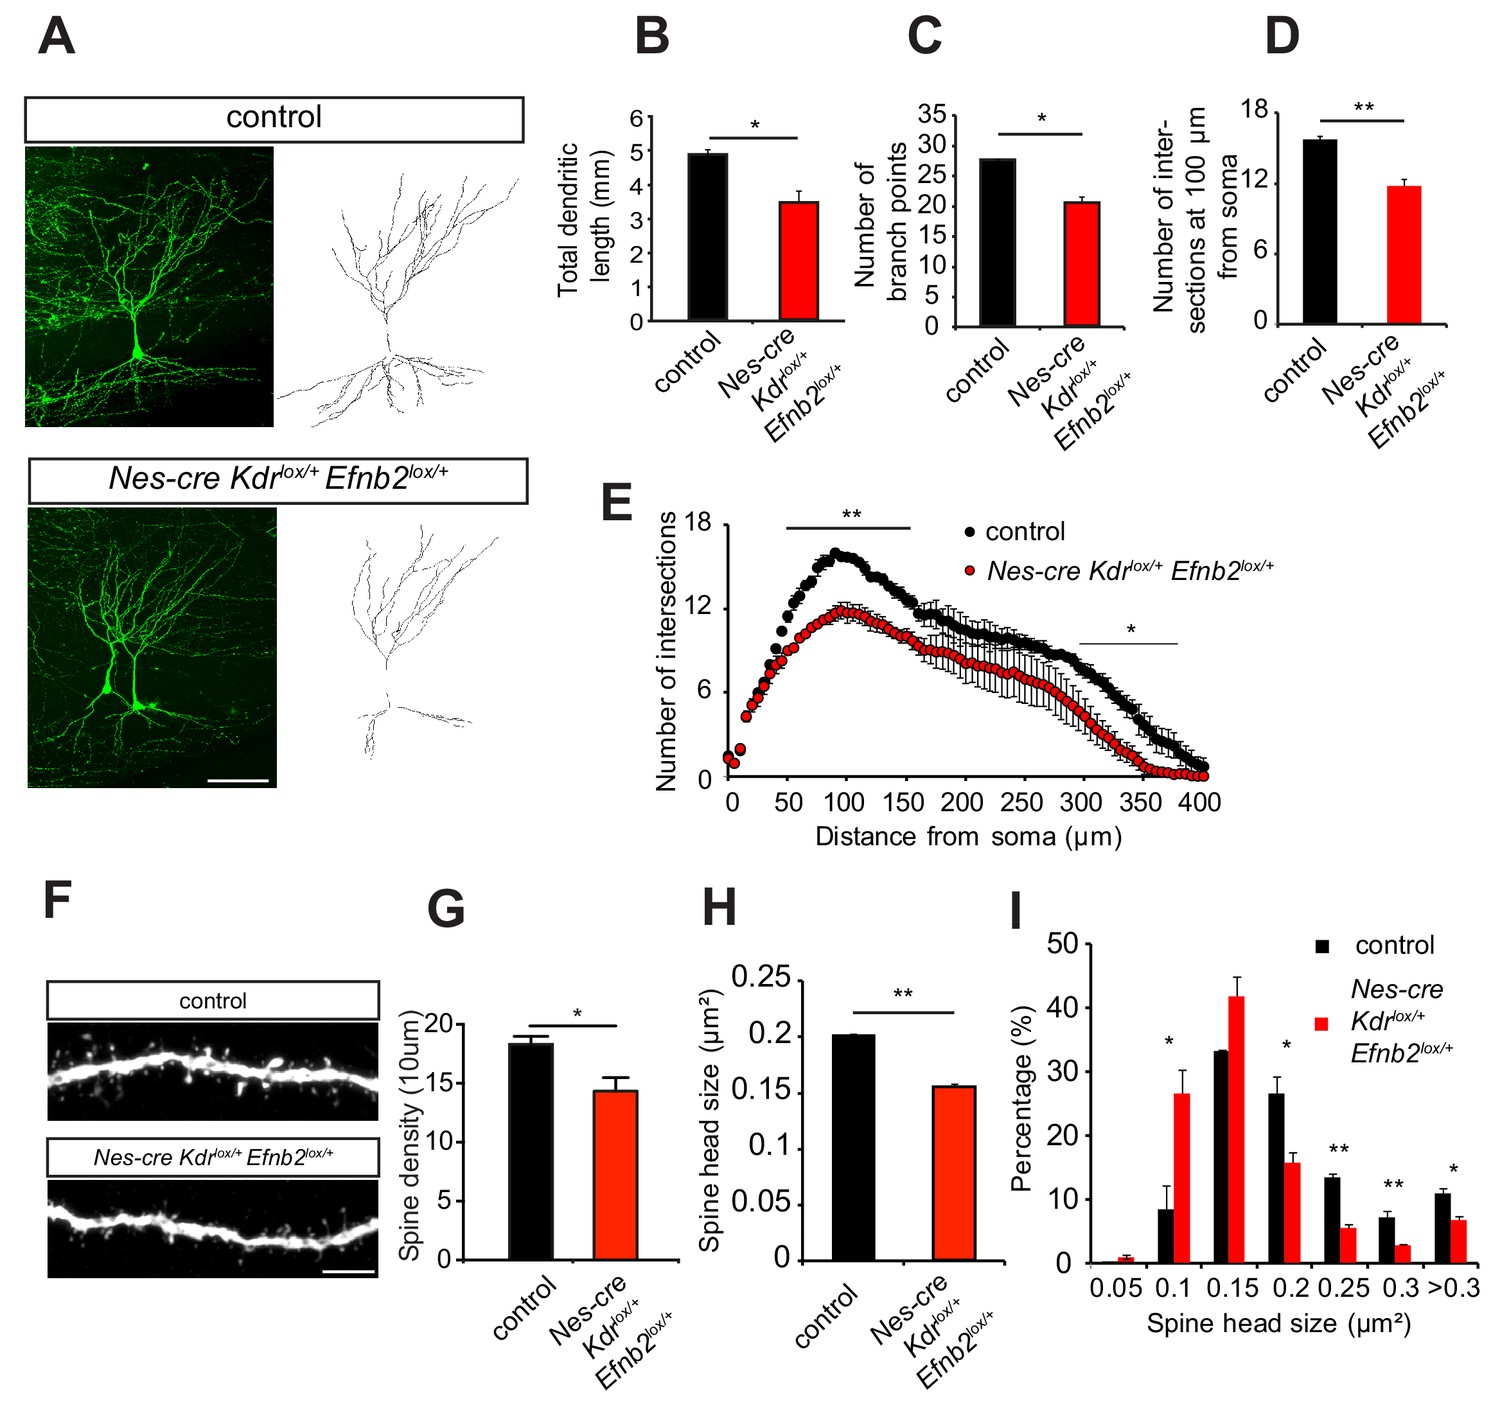
EphrinB2-VEGFR2 crosstalk is required for dendritogenesis and spine morphogenesis in vivo.
(A–E) Compound mice for ephrinB2 and VEGFR2 show reduced dendritic arborization of CA3 pyramidal neurons. Nes-cre Kdrlox/+ Efnb2lox/+ compound mice were crossed to Thy1-GFP mice to visualize whole morphology of pyramidal neurons. Maximum intensity z-projection confocal images of CA3 pyramidal neurons and the corresponding dendritic tracings of P10 Nes-cre negative control (Kdrlox/+ Efnb2lox/+) and compound mice (Nes-cre Kdrlox/+ Efnb2lox/+) are shown in (A). Total dendritic length (B), number of branch points (C) and the number of dendrites at 200 µm from the soma (D) were significantly reduced in compound mice compared to control littermates. 3D Sholl analysis of confocal z-stacks shows reduced branching and dendritic complexity in compound mice compared to control littermates (n = 3–4 mice per genotype). Scale bar: 100 µm. Data are represented as mean ± SEM; *p<0.05; **p<0.01. (F–I) Spine morphogenesis is impaired in compound mice for ephrinB2 and VEGFR2. Representative images of dendritic segments acquired in the CA3 stratum radiatum of P15 compound mice (Nes-cre Kdrlox/+ Efnb2lox/+) and Nes-cre negative control littermates (Kdrlox/+ Efnb2lox/+) both crossed to Thy1-GFP transgenic animals are shown in (F). Scale bar: 5 µm. Spine density (G) and spine head size (H) are significantly reduced in the compound mice. The distribution of spine head size in compound mice show a high proportion of smaller spines (<0.2 µm2) compared to control littermates where larger spine heads (>0.2 µm2) are more frequent (I) (n = 3–4 mice per genotype). Data are represented as mean ± SEM. *p<0.05, **p<0.01.
Figure 6—figure supplement 1
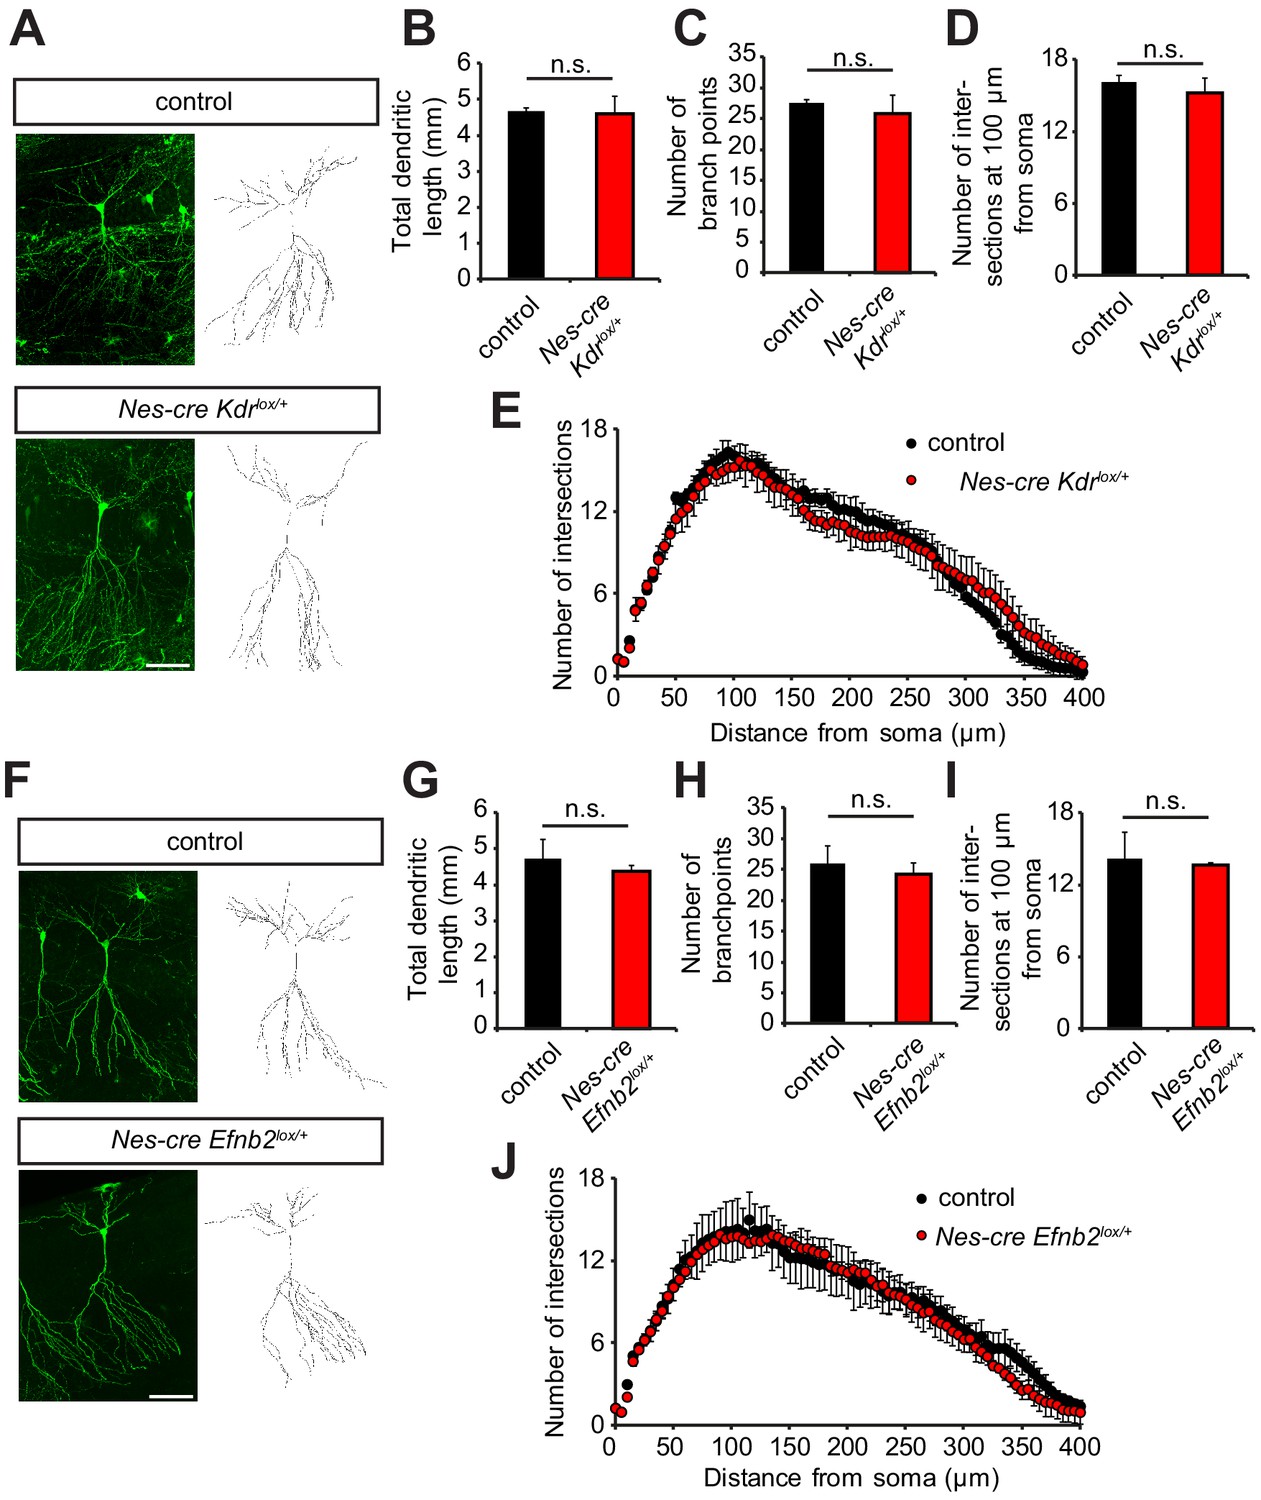
Single heterozygous ephrinB2 (Nes-cre Efnb2lox/+) or VEGFR2 (Nes-cre Kdrlox/+) mice show normal dendritic branching of CA3 pyramidal neurons.
(A) Representative confocal images and dendritic tracings of P10 Nes-cre negative control (Kdrlox/+) and VEGFR2 heterozygous mice (Nes-cre Kdrlox/+) carrying the Thy1-GFP transgene. Scale bar:100 µm (B–D) Quantification of dendritic parameters: total dendritic length (B), number of branch points (C) and number of crossings at 200 µm from soma (D). All parameters were normal in Nes-cre Kdrlox/+ mice and comparable to controls (n = 3 mice per genotype). Data are represented as mean ± SEM; n.s., not significant. (E) 3D Sholl analysis confirmed normal dendritic branching pattern in Nes-cre Kdrlox/+ mice (n = 3 mice per genotype). Data are represented as mean ± SEM (F) Representative confocal images of Thy1-GFP positive CA3 pyramidal neurons in ephrinB2 heterozygous mice (Nes-cre Efnb2lox/+) with their Nes-cre negative control (Efnb2lox/+) littermates at P10. Scale bar:100 µm (G–I) The quantified dendritic parameters (total dendritic length (G), number of branch points (H) and number of crossings at 200 µm from soma (I)) did not show any significant differences between Nes-cre Efnb2lox/+ and control mice (n = 3 mice per genotype). Data are represented as mean ± SEM; n.s., not significant. (J) 3D sholl analysis revealed a similar complexity of the dendritic tree in Nes-cre Efnb2lox/+ and control mice (n = 3 mice per genotype). Data are represented as mean ± SEM.
Figure 6—figure supplement 2
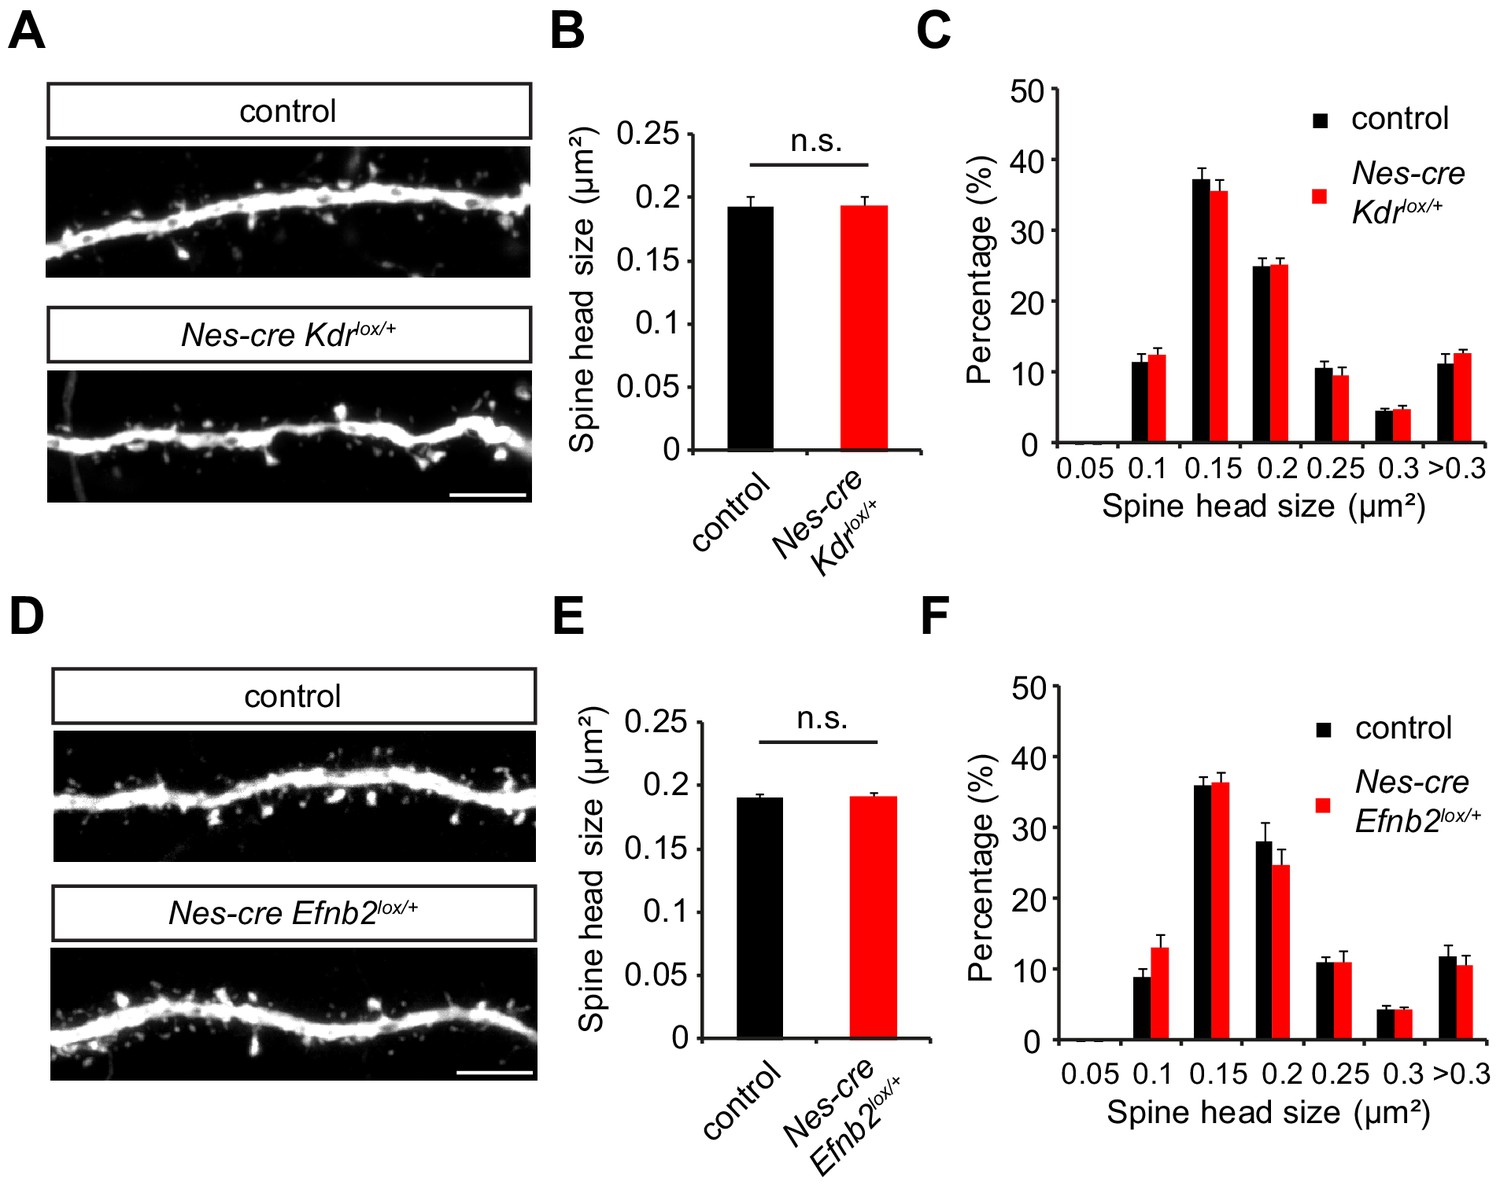
Spine morphology of CA3 pyramidal neurons is normal in mice heterozygous for VEGFR2 (Nes-cre Kdrlox/+) or ephrinB2 (Nes-cre Efnb2lox/+).
(A) Representative confocal images of dendritic stretches in stratum radiatum of P15 CA3 pyramidal neurons in Thy1-GFP positive Nes-cre Kdrlox/+ and Nes-cre negative control (Kdrlox/+) mice. Scale bar: 5 µm (B) Dendritic spine head size of Nes-cre Kdrlox/+ mice is comparable to control littermates (n = 3 mice per genotype). Data are represented as mean ± SEM; n.s., not significant. (C) Distribution of spine head sizes showing no differences between Nes-cre Kdrlox/+ mice and control littermates (n = 3 mice per genotype). Data are represented as mean ± SEM. (D) Dendritic stretches in stratum radiatum of P15 CA3 pyramidal neurons of a Thy1-GFP positive Nes-cre Efnb2lox/+ and Nes-cre negative control (Efnb2lox/+) mice. Scale bar: 5 µm. (E) No significant differences in spine head size were observed between Nes-cre Efnb2lox/+ and their control littermates (n = 3 mice per genotype). Data are represented as mean ± SEM; n.s., not significant. (F) Spine head size distribution is normal in Nes-cre Efnb2lox/+ mice (n = 3 mice per genotype). Data are represented as mean ± SEM.
Figure 7 with 1 supplement
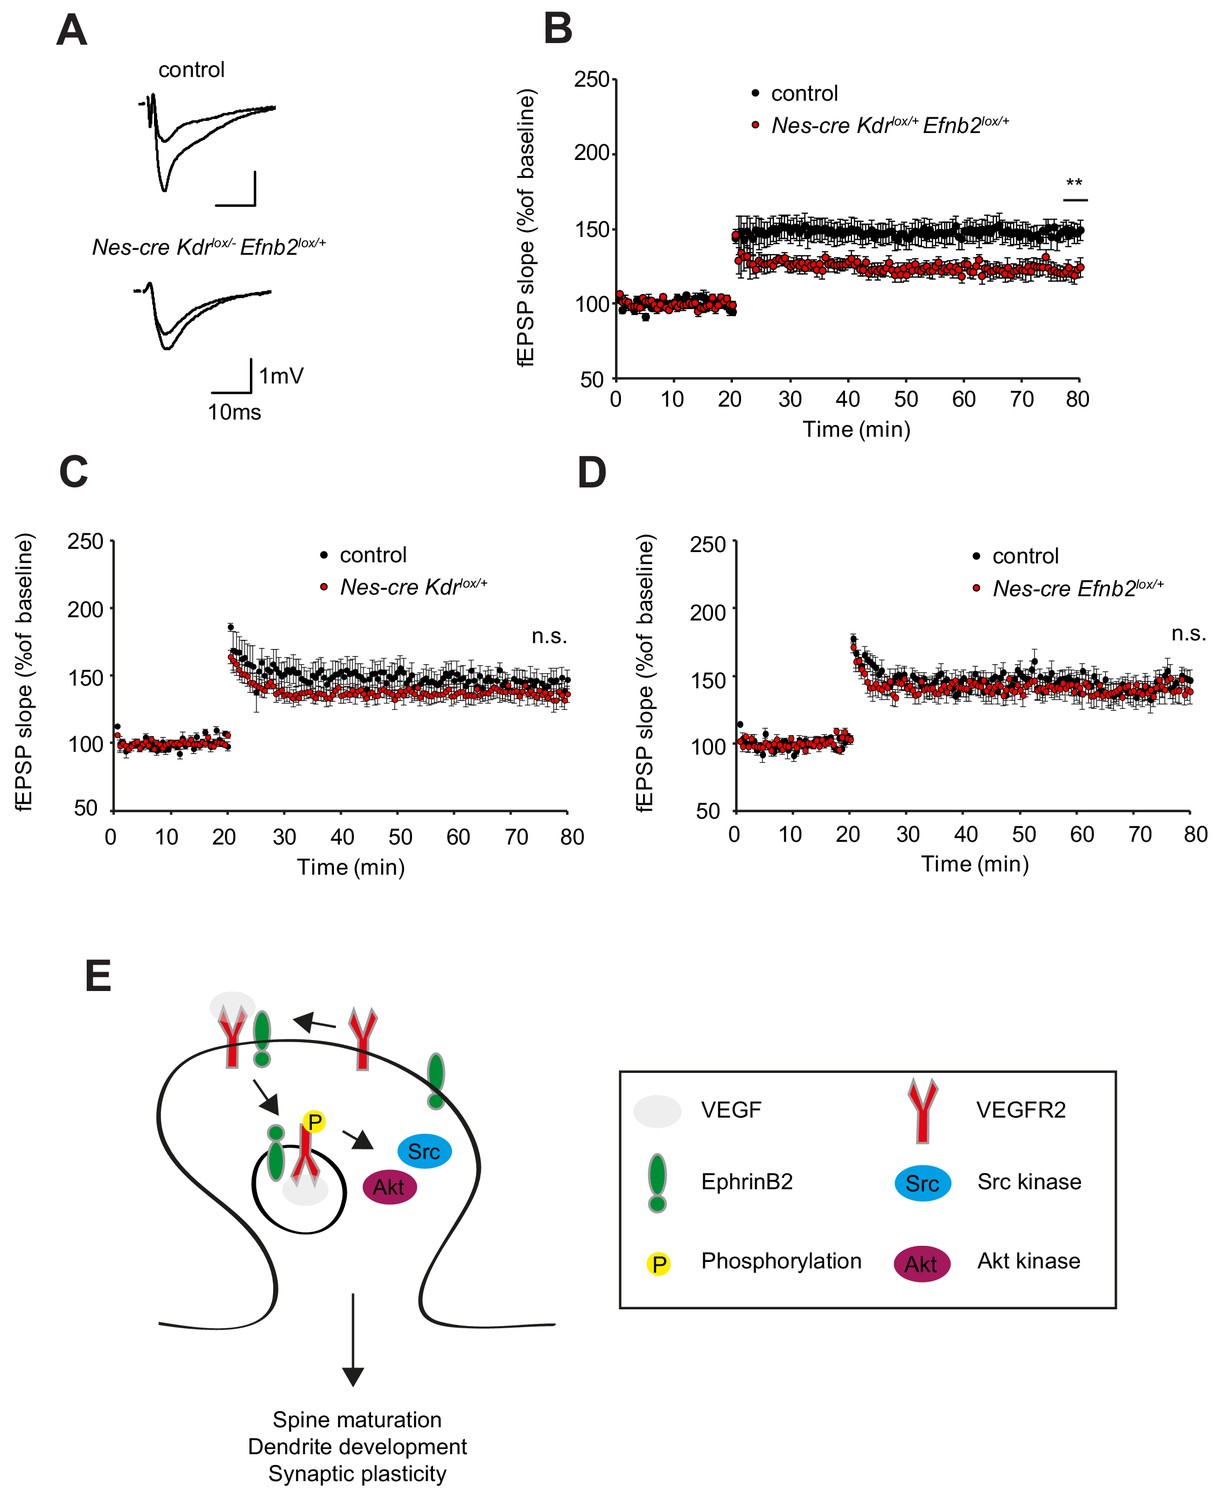
EphrinB2-VEGFR2 crosstalk is required for synaptic plasticity in vivo.
(A–B) Compound mice for ephrinB2 and VEGFR2 show reduced LTP at associational/commissural pathway. Representative fEPSP traces showing potentiation in hippocampal slices from compound mice (Nes-cre Kdrlox/+ Efnb2lox/+) and Nes-cre negative control littermates (Kdrlox/+ Efnb2lox/+) upper trace: averaged first 5 min of baseline, lower trace: averaged last 5 min, stimulus artifacts were removed) are shown in (A). Long-term potentiation was induced by applying a theta burst stimulation protocol (TBS) at associational/commissural fibers while recording in stratum radiatum of CA3 neurons. LTP is significantly reduced in compound mice as compared to littermate controls (B) (Control n = 5 mice (10 slices), Compound mice n = 4 mice (10 slices)). Data are represented as mean ± SEM. **p<0.01 (C–D) LTP, recorded in the CA3 region of single heterozygous mice for either Nes-cre Kdrlox/+ or Nes-cre Efnb2lox/+, is comparable to their corresponding Nes-cre negative littermate controls. (Control n = 6 mice (nine slices), Nes-cre Kdrlox/+ mice n = 5 mice (11 slices) (C); Control n = 5 mice (10 slices), Nes-cre Efnb2lox/+ mice n = 6 mice (10 slices) (D). Data are represented as mean ± SEM; n.s., not significant. (E) Model of action of VEGFR2 in CA3 pyramidal neurons. VEGF induces the clustering of VEGFR2 and ephrinB2 complexes at the postsynaptic sites and the internalization of such complexes to activate signaling downstream of VEGFR2 involving Src kinases and Akt phosphorylation. These events are required for proper dendritic arborization, spine maturation and synaptic plasticity at the hippocampal associational/commissural CA3 pathway.
Figure 7—figure supplement 1
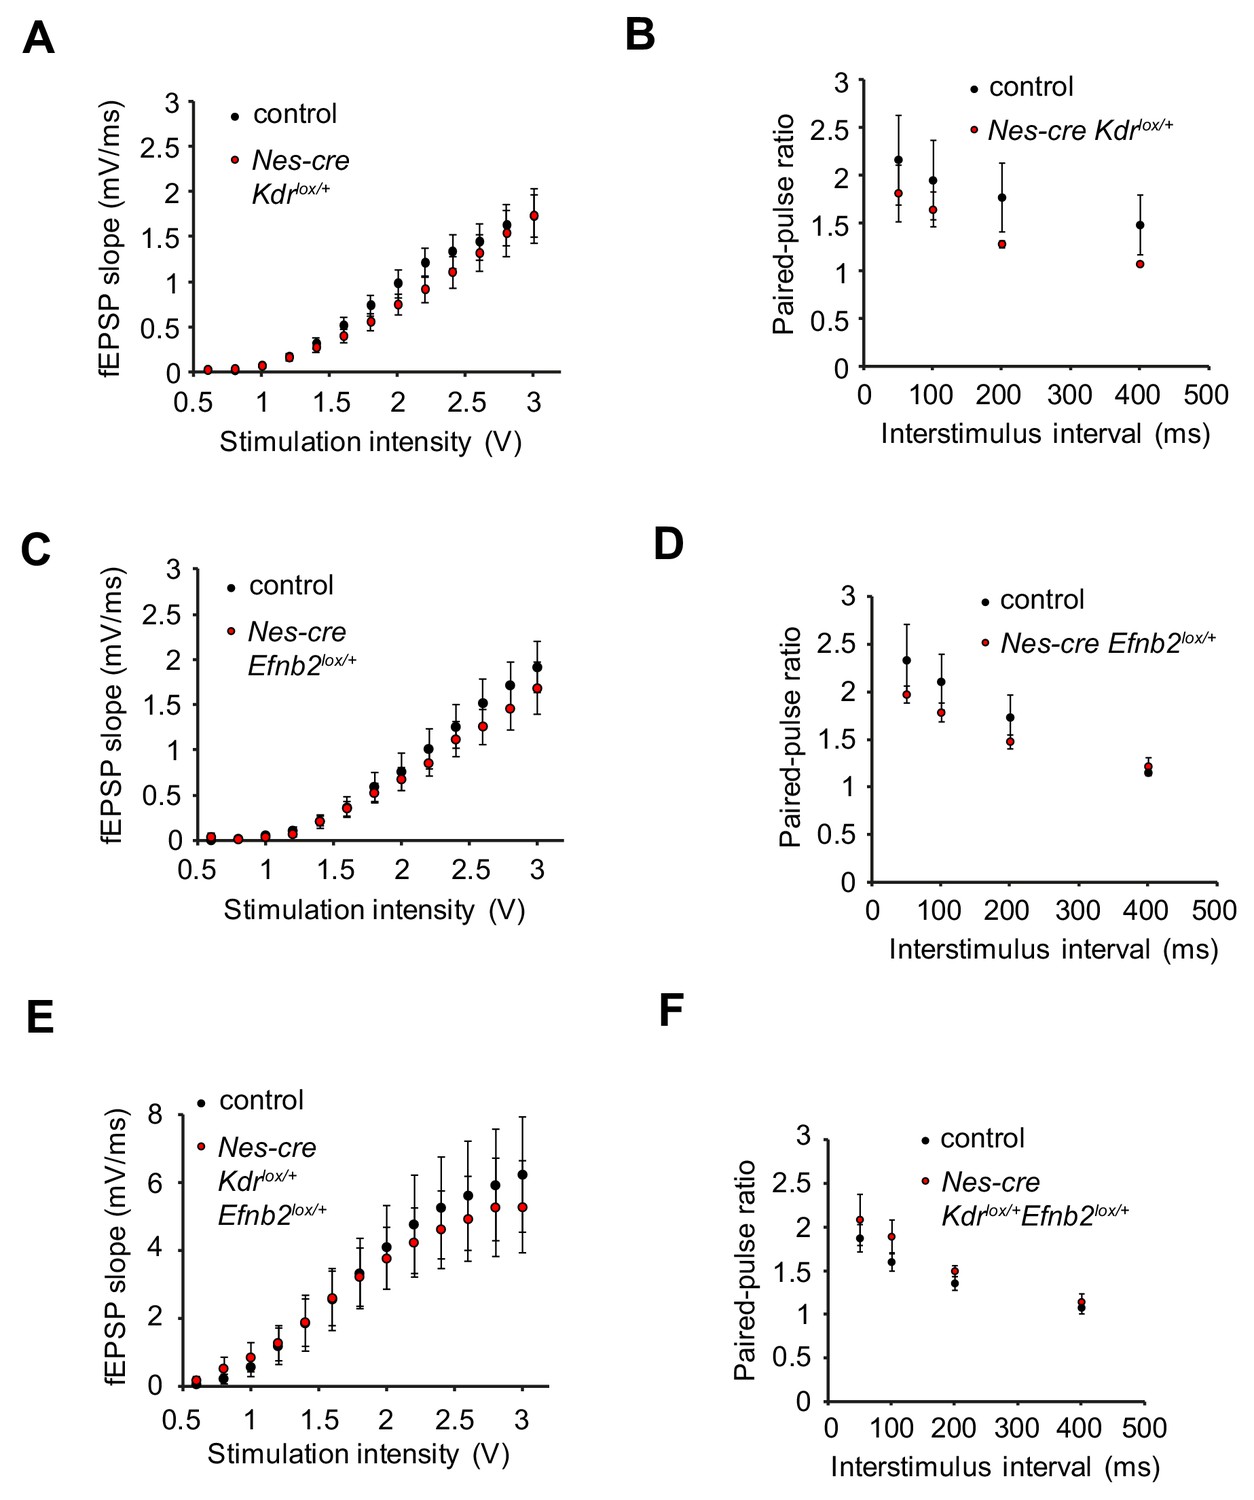
Basal synaptic transmission and paired-pulse facilitation is normal in single heterozygous for VEGFR2 (Nes-cre Kdrlox/+) or ephrinB2 (Nes-cre Efnb2lox/+) and VEGFR2-ephrinB2 compound mice (Nes-cre Kdrlox/+ Efnb2lox/+).
(A, C, E) Input-output curves are similar in single heterozygous (Nes-cre Kdrlox/+ (A) and Nes-cre Efnb2lox/+ (C) as well as in the compound mice (Nes-cre Kdrlox/+ Efnb2lox/+) (E), when compared to their corresponding controls. Data are represented as mean ± SEM. (B, D, F) Measurement of paired-pulse facilitation revealed no significant differences between slices of single heterozygous mice (Nes-cre Kdrlox/+ (B) and Nes-cre Efnb2lox/+ (D) or compound mice (Nes-cre Kdrlox/+ Efnb2lox/+) (F) and their respective controls. Data are represented as mean ± SEM.
Additional files
Download links
A two-part list of links to download the article, or parts of the article, in various formats.
Downloads (link to download the article as PDF)
Open citations (links to open the citations from this article in various online reference manager services)
Cite this article (links to download the citations from this article in formats compatible with various reference manager tools)
EphrinB2 regulates VEGFR2 during dendritogenesis and hippocampal circuitry development
eLife 8:e49819.
https://doi.org/10.7554/eLife.49819


