Principles of self-organization and load adaptation by the actin cytoskeleton during clathrin-mediated endocytosis
- University of California, Berkeley, United States
- University of California, San Diego, United States
Figures
Figure 1 with 4 supplements
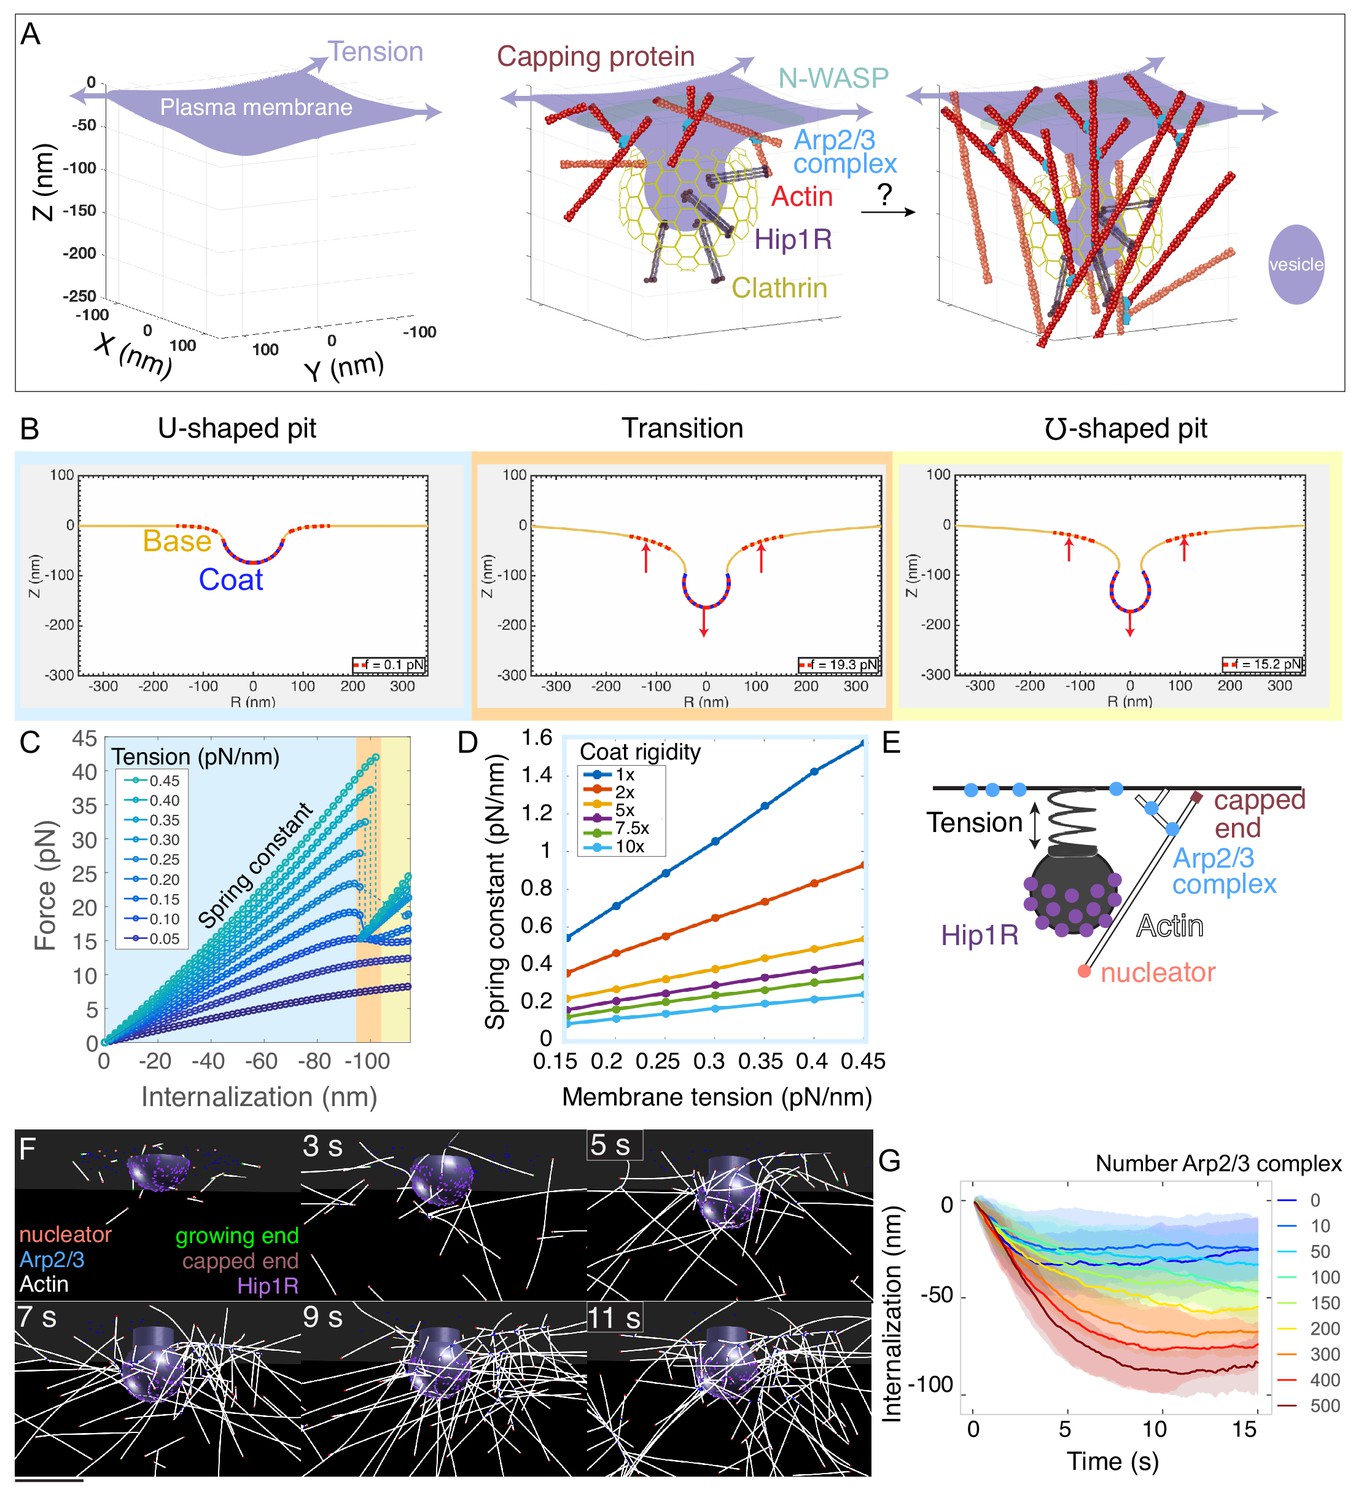
Multiscale modeling shows that a minimal branched actin network is sufficient to internalize endocytic pits against physiological membrane tension.
(A) Schematic of a section of the cell’s plasma membrane being internalized during mammalian endocytosis depicts plasma membrane deformation against membrane tension (purple arrows) countered by the clathrin coat (yellow) and the actin cytoskeleton (red). (B) Shape of the membrane and pit internalization from continuum mechanics simulations of the endocytic pit experiencing axial (Z) forces corresponding to simplified actin forces. To begin with, the plasma membrane (yellow) is deformed by a coat with preferred curvature that expands in area until the pit stalls. A net force (red arrows) is applied downward from the coat and upward into the base of the endocytic pit (red dotted lines). In this simulation, membrane tension was 0.2 pN/nm, and the coated area was rigid (2400 pN·nm). (C) Force versus pit internalization relationships for different values of membrane tension. Internalization is defined as the pit displacement in Z. Shading delineates linear force-internalization regime (blue); ‘transition point’ from U to omega shape (orange); ‘omega-shaped’ regime where the neck is narrower than the pit diameter and the force required for internalization is lower than at the transition point (for tensions > 0.1 pN/nm) (yellow). Color matches the three snapshots in B. Parameters are given in Supplementary files 1 and 2. (D) Resistance of pit to internalization versus membrane tension. Resistance (spring constant) is defined as absolute value of slope in C for the ‘U-shaped’ region. Each curve is calculated for a different value of membrane rigidity (where 1x = 320 pN·nm, the rigidity of the uncoated plasma membrane). (E) Computational model of branched actin filament polymerization coupled to endocytic pit internalization. An internalizing endocytic pit is modeled as a sphere with a neck attached to a flat surface by a spring. Active Arp2/3 complex (blue) is distributed in a ring around the base of the pit. An actin nucleation protein (pink) generates an actin filament (white), which polymerizes, stalls under load, and is stochastically capped (red). Arp2/3 complexes bind to the sides of actin filaments and nucleate new filaments at a 77-degree angle, creating new branches. Linker Hip1R (purple) is embedded in the pit and binds to actin filaments. Model parameters are given in Supplementary file 3. (F) Graphical output of the simulations from Cytosim (Nedelec and Foethke, 2007) at 2 s intervals. Scale bar: 100 nm. (G) Pit internalization over simulated time as a function of the number of available molecules of Arp2/3 complex. Average of 16 simulations per condition. Shaded bars are standard deviations.
Figure 1—figure supplement 1
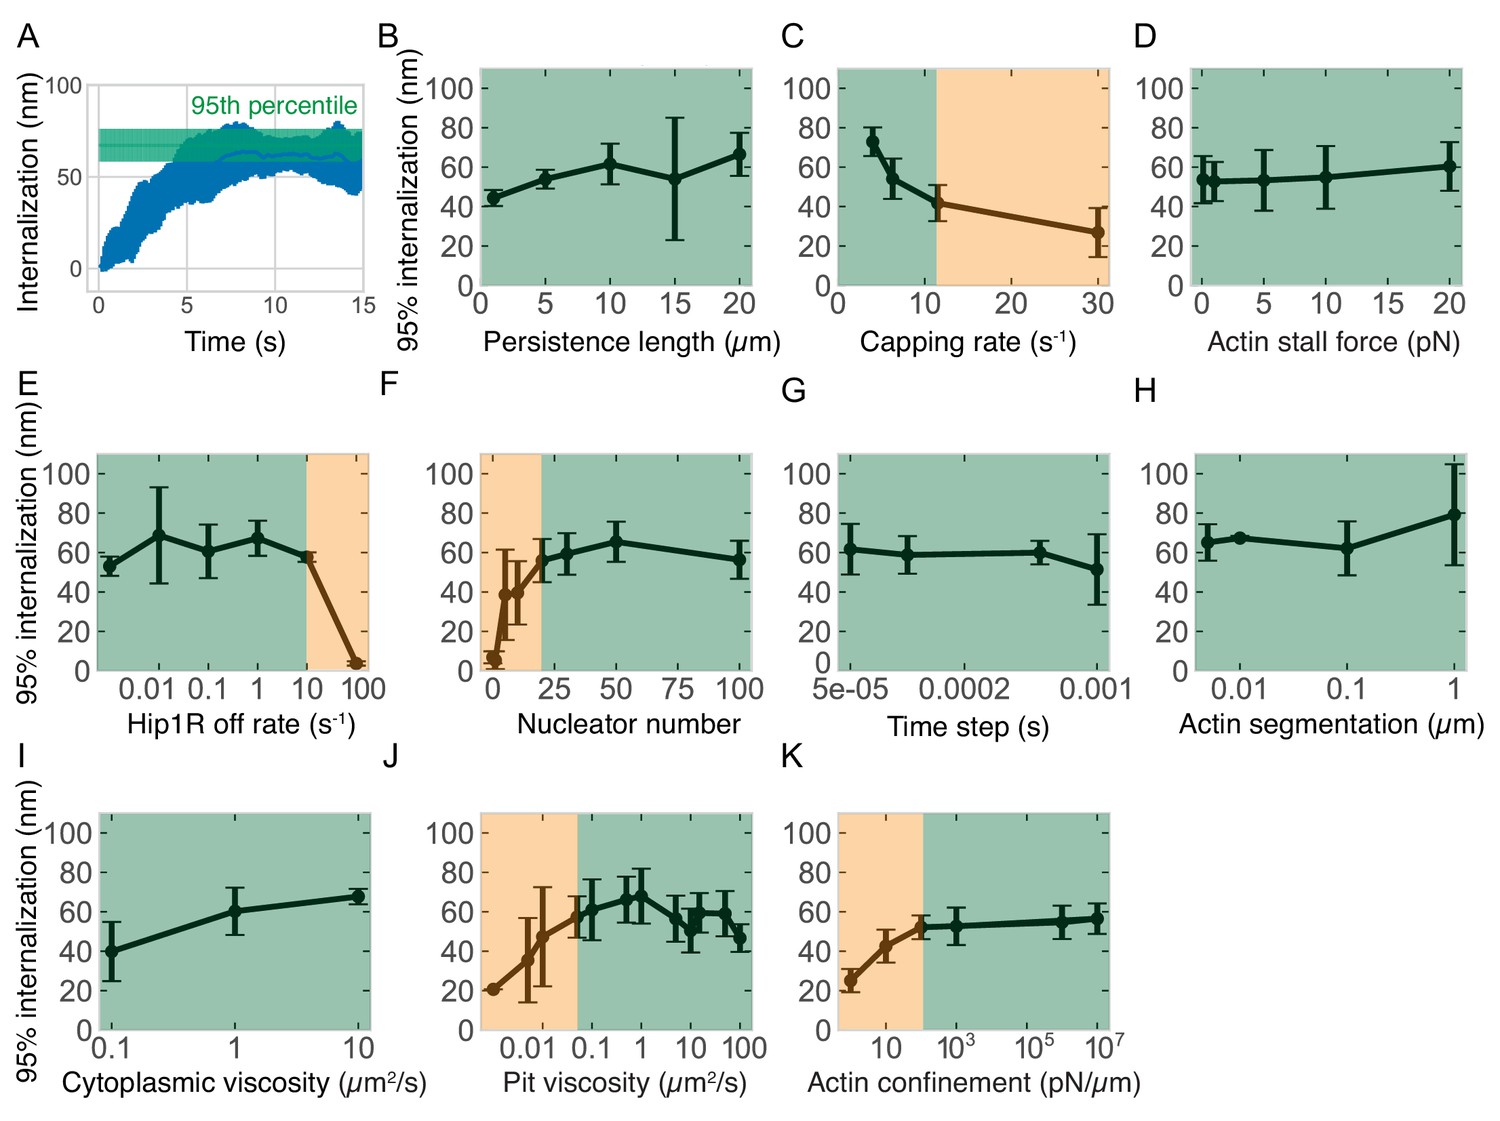
Effect of different actin- and simulation-related parameters on pit internalization dynamics.
(A) Graph illustrating the definition of the metric of 95% internalization -- the 95th percentile of internalization. This metric is used in the remaining panels and throughout the study to compare the effectiveness of endocytosis under different parameter combinations. The first 12 s of simulation are used to control for sampling errors near the end of the simulation. (B) Internalization versus actin persistence length (filament stiffness) (n = 60 simulations). (C) Internalization versus capping rate (n = 45). Lower capping rate increases the total amount of actin. (D–F) Internalization versus: (D) actin polymerization stall force (n = 70); (E) Hip1R off rate (n = 24); (F) number of linear actin filament nucleating proteins (n = 84). (G–K) Controls for simulation conditions. Internalization versus: (G) simulation time step (n = 42); (H) actin segmentation (distance between model points in each filament) (n = 8); (I) cytoplasmic viscosity (n = 18); (J) axial (Z) viscosity of pit (n = 111); (K) strength of actin confinement inside the cell (restorative force against actin filaments located outside the cell) (n = 96). Green regions highlight the parameter space for which internalization is relatively insensitive to the parameter value; orange regions highlight parameter space more strongly dependent on parameter value. Bars are standard deviations.
Figure 1—figure supplement 2
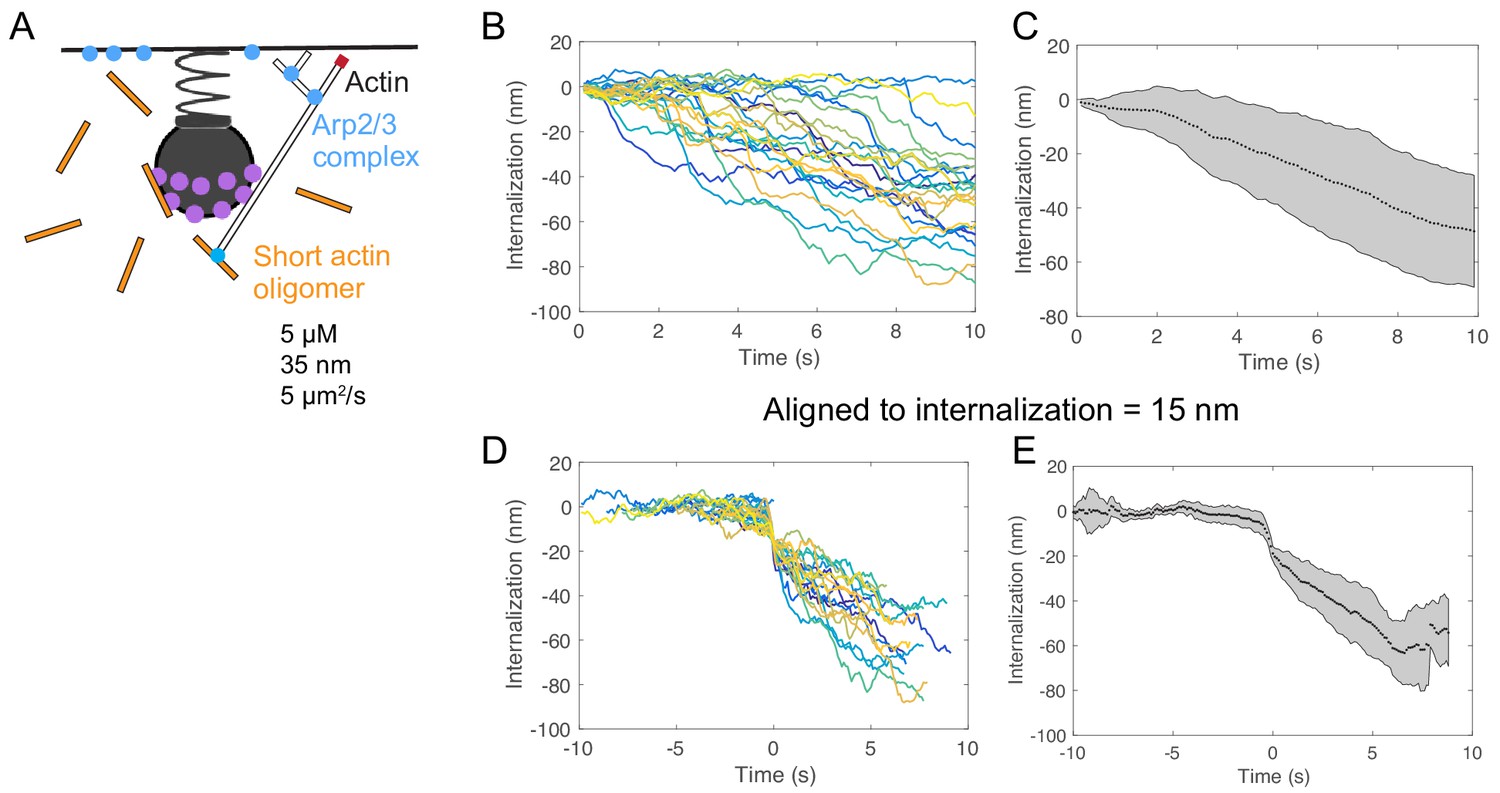
Initiation from a pool of diffusing cytoplasmic actin filaments leads to variable timing of internalization.
(A) Schematic of endocytosis with pool of short diffusing cytoplasmic linear actin filaments. The lengths, concentration, and diffusion rate of the actin filaments were derived from measurements in Raz-Ben Aroush et al. (2017). (B) Internalization over time for 24 individual simulations. Pits internalize after a delay of variable length. (C) Average internalization over time. (D) Internalization for the same simulations in which tracks were aligned according to a value of 15 nm internalization. (E) Average of (D). Shaded regions are standard deviations.
Figure 1—video 1
Simulations of continuum membrane mechanics model.
An axial force corresponding to actin assembly was applied in the regions corresponding to the dotted lines of increasing magnitude over successive simulations. Graph of force versus internalization on the right. Parameters: membrane tension = 0.2 pN/nm; coat rigidity = 320 pN·nm; other parameters given in Tables S1 and S2.
Figure 1—video 2
Simulation of actin in endocytosis using Cytosim.
The pit internalizes 60 nm in 10 s. Conditions: 150 molecules of Arp2/3 complex; other parameters given in Supplementary file 3. Scale bar: 50 nm.
Scheme 1
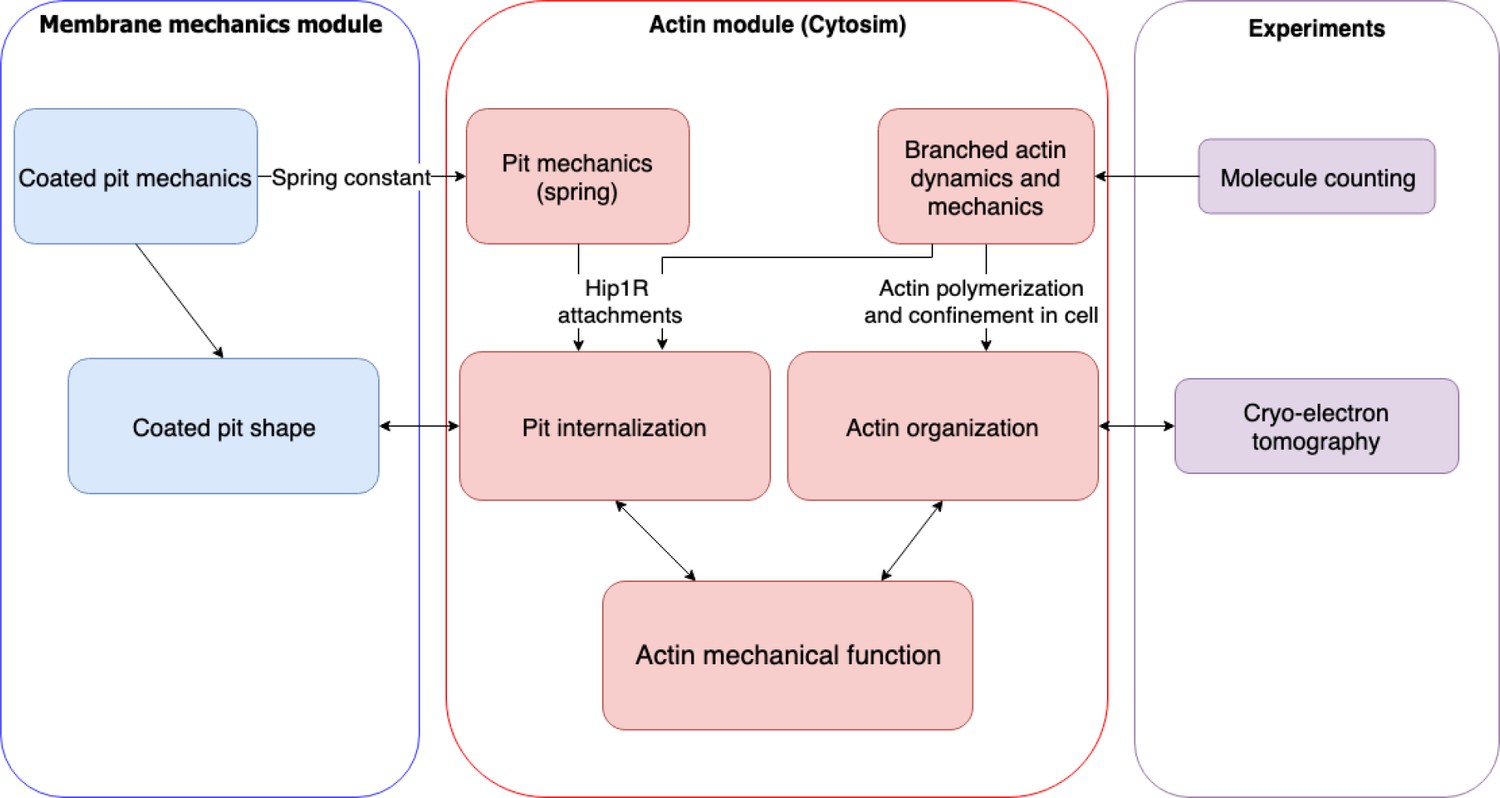
Flow chart of multiscale modeling and experimental strategy combining membrane mechanics, actin spatiotemporal dynamics, molecule counting, and cryo-electron tomography.
Figure 2 with 4 supplements
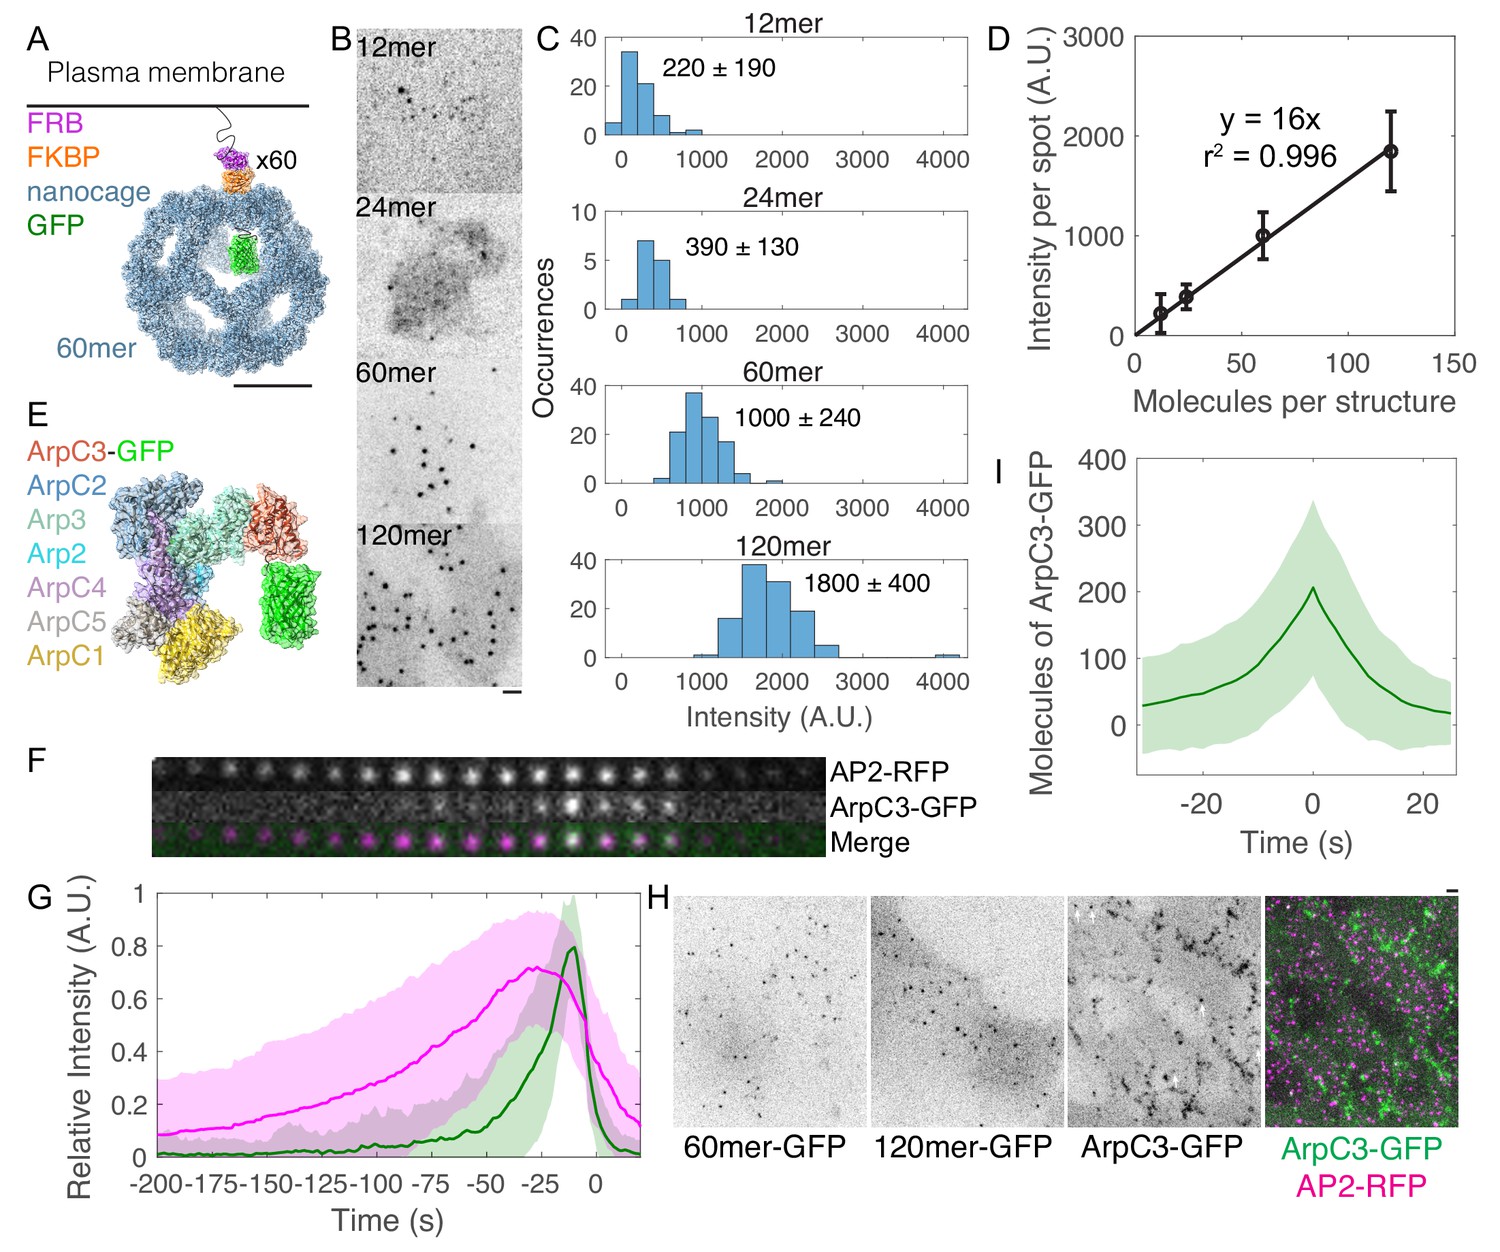
Molecule counting of endogenously GFP-tagged Arp2/3 complex in live human induced pluripotent stem cells.
(A–D) Development of a calibration curve relating fluorescence intensity to numbers of molecules in live cells. (A) Cartoon of intracellular GFP-tagged 60mer nanocage with inducible plasma membrane tether. Each subunit (blue) is tagged with GFP (green) and FKBP (orange). FRB (T2098L) (Purple) is targeted to the plasma membrane by a palmitoylation and myristoylation sequence and dimerizes with FKBP in the presence of rapamycin analog AP21967. Cartoon showing one of 60 tagged subunits is based on PDB structures 5kp9, 2y0g, and 4dri. Scale bar 10 nm. (B) Inverse contrast fluorescence intensity images of human induced pluripotent stem cells expressing GFP-tagged plasma membrane-bound nanocages. Sum projection of nine 300 nm confocal images. Scale bar: 2 µm. (C) Histograms of fluorescence intensity per spot for the four calibration constructs showing mean ± standard deviation. Images were corrected for uneven illumination and intensity was background-corrected. Data from 305 spots in 15 cells over three experiments. (D) Calibration curve relating fluorescence intensity to numbers of molecules in mammalian cells. Line is a linear fit through zero. Error bars are standard deviations. (E) Cartoon drawn to scale of Arp2/3 complex tagged with GFP at the flexible C-terminus of ArpC3. Known binding and activation sites are distal to this site. Based on PDB 2p9l. (F) Montage of CME event marked by AP2-tagRFP-T and ArpC3-tagGFP2 from TIRF imaging. Montage shows 4 s intervals from a movie taken at 2 s intervals. (G) Relative fluorescence intensity over time of AP2-tagRFP-T and ArpC3-tagGFP2 in endocytic events imaged by TIRF microscopy. Traces were normalized to maximum intensity and averaged. 121 traces from 8 cells in four experiments. Shading is ±1 s.d. (H) Fluorescence micrographs of (left) 60mer-tagGFP2, (left-center) 120mer-tagGFP2, (right-center) ArpC3-tagGFP2, and (right) ArpC3-tagGFP2 and AP2-tagRFP-T. White arrows mark spots in which ArpC3-tagGFP2 and AP2-tagRFP-T colocalize. Scale bar 2 µm. (I) Numbers of molecules of ArpC3 over time.
Figure 2—figure supplement 1
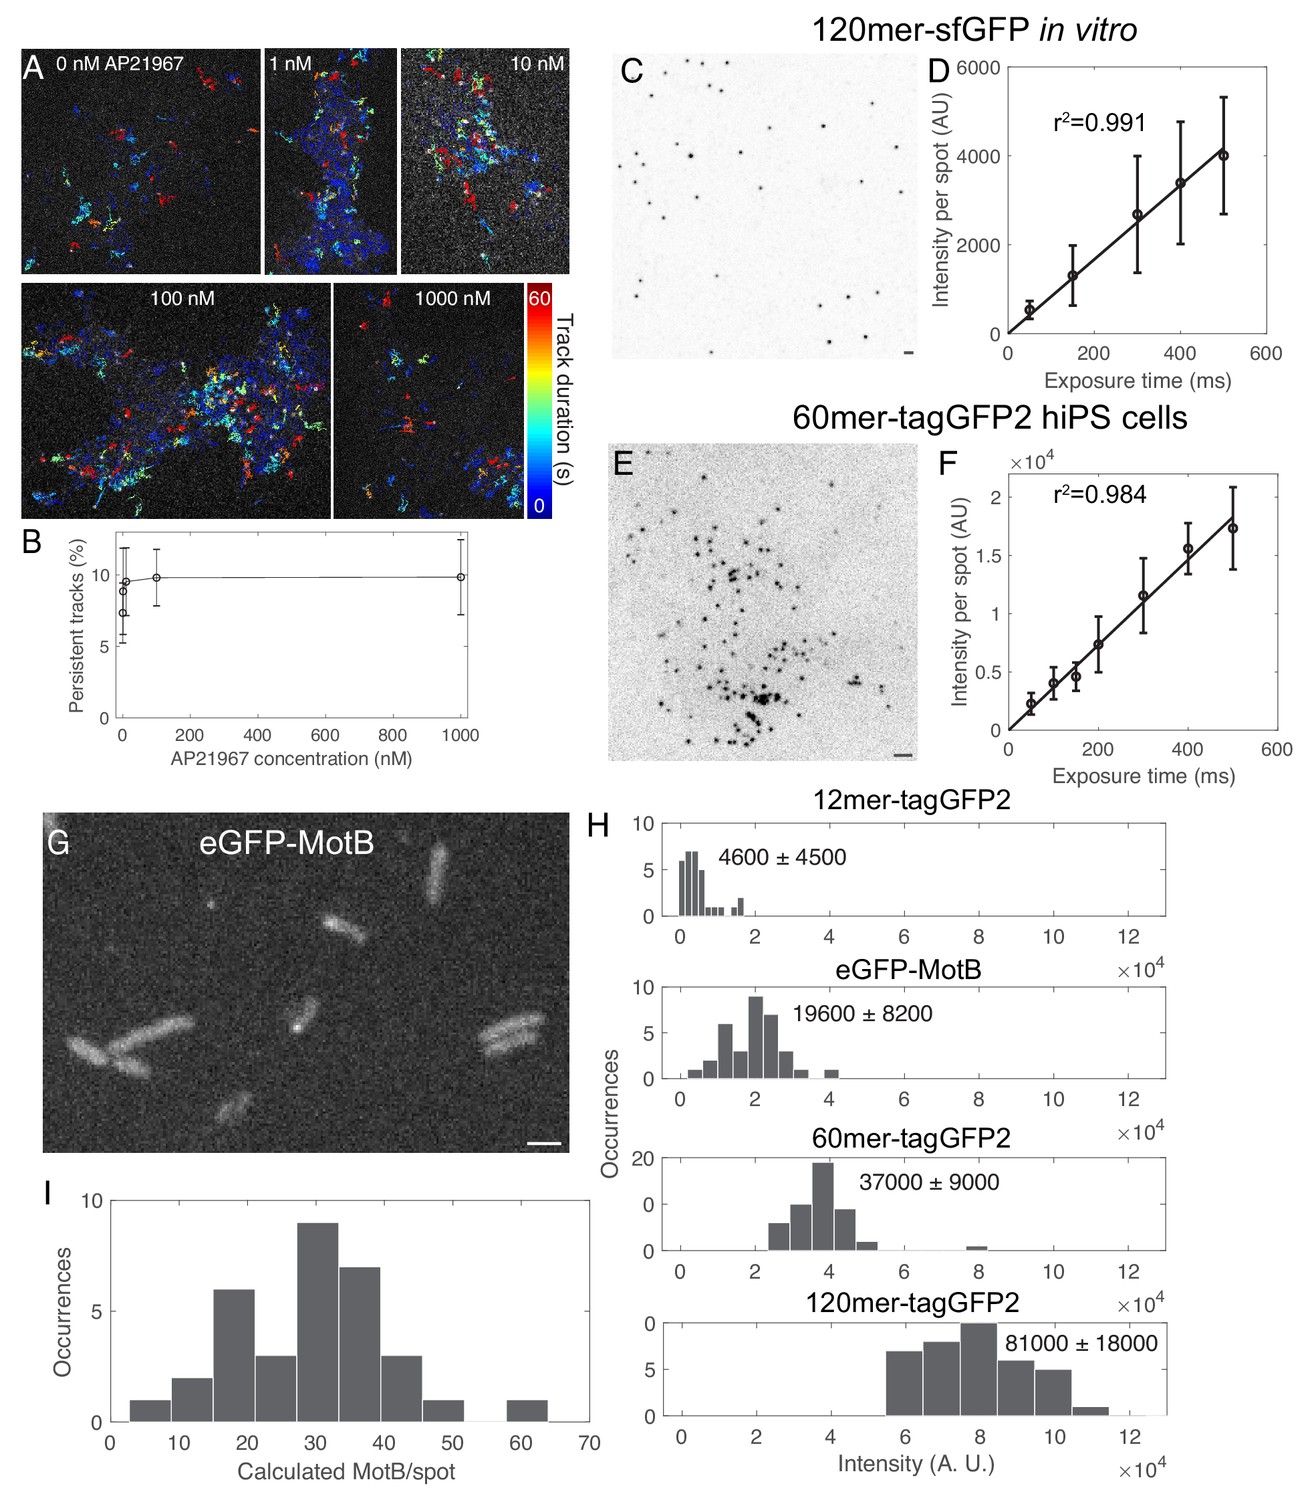
Optimization and validation of fluorescence calibration method.
(A) Tracks overlaid on fluorescence images of 120mer-tagGFP2-FKBP in hiPS cells treated with a range of concentrations of the rapamycin analog AP21967. Color code corresponds to length of track in seconds. (B) Plot of persistent tracks (tracks lasting >30 s) as a function of rapamycin analog concentration. n = 7266 tracks in 19 cells from one experiment. (C) Inverse contrast image of 120mer-sfGFP (Hsia et al., 2016) from E. coli lysate on glass coverslip. Sum projection of 15 confocal Z slices with 400 nm spacing. (D) Curve of fluorescence intensity per spot in vitro as a function of exposure time. Line is a linear fit through zero. (E) Inverted contrast image of 60mer-tagGFP2-FKBP transiently expressed in human induced pluripotent stem cells. Sum projection of 9 confocal Z slices at 300 nm spacing. (F) Graph of fluorescence intensity per spot in cells as a function of exposure time. (G) Fluorescence image of E. coli expressing eGFP-MotB (Leake et al., 2006). (H) Histograms of fluorescence intensity spots for nanocages in WTC10 hiPS cells and eGFP-MotB spots from one experiment. (I) Histogram of numbers of molecules of eGFP-MotB spots quantified using the calibration curve in H and Figure 2. Data from two independent experiments. Bars 2 µm. Error bars are standard deviations.
Figure 2—figure supplement 2
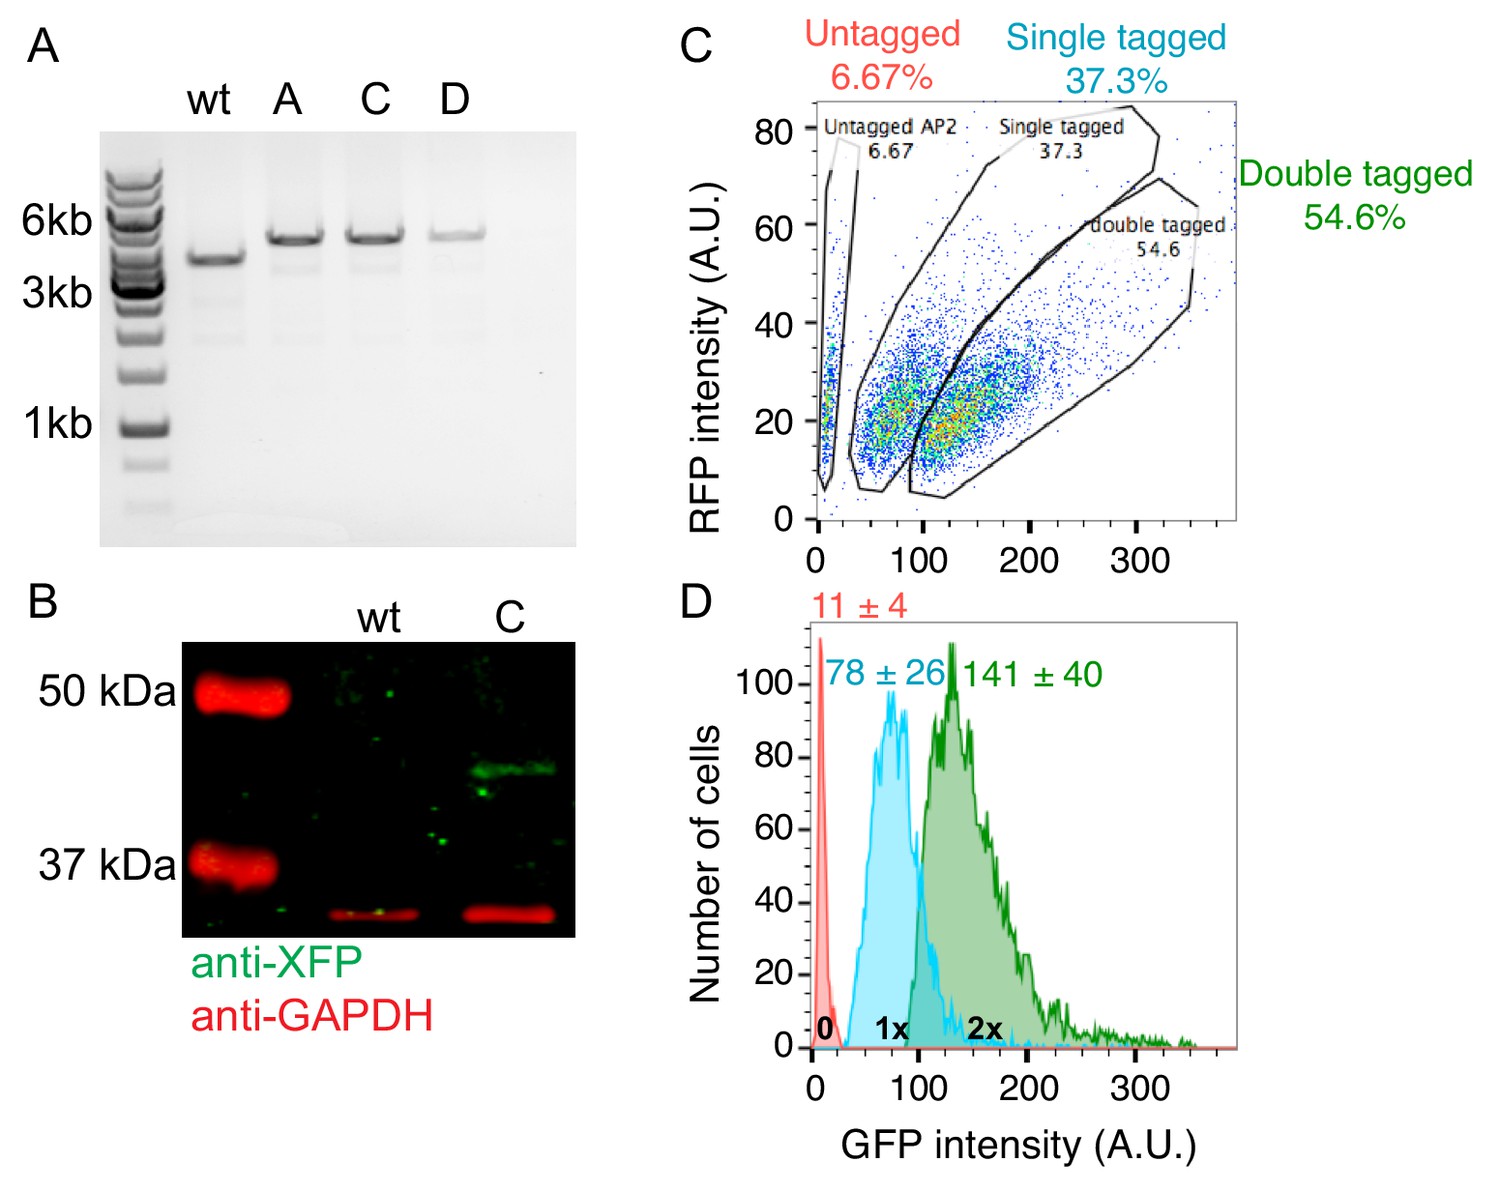
Generation of genome-edited human induced pluripotent stem cell lines endogenously expressing AP2-RFP and ArpC3-GFP.
(A) DNA gel of PCR products of genomic DNA extracted from clonal wild type cells (wt) or cell lines tagged at the ArpC3 locus (clones A, C, D). Each band was sequenced to confirm its identity. (B) Western blot of total cell lysates from genome-edited cells probed with (green) anti-tag (C,G,YFP) antibody, showing a GFP tag at the molecular mass predicted for ArpC3-GFP. (Red) GAPDH loading control. (C) 2D flow cytometry histogram of AP2-RFP and ArpC3-GFP fluorescence intensity from pooled genome-edited cells. Cells were subsequently sorted once by FACS into pooled populations and re-sorted to generate clonal cell lines using the gates indicated in the circles. Numbers in the circles are percentages of total cells. (D) GFP fluorescence intensity histograms for untagged (red), single-tagged (blue) and double-tagged (green) cells. The GFP fluorescence intensity per cell was unitary (intensity minus background) between single- and double-tagged cell lines. Mean ± s.d. values are given.
Figure 2—video 1
Time lapse images of human induced pluripotent stem cells transiently expressing FKBP-60mer-GFP and treated with 0.5 nM AP21967.
Single Z slice at 1 s intervals from spinning disk confocal microscope. Cells seeded on cover glass coated with 80 µg/mL matrigel. FKBP-60mer-GFP particles diffuse slowly on the plasma membrane. Scale bar: 2 µm.
Figure 2—video 2
Time-lapse TIRF microscopy image of a human induced pluripotent stem cell endogenously expressing ArpC3-GFP and AP2-RFP.
Cells seeded on cover glass coated with 80 µg/mL matrigel. Images taken on a Nikon Ti2 microscope with TIRF imaging. 3 min movie taken at 2 s intervals. Scale bar: 2 µm.
Figure 3 with 2 supplements
Self-organization of actin filaments into a radial dendritic network drives endocytic internalization.
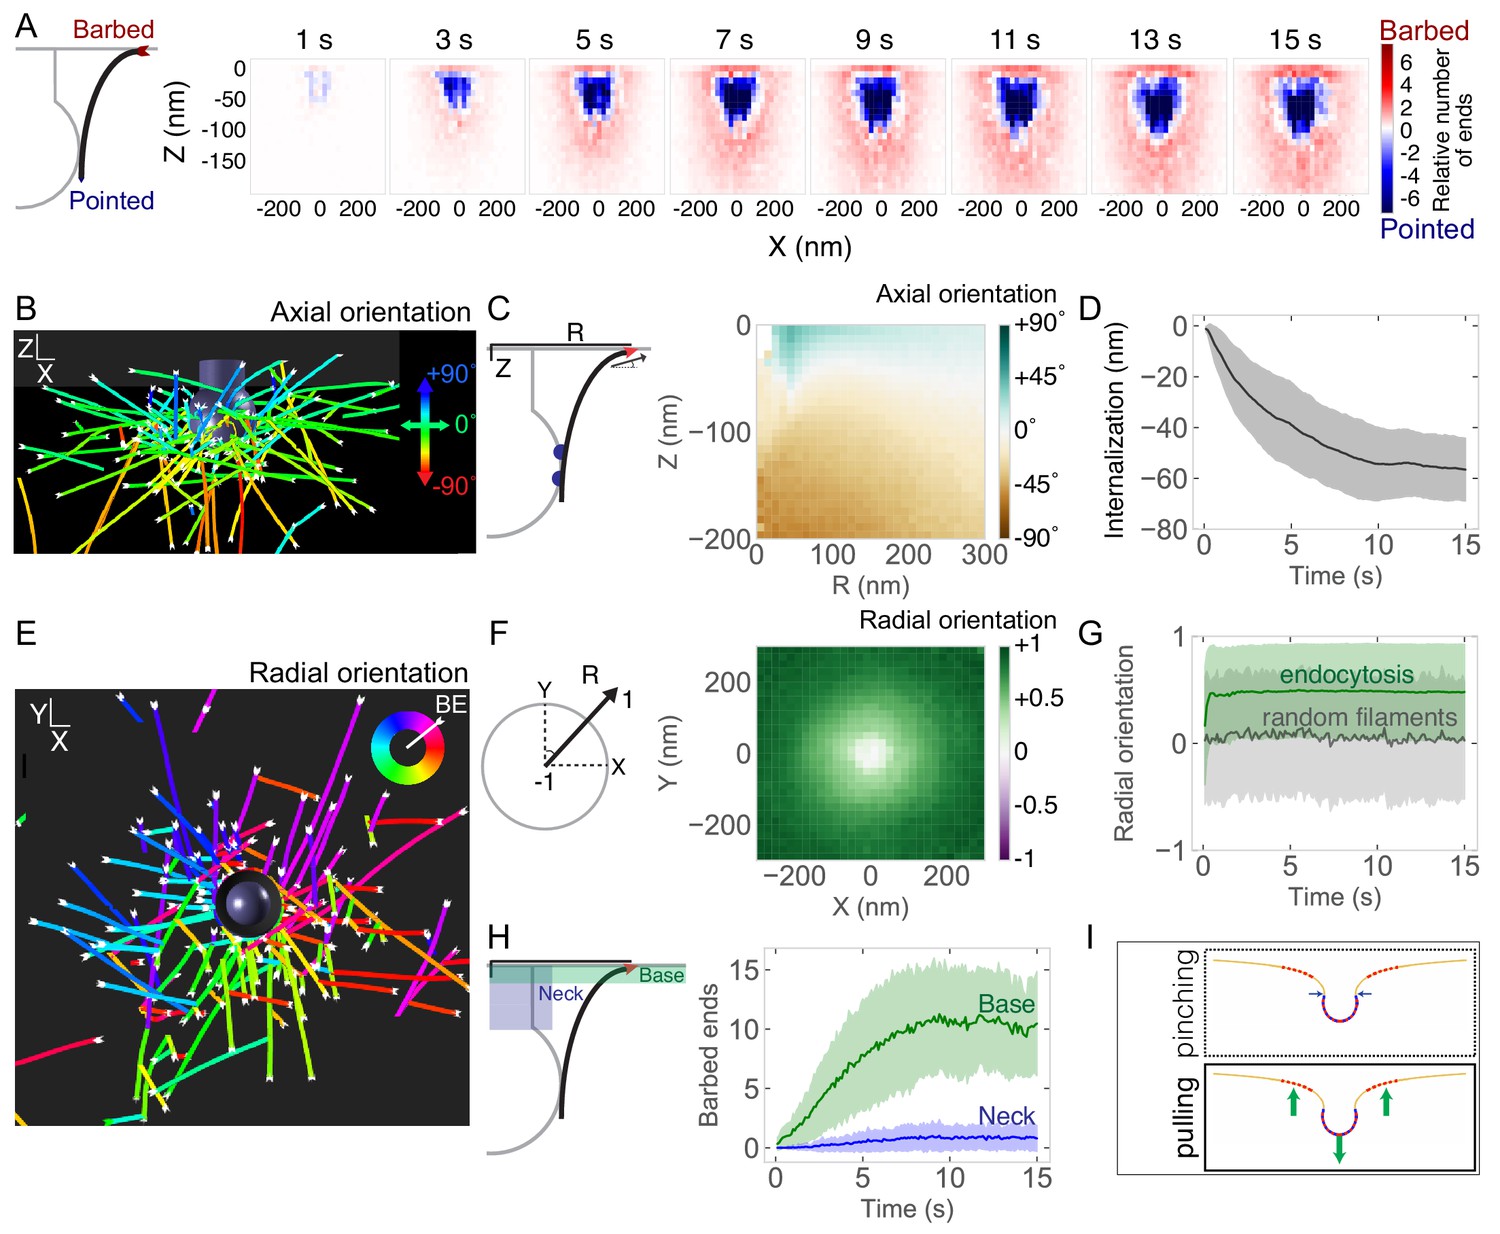
(A) (Left) Schematic depicting actin barbed (plus) or pointed (minus) ends. (Right) Heat maps of the positions of barbed ends (red) or pointed ends (blue) relative to the endocytic pit. Color code represents the relative number of ends. Each graph is averaged across 96 simulations and 1 s of simulation time. (B) Simulation output of endocytic actin filaments color-coded for axial (Z) orientation. Blue filaments orient toward the base of the pit (+90°) and green filaments orient parallel to the base of the pit (0°). (C) Axial orientation of barbed ends. (Left) Schematic of axes. R is radial position of barbed end. (Right) Heat map of axial orientation of barbed ends as a function of R and Z position. Average of 96 simulations. (D) Pit internalization over time (n = 96 simulations). (E) Simulation output of endocytic actin filaments color-coded for radial orientation. (F) Radially oriented endocytic actin filaments. (Left) Schematic of axes. Radial orientation is defined such that +1 = barbed end oriented away from the center of the pit, and −1 = barbed end oriented toward the center of the pit. (Right) Heat map of radial orientation of barbed ends as a function of X and Y position (n = 96 simulations). Barbed ends radiate outward. (G) Radial orientation of barbed ends over time for 96 simulations. Gray curve is negative control of randomly oriented filaments (n = 50 filaments in one simulation). (H) Concentration of barbed ends near the base of the endocytic pit. (Left) Schematic of positions of the neck and base of the pit. (Right) Number of barbed ends near base (green) or neck (blue) of pit, defined as within 7.5 nm of each surface. (I) The majority of forces are directed orthogonal to the base of the pit based on positions of barbed ends in simulations. Shaded bars are standard deviations.
Figure 3—figure supplement 1
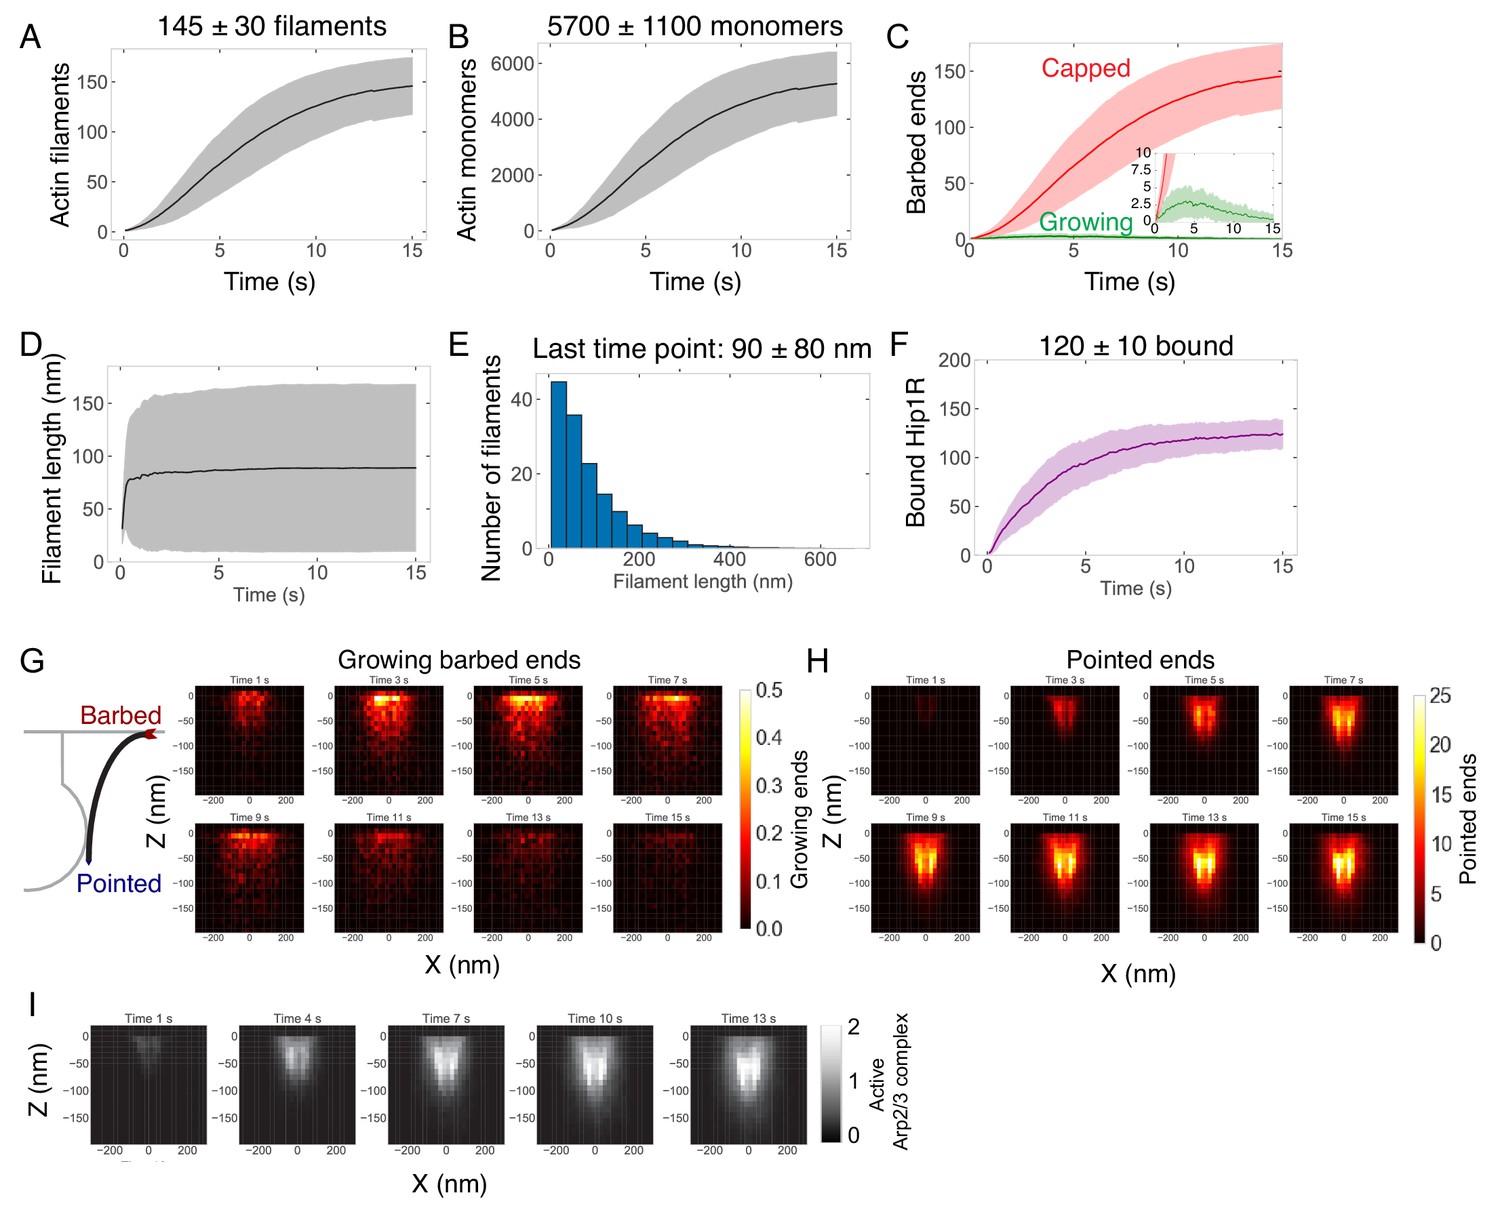
Assembly and self-organization of endocytic actin network.
(A–F) Quantification of the endocytic actin network over time. n = 96 simulations. Measurements are of filaments bound directly to Hip1R or indirectly to Hip1R through the Arp2/3 complex. Shaded bars are standard deviations. (A) Number of actin filaments. (B) Number of actin monomers. (C) Numbers of growing (green) or capped (red) barbed ends. (D) Lengths of filaments. (E) Distribution of filament lengths at last time point. n = 14,007 filaments from 96 simulations. (F) Number of bound Hip1R. (G) (Left) Schematic of actin filament barbed and pointed ends. (Right) Heat map of the positions of growing barbed ends in X and Z over time. (H) Heat map of position of pointed (minus) ends in X and Z over time. (I) Heat map of position of active Arp2/3 complex in X and Z over time.
Figure 3—video 1
Simulation of actin in endocytosis with actin filaments color coded for axial orientation.
Color scale: blue = toward base (up); red = toward cell interior (down). Conditions: 200 molecules of Arp2/3 complex; 60% Hip1R linker coverage.
Figure 4 with 4 supplements
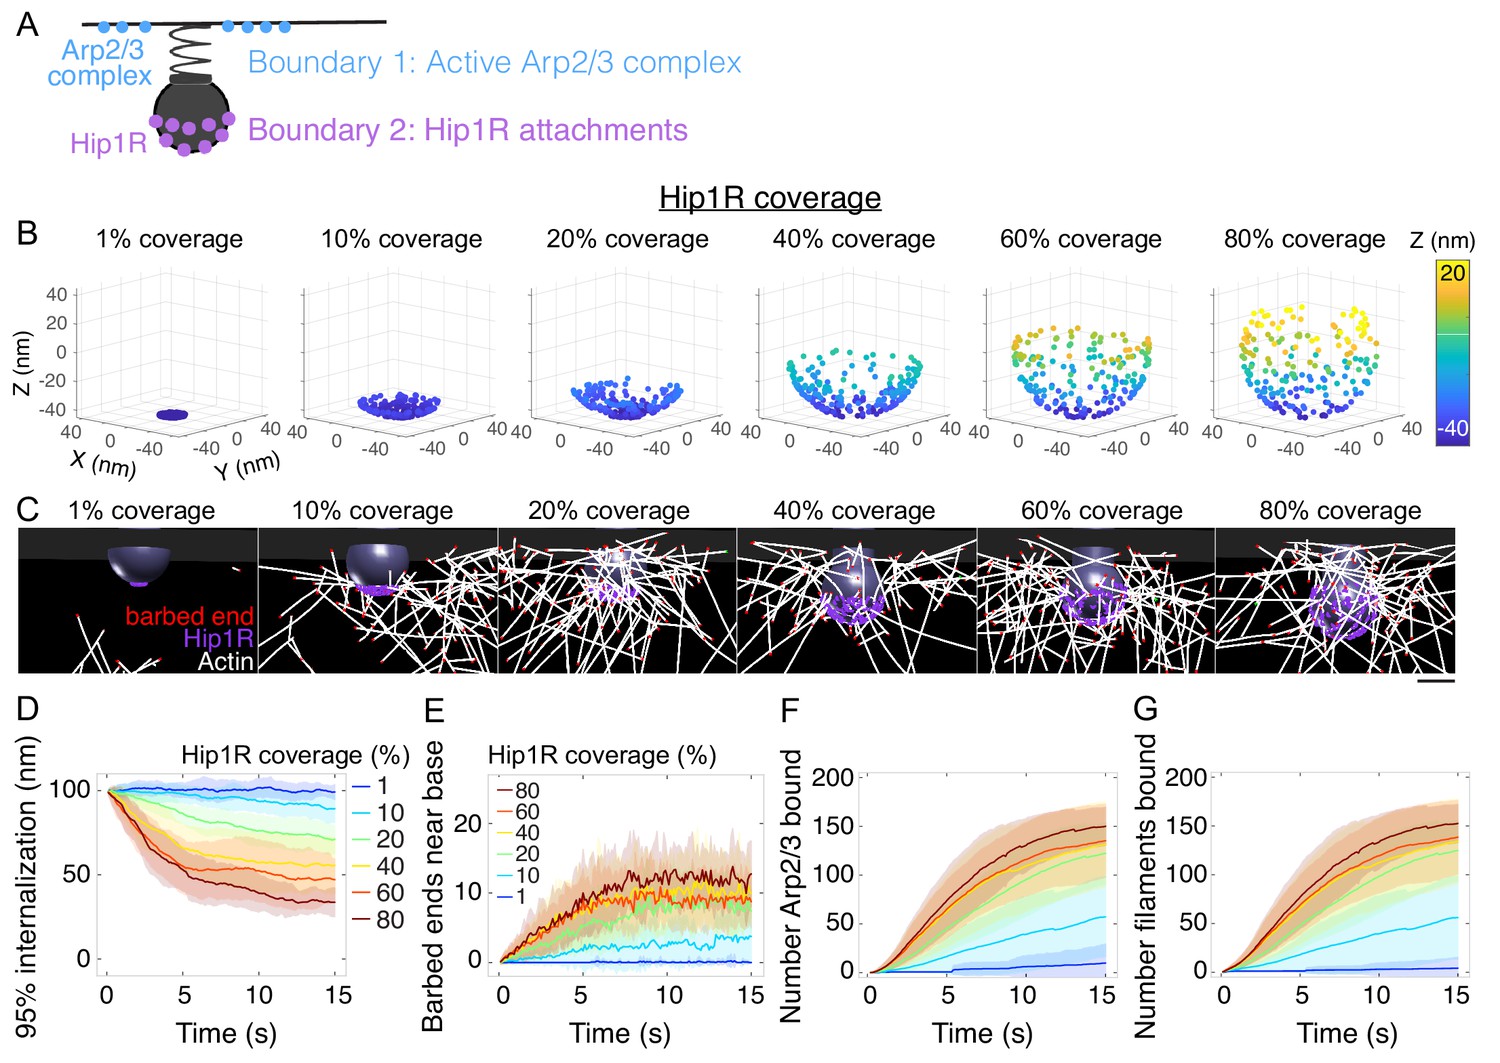
Spatial distribution of actin/Hip1R attachments strongly affects actin self-organization and pit internalization.
(A) Schematic of spatial boundary conditions from endocytic actin-binding proteins. Positions of active Arp2/3 complex (blue) and actin/pit attachments via linker proteins such as Hip1R (purple). (B) Initial positions of Hip1R around increasingly large pit surface area, from 1% to 80% of a sphere. The top ~20% of the sphere is occluded by the neck. (C) Snapshots of a series of simulations for different values of Hip1R coverage showing actin distribution at t = 13 s. (D–G) Changes in the endocytic actin network over time as a function of Hip1R coverage (colors). n = 96 simulations. (D) Internalization; (E) Number of barbed ends near the base of the pit (within 7.5 nm); (F) Number of Arp2/3 complexes bound in the endocytic network; (G) Number of actin filaments bound in the endocytic network. Scale bar: 50 nm.
Figure 4—figure supplement 1
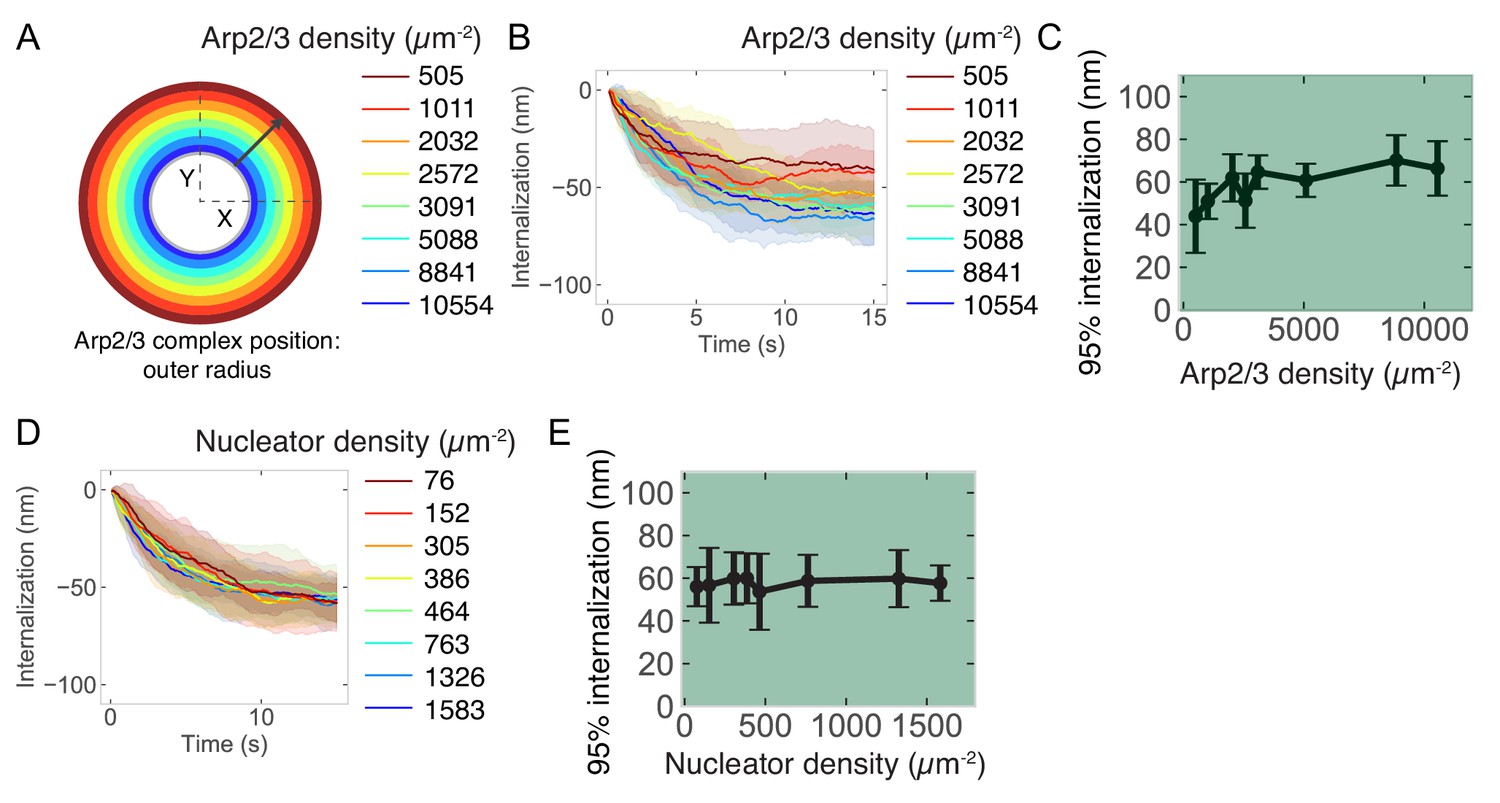
Relationship between endocytic outcome and active Arp2/3 complex surface density or mother filament nucleating protein surface density at the base of the pit.
(A) Schematic of initial location of active Arp2/3 complex. 200 molecules of Arp2/3 complex were seeded in a ring with an inner diameter of 60 nm (inner gray circle) and an outer diameter of increasing radius (colors) which corresponds to decreasing surface density. (B) Internalization over time for different surface densities of Arp2/3 complex. Color code same as previous panel. (C) Internalization as a function of Arp2/3 complex surface density. n = 72 simulations. (D) Internalization over time for different surface densities of nucleator protein. (E) Internalization as a function of nucleator protein surface density. n = 160 simulations.
Figure 4—figure supplement 2

A collar of active Arp2/3 complex near the neck the pit does not affect endocytic outcome.
(A) Schematic of active Arp2/3 complex initiated at the base of the pit and a collar near the neck of the pit. (B) Snapshot of simulation with active Arp2/3 complex (blue) near the neck of the pit. Note that the neck can translate in XY slightly (<10 nm) relative to the collar of Arp2/3 complex. (C) Internalization over time with a collar of Arp2/3 complex at the neck (blue) compared to all Arp2/3 complex at the base of the pit (black). No difference in 95% internalization (p>0.5; Welch’s t-test). n = 24 simulations per condition. Black curve is 24 of the 96 simulations shown in Figure 3D. (D) Number of barbed ends near the neck and base of the pit over time. Compare to Figure 3H.
Figure 4—figure supplement 3

Internalization as a function of the number of Hip1R molecules and mechanism of self-organization of endocytic actin filaments.
(A) Endocytic internalization as a function of Hip1R number. n = 57 simulations. (B) Time-lapse montage demonstrating endocytic actin self-organization mechanism due to Hip1R spatial distribution around the pit (coverage = 80%). Arrows point to new branched actin filaments nucleated by Arp2/3 complex. Filaments color coded by axial orientation. Scale bar: 50 nm. (C) Snapshot of initial time point of simulation with filaments color coded according to axial orientation. Compare to Figure 3B. (D) Schematic illustrating mechanism of stochastic assembly and selection. At initial timepoints, filaments have no preferred orientation. Blue circle highlights filament oriented away from base of pit, which does not encounter active Arp2/3 complex. Red circle highlights filament oriented toward base of pit, which encounters active Arp2/3 complex to template dendritic nucleation of additional actin filaments oriented toward base of pit (green color in panels below). (E–F) Heat maps of filament orientation as a function of radial (R) and axial (Z) position. (E) Simulation of randomly oriented filaments; (F) First five time points of endocytic actin simulation showing establishment of asymmetric orientation for filaments near the base of the pit.
Figure 4—video 1
Simulations in which the coverage of linker Hip1R around the pit was varied from 1% to 80% of a sphere.
Increased Hip1R coverage corresponds to increased internalization.
Figure 5 with 4 supplements
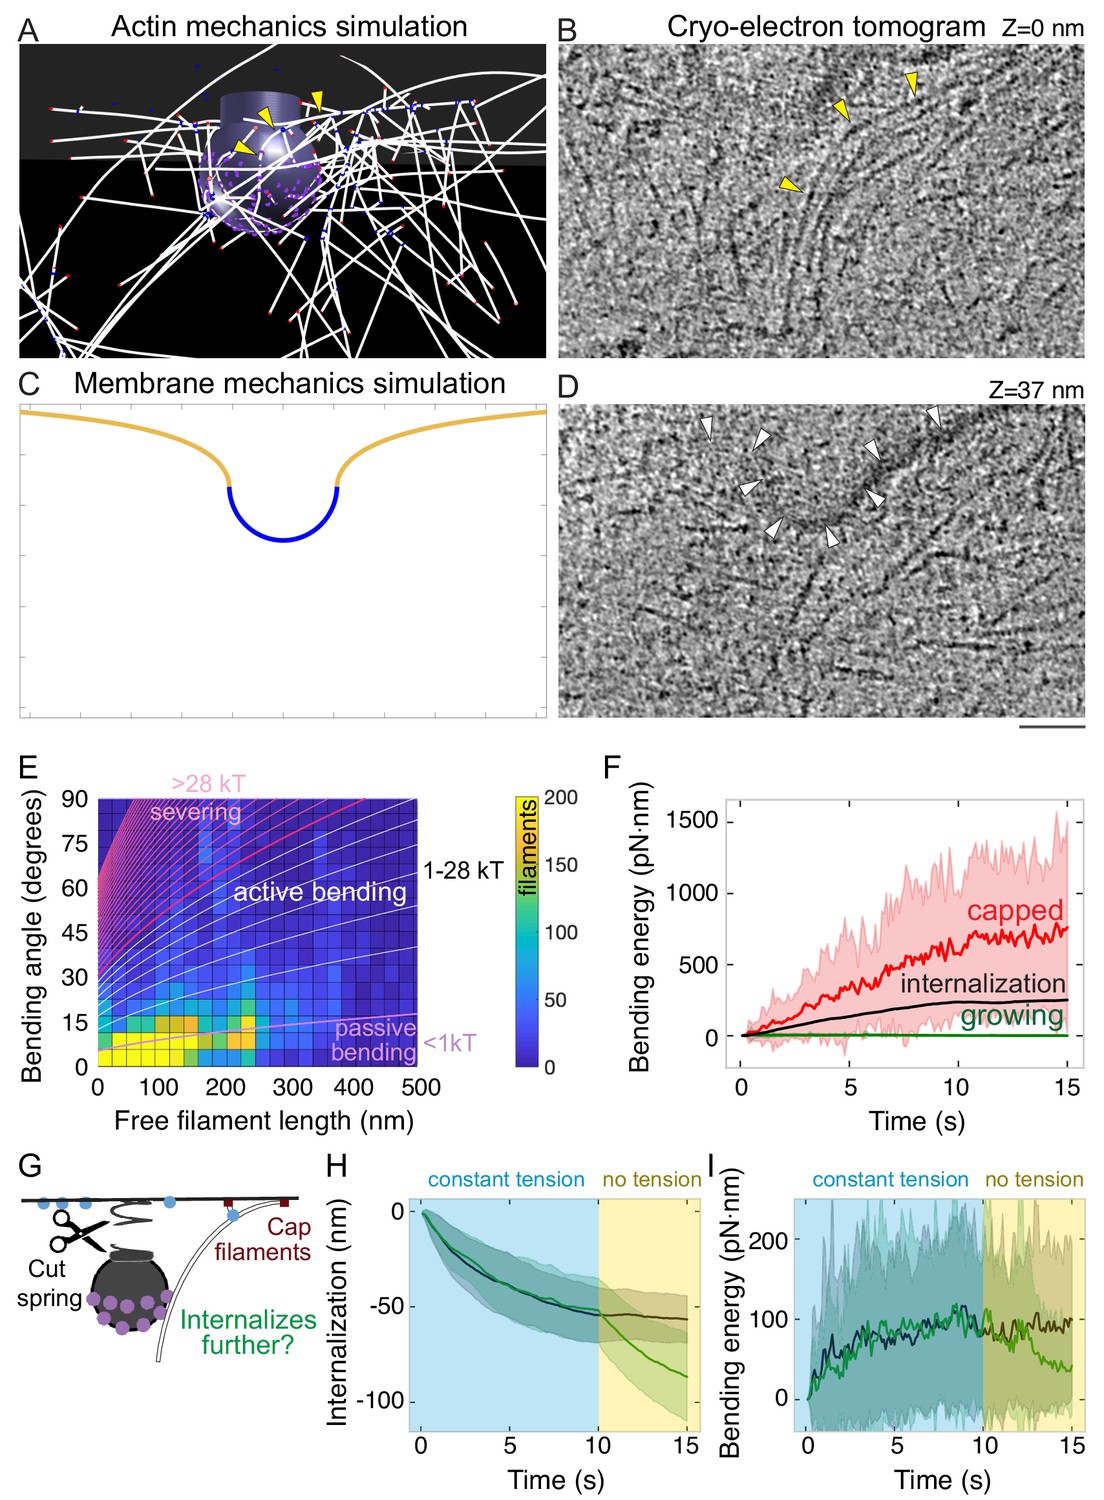
Bending of endocytic actin filaments stores elastic energy for pit internalization.
(A) Snapshot of simulation showing filaments bent between the attachment site in the coat and the base of the pit. Also see Figure 1F. Yellow arrowheads point to a bent actin filament. (B) Tomographic slice of cryo-electron tomogram of an SK-MEL-2 cell. Long actin filaments (yellow arrowheads) bend along the clathrin-coated pit between the coat and the base of the pit. (C) Snapshot of membrane mechanics simulation under an internalization force with 60 nm internalization. (D) Slice of the same tomogram as shown in B at a different Z-level (+37 nm) in which the coated plasma membrane (white arrowheads) is visible. Scale bar for A-D: 50 nm. (E) Heat map of the bending angle and free filament length of endocytic actin filaments in simulations. Color code is number of filaments (summed for all time points, average of 24 simulations). Lines demarcate the magnitude of energy stored in these filaments, based on the theory of elastic beam rigidity for filaments of persistence length 10 µm (Materials and methods), in units of kBT (4.1 pN·nm). Purple lines: filament conformations expected from thermal fluctuations (passive bending). White lines: filament bending greater than from thermal fluctuations (active bending). Magenta lines: lower limit for bending energy expected to sever filaments (De La Cruz et al., 2015b). (F) Total elastic energy stored in bent capped (red) or growing (green) endocytic actin filaments during simulation over time compared to mean energy necessary for internalization (black) (n = 96 simulations). (G) Schematic of an in silico experiment to test the mechanical function of bent endocytic actin filaments. At t = 10 s, the membrane tension was reduced to zero, and the filaments were capped. (H) Internalization (green) after spring cut and filament capping, compared to simulation with no change in tension (black, same data as Figure 3D). n = 48 simulations. (I) Bending energy of endocytic actin filaments with barbed ends near base of pit over time. Release of tension and filament capping at t = 10 s (green) compared to no change in tension (black).
Figure 5—figure supplement 1
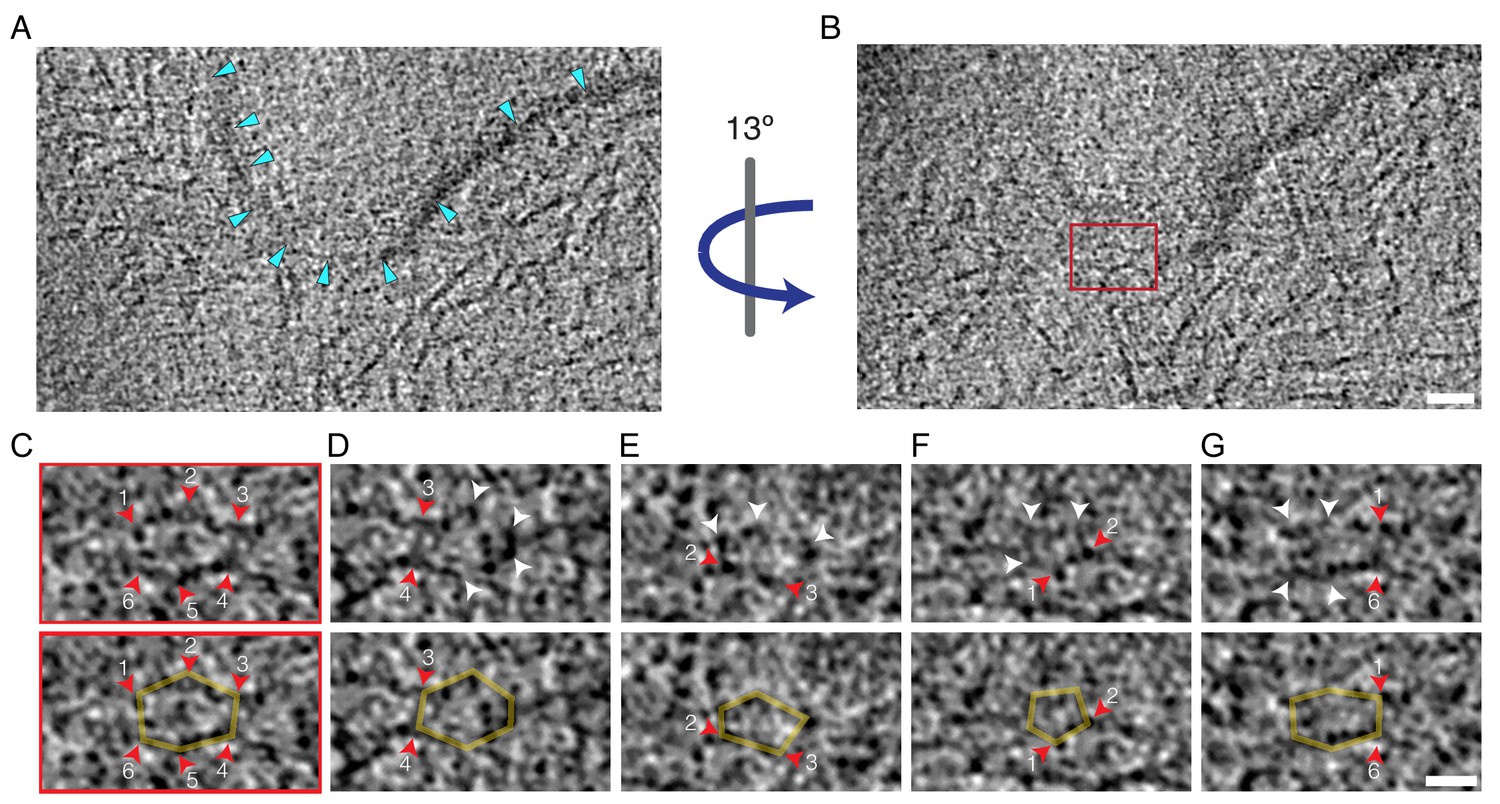
Hexagonal and pentagonal lattices in tomogram of clathrin-coated pit.
(A, B) Tomographic slices of membrane invagination shown in Figure 5B and D, (B) is rotated by 13° relative to (A). Blue arrowheads in (A) point to lipid bilayer, red box in (B) highlights a clathrin hexagon visible in (C–G) Insets of tomogram. (C) Magnified view of boxed hexagon in (B) with increased contrast. Red arrows point to the six vertices of the hexagon. Bottom row is the same image with the hexagon highlighted in yellow. The numbering is preserved in the remaining insets; for example vertices 3 and 4 connect the hexagon in (C) to the hexagon in (D). Therefore, the insets show a continuous lattice of pentagons and hexagons. Each inset is rotated so that each pentagon or hexagon is en face. Resolution is anisotropic in rotated insets due to the missing wedge effect. Scale bars: (A, B) 40 nm, (C–G) 20 nm.
Figure 5—figure supplement 2
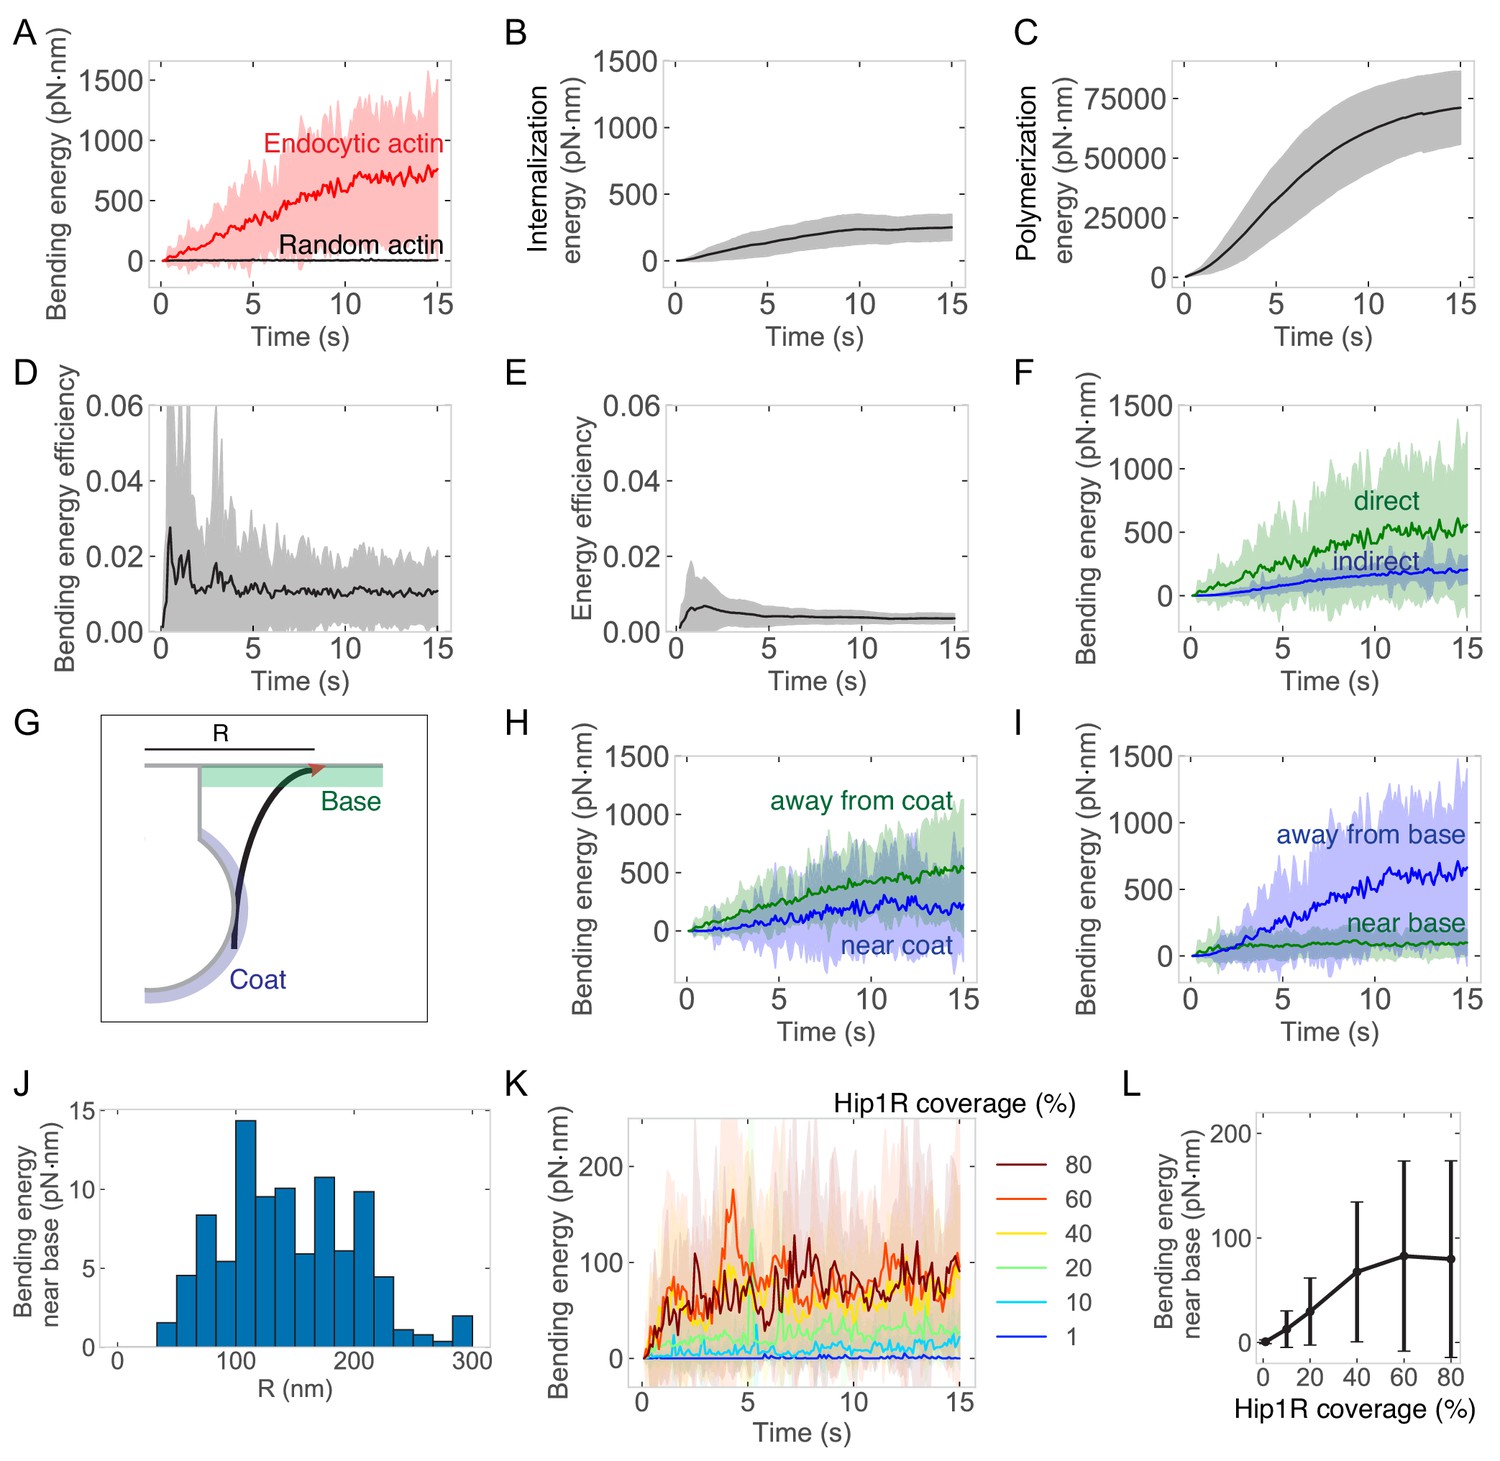
Energetics of endocytic actin network.
Graphs are of endocytic actin within Hip1R-attached networks from 96 simulations. Parameters were the same as in Figure 3. Shaded regions are standard deviations. (A) Bending energy from endocytic actin (red, also see Figure 5F) or randomly diffusing actin filaments (black). Random actin: 50 filaments simulated over time in one simulation. Time-averaged bending energy = 3.5 ± 2 pN·nm per time point summed for 50 filaments. (B) Energy to internalize a pit, based on internalization and relationship E = 0.5kx2, where k = spring constant and x = internalization. (C) Energy from actin polymerization over time, calculated based on the number of monomers and work = 13.5 pN·nm per binding event (see Materials and methods). (D) Energy efficiency from filament bending, calculated as the ratio of bending to polymerization energy over time. (E) Ratio of internalization to polymerization energy over time. (F) Bending energy stored in filaments directly bound to Hip1R (green) or indirectly through branching (blue). (G) Schematic of endocytic actin filament with barbed end (red) near the base of pit (green). Coat is shaded in blue. (H) Bending energy within 5 nm of the coat (blue) or >5 nm away from the coat (green). (I) Bending energy within 10 nm of the base of the pit (green) or >10 nm away from the base (blue). (J) Bending energy within 10 nm of the base of the pit as a function or radial distance R from the center of the pit. (K) Bending energy over time of filaments with barbed ends near the base of the pit as a function of Hip1R coverage. (L) Bending energy stored in filaments with barbed ends near the base of the pit as a function of Hip1R coverage.
Figure 5—video 1
Cryo-electron tomogram of SK-MEL-2 cell grown on holey carbon grid and vitrified, related to Figure 5.
Plasma membrane, clathrin coat, and bent endocytic actin filaments are visible. Scale bar: 50 nm.
Figure 5—video 2
Simulation of actin in endocytosis in which, at t = 10 s, filaments were all capped and the membrane tension was reduced to 0 pN/nm.
After this time point internalization increases further despite the lack of actin filament growth.
Figure 6 with 1 supplement
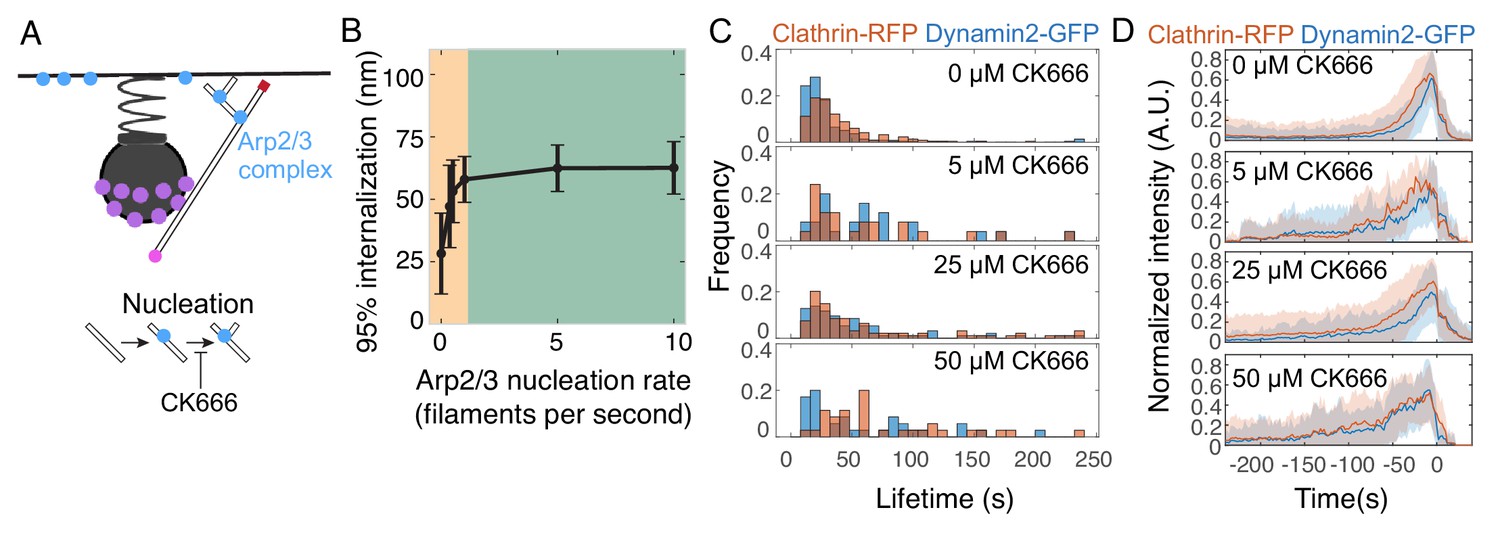
Inhibiting Arp2/3 complex nucleation activity stalls endocytosis.
(A) Schematic of the model parameter corresponding to Arp2/3 nucleation activity, and the step inhibited by the small molecule CK-666. (B) Internalization as a function of Arp2/3 complex nucleation rate. Orange region highlights parameter sensitivity, and green region highlights parameter insensitivity. n = 96 simulations. Reducing Arp2/3 nucleation rate reduces internalization as seen in the orange region. (C) Histograms of endocytic lifetime in SK-MEL-2 cells endogenously expressing clathrin light chain CLTA-tagRFP-T and dynamin2-eGFP and treated with CK-666. n = 368 tracks from 10 cells. (D) Fluorescence intensity over time for endocytic tracks marked by clathrin-RFP and dynamin2-GFP in SK-MEL-2 cells treated with 0.1% DMSO (0 µM) or the indicated concentration of CK-666 for 45 min. Fluorescence events were tracked automatically (Materials and methods). Tracks in which GFP and RFP colocalized are shown. Each track was normalized to its maximum intensity and then all tracks were averaged and aligned to the time of the disappearance of the clathrin-RFP signal. The lifetimes of these events are plotted in D. Shaded bars are standard deviations.
Figure 6—figure supplement 1

Effect of Arp2/3 complex inhibitor CK-666 on lifetimes of endogenously tagged markers of endocytosis.
(A) Endocytic lifetime as a function of time from addition of 40 µM CK-666. For time = 0 s CK-666 was added in the middle of imaging. Lifetimes for this panel were calculated by analyzing the lengths of user-defined kymographs (Materials and methods). n = 142 tracks.
Figure 7 with 2 supplements

Adaptation of endocytic actin network to changes in membrane tension.
(A) Schematic depicting possible adaptation of the actin network to membrane tension via self-organization and bending. (B–D) Snapshots of simulations from the same time point (14 s) for (B) low membrane tension (0.015 pN/nm); (C) medium membrane tension (0.15 pN/nm); (D) high membrane tension (1 pN/nm). Scale bar is 50 nm. (E–H) Changes in the endocytic actin network as a function of membrane tension. n = 144 simulations. (E) Internalization; (F) Number of barbed ends near base of pit; (G) Number of actin filaments in Hip1R-bound network; (H) Bending energy for filaments with barbed ends near base of pit. Mean ± standard deviation of time points in the last 5 s of simulations. Dashed line in (E) is expected internalization based on constant energy usage with 0.01 pN/nm condition as reference (see Methods).
Figure 7—figure supplement 1
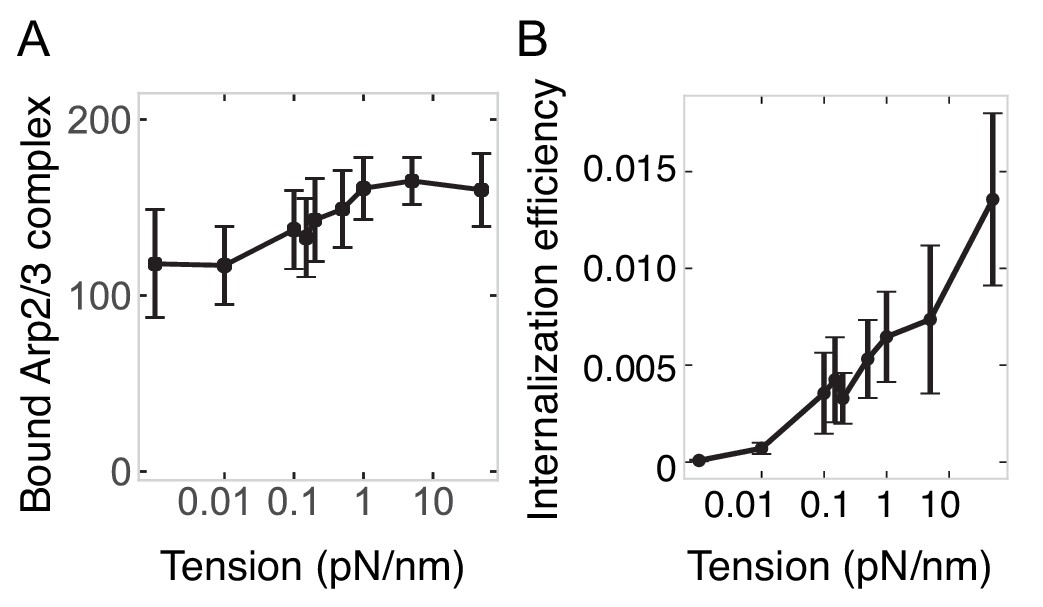
Membrane tension-dependent adaptation by the actin network.
(A) Number of Arp2/3 complexes bound in endocytic network as a function of membrane tension. (B) Endocytic energy efficiency (internalization energy/polymerization energy) as a function of membrane tension. n = 144 simulations.
Figure 7—video 1
Simulations of actin in endocytosis with different values of membrane tension (Low, 0.01 pN/nm; Medium, 0.15 pN/nm; High, 1 pN/nm).
Conditions: 200 molecules of Arp2/3 complex; 80% Hip1R linker coverage. Under high tension, the broad distribution of Hip1R linkers allows actin to encounter Arp2/3 complex at the base of the pit for increased filament nucleation and bending.
Figure 8 with 1 supplement
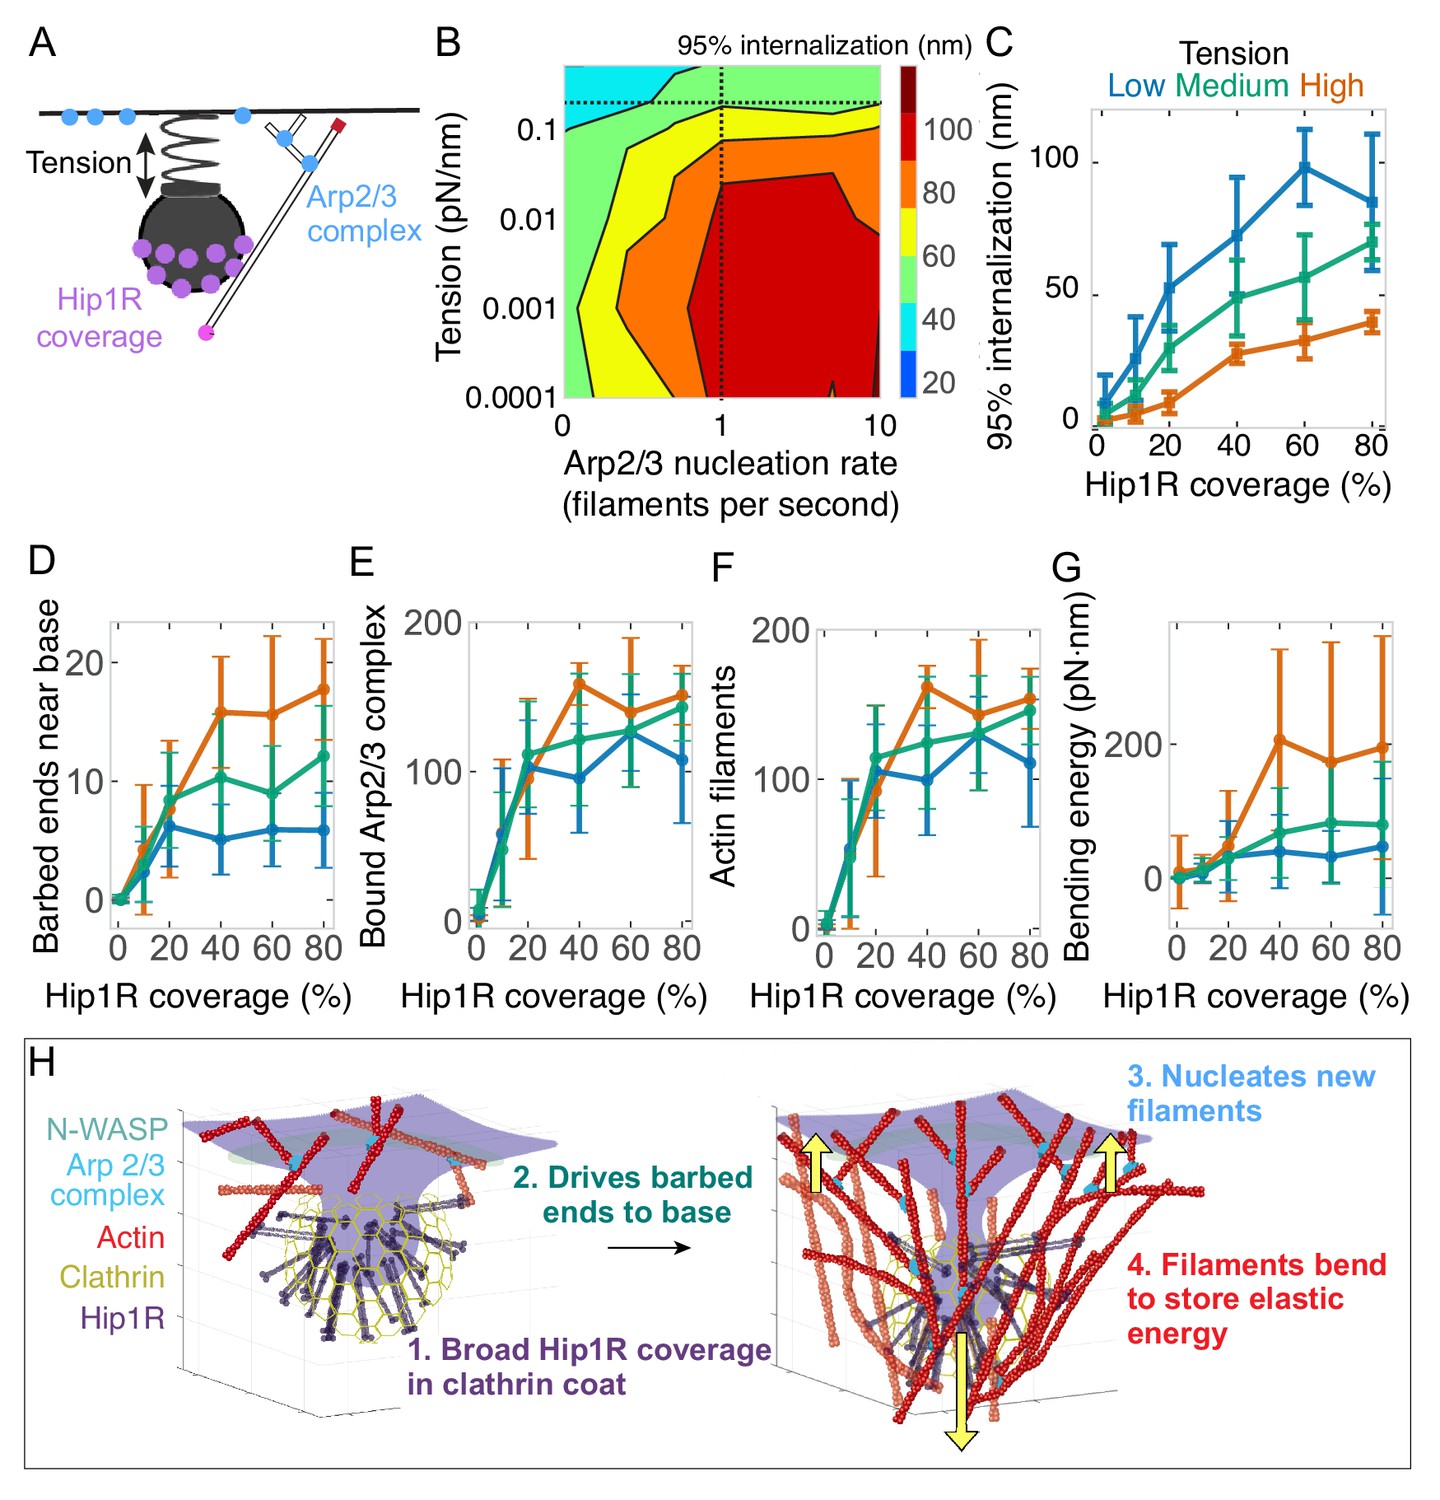
Arp2/3 complex activity and Hip1R/actin attachments are critical for allowing actin filaments to drive endocytic pit internalization and adapt to changing tension.
(A) Schematic of Arp2/3 complex activity and Hip1R coverage along with membrane tension. (B) Phase diagram of endocytic internalization as a function of membrane tension and Arp2/3 complex nucleation rate shown on a log-log plot. Dotted lines are values taken from the literature (Beltzner and Pollard, 2008; Diz-Muñoz et al., 2016). (C–G) Changes in the endocytic actin network as a function of Hip1R coverage for different values of membrane tension. Low tension = 0.015 pN/nm; medium tension = 0.15 pN/nm; high tension = 1 pN/nm. n = 288 simulations. (C) Internalization; (D) Number of barbed ends near base of pit; (E) Number of Arp2/3 complexes bound in network; (F) Number of actin filaments bound in network; (G) Bending energy of filaments with barbed ends near the base of the pit. Mean ± standard deviation of time points in the last 5 s of simulations. (H) Summary of load-dependent adaptation of self-organizing endocytic actin network due to spatial segregation of active Arp2/3 complex at the base and Hip1R in a broad distribution within the clathrin coat.
Figure 8—figure supplement 1
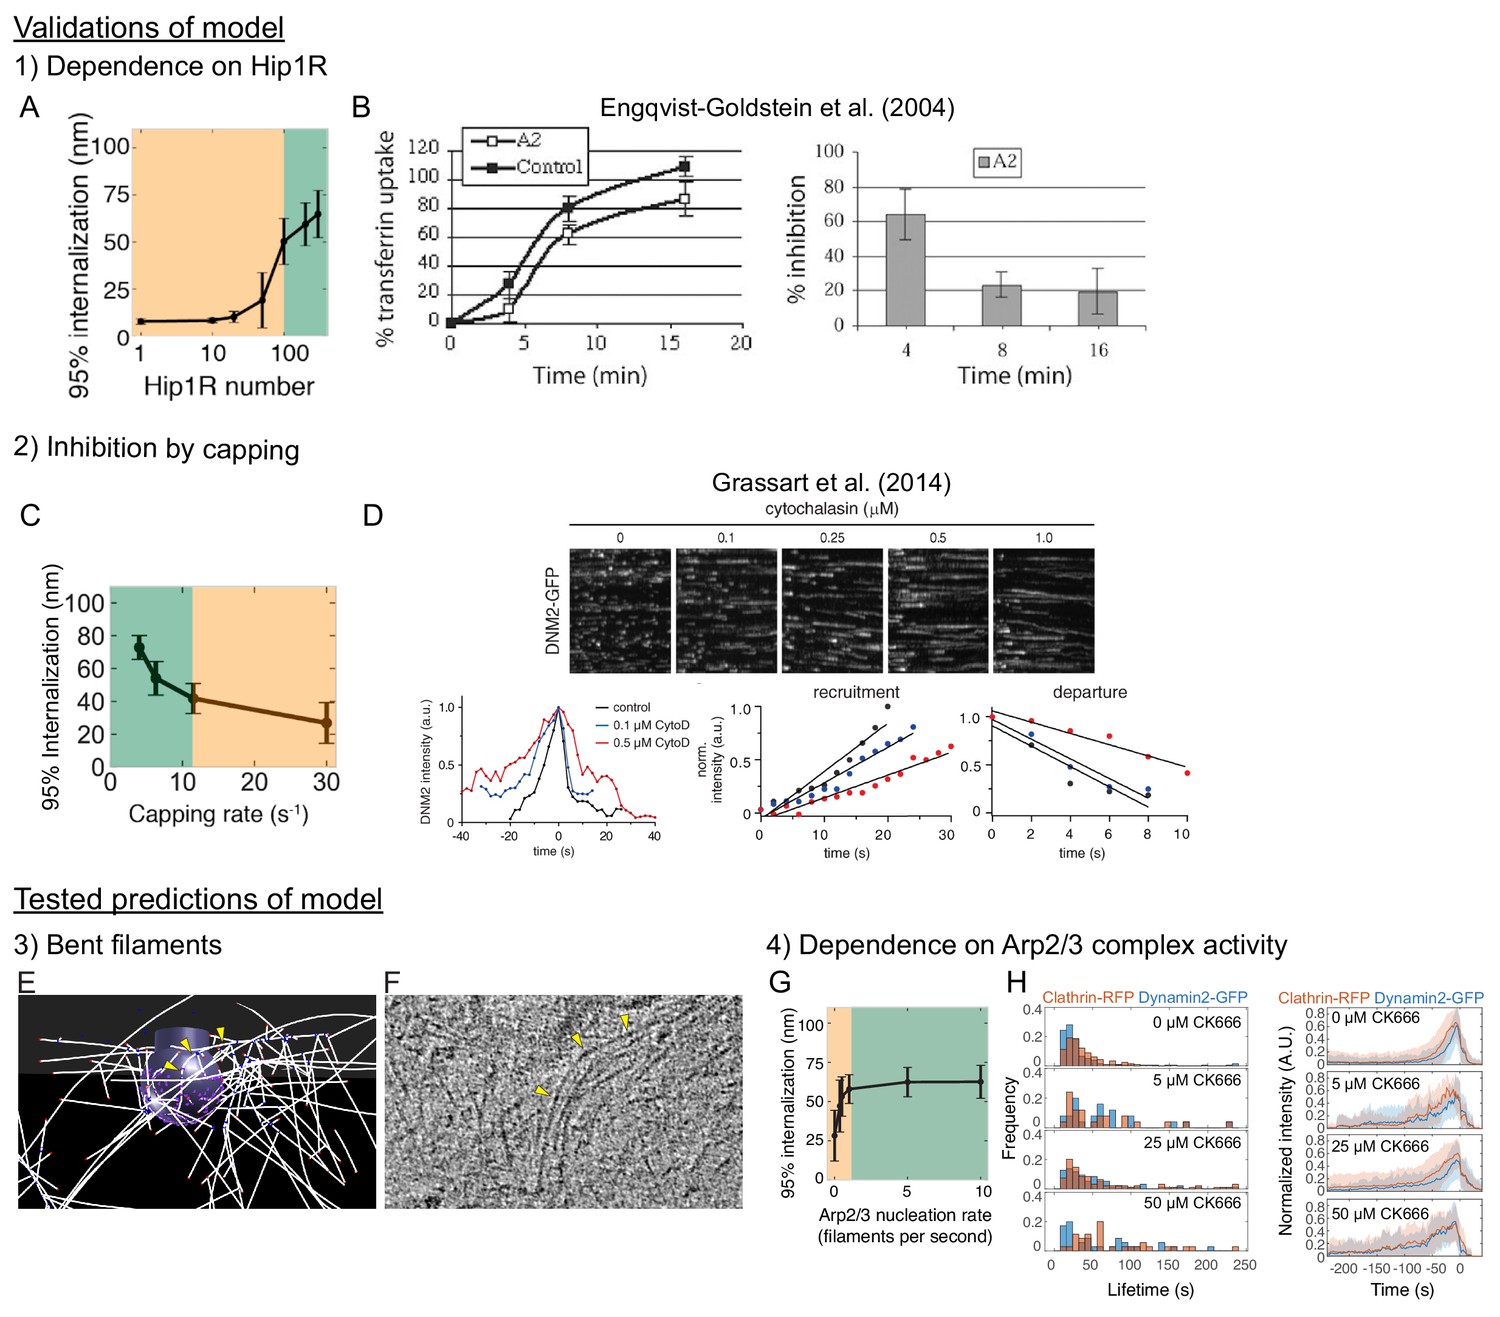
Summary of predictions of the model supported by experimental data in the current manuscript and in the literature.
(A, B) Dependence of CME on Hip1R. (A) Simulation varying number of Hip1R (Figure 4—figure supplement 3A). (B) Hip1R knockdown inhibits CME (transferrin uptake) in HeLa cells.. (C, D) Capping actin filaments inhibits CME. (C) Simulation (Figure 1—figure supplement 1C). (D) Slower assembly and disassembly of endogenous dynamin2-GFP at sites of endocytosis in SK-MEL-2 cells treated with different concentrations of Cytochalasin D. (E, F) Endocytic actin filaments bend at sites of mammalian endocytosis, tested by cryo-electron tomography of intact mammalian cells (Figure 5A–B). (G, H) Mammalian CME is sensitive to Arp2/3 complex activity, revealed by treating SK-MEL-2 cells expressing endogenous clathrin and dynamin2 fluorescent tags with the Arp2/3 complex inhibitor CK-666 (Figure 6B–D).
© 2004, American Society for Cell Biology, All Rights Reserved. Panel B is reproduced from Engqvist-Goldstein et al. (2004) with permission. It is not covered by the CC-BY 4.0 licence and further reproduction of this panel would need permission from the copyright holder.
© 2014, Rockefeller University Press, All Rights Reserved. Panel D is reproduced from Grassart et al. (2014) with permission. It is not covered by the CC-BY 4.0 licence and further reproduction of this panel would need permission from the copyright holder.
Tables
Key resources table
| Reagent type (species) or resource | Designation | Source or reference | Identifiers | Additional information |
|---|---|---|---|---|
| Gene (H. sapiens) | ArpC3 | HGNC:706 ARPC3 | ||
| Cell line (human) | WTC-10 hiPSC AP2-tagRFP-t ArpC3-tagGFP2 | This study | Cell line maintained in D. Drubin lab | |
| Transfected construct (H. sapiens) | 12mer-tagGFP2-FKBP | This study | Plasmid to transiently express calibration construct | |
| Transfected construct (H. sapiens) | 24mer-tagGFP2-FKBP | This study | Plasmid to transiently express calibration construct | |
| Transfected construct (H. sapiens) | 60mer-tagGFP2-FKBP | This study | Plasmid to transiently express calibration construct | |
| Transfected construct (H. sapiens) | 120mer-tagGFP2-FKBP | This study | Plasmid to transiently express calibration construct | |
| Antibody | mouse monoclonal anti-GAPDH | ProteinTech | 10494–1-AP (RRID:AB_2263076) | (1:5000 dilution) |
| Antibody | tag(C,G,Y)FP | Evrogen | 12101231265 | (1:2500 dilution) |
| Sequence-based reagent | ArpC3 crRNA | This paper | crRNA | CCGGGCUCCCUUCACUGUCC |
| Sequence-based reagent | ArpC3_sequencing primer | This paper | PCR primers | ACTTATTCTTATTAAGCGCCAGC |
| Sequence-based reagent | ArpC3_sequencing primer | This paper | PCR primers | CAGGGCTCTGGAGACGGT |
| Commercial assay or kit | Lipofectamine Stem | Thermo Fisher | STEM00003 | |
| Chemical compound, drug | AP21967 | Clontech | 635056 | |
| Chemical compound, drug | CK-666 | Sigma | SML0006 | |
| Software, algorithm | Cytosim | Nedelec and Foethke, 2007 | https://github.com/DrubinBarnes/Akamatsu_CME_manuscript | |
| Software, algorithm | MATLAB | Mathworks, Inc | R2017b | |
| Software, algorithm | Python | Python.org | 3.7 | |
| Software, algorithm | µ-Track | Jaqaman et al., 2008 | https://github.com/DrubinBarnes/Akamatsu_CME_manuscript |
Additional files
-
Supplementary file 1
Model parameters for continuum membrane mechanics model.
- https://cdn.elifesciences.org/articles/49840/elife-49840-supp1-v3.docx
-
Supplementary file 2
Parameters for coat pulling continuum mechanics simulations.
- https://cdn.elifesciences.org/articles/49840/elife-49840-supp2-v3.docx
-
Supplementary file 3
Parameters in the model.
- https://cdn.elifesciences.org/articles/49840/elife-49840-supp3-v3.docx
-
Transparent reporting form
- https://cdn.elifesciences.org/articles/49840/elife-49840-transrepform-v3.docx
Download links
A two-part list of links to download the article, or parts of the article, in various formats.
Downloads (link to download the article as PDF)
Open citations (links to open the citations from this article in various online reference manager services)
Cite this article (links to download the citations from this article in formats compatible with various reference manager tools)
Principles of self-organization and load adaptation by the actin cytoskeleton during clathrin-mediated endocytosis
eLife 9:e49840.
https://doi.org/10.7554/eLife.49840


