Intermittent hypoxia mediated by TSP1 dependent on STAT3 induces cardiac fibroblast activation and cardiac fibrosis
- The Second Hospital of Tianjin Medical University, China
- Peking University People's Hospital, China
Figures
Figure 1 with 1 supplement
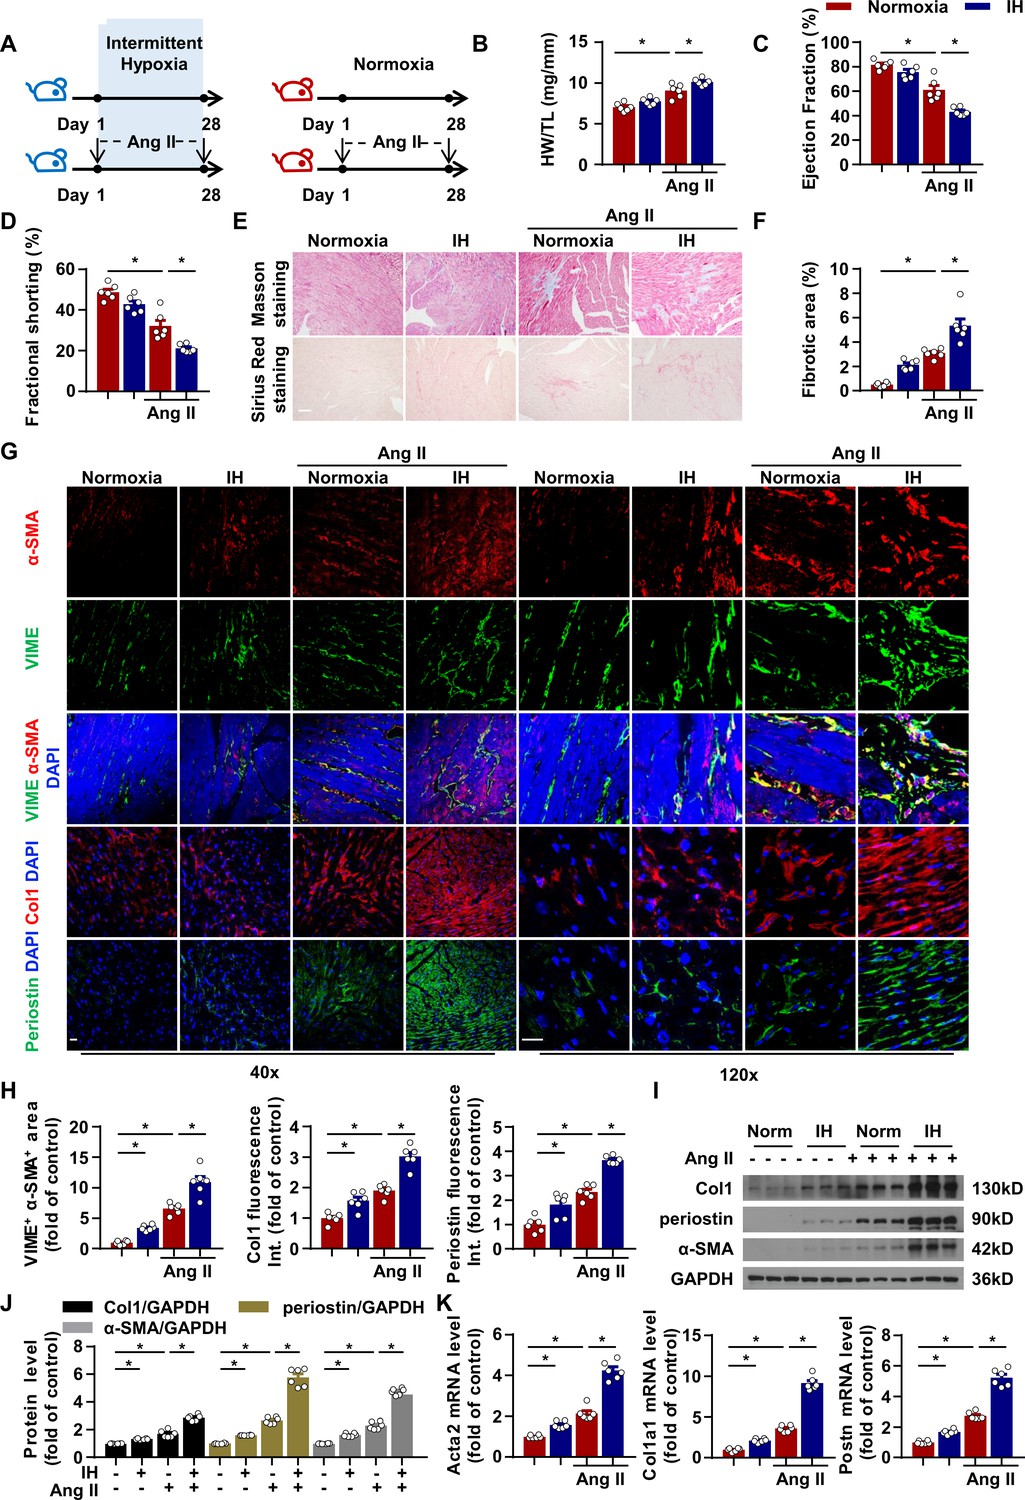
Intermittent hypoxia (IH) induces cardiac fibrosis and aggravates pathological cardiac dysfunction by promoting fibroblast activation in myocardial interstitium.
(A) C57BL/6 mice were housed under normoxia or IH with or without infusion of angiotensin II (Ang II) for 28 days. (B) Ratio of heart weight to tibial length of mice in each group. (C, D) Ejection fraction (EF) and fractional shortening (FS) of mice quantified by echocardiography. (E) Representative images of Masson and Sirius red staining of left ventricle. Scale bar, 100 μm. (F) Quantification of fibrotic area in (E). (G) Representative confocal microscopy images of immunofluorescence staining for α-SMA, vimentin (VIME, fibroblast marker), collagen I (Col1), periostin and DAPI. Scale bar, 20 μm. (H) Quantification of co-localization of α-SMA and VIME, Col1 and periostin fluorescence intensity in (G). (I) Col1, periostin, and α-SMA protein level in left ventricle detected by western blot analysis. (J) Quantification of Col1, periostin and α-SMA protein level in (I). (K) Quantification of Acta2, col1a1 and Postn mRNA expression. Data are mean ± SEM, n = 6 mice per group, *p<0.05, 2-way ANOVA with Bonferroni post-test. Data used for quantitative analyses as well as the numerical data that are represented in graphs are available in Figure 1—source data 1.
-
Figure 1—source data 1
Intermittent hypoxia (IH) induces fibroblast activation and cardiac fibrosis.
- https://cdn.elifesciences.org/articles/49923/elife-49923-fig1-data1-v2.xlsx
Figure 1—figure supplement 1

The effects of IH on cardiomyocyte morphology and apoptotic status.
(A) C57BL/6 mice exposed to intermittent hypoxia (IH) for 7 days. Mice were sacrificed 1 hr after pimonidazole injection. Representative confocal microscopy images of immunofluorescence staining for pimonidazole and DAPI. Scale bar, 100 μm. (B) C57BL/6 mice were housed under normoxia or IH with or without infusion of angiotensin II (Ang II) for 28 days. Quantification of cross-sectional area of cardiomyocytes in left ventricle. C) Ratio of TUNEL positive cells in left ventricle. Data are mean ± SEM, n = 6 mice per group, *p<0.05, 2-way ANOVA with Bonferroni post-test. Data used for quantitative analyses as well as the numerical data that are represented in graphs are available in Figure 1—figure supplement 1—source data 1.
-
Figure 1—figure supplement 1—source data 1
The effects of IH on cardiomyocyte morphology and apoptotic status.
- https://cdn.elifesciences.org/articles/49923/elife-49923-fig1-figsupp1-data1-v2.xlsx
Figure 2
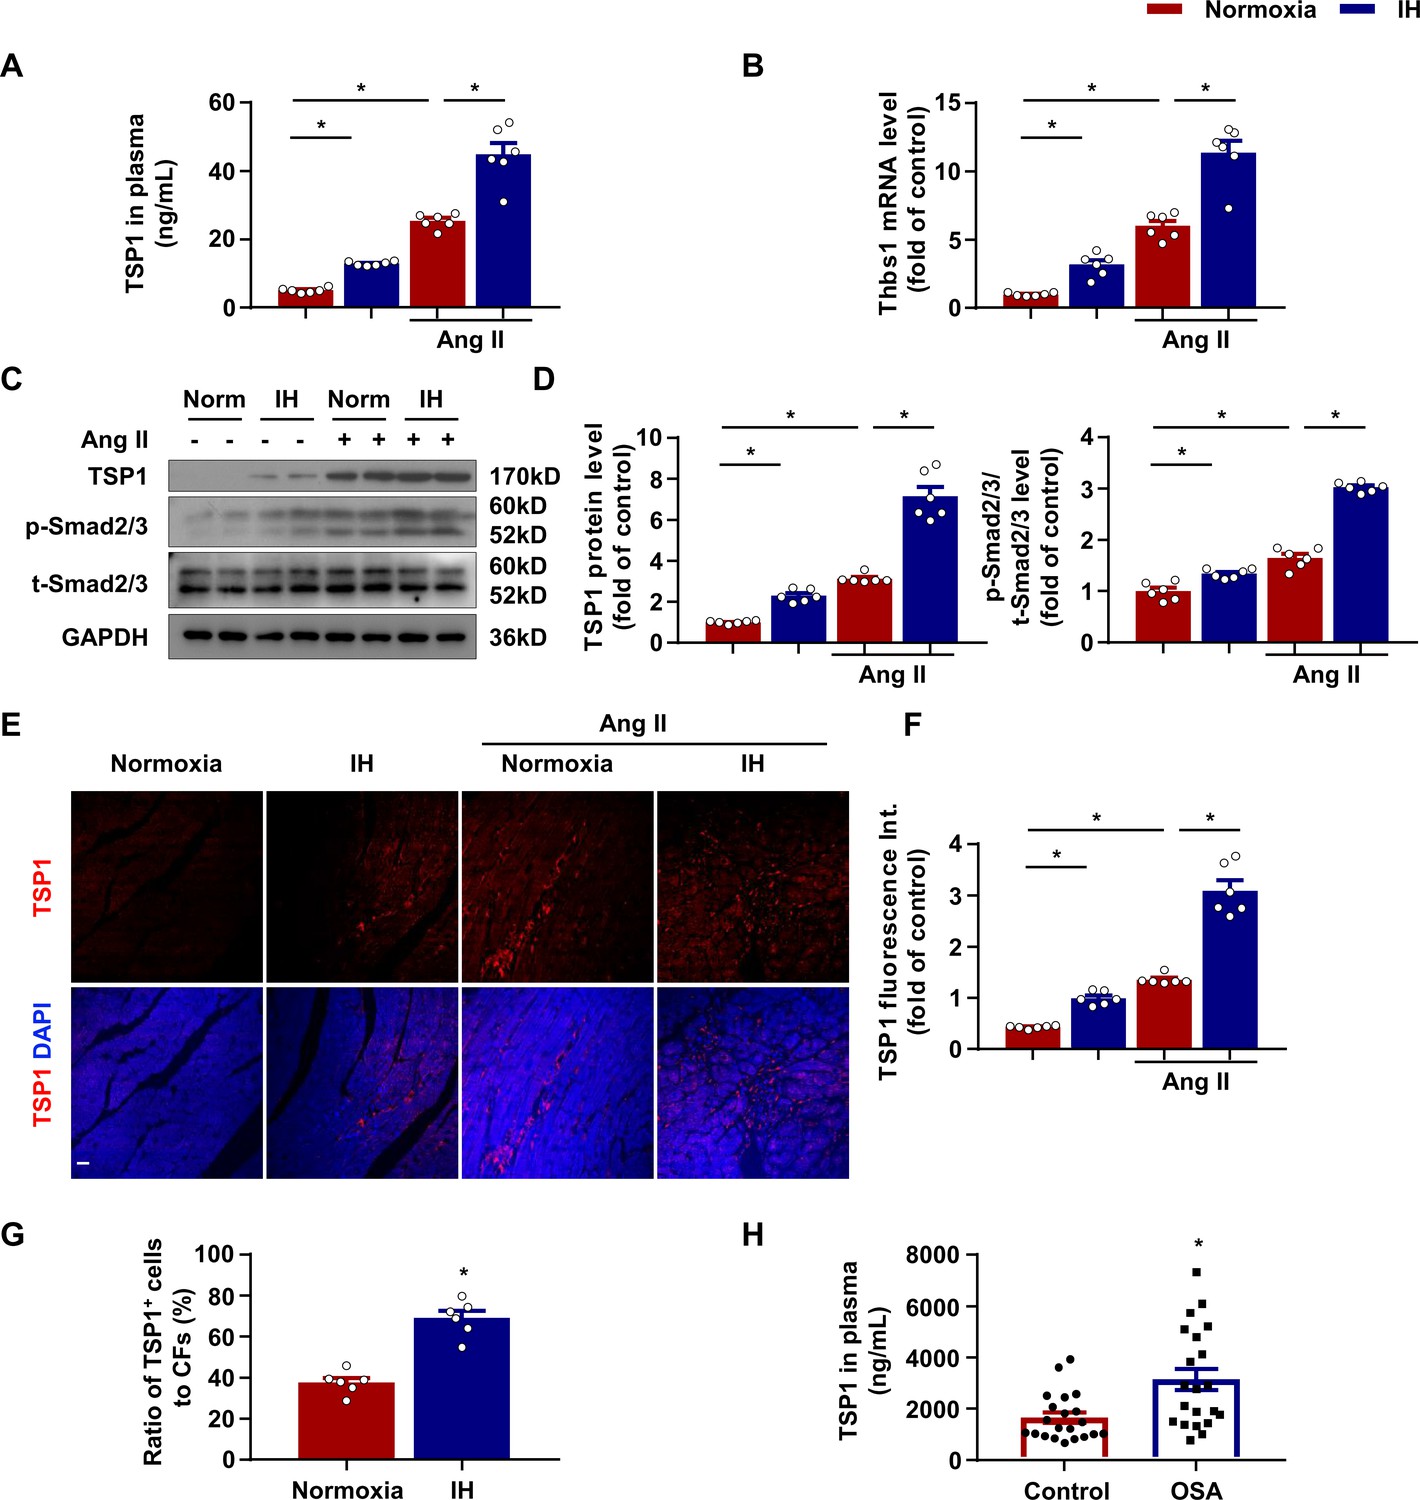
Increased thomsbospondin-1 (TSP1) expression in mice after IH exposure.
(A) C57BL/6 mice were housed under normoxia or IH with or without infusion of Ang II for 28 days. Plasma concentration of TSP1 in mice detected by ELISA. (B) Thbs1 mRNA level in left ventricle of mice exposed to IH with or without infusion of Ang II for 14 days quantified by RT-PCR. (C) C57BL/6 mice were housed under normoxia or IH with or without infusion of Ang II for 28 days. The protein levels of TSP1, phosphorylated Smad2/3 (p-Smad2/3), and total Smad2/3 (t-Smad2/3) in left ventricle of mice detected by western blot analysis. (D) Quantification of TSP1 and p-Smad2/3 in (C). (E) Representative confocal microscopy images of immunofluorescence staining for TSP1 and DAPI. Scale bar, 20 μm. (F) Quantification of TSP1 fluorescent intensity in (E). Data are mean ± SEM, n = 6 mice per group, *p<0.05, 2-way ANOVA with Bonferroni post-test. (G) Quantification of number of cells negative for CD45, CD31, CD11b, and Ter119 and positive for Thy1 from left ventricle tissue digestion, that stained positive for intracellular TSP1 by flow cytometry. Data are mean ± SEM, n = 6, *p<0.05, unpaired 2-tail t test. (H) Plasma concentration of TSP1 in healthy individuals and patients with obstructive sleep apnea (OSA) detected by ELISA. Data are mean ± SEM, n = 21, *p<0.05, unpaired 2-tail t test. Data used for quantitative analyses as well as the numerical data that are represented in graphs are available in Figure 2—source data 1.
-
Figure 2—source data 1
Intermittent hypoxia (IH) increased thomsbospondin-1 (TSP1) expression.
- https://cdn.elifesciences.org/articles/49923/elife-49923-fig2-data1-v2.xlsx
Figure 3
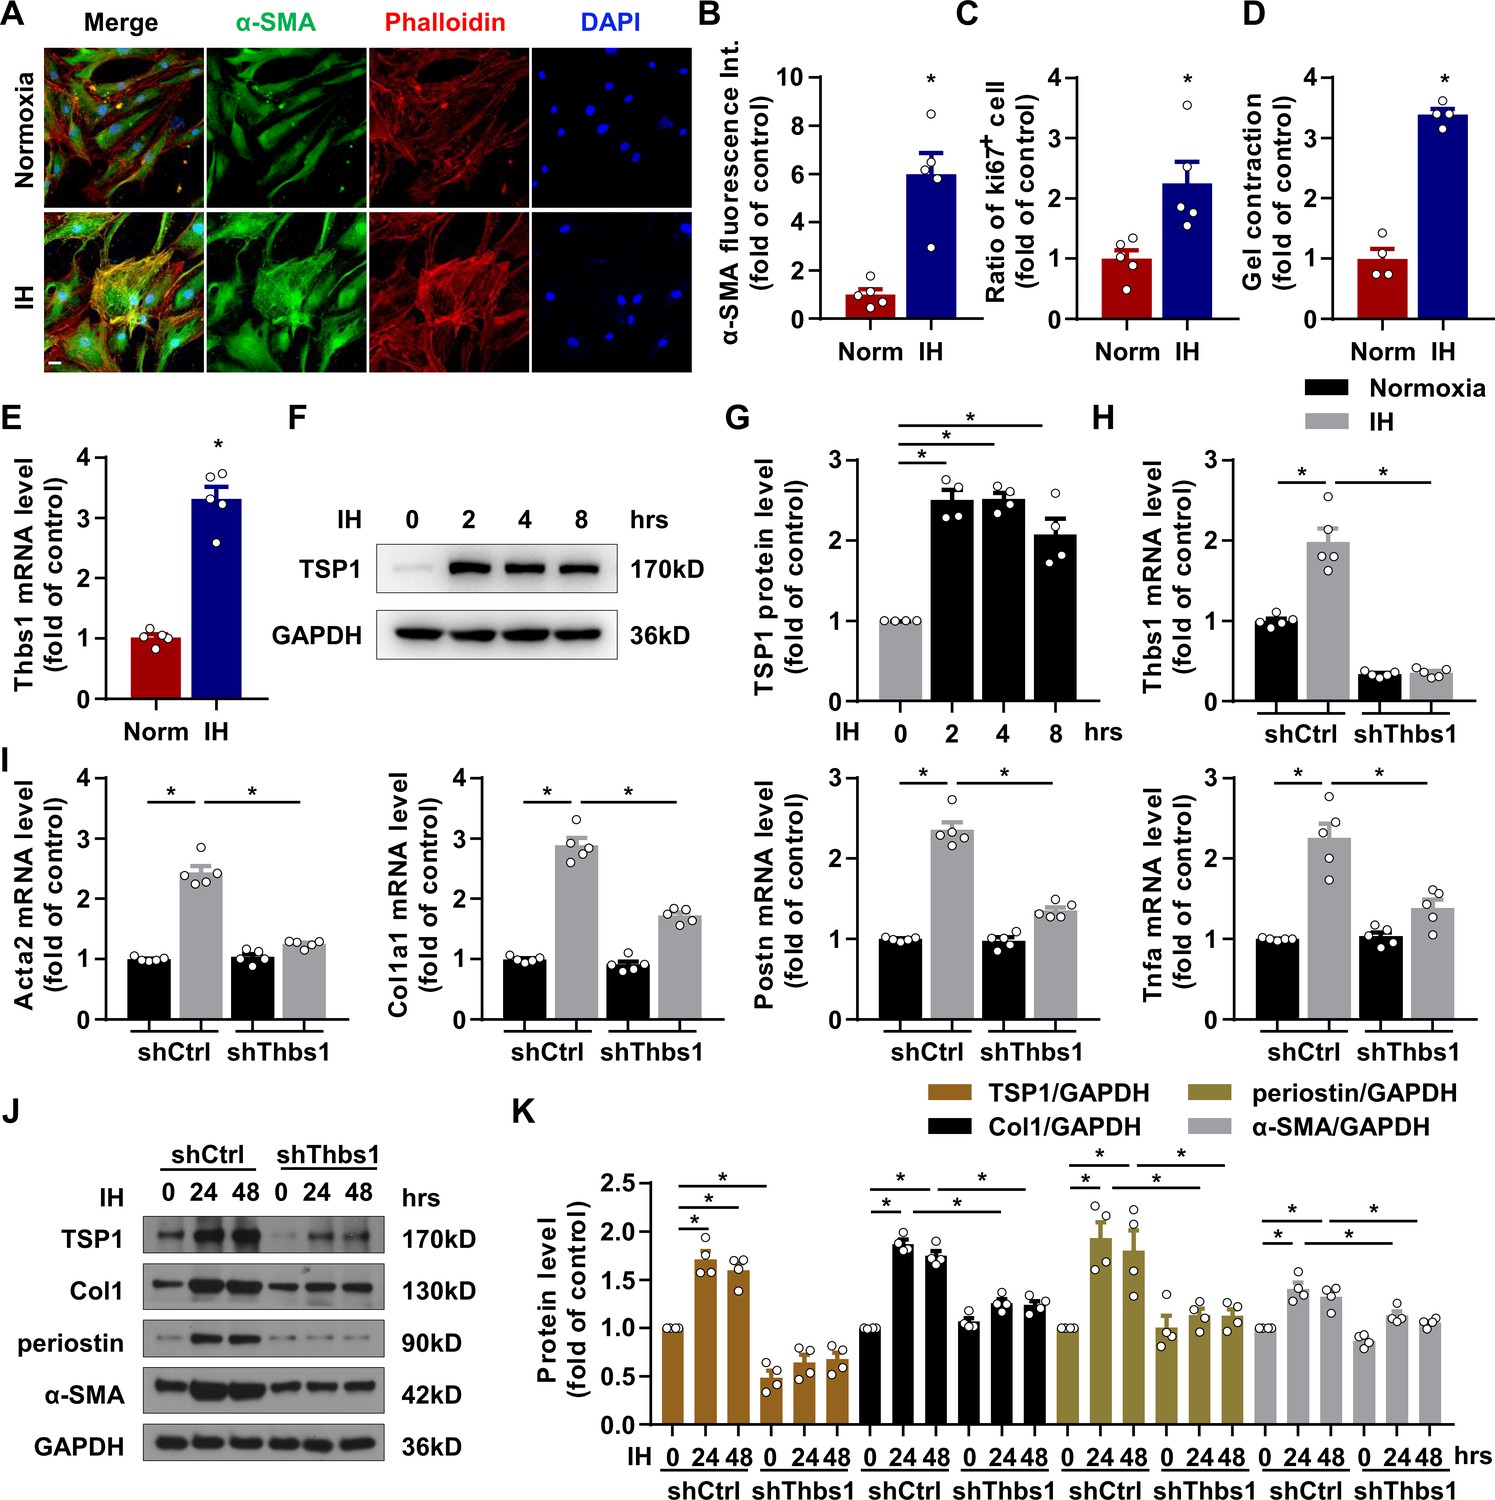
IH induced cardiac fibroblast (CF) activation via TSP1.
(A) Mouse primary CFs (mPCFs) were cultured under normoxia or IH for 24 hr. Representative confocal microscopy images of immunofluorescence stained for α-SMA, phalloidin and DAPI. Scale bar, 20 μm. (B) α-SMA fluorescence intensity quantification. (C) Ratio of Ki67 positive cells to total mPCFs after IH exposure for 24 hr. Data are mean ± SEM, n = 5 independent experiments, *p<0.05, unpaired 2-tail t test. (D) Quantification of gel contraction by mPCFs after IH exposure for 24 hr. Data are mean ± SEM, n = 4 independent experiments, *p<0.05, unpaired 2-tail t test. (E) Thbs1 mRNA levels detected by RT-PCR. Data are mean ± SEM, n = 5 independent experiments, *p<0.05, unpaired 2-tail t test. (F) Expression of TSP1 in mPCFs exposed to IH for the indicated time detected by western blot analysis. (G) Quantification of TSP1 in (F). Data are mean ± SEM, n = 4 independent experiments, *p<0.05, 1-way ANOVA with Bonferroni post-test. (H–K) mPCFs were infected with lentivirus to deliver Thbs1 shRNA (LV-shThbs1) or control shRNA (LV-shCtrl) for 48 hr, then cultured under normoxia or IH for 24 hr. (H–I) Thbs1, Acta2, Col1a1, Postn and Tnfa mRNA levels detected by RT-PCR. Data are mean ± SEM, n = 5 independent experiments, *p<0.05, 2-way ANOVA with Bonferroni post-test. (J) Protein level of TSP1, collagen I (Col1), periostin and α-SMA detected by western blot analysis. (K) Quantification of TSP1, Col1, periostin and α-SMA in J). Data are mean ± SEM, n = 4 independent experiments, *p<0.05, 2-way ANOVA with Bonferroni post-test. Data used for quantitative analyses as well as the numerical data that are represented in graphs are available in Figure 3—source data 1.
-
Figure 3—source data 1
Intermittent hypoxia (IH) induced cardiac fibroblast (CF) activation.
- https://cdn.elifesciences.org/articles/49923/elife-49923-fig3-data1-v2.xlsx
Figure 4
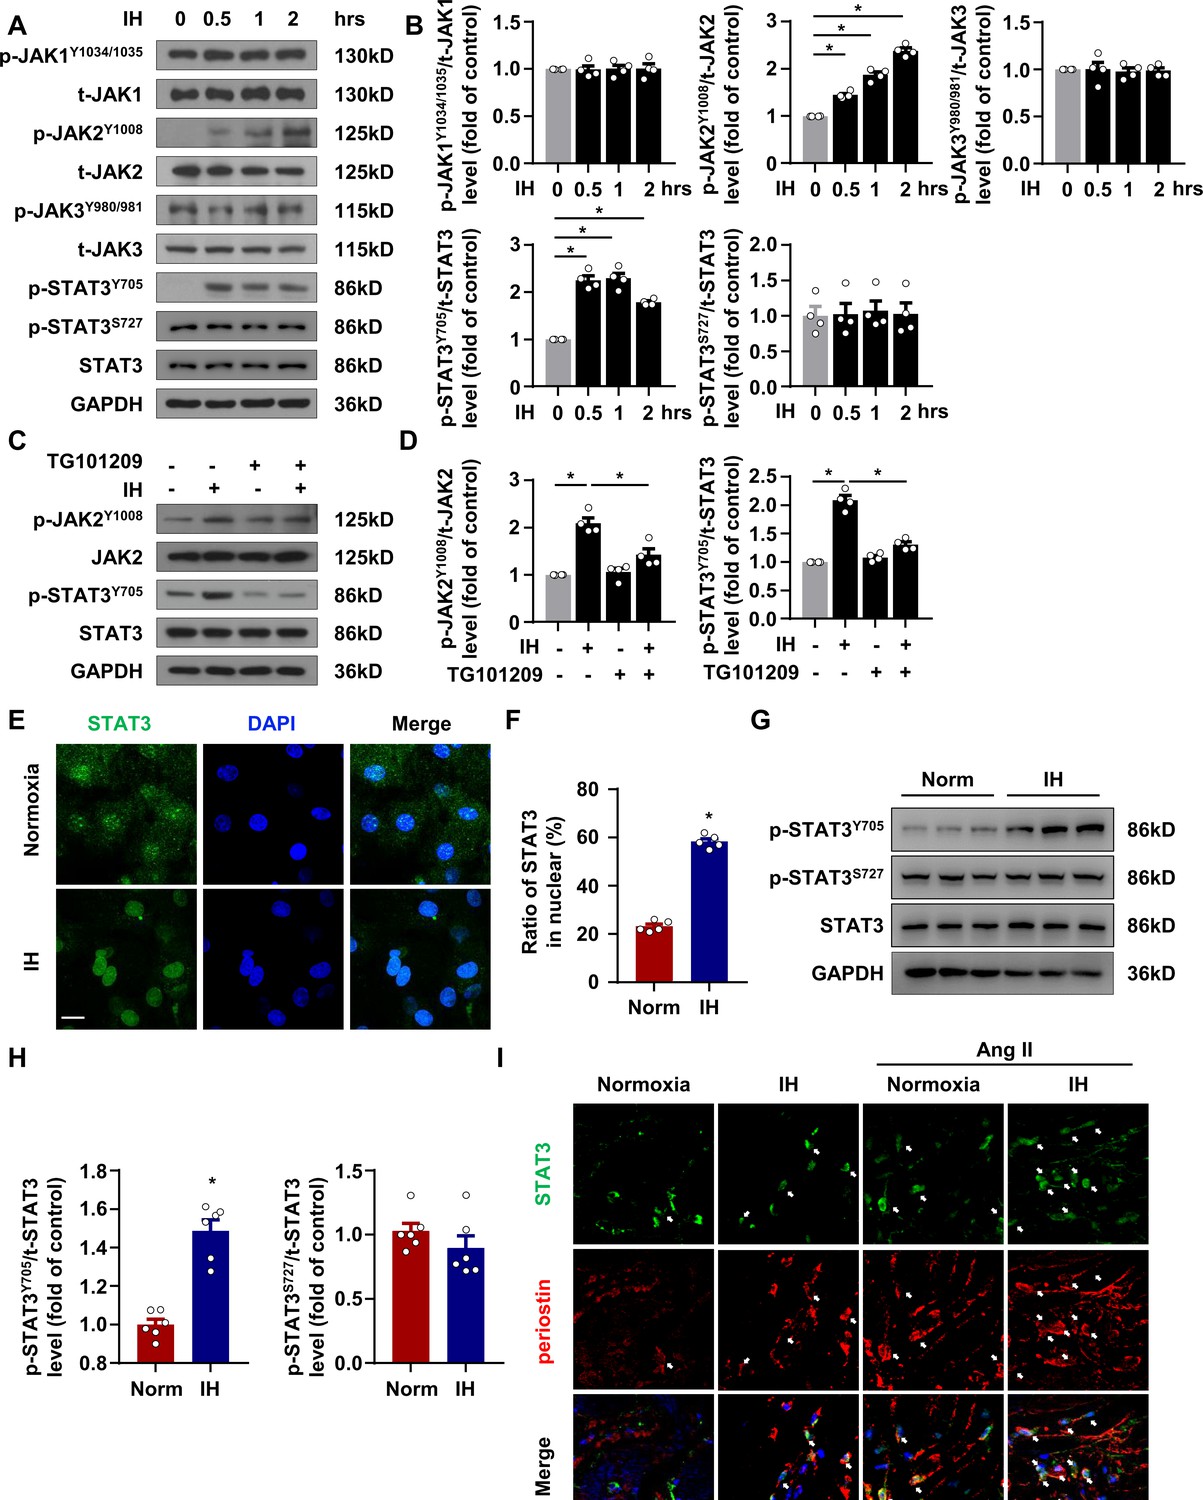
IH induced STAT3 signaling activation in CFs.
(A) mPCFs were cultured and exposed to IH for the indicated time. The protein levels of phosphorylated JAK1 at Tyr1034/1035 (p-JAK1Y1034/1035), total JAK1 (t-JAK1), p-JAK2 at Tyr1008 (p-JAK2Y1008), total JAK2 (t-JAK2), p-JAK3 at Tyr980/981 (p-JAK3Y980/981), total JAK3 (t-JAK3), p-STAT3 at Tyr705 (p-STAT3Y705) and Ser727 (p-STAT3S727) and total STAT3 (t-STAT3) detected by western blot analysis. (B) Quantification of indicated protein levels in (A). Data are mean ± SEM, n = 4 independent experiments, *p<0.05, 1-way ANOVA with Bonferroni post-test. (C–D) mPCFs were cultured and exposed to IH for 1 hr with or without TG101209 (2 μM). Indicated protein levels were analyzed (D). (E) mPCFs were exposed to IH for 1 hr. Representative confocal microscopy images of immunofluorescence staining for STAT3 and DAPI. Scale bar, 20 μm. (F) Quantification of subcellular localization of STAT3 in (E). Data are mean ± SEM, n = 5 independent experiments, *p<0.05, unpaired 2-tail t test. (G) The protein levels of p-STAT3Y705 and p-STAT3S727 in ventricles of mice with or without IH detected by western blot analysis. (H) Quantification of p-STAT3Y705, p-STAT3S727 and t-STAT3 in (E). Data are mean ± SEM, n = 6 mice per group, *p<0.05, unpaired 2-tail t test. (I) Representative confocal microscopy images of immunofluorescence staining for STAT3, periostin, and DAPI in mice exposed IH with or without Ang II infusion for 4 weeks. The white arrows indicate periostin-positive cells with nuclear localization of STAT3. Scale bar, 10 μm. Data used for quantitative analyses as well as the numerical data that are represented in graphs are available in Figure 4—source data 1.
-
Figure 4—source data 1
Intermittent hypoxia induced STAT3 signaling activation.
- https://cdn.elifesciences.org/articles/49923/elife-49923-fig4-data1-v2.xlsx
Figure 5 with 1 supplement
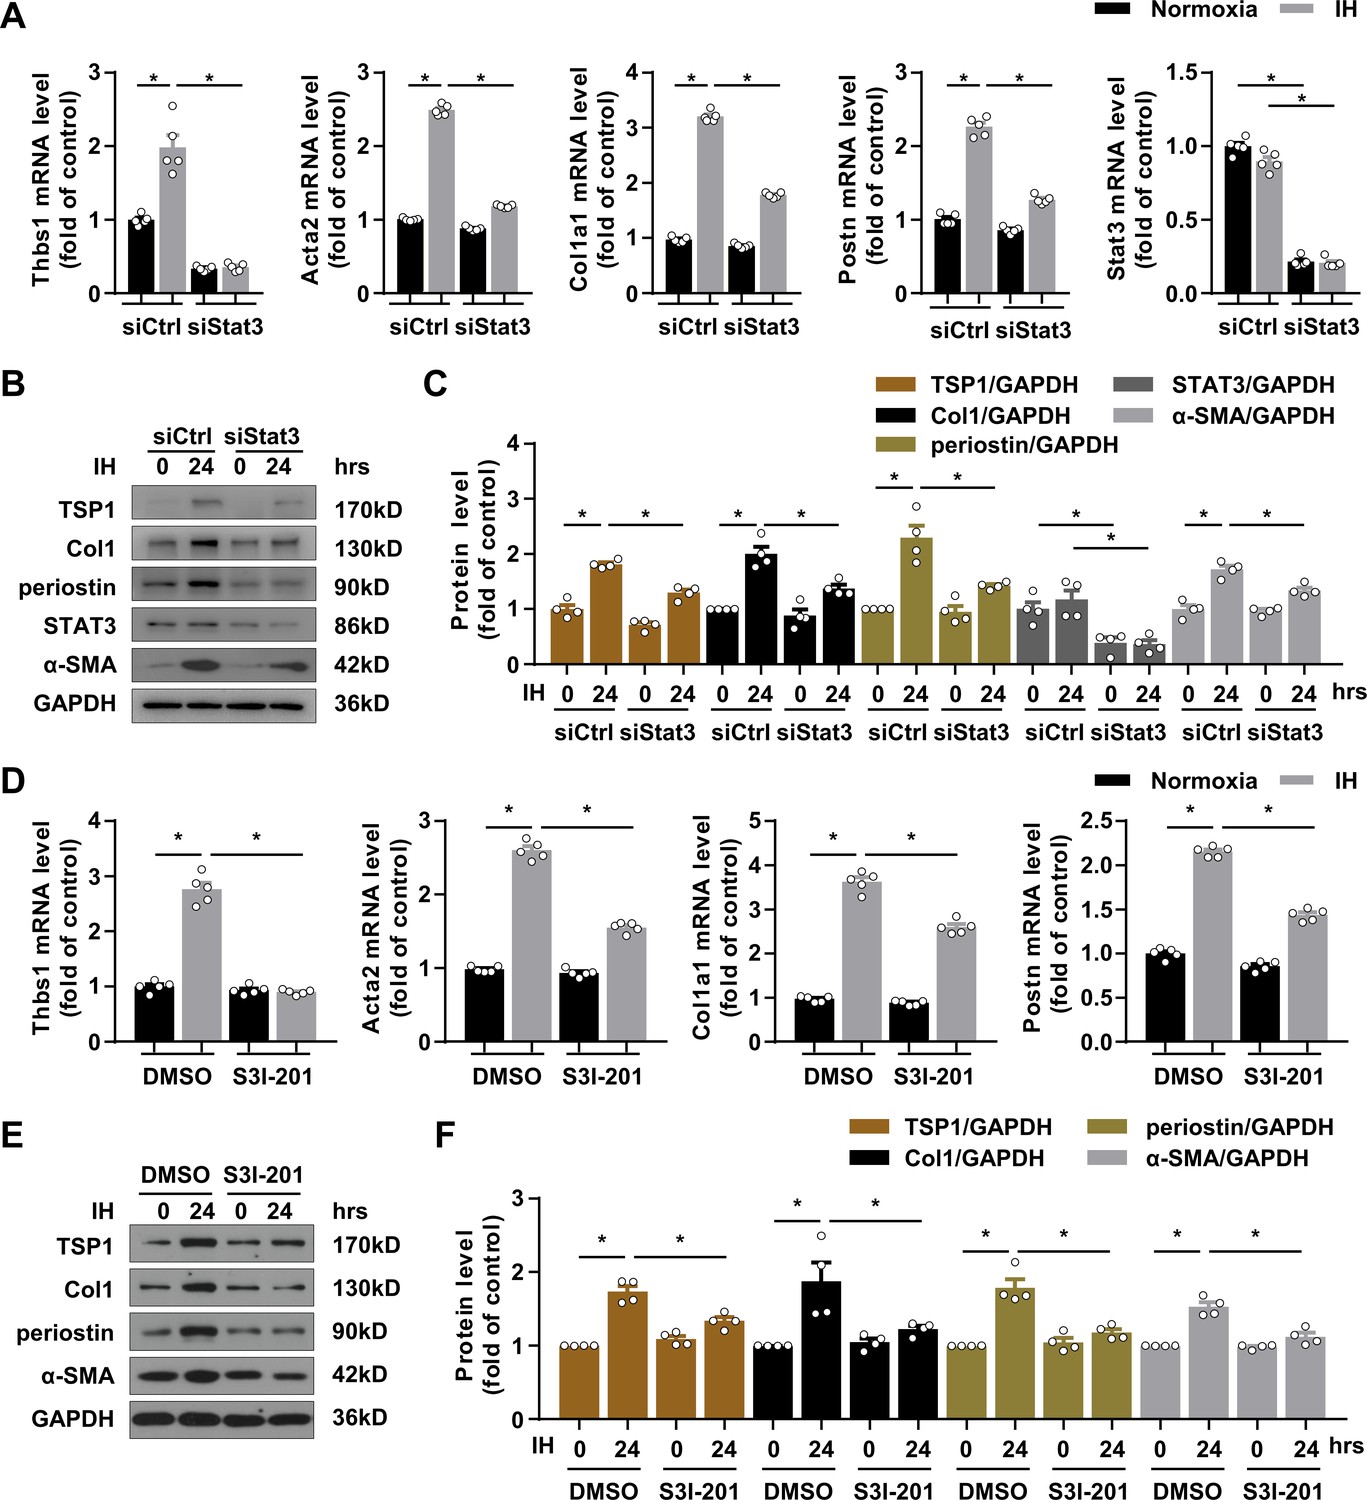
Silencing and inactivating STAT3 downregulated TSP1 expression and attenuated IH-induced CF activation.
(A–C) mPCFs were transduced with STAT3 siRNA (siSTAT3) or control siRNA (siCtrl) for 24 hr, then cultured under normoxia or IH for 24 hr. (A) Thbs1, Acta2, Col1a1, Postn, Stat3 mRNA levels were quantified by RT-PCR. Data are mean ± SEM, n = 5 independent experiments, *p<0.05, 2-way ANOVA with Bonferroni post-test. (B) The protein levels of TSP1, collagen I (Col1), periostin, STAT3 and α-SMA detected by western blot analysis. (C) Quantification of TSP1, Col1, periostin, STAT3 and α-SMA protein level in (B). Data are mean ± SEM, n = 4 independent experiments, *p<0.05, 2-way ANOVA with Bonferroni post-test. (D–F) mPCFs were cultured under normoxia and IH for 24 hr with or without S3I-201 (100 ng/mL). (D) Thbs1, Acta2, Col1a1, and Postn, mRNA levels detected by RT-PCR and quantified. Data are mean ± SEM, n = 5 independent experiments, *p<0.05, 2-way ANOVA with Bonferroni post-test. (E) The protein levels of TSP1, Col1, periostin, and α-SMA detected by western blot analysis. (F) Quantification of TSP1, Col1, periostin, and α-SMA protein level in (E). Data are mean ± SEM, n = 4 independent experiments, *p<0.05, 2-way ANOVA with Bonferroni post-test. Data used for quantitative analyses as well as the numerical data that are represented in graphs are available in Figure 5—source data 1.
-
Figure 5—source data 1
Silencing or inactivating STAT3 downregulated TSP1 expression.
- https://cdn.elifesciences.org/articles/49923/elife-49923-fig5-data1-v2.xlsx
Figure 5—figure supplement 1
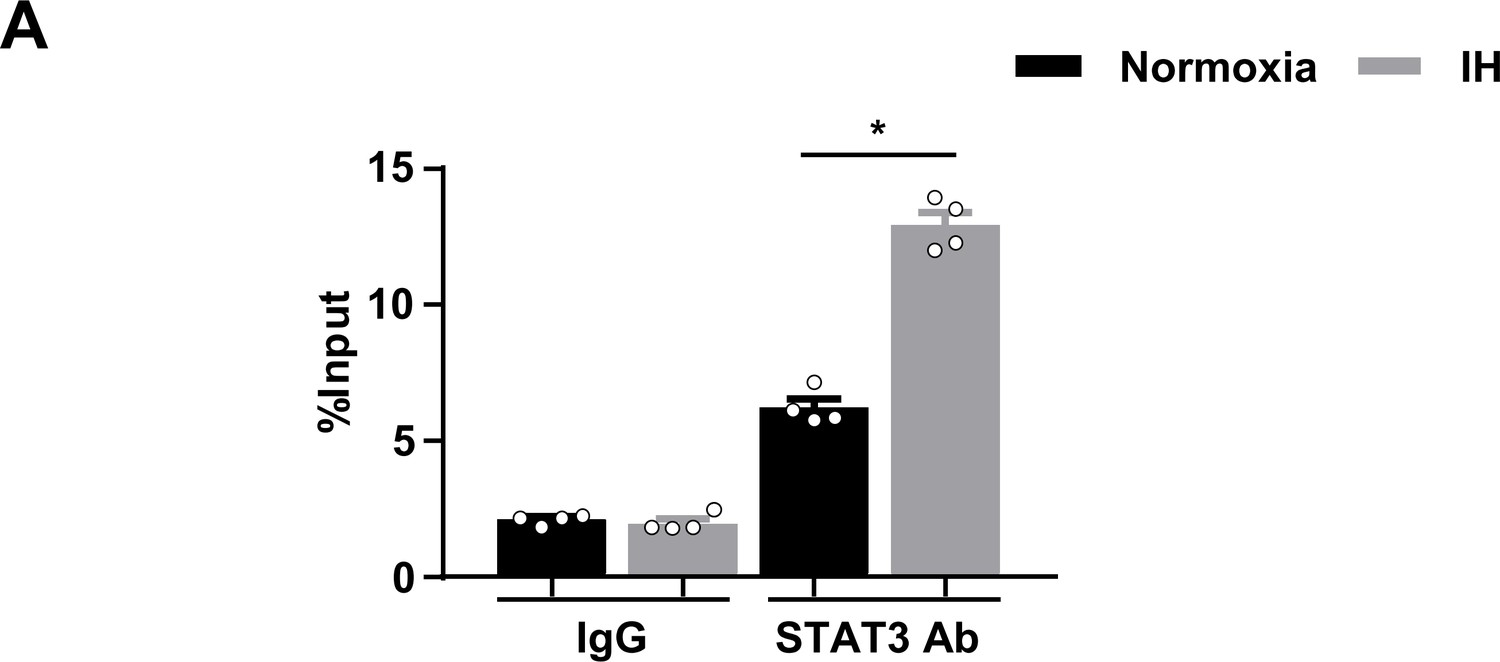
Chromatin inmmunoprecipitation (ChIP) quantitative PCR assay showed the binding of STAT3 to the Thbs1 promoter.
(A) mPCFs were cultured under normoxia and IH for 24 hr. Chromatin immunoprecipitation (ChIP) quantitative PCR analysis of STAT3 binding on the Thbs1 genomic locus involved antibodies against STAT3, or rabbit IgG. The fold enrichment of the Thbs1 locus was determined by quantitative PCR and calculated as percentage of input. Data are mean ± SEM (n = 4 independent experiments). *p<0.05, unpaired 2-tail t test. Data used for quantitative analyses as well as the numerical data that are represented in graphs are available in Figure 5—figure supplement 1—source data 1.
-
Figure 5—figure supplement 1—source data 1
Chromatin inmmunoprecipitation (ChIP) quantitative PCR assay.
- https://cdn.elifesciences.org/articles/49923/elife-49923-fig5-figsupp1-data1-v2.xlsx
Figure 6 with 1 supplement

STAT3 inhibitor ameliorated IH-induced cardiac fibrosis.
(A) C57BL/6 mice exposed to IH with or without infusion of Ang II were treated with S3I-201 or vehicle. (B) Ratio of heart weight to tibial length of mice. (C) Quantification of ejection fraction (EF) after echocardiography of mice. (D) Representative Masson staining of left ventricle of mice. Immunofluorescence staining of left ventricle for TSP1, periostin, Collagen I (Col1), α-SMA, VIME and DAPI. Scale bar, 100 μm. (E) Quantification of fibrotic area in Masson-stained slides (D), quantification of TSP1, periostin, and Col1 fluorescent intensity in (D), and quantification of co-localization of α-SMA and VIME in (D). (F) Protein levels of TSP1, Col1, periostin, p-STAT3Y705, t-STAT3 and α-SMA in left ventricle of mice detected by western blot analysis. (G) Quantification of TSP1, Col1, periostin, p-STAT3Y705 and α-SMA in (F) Data are mean ± SEM, n = 6 mice per group, *p<0.05, 2-way ANOVA with Bonferroni post-test. (H) Schematic diagram depicting the key findings of this study. IH induced cardiac fibrosis via a STAT3/TSP1/Smad pathway. Data used for quantitative analyses as well as the numerical data that are represented in graphs are available in Figure 6—source data 1.
-
Figure 6—source data 1
Effect of pharmacological inhibition of STAT3 on IH-induced cardiac dysfunction and fibrosis.
- https://cdn.elifesciences.org/articles/49923/elife-49923-fig6-data1-v2.xlsx
Figure 6—figure supplement 1

Genetic inhibition of STAT3 ameliorates IH-induced cardiac dysfunction and fibrosis.
(A) C57BL/6 mice were treated with S3I-201 or vehicle for 14 days after exposure to IH and Ang II for 28 days. (B) Ratio of heart weight to tibial length of mice. (C) Quantification of ejection fraction (EF) after echocardiography of mice. D) Representative Masson and Sirius red staining of left ventricle of mice. Scale bar, 100 μm. (E) Quantification of fibrotic area in Masson-stained slides (D). Data are mean ± SEM, n = 6 mice per group, *p<0.05, unpaired 2-tail t test. (F) C57BL/6 mice infected with AAV9-periostin promoter-shStat3 (AAV9-Postn Prom-shStat3) or AAV9-periostin promoter-shScramble (AAV9-Postn Prom-shScramble) were exposed to IH with or without infusion of Ang II for 28 days. (G) Quantification of number of cells negative for CD45, CD31, CD11b, and Ter119 and positive for Thy1 from left ventricle tissue digestion that stained positive for intracellular STAT3 by flow cytometry. Data are mean ± SEM, n = 6 mice per group, *p<0.05, unpaired 2-tail t test. (H) Ratio of heart weight to tibial length of mice. (I) Quantification of ejection fraction (EF) after echocardiography of mice. (J) Representative Masson and Sirius red staining of left ventricle of mice. Scale bar, 100 μm. K) Quantification of fibrotic area in Masson-stained slides (J). Data are mean ± SEM, n = 6 mice per group, *p<0.05, 2-way ANOVA with Bonferroni post-test. Data used for quantitative analyses as well as the numerical data that are represented in graphs are available in Figure 6—figure supplement 1—source data 1.
-
Figure 6—figure supplement 1—source data 1
Effect of genetic inhibition of STAT3 on IH-induced cardiac dysfunction and fibrosis.
- https://cdn.elifesciences.org/articles/49923/elife-49923-fig6-figsupp1-data1-v2.xlsx
Author response image 1
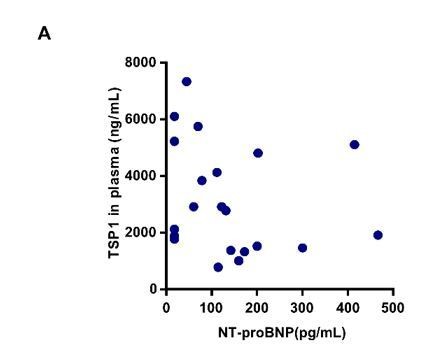
Correlation between NT-proBNP and TSP1 level.
(A) Plasma concentration of TSP1 and NT-proBNP in patients with obstructive sleep apnea (OSA), detected by ELISA and fluorescent immunochromatography. Correlation between NT-proBNP and TSP1 level. Pearson r = -0.2, P=0.3846.
Author response image 2
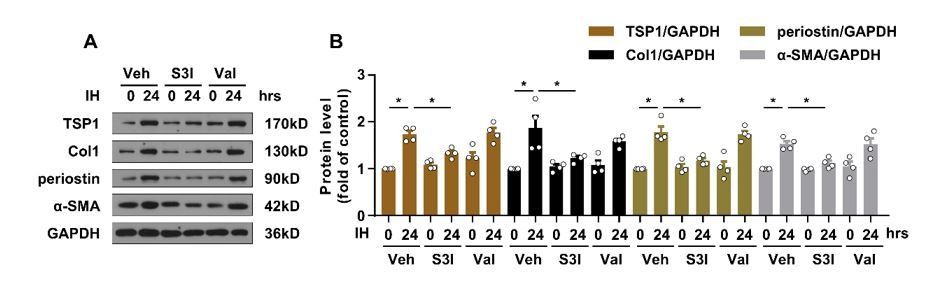
Effect of valsartan on IH-induced TSP1 expression.
(A) mPCFs were cultured under normoxia and IH for 24 hr with or without S3I-201 (S3I, 100 ng/mL) or valsartan (Val, 200 μM). The protein levels of collagen I (Col1), periostin, and α-SMA were detected by western blot analysis. (B) Quantification of Col1, periostin and α-SMA protein level in (A). Data are mean ± SEM, n=4 independent experiments, *P<0.05, 2-way ANOVA with Bonferroni post-test.
Author response image 3
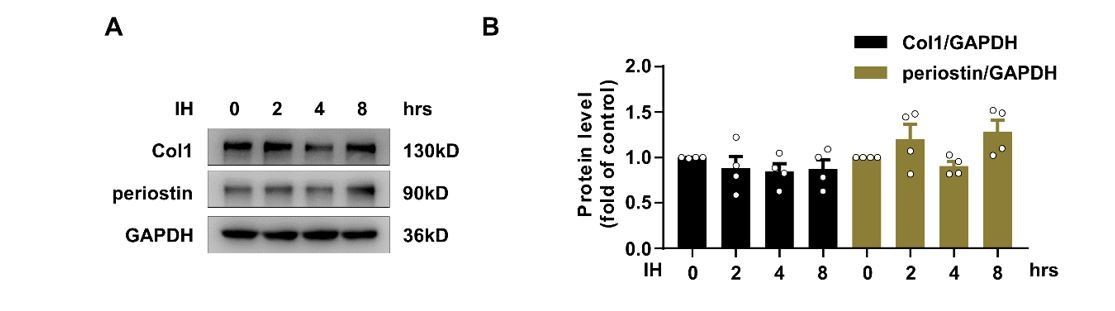
Effect of Intermittent hypoxia (IH) on the expression of collagan I and periostin.
(A) Expression of TSP1, collagen I (Col1) and periostin in mPCFs exposed to IH for the indicated time detected by western blot analysis. (B) Quantification of TSP1, Col1 and periostin in (A). Data are mean ± SEM, n=4 independent experiments, *P<0.05, 1-way ANOVA with Bonferroni post-test.
Tables
Key resources table
| Reagent type (species) or resource | Designation | Source or reference | Identifiers | Additional information |
|---|---|---|---|---|
| Antibody | anti-thrombospondin-1 (Rabbit monoclonal) | Cell Signaling Technology | Cat# 37879 | WB (1:1000) |
| Antibody | anti-phospho-SMAD2/3 (Rabbit monoclonal) | Cell Signaling Technology | Cat# 8828 | WB (1:1000) |
| Antibody | anti-SMAD2/3 (Rabbit monoclonal) | Cell Signaling Technology | Cat# 8685 | WB (1:1000) |
| Antibody | anti-phospho-JAK1 (Rabbit monoclonal) | Cell Signaling Technology | Cat# 74129 | WB (1:1000) |
| Antibody | anti-phospho-JAK2 (Rabbit monoclonal) | Cell Signaling Technology | Cat# 8082 | WB (1:1000) |
| Antibody | anti-phospho-JAK3 (Rabbit monoclonal) | Cell Signaling Technology | Cat# 5031 | WB (1:1000) |
| Antibody | anti-JAK1 (Rabbit monoclonal) | Cell Signaling Technology | Cat# 3344 | WB (1:1000) |
| Antibody | anti-JAK2 (Rabbit monoclonal) | Cell Signaling Technology | Cat# 3230 | WB (1:1000) |
| Antibody | anti-JAK3 (Rabbit monoclonal) | Cell Signaling Technology | Cat# 8827 | WB (1:1000) |
| Antibody | anti-phospho-STAT3(Tyr705) (Rabbit monoclonal) | Cell Signaling Technology | Cat# 9145 | WB (1:1000) |
| Antibody | anti-phospho-STAT3(Ser727) (Rabbit polyclonal) | Cell Signaling Technology | Cat# 9134 | WB (1:1000) |
| Antibody | anti-STAT3 (Rabbit monoclonal) | Cell Signaling Technology | Cat# 12640 | WB (1:1000) ChIP (1:50) |
| Antibody | anti-STAT3 (Mouse monoclonal) | Cell Signaling Technology | Cat# 9139 | IF (1:100) FACS (1 μL per test) |
| Antibody | Normal Rabbit IgG | Cell Signaling Technology | Cat# 2729 | ChIP (1 μg per test) |
| Antibody | anti-thrombospondin antibody (Mouse monoclonal) | Abcam | Cat# ab1823 | IF (1:50) FACS (1 μL per test) |
| Antibody | anti-αSMA (Mouse monoclonal) | Abcam | Cat# ab7817 | WB (1:1000) IF (1:100) |
| Antibody | anti-Collagen I antibody (Mouse monoclonal) | Abcam | Cat# ab6308 | WB (1:1000) IF (1:100) |
| Antibody | anti-periostin (Rabbit polyclonal) | Abcam | Cat# ab14041 | WB (1:1000) IF (1:100) |
| Antibody | anti-vimentin (Rabbit monoclonal) | Abcam | Cat# ab92547 | IF (1:500) |
| Antibody | anti-GAPDH (Mouse monoclonal) | Proteintech | Cat# 60004 | WB (1:1000) |
| Antibody | anti-Ki67 (Rabbit monoclonal) | HuaAn Biotechnology Co | Cat# ET1609-34 | IF (1:100) |
| Antibody | anti-mouse CD45-PE Cy7 (Rat monoclonal) | BioLegend | Cat# 103114 | FACS (1 μL per test) |
| Antibody | anti-mouse CD31-PE Cy7 (Rat monoclonal) | BioLegend | Cat# 102523 | FACS (1 μL per test) |
| Antibody | anti-mouse CD11b-PE Cy7 (Rat monoclonal) | BioLegend | Cat# 101215 | FACS (1 μL per test) |
| Antibody | anti-mouse Ter119-PE Cy7 (Rat monoclonal) | BioLegend | Cat# 116221 | FACS (1 μL per test) |
| Antibody | anti-mouse thy1- Alexa Fluor 488 (Mouse monoclonal) | BioLegend | Cat# 202505 | FACS (1 μL per test) |
| Antibody | anti-mouse thy1- Alexa Fluor 488 (Rat monoclonal) | BioLegend | Cat# 105315 | FACS (1 μL per test) |
| Antibody | PE RAT anti-mouse IgG1 | BD Biosciences | Cat# 550083 | FACS (1 μL per test) |
| Antibody | Alex 594-conjugated goat anti-mouse antibody | Thermo Fisher Scientific | Cat# A-11005 | IF (1:200) |
| Antibody | Alex 488-conjugated goat anti-rabbit antibody | Thermo Fisher Scientific | Cat# A-11008 | IF (1:200) |
| Sequence-based reagent | Stat3 siRNA | Santa Cruz Biotechnology | Cat# sc-29494 | |
| Sequence-based reagent | Control siRNA | Santa Cruz Biotechnology | Cat# sc-37007 | |
| Sequence-based reagent | Mouse Acta | This paper | N/A | Sequences in Supplementary file 1 |
| Sequence-based reagent | Mouse Col1a1 | This paper | N/A | Sequences in Supplementary file 1 |
| Sequence-based reagent | Mouse Postn | This paper | N/A | Sequences in Supplementary file 1 |
| Sequence-based reagent | Mouse Thbs1 | This paper | N/A | Sequences inSupplementary file 1 |
| Sequence-based reagent | Mouse Tnfa | This paper | N/A | Sequences in Supplementary file 1 |
| Sequence-based reagent | Mouse Stat3 | This paper | N/A | Sequences in Supplementary file 1 |
| Sequence-based reagent | Mouse 18S | This paper | N/A | Sequences in Supplementary file 1 |
| Peptide, recombinant protein | Angiotensin II | Abcam | Cat# ab120183 | |
| Commercial assay or kit | TSP1 ELISA KIT(Human) | R and D Systems | Cat# DTSP10 | |
| Commercial assay or kit | TSP1 ELISA KIT(Mouse) | Cloud-Clone Corp. | Cat# SEA611Mu | |
| Commercial assay or kit | TUNEL staining kit | KeyGEN BioTECH | Cat# KGA7073-1 | |
| Commercial assay or kit | SimpleChIP Enzymatic Chromatin IP Kit | Cell Signaling Technology | Cat# 9003 | |
| Commercial assay or kit | Eastep Super Total RNA Extraction Kit | Promega Corporation | Cat# LS1040 | |
| Chemical compound, drug | S3I-201 | Santa Cruz Biotechnology | Cat# sc-204304 | |
| Chemical compound, drug | TG101209 | MedChem Express | Cat# HY-10410 | |
| Software, algorithm | Prism version 7.0 | GraphPad Software Inc | https://www.graphpad.com/scientific-software/prism/ | |
| Software, algorithm | ImageJ version 1.52a | NIH | https://imagej.nih.gov/ij/ | |
| Software, algorithm | FlowJo version 10 | Tree Star Inc | https://www.flowjo.com/solutions/flowjo/downloads |
Additional files
-
Supplementary file 1
RT-PCR primers.
- https://cdn.elifesciences.org/articles/49923/elife-49923-supp1-v2.docx
-
Transparent reporting form
- https://cdn.elifesciences.org/articles/49923/elife-49923-transrepform-v2.docx
Download links
A two-part list of links to download the article, or parts of the article, in various formats.
Downloads (link to download the article as PDF)
Open citations (links to open the citations from this article in various online reference manager services)
Cite this article (links to download the citations from this article in formats compatible with various reference manager tools)
Intermittent hypoxia mediated by TSP1 dependent on STAT3 induces cardiac fibroblast activation and cardiac fibrosis
eLife 9:e49923.
https://doi.org/10.7554/eLife.49923


