Coronary arterial development is regulated by a Dll4-Jag1-EphrinB2 signaling cascade
- Centro Nacional de Investigaciones Cardiovasculares Carlos III (CNIC), Spain
- CIBER de Enfermedades Cardiovasculares, Spain
- Centro Nacional de Investigaciones Cardiovasculares, Spain
Figures
Figure 1 with 4 supplements
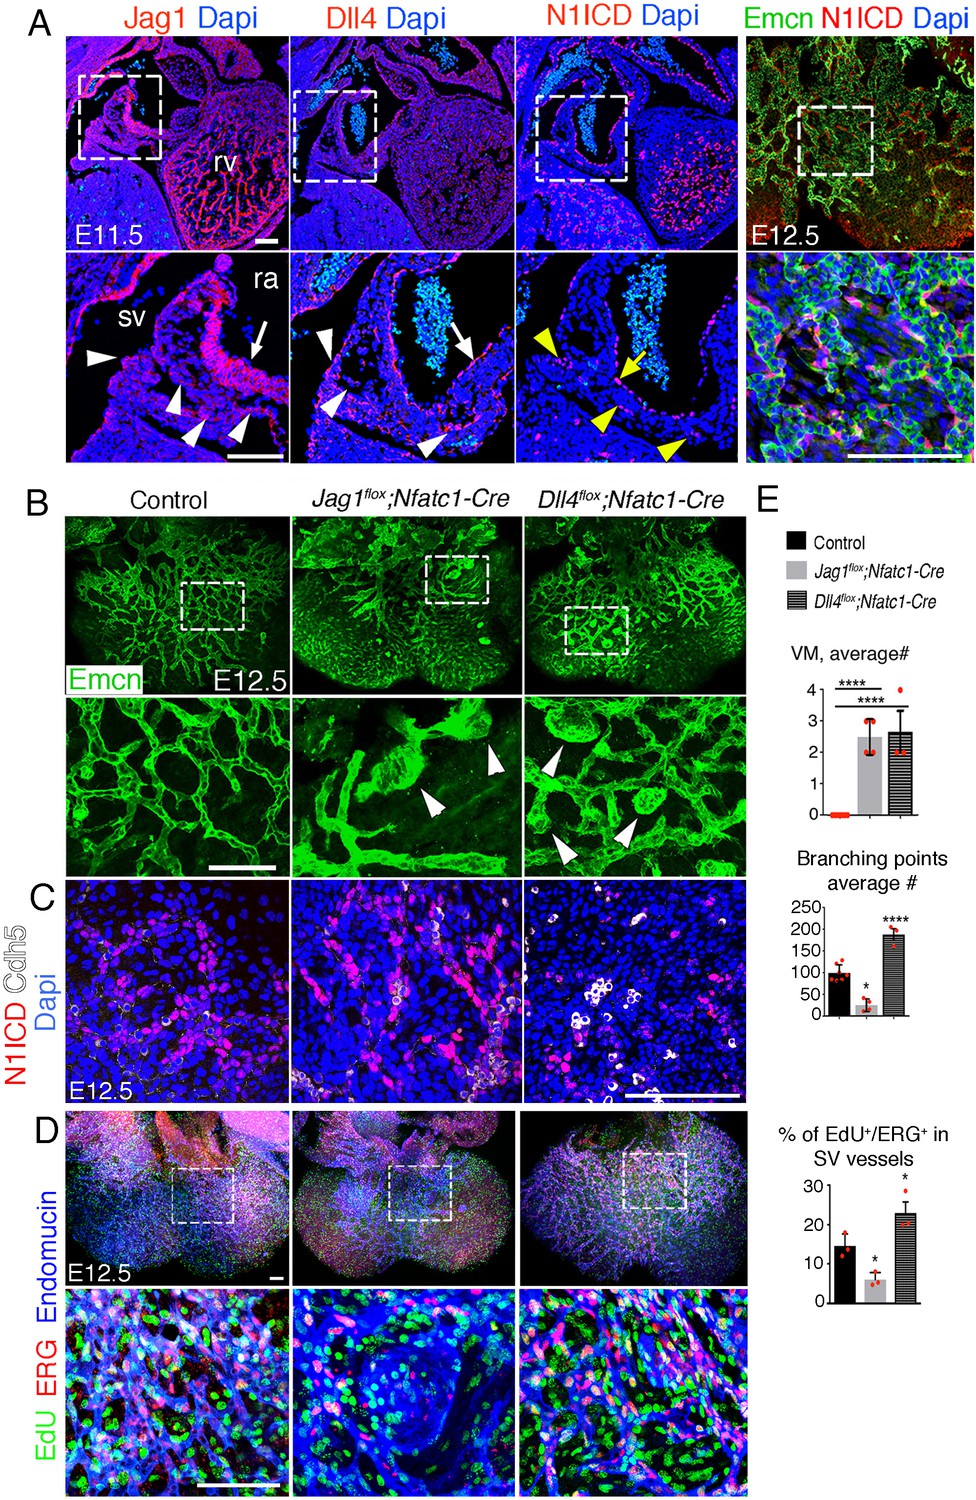
Endocardial Jag1 or Dll4 inactivation disrupts coronary plexus formation.
(A) Jag1, Dll4, and N1ICD immunostaining (red) in E11.5 control hearts, sagittal views. Magnified views of boxed areas show details of sinus venosus (sv, arrowheads) and right atrium (ra, arrow). Whole-mount dorsal view of immunostainings for N1ICD (red) and Emcn (green) in E12.5 control heart. Magnified views show detail of sub-epicardial endothelium. Nuclei are counterstained with Dapi (blue). (B) Whole-mount dorsal view of immunostaining for Emcn (green) in E12.5 control, Jag1flox;Nfatc1-Cre, and Dll4flox;Nfatc1-Cre mutant hearts. Arrowheads indicate vascular malformations. Quantified data of average number of vascular malformations (VM) and average number of branching points in E12.5 control, Jag1flox;Nfatc1-Cre and Dll4flox;Nfatc1-Cre hearts. (C) Dorsal views of whole-mount E12.5 control, Jag1flox;Nfat-Cre, and Dll4flox;Nfatc1-Cre hearts stained for N1ICD (red) and VE-Caderin (white). Microscope: Leica SP5. Software: LAS-AF 2.7.3. build 9723. Objective: HCX PL APO CS 10 × 0.4 dry. HCX PL APO lambda blue 20 × 0.7 multi-immersion. (D) Dorsal views of whole-mount E12.5 control, Jag1flox;Nfat-Cre, and Dll4flox;Nfatc1-Cre hearts stained for EdU (green), ERG (red), and Emcn (blue). Scale bars, 100 μm. Microscope: Nikon A1-R. Software: NIS Elements AR 4.30.02. Build 1053 LO, 64 bits. Objectives: Plan Apo VC 20x/0.75 DIC N2 dry; Plan Fluor 40x/1.3 Oil DIC H N2 Oil. (E) Quantified data for vascular malformations (VM), average number (#) of branching points and EdU-ERG dual-positive nuclei as a percentage of all nuclei in sub-epicardial vessels. Data are mean ± s.d. (n = 7 control embryos and n = 4 Jag1flox;Nfat-Cre and n = 3 Dll4flox;Nfatc1-Cre mutant embryos for VM and average # of branching points. n = 3 control embryos and n = 3 mutant embryos for EdU-ERG). *p<0.05, ****p<0.0001 by one-way ANOVA with Tukey’s multiple comparison tests). Abbreviations: rv, right ventricle.
Figure 1—figure supplement 1
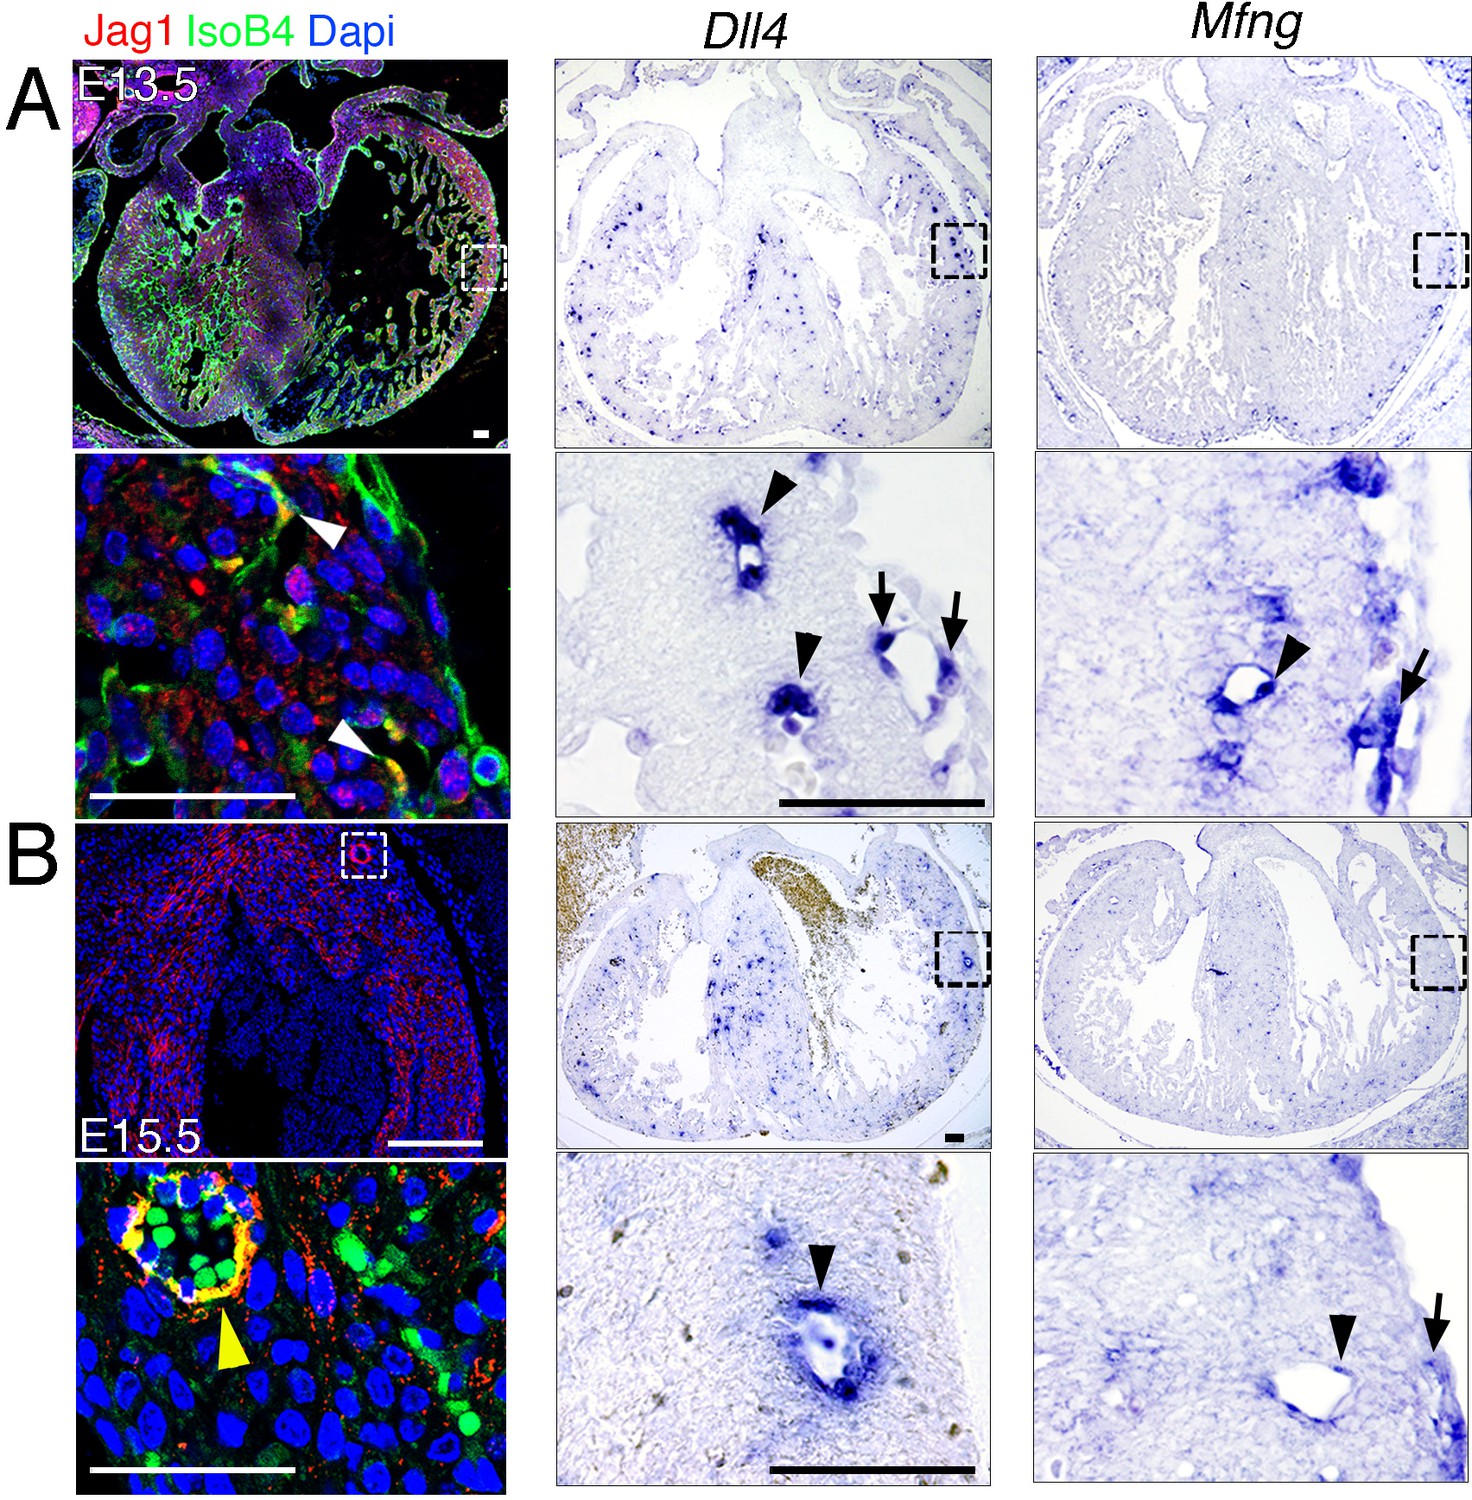
Jag1, Dll4, and Mfng expression in developing coronary vessels.
(A) E13.5 control heart. Left, immunohistochemistry for Jag1 (red) and IsoB4 (green); the magnified view shows co-staining of Jag1 and IsoB4 in coronary arteries (white arrowheads). Center and right, ISH for Dll4 and Mfng; magnified views show expression in coronary arteries (black arrowheads) and sub-epicardial vein (arrows). (B) E15.5 control heart. Immunohistochemistry for Jag1 (red) and IsoB4 co-staining (green); the magnified view shows co-staining of Jag1 and IsoB4 in a coronary artery (yellow arrowhead). Dapi counterstain (blue). ISH for Dll4 and Mfng expression; magnified views show expression in a coronary artery (black arrowheads) and sub-epicardial vein (arrow). Scale bars, 50 μm. Images for Jag1 immunostainings were acquired on Nikon A1-R microscope. Software: NIS Elements AR 4.30.02. Build 1053 LO, 64 bits. Objectives: Plan Apo VC 20x/0,75 DIC N2 dry; Plan Fluor 40x/1,3 Oil DIC H N2 Oil.
Figure 1—figure supplement 2

Most ventricular free-wall coronary vessels derive from Nfatc1+ progenitors.
Nfatc1+ progenitors give rise to most coronary vessels. (A) Left: Sagittal section of a E11.5 Nfatc1-Cre;R26R-LacZ heart, showing LacZ expression in the sinus venosus (sv; arrowheads in inset), right ventricle (rv), and atrioventricular canal (avc). Right: Sagittal section of a E11.5 control heart immunostained for Nfatc1 (red) and IsoB4 (green); yellow arrowheads indicate nuclear Nfatc1 staining in SV endothelial cells. Dapi counterstain (blue). Scale bars 100 μm. (B) E12.5 Nfatc1-Cre;R26R-LacZ heart co-stained for LacZ and Pecam-1. (1) LacZ staining is weak in vessels proximal to the AVC (red arrowheads) and strong in distal vessels (1, 2, black arrowheads). (2) LacZ staining in vessels close to chamber endocardium is consistent with an endocardial origin of coronary arteries (arrows). The chart shows Nfatc1-positive vessels (Nfatc1-Cre-driven LacZ expression) as a percentage of all sub-epicardial vessels (Pecam-1-stained). Data are mean ± s.d. (n = 3 sections from four embryos). (C) Whole-mount E12.5 Nfatc1-Cre;Rosa26-RFP heart (dorsal view), showing RFP fluorescence (red) and immunhistochemistry for Emcn (blue) and Erg (green). Sub-epicardial vessel endothelium contains Nfatc1-Cre;Rosa26-RFP-positive nuclei (yellow arrowheads) and Nfatc1-Cre;Rosa26-RFP-negative nuclei (green arrowheads). Dapi counterstain (blue). The chart shows Nfatc1-Erg dual-positive nuclei as a percentage of all nuclei in subepicardial vessels. Data are mean ± s.d. (n = 2 hearts). Scale bars, 100 μm. (D) Whole-mount E11.5 Nfatc1-Cre;Rosa26-RFP:CBF:H2B-Venus heart (dorsal view), showing RFP reporter fluorescence (red) and immunohistochemistry for GFP (green). The Z-stack of SV endothelium shows Nfatc1-Cre;Rosa26-RFP-CBF:H2B-Venus double-positive nuclei (arrowheads) and CBF:H2B-Venus single-positive nuclei (arrows). sv, sinus venosus; rv, right ventricle; li, liver. (E) Whole-mount E12.5 Nfatc1-Cre;Rosa26-RFP-CBF:H2B-Venus heart (dorsal view), showing RFP reporter expression (red) and immunohistochemistry for GFP (green). The sub-epicardial vessel endothelium contains Nfatc1-Cre;Rosa26-RFP, CBF:H2B-Venus dual-positive nuclei (white arrowheads) and CBF:H2B-Venus single positive nuclei (arrows). Scale bars, 100 μm. Images for fluorescence immunostainings were acquired on a Nikon A1-R microscope. Software: NIS Elements AR 4.30.02. Build 1053 LO, 64 bits. Objectives: Plan Apo VC 20x/0,75 DIC N2 dry; Plan Fluor 40x/1,3 Oil DIC H N2 Oil.
Figure 1—figure supplement 3
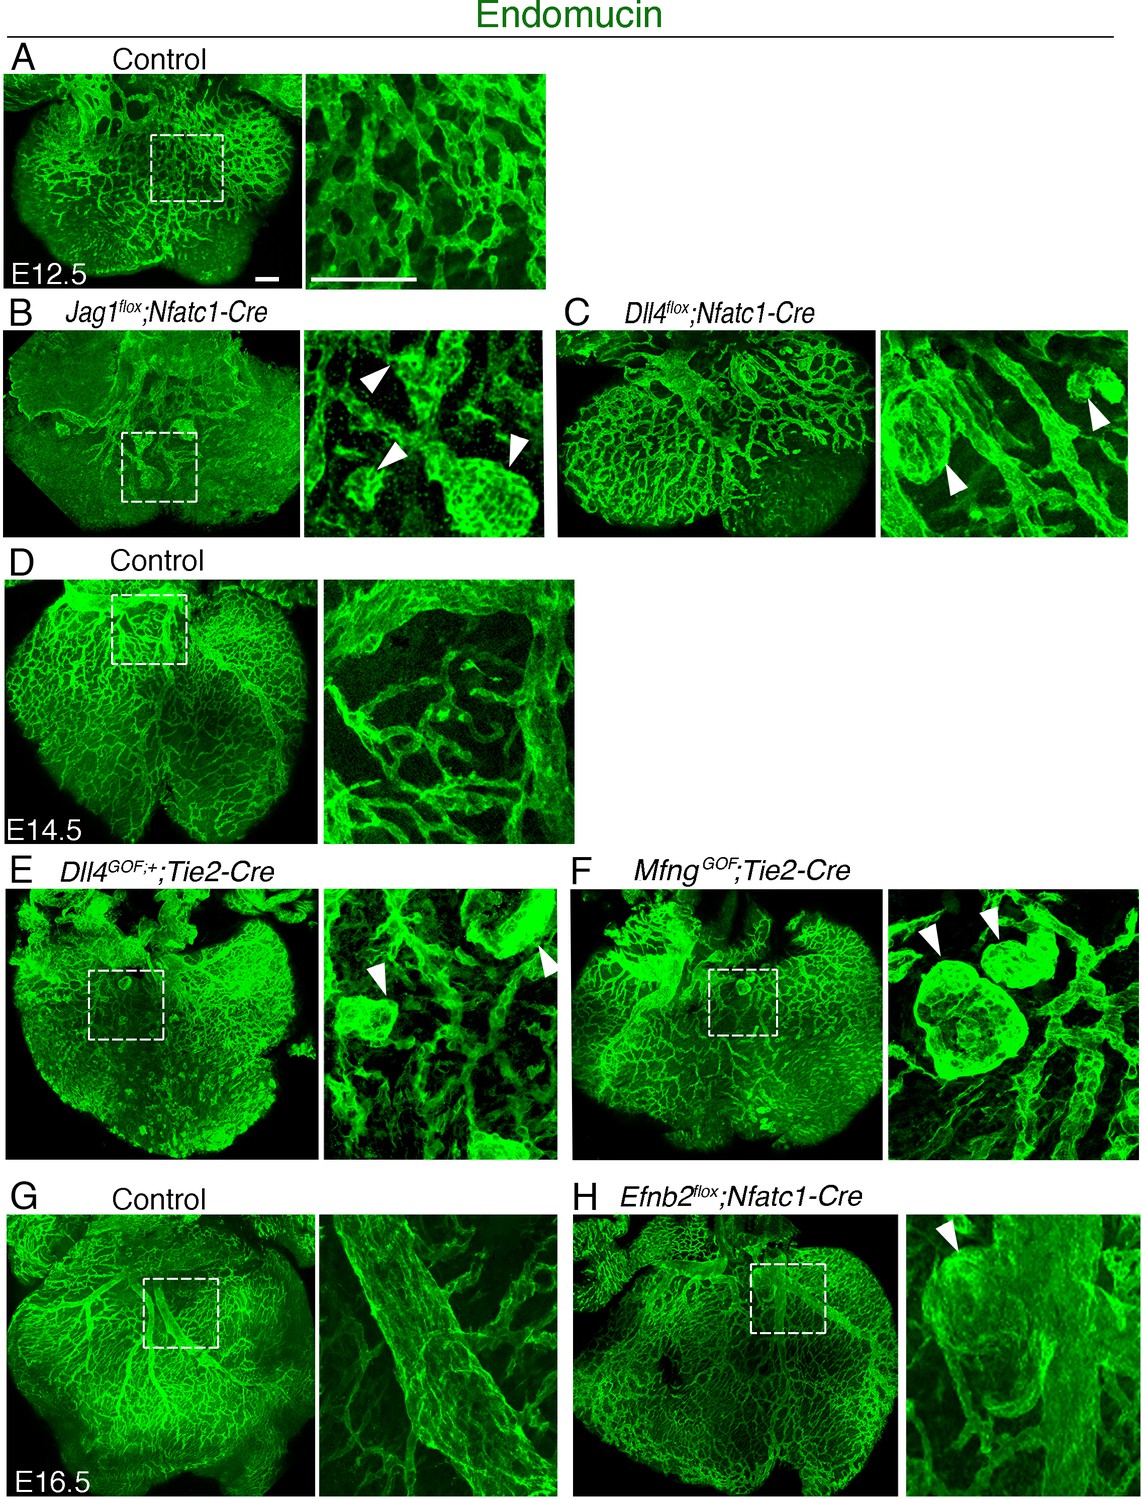
Coronary vessels of Notch pathway and Notch effector mutants display vascular malformations.
Dorsal views of whole-mount immunostaining for Emcn (green). (A) E12.5 control heart, (B) E12.5 Jag1flox;Nfatc1-Cre heart, (C) E12.5 Dll4flox;Nfatc1-Cre heart, (D) E14.5 control heart, (E) E14.5 Dll4GOF;Tie2-Cre heart, (F) E14.5 MfngGOF;Tie2-Cre heart, (G) E16.5 control heart, (H) E16.5 Efnb2flox;Nfatc1-Cre heart. Scale bars, 100 μm.
Figure 1—figure supplement 4
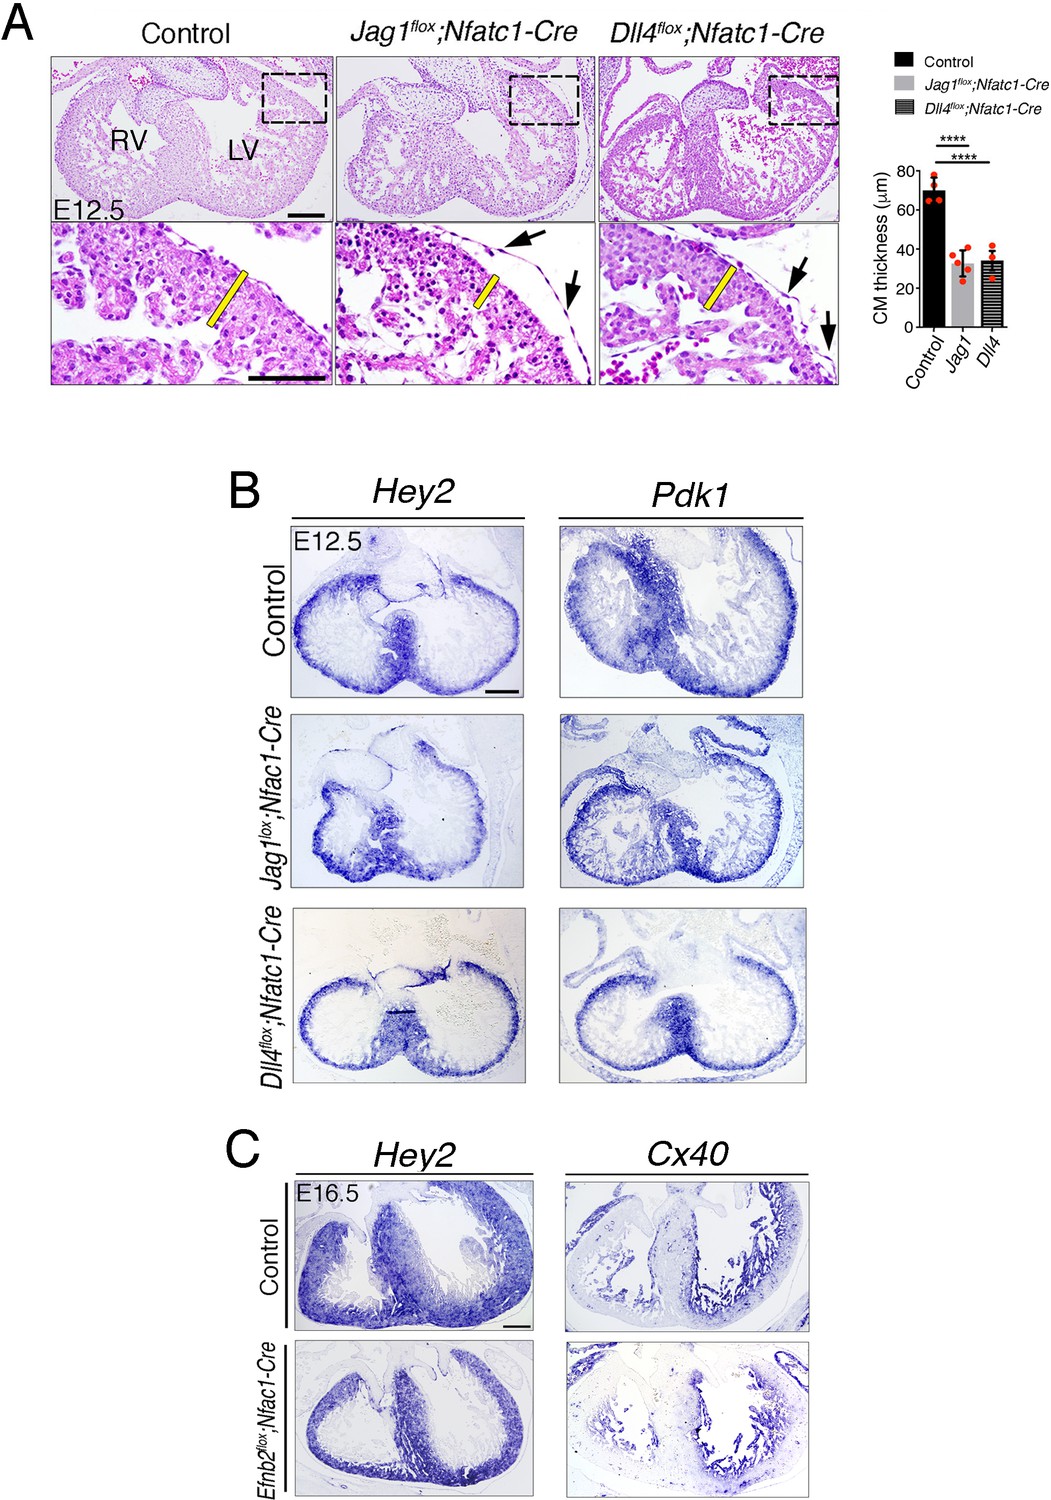
Histological and molecular marker analysis of E12.5 Jag1flox;Nfatc1-Cre, and Dll4flox;Nfatc1-Cre and E16.5 Efnb2flox;Nfatc1-Cre hearts.
(A) H and E staining on control, Jag1flox;Nfatc1-Cre, and Dll4flox;Nfatc1-Cre heart sections. Arrows point to detached epicardium. Yellow bars indicate compact myocardium (CM) thickness. Quantified data of CM thickness in control, Jag1flox;Nfatc1-Cre and Dll4flox;Nfatc1-Cre hearts. Data are mean ± s.d. (n = 4 control hearts and n = 5 for Jag1flox;Nfatc1-Cre and n = 3 for Dll4flox;Nfatc1-Cre mutant hearts). ****p<0.0001 by one-way ANOVA with Tukey’s multiple comparison tests. (B) Endocardial Jag1 or Dll4 deletion does not affect myocardial patterning. ISH of the compact myocardium markers Hey2 and Pdk1 on control, Jag1flox;Nfat-Cre, and Dll4flox;Nfatc1-Cre heart sections (C) ISH of the compact myocardium marker Hey2, and trabecular myocardium marker Cx40 on control and Efnb2flox;Nfatc1-Cre heart sections. Scale bars, 100 μm.
Figure 2 with 1 supplement
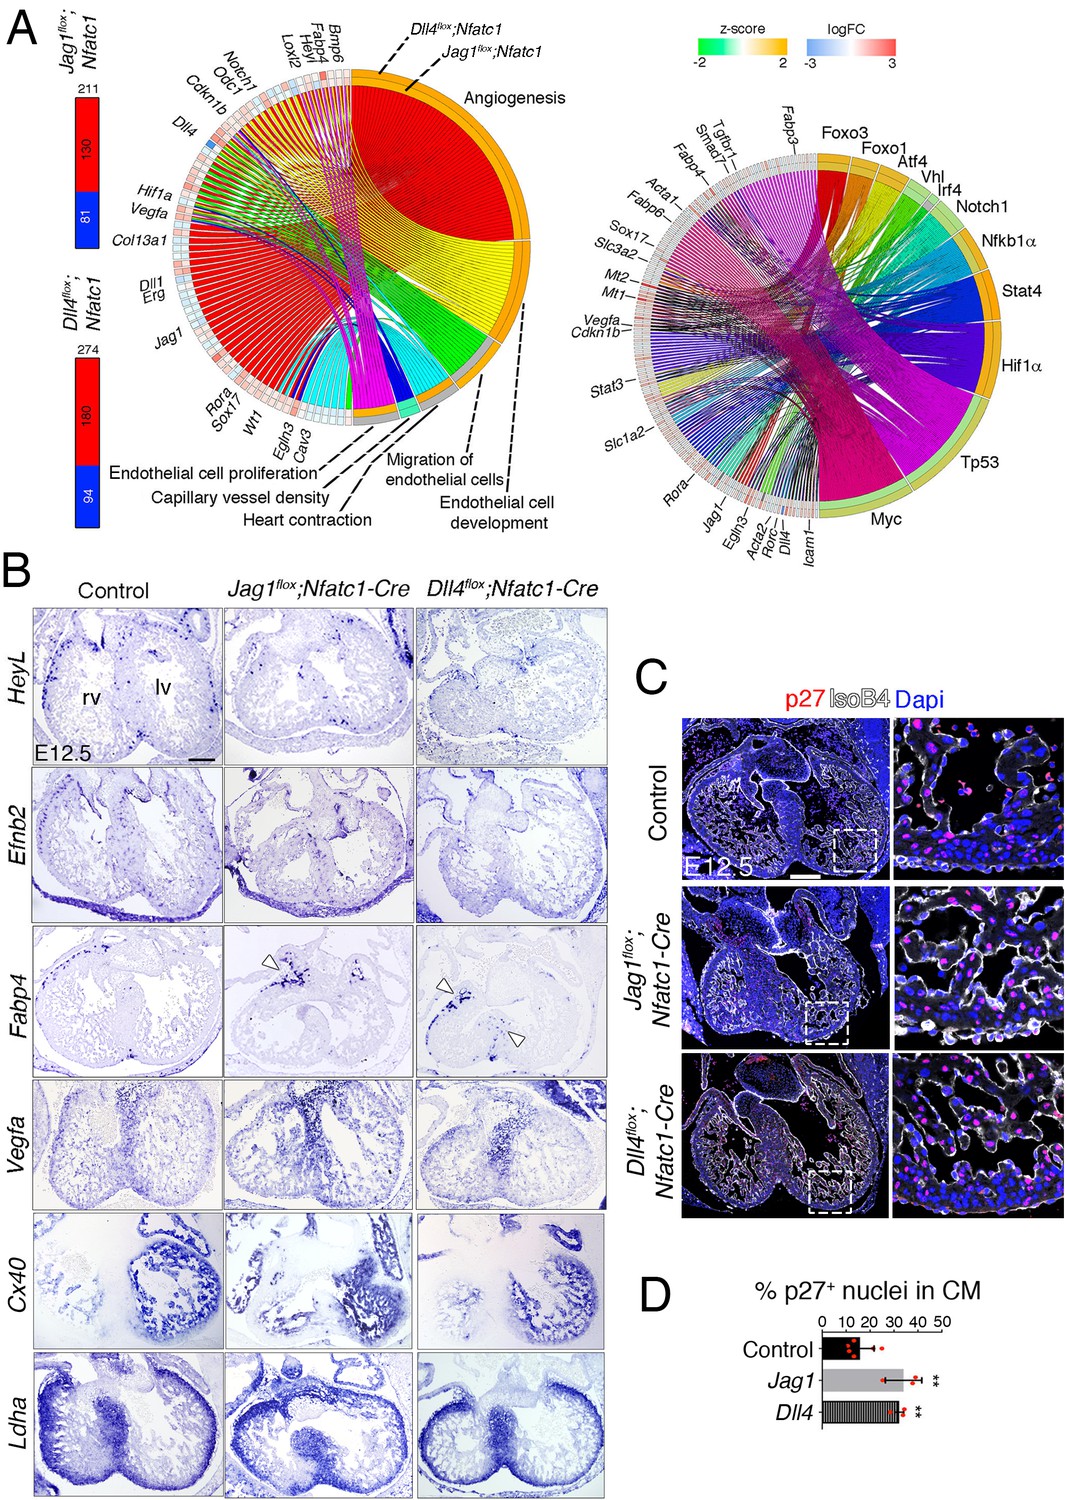
Transcriptome profiling of endocardial Jag1 and Dll4 mutant hearts.
(A) Left, Total number of differentially expressed genes identified by RNA-seq (Benjamini-Hochberg (B–H) adjusted p<0.05) in the indicated genotypes. Numbers indicate upregulated genes (red) and downregulated genes (blue). Center, circular plot of representative differentially expressed genes, presenting a detailed view of the relationships between expression changes (left semicircle perimeter) and IPA functions belonging to the Cardiovascular System Development and Function category (right semicircle perimeter). For both circular plots, in the left semicircle perimeter, the inner ring represents Jag1flox;Nfatc1-Cre data and the outer ring Dll4flox;Nfatc1-Cre data. Activation z-score scale: green, repression; orange, activation; white, unchanged. LogFC scale: red, upregulated; blue, downregulated; white, unchanged. Right, circular plot showing representative differentially expressed genes depending of selected upstream regulators. Details in Table supplement 2 and Table supplement 3. (B) In situ hybridization (ISH) of HeyL, Efnb2, Fabp4, Vegfa, Cx40 and Ldha on E12.5 control, Jag1flox;Nfatc1-Cre, and Dll4flox;Nfatc1-Cre heart sections. Arrowheads indicate Fabp4 expression in capillary vessels. (C) Immunohistochemistry of p27 (red) and IsoB4 (white) on E12.5 control, Jag1flox;Nfatc1-Cre, and Dll4flox;Nfatc1-Cre mutant heart sections. Dapi counterstain (blue). Microscope: Nikon A1-R. Software: NIS Elements AR 4.30.02. Build 1053 LO, 64 bits. Objectives: Plan Apo VC 20x/0,75 DIC N2 dry; Plan Fluor 40x/1,3 Oil DIC H N2 Oil. Quantified data for p27-positive nuclei as a % of total CM nuclei. Data are mean ± s.d. (n = 3 sections from 6 control embryos and n = 3 sections from 3 mutant embryos). **p<0.01 by one-way ANOVA with Tukey’s multiple comparison tests). Abbreviations: lv, left ventricle; rv, right ventricle. Scale bars, 100 μm.
Figure 2—figure supplement 1
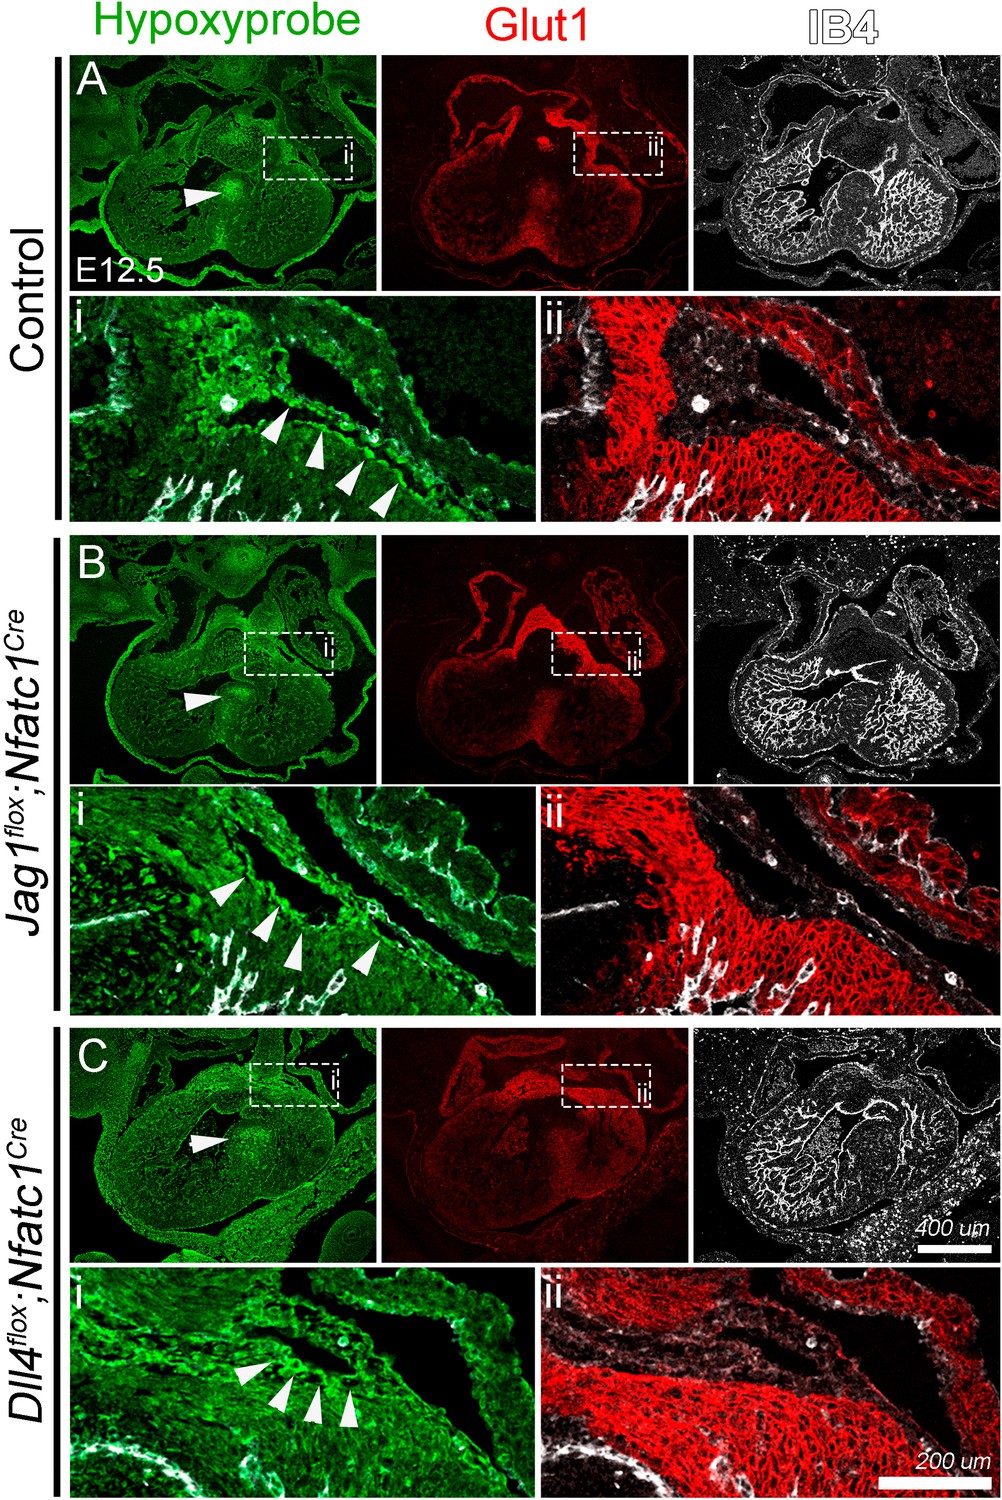
No evidence of hypoxia in Jag1flox;Nfatc1Cre and Dll4flox;Nfatc1Cre hearts at E12.5.
(A) WT heart. Hypoxyprobe-1 (hypoxyprobe; green) staining is found in the ventricular septum (arrowhead), the AV groove (i), and in chamber and valve endocardium. A subset of valve mesenchymal cells in the AV cushions is also distinctly positive for hypoxyprobe. (i) Magnification of the sub-epicardial mesenchyme layer region. hypoxyprobe labels endothelial cells lining the vessels emerging from the AV groove (arrowheads). Glut1 immunostaining (red) is prominent in AV groove region, ventricular septum and weakly in compact myocardium, while is generally absent from AV cushion and sub-epicardial mesenchyme. (ii) Magnification of the sub-epicardial region at the AV groove. Glut1 immunofluorescence is strongly positive in compact myocardium underlying sub-epicardial mesenchyme (asterisk). Jag1flox;Nfatc1Cre (B) and Dll4flox;Nfatc1Cre (C) mutants show similar patterns and intensity of immunofluorescence for hypoxyprobe and Glut1 than WT.
Figure 3 with 4 supplements
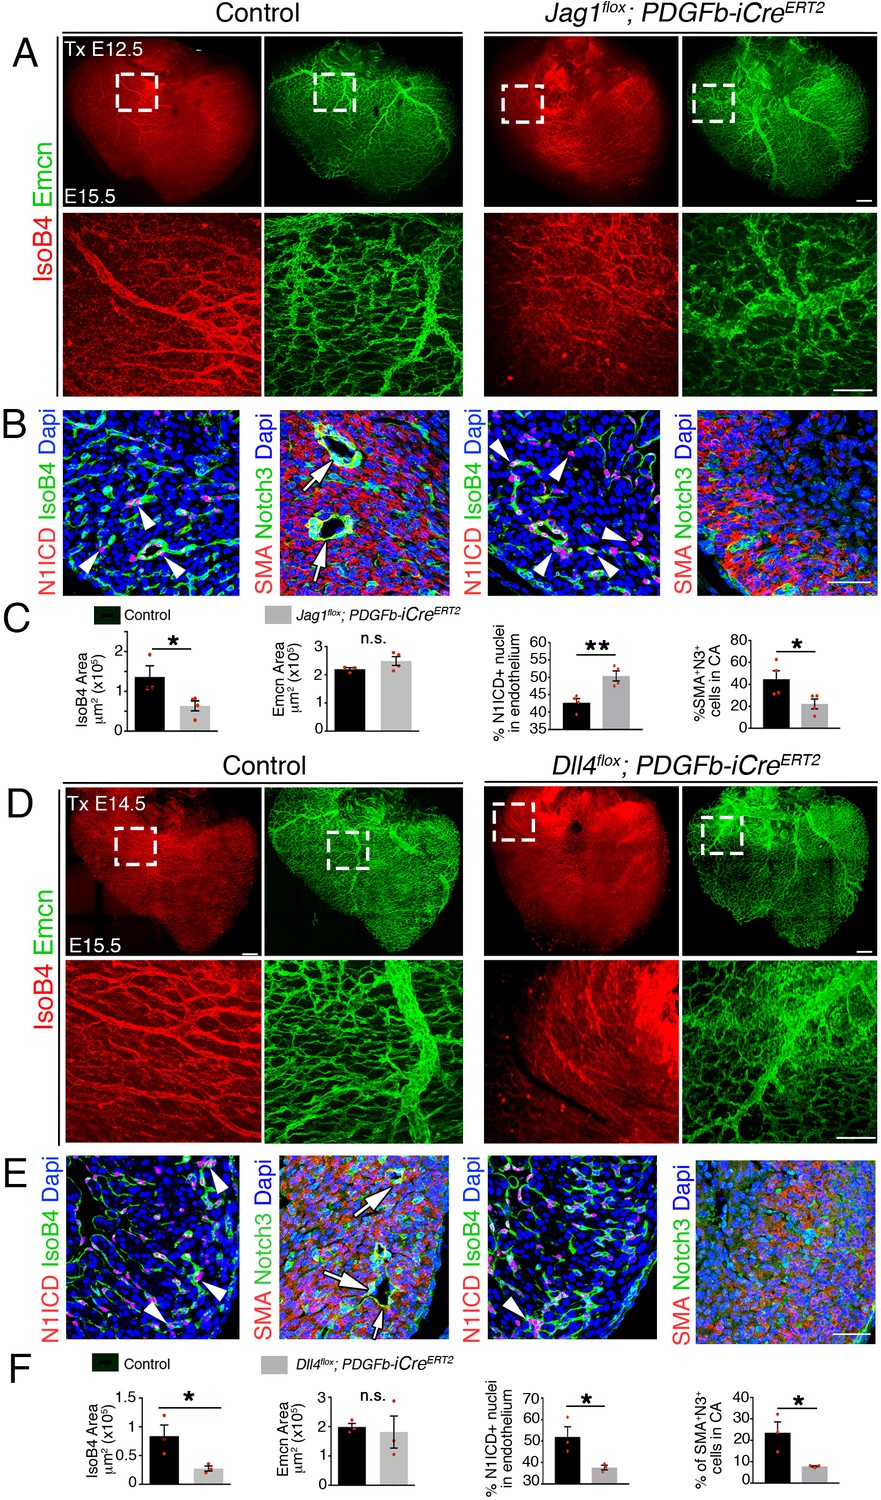
Late endothelial Jag1 or Dll4 inactivation disrupts coronary plexus remodeling.
(A) Dorsal view of whole-mount immunochemistry for IsoB4 (red), labelling arteries and Emcn (green), labeling veins and capillaries, in E15.5 control and Jag1flox;Pdgfb-iCreERT2 mutant hearts, tamoxifen (Tx)-induced at E12.5. Scale bars, 100 μm. (B) E15.5 control and Jag1flox;Pdgfb-iCreERT2 mutant heart sections. Left, Immunostaining for N1ICD (red) and IsoB4 (green). Right, α-smooth-muscle actin (SMA, red) and Notch3 (green). Dapi counterstain (blue). Arrowheads point to N1ICD-positive nuclei. Arrows point to αSMA-Notch3 co-immunostaining. Scale bars, 100 μm. (C) Quantified data from E15.5 control and Jag1flox;Pdgfb-iCreERT2 hearts: area of coverage by coronary arteries (IsoB4-positive vessels) and veins (Emcn-positive vessels); Data are mean ± s.d. (n = 3 control embryos and 4 mutant embryos. N1ICD-positive nuclei as a percentage of total endothelial nuclei; and SMA-Notch3 co-immunostaining in coronary arteries. Data are mean ± s.d. (n = 3 sections from 4 control embryos and from 4 mutant embryos. (D) Whole-mount dorsal view of immunohistochemistry for Emcn (green) and IsoB4 (red) in E15.5 control and Dll4flox;Pdgfb-iCreERT2 mutant hearts. Tx-induced at E14.5. (E) Left, immunohistochemistry for N1ICD (red) and IsoB4 (green); right, immunohistochemistry for SMA (red) and Notch3 (green) on control E15.5 WT and Dll4flox;Pdgfb-iCreERT2 mutant heart sections. Dapi counterstain (blue). Arrowheads indicate N1ICD-positive nuclei. Arrows point to SMA-Notch3 co-immunostaining. Scale bars, 100 μm. Microscopes: Nikon A1-R, Leica SP5. Softwares: NIS Elements AR 4.30.02. Build 1053 LO, 64 bits (Nikon); LAS-AF 2.7.3. build 9723 (Leica). Objectives: Plan Apo VC 20x/0.75 DIC N2 dry; Plan Fluor 40x/1.3 Oil DIC H N2 Oil (Nikon); HCX PL APO CS 10 × 0.4 dry. HCX PL APO lambda blue 20 × 0.7 multi-immersion (Leica). (F) Quantified data from E15.5 control and Dll4flox;Pdgfb-iCreERT2 hearts: area covered by coronary arteries (IsoB4-positive vessels); area covered by veins (Emcn-positive vessels); percentage of N1ICD-positive nuclei in endothelium as a percentage (%) of total nuclei; and SMA-Notch3 co-immunostaining in coronary arteries. Data are mean ± s.d. (n = 3 sections from 3 control embryos and from three mutant embryos). *p<0.05, **p<0.01, by Student’s t-test; n.s., not significant. Scale bars, 100 μm.
Figure 3—figure supplement 1
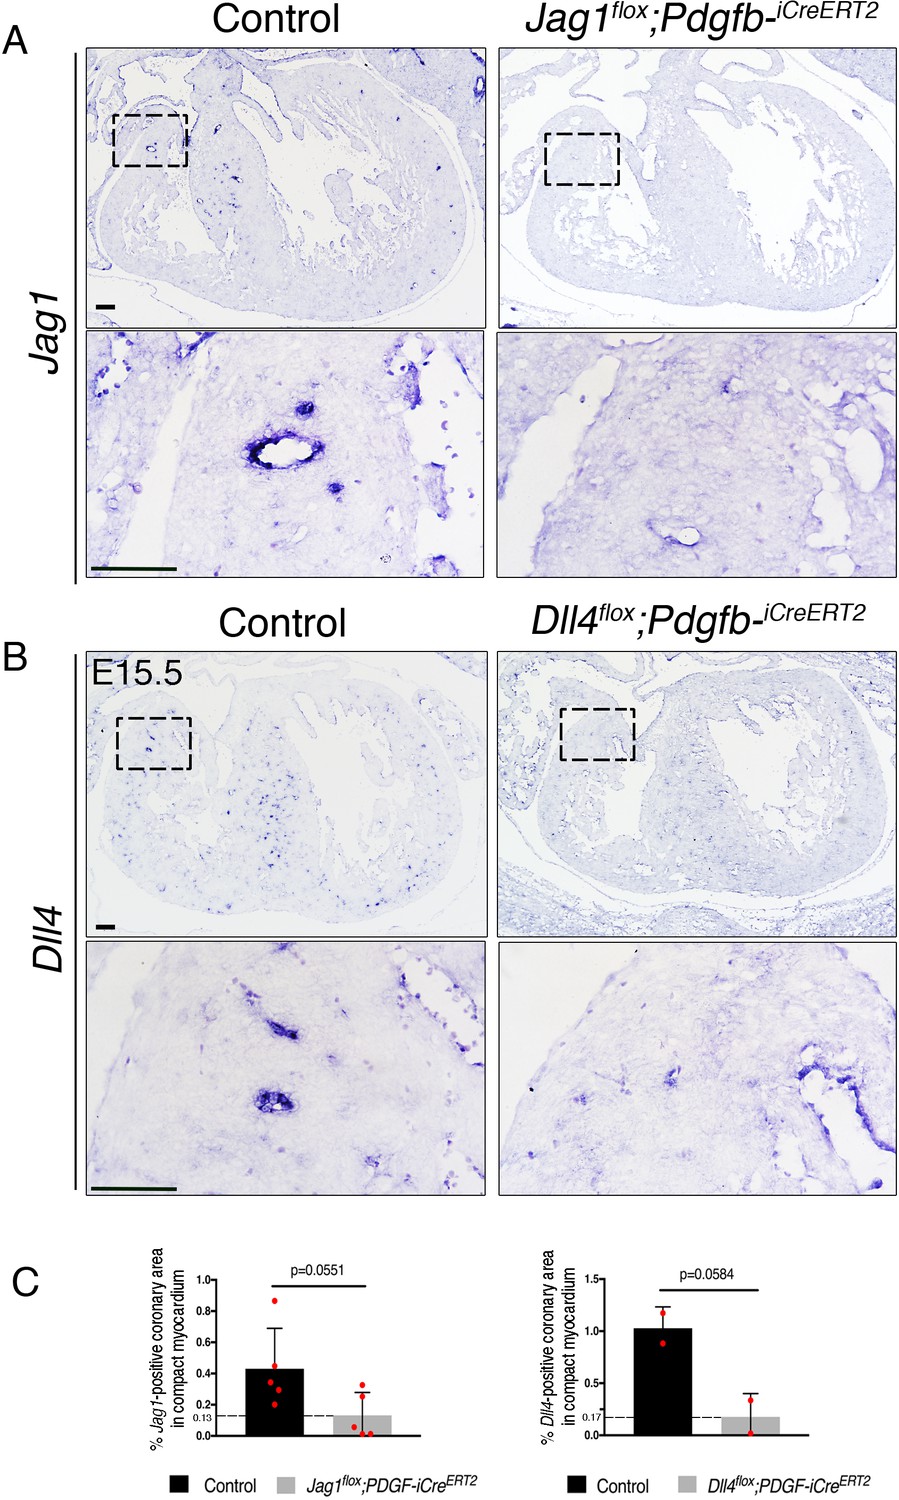
Efficient tamoxifen-induced endothelial deletion of Jag1 and Dll4 using Pdgfb-iCreERT2 driver line.
(A) ISH of Jag1 on sections of E15.5 control and Jag1flox;Pdgfb-iCreERT2 embryo hearts tamoxifen-induced at E12.5. (B) ISH of Dll4 on sections of E15.5 control and Dll4flox;Pdgfb-iCreERT2 hearts tamoxifen-induced at E14.4. (C) Quantified data of ISH staining as percentage of Dll4- or Jag1-positive coronary artery area in compact myocardium of E15.5 control, Jag1flox;Pdgfb-iCreERT2 and Dll4flox;Pdgfb-iCreERT2 tamoxifen-induced at E12.5 and E14.5, respectively. A Student’s t test was applied. n = 2 for control and Dll4flox;Pdgfb-iCreERT2 hearts, and n = 5 for control and Jag1flox;Pdgfb-iCreERT2 hearts. Scale bar, 100 μm.
Figure 3—figure supplement 2
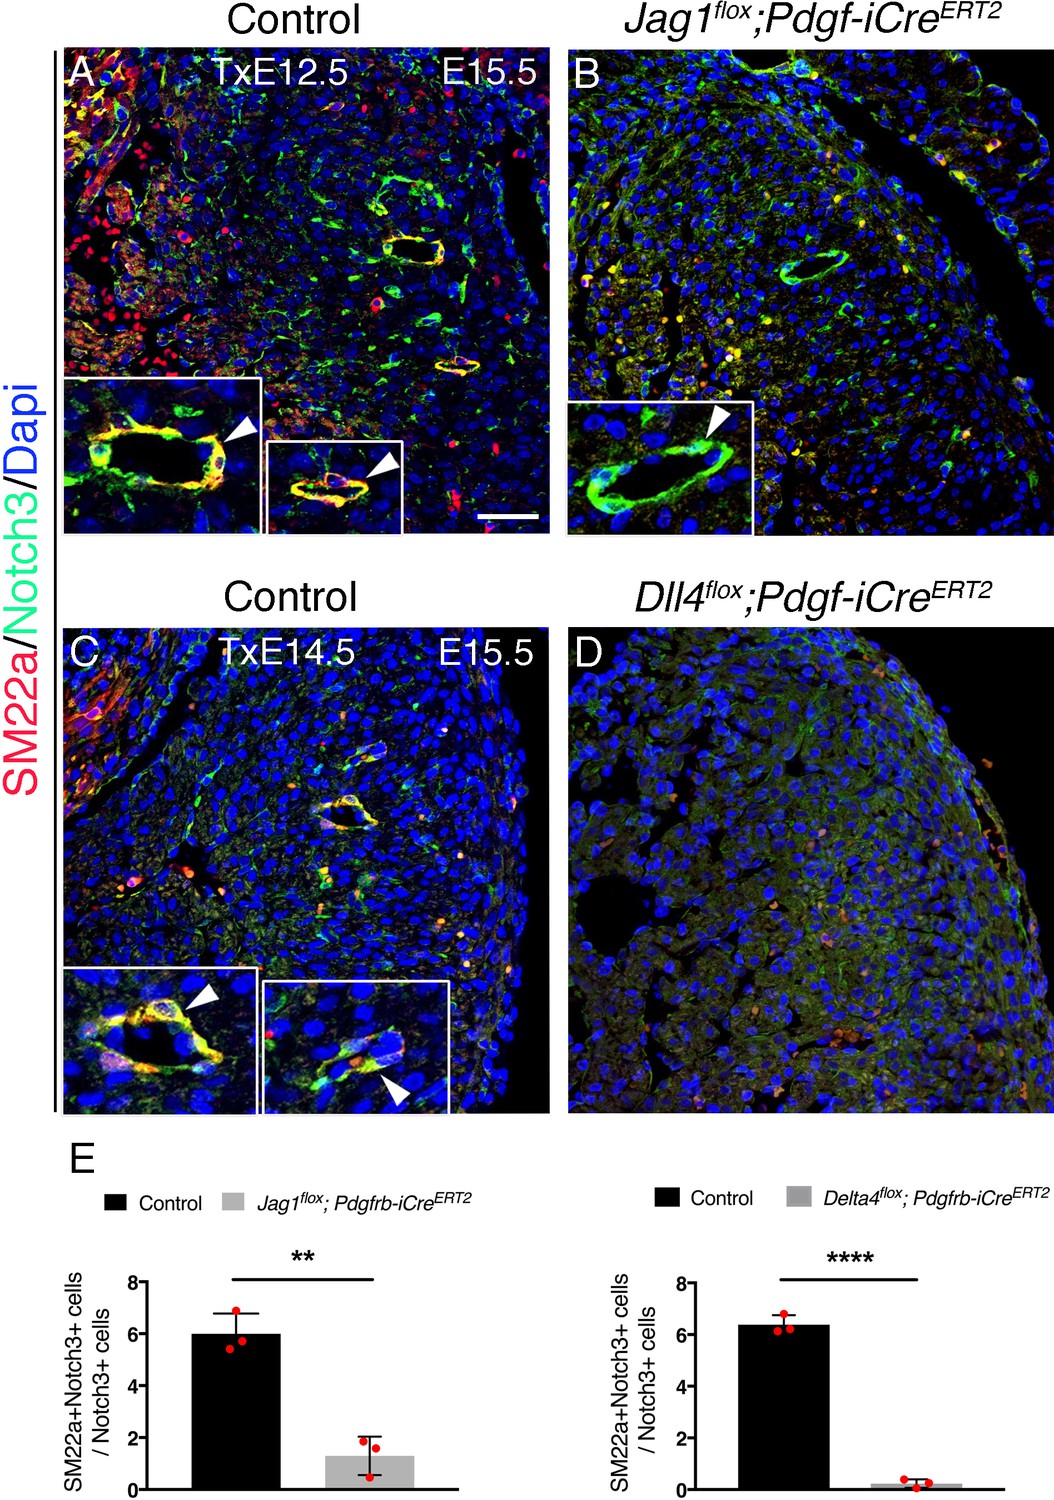
Induced endothelial Jag1 or Dll4 deletion disrupts coronary smooth muscle cell differentiation.
(A) Immunofluorescence for SM22a (red) and Notch3 (green) on sections of E15.5 control, and Jag1flox;Pdgfb-iCreERT2 and Dll4flox;Pdgfb-iCreERT2 mutants tamoxifen-induced at E12.5 and E14.5 respectively. Dapi counterstain (blue). Inserts, magnification of larger coronary arteries. Arrowheads point to larger arteries that are both SM22a and Notch3-positive in control and SM22a-negative/Notch3-positive in the Jag1flox;Pdgfb-iCreERT2 mutant. Coronaries are altogether absent in the Dll4flox;Pdgfb-iCreERT2 mutant. Microscope: Nikon A1-R. Software: NIS Elements AR 4.30.02. Build 1053 LO, 64 bits. Objectives: Plan Apo VC 20x/0,75 DIC N2 dry; Plan Fluor 40x/1,3 Oil DIC H N2 Oil. (B) Quantified data from E15.5 control, and Jag1flox;Nfatc1-Cre and Dll4flox;Nfatc-Cre mutants. Data are mean of ± s.d. (n = 3 controls and three mutants). **p<0.01, ****p<0.0001 by Student's t-test. Scale bar, 100 µm.
Figure 3—figure supplement 3
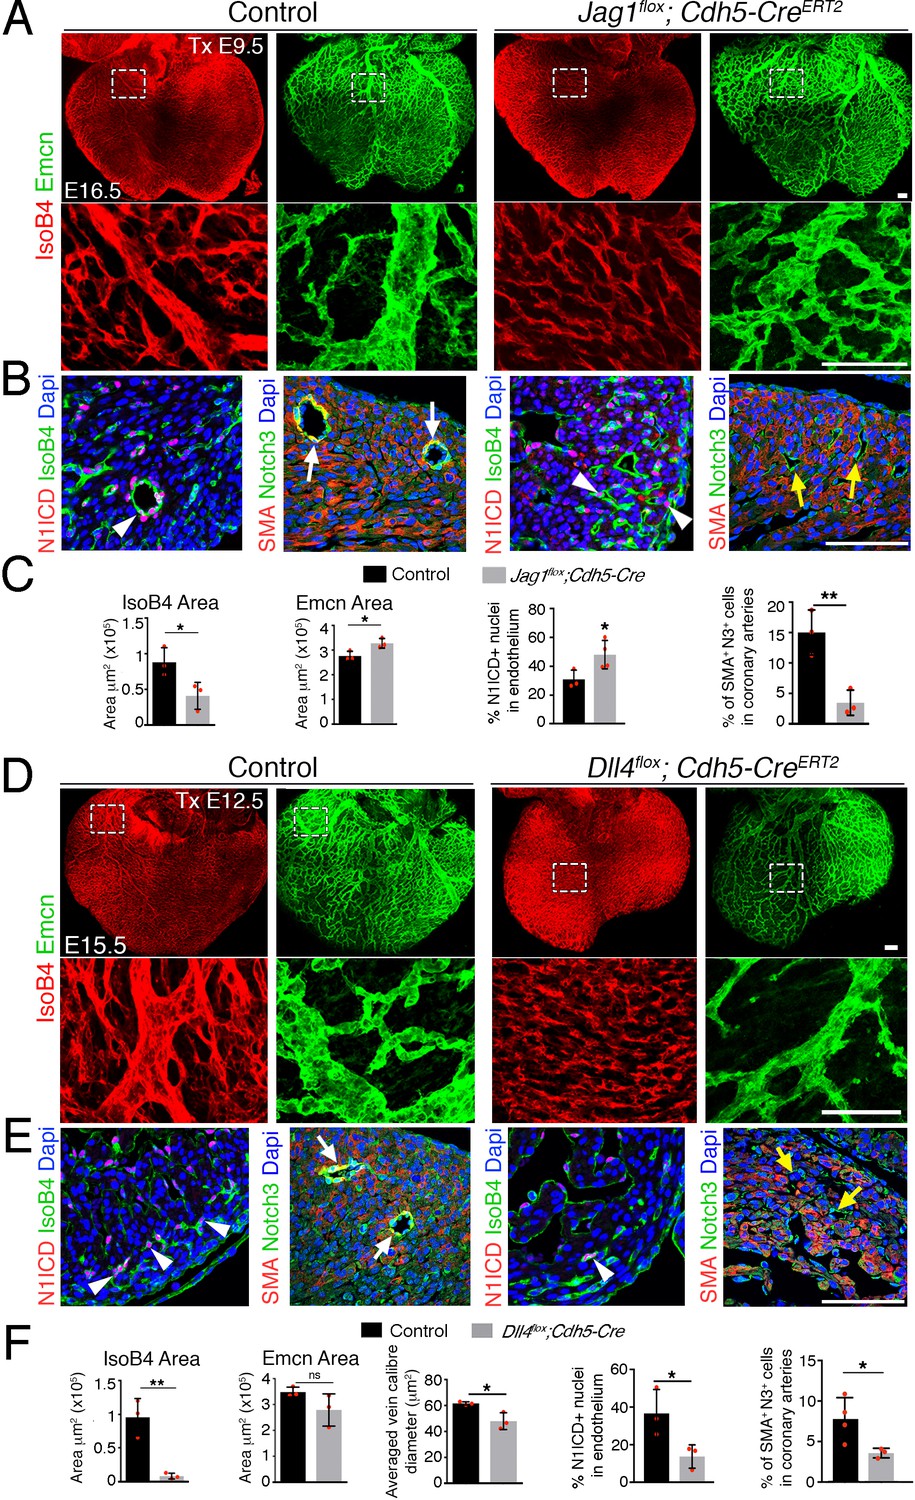
Late endothelial Jag1 or Dll4 inactivation disrupts coronary plexus remodeling.
(A) Dorsal view of whole-mount immunochemistry for IsoB4 (red), labeling arteries and Emcn (green), labeling veins and capillaries, in E16.5 control and Jag1flox;Cdh5-CreERT2 mutant hearts, tamoxifen (Tx)-induced at E9.5. Scale bars, 100 μm. (B) E16.5 control and Jag1flox;Cdh5-CreERT2 mutant heart sections. Left, Immunostaining for N1ICD (red) and IsoB4 (green). Right, α-smooth-muscle actin (SMA, red) and Notch3 (green). Dapi counterstain (blue). Arrowheads point to N1ICD-positive nuclei. Arrows point to SMA-Notch3 co- immunostaining. Yellow arrows point to small calibre intramyocardial vessels in Jag1 mutant. (C) Quantified data from E15.5 control and Jag1flox;Cdh5-CreERT2 hearts: area of coverage by coronary arteries (IsoB4-positive vessels) and veins (Emcn-positive vessels). Data are mean ± s.d. (n = 3 control embryos and 3 mutant embryos); N1ICD-positive nuclei as a percentage of total endothelial nuclei Data are mean ± s.d. (n = 3 sections from 3 control embryos and 4 mutant embryos); and SMA-Notch3 co-immunostaining in coronary arteries. Data are mean ± s.d. (n = 3 sections from 3 control embryos and 3 mutant embryos). (D) Whole-mount dorsal view of immunohistochemistry IsoB4 (red), labeling arteries and Emcn (green), labeling veins and capillaries, in E15.5 control and Dll4flox;Cdh5-CreERT2 mutant hearts Tx-induced at E12.5. (E) Immunohistochemistry on the left for N1ICD (red) and IsoB4 (green), and on the right for SMA (red) and Notch3 (green) on control E15.5 WT and Dll4flox;Cdh5-CreERT2 mutant heart sections. Dapi counterstain (blue). Arrowheads indicate N1ICD-positive nuclei. Arrows point to SMA-Notch3 co- immunostaining. Yellow arrows point to small calibre intramyocardial vessels in the Dll4 mutant. Scale bars as in (A). (F) Quantified data from E16.5 control and Dll4flox;Cdh5-CreERT2 hearts: area covered by coronary arteries (IsoB4-positive vessels); area covered by veins (Emcn-positive vessels); mean vein caliber Data are mean ± s.d. (n = 3 control embryos and 3 mutant embryos); percentage of N1ICD-positive nuclei in endothelium as a percentage (%) of total nuclei; and SMA-Notch3 co- immunostaining in coronary arteries. Data are mean ± s.d. (n = 3 sections from 3Control embryos and from 3 to 4 mutant embryos). *p<0.05, **p<0.01, by Student’s t-test; n.s., not significant. Scale bars, 100 μm. Microscope: Nikon A1-R. Software: NIS Elements AR 4.30.02. Build 1053 LO, 64 bits. Objectives: Plan Apo VC 20x/0,75 DIC N2 dry; Plan Fluor 40x/1,3 Oil DIC H N2 Oil.
Figure 3—figure supplement 4
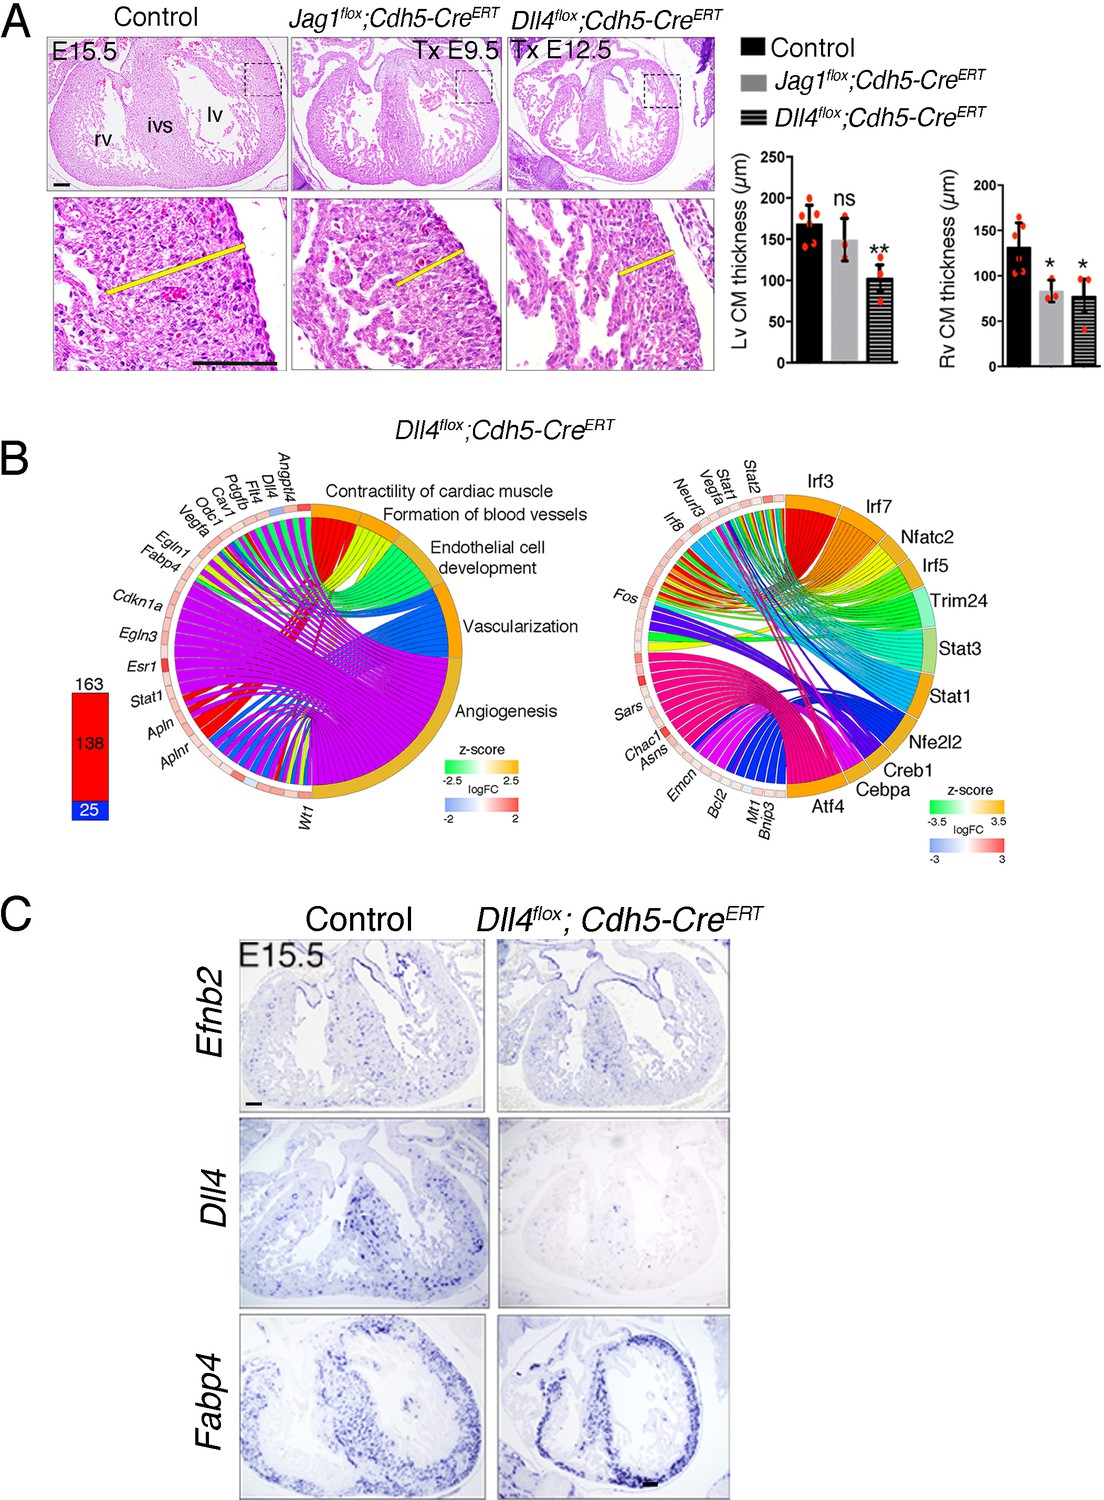
Induced endothelial Jag1 or Dll4 deletion disrupts myocardial growth.
(A) H & E staining of transverse sections of E15.5 hearts from control mice, Jag1flox;Cdh5-CreERT2 mice tamoxifen (Tx)-induced at E9.5 and Dll4flox;Cdh5-CreERT2 mice Tx-induced at E12.5. Yellow bars indicate compact myocardium (CM) thickness. Charts show CM thickness in the left ventricle (lv) and right ventricle (rv). ivs, interventricular septum. Data are mean ± s.d. (n = 6 control embryos and 3 mutant embryos). *p<0.05, **p<0.01, 01 by one-way ANOVA with the Dunnett multiple comparison tests; n.s., not significant. (B) Transcriptome profiling of Dll4flox;Cdh5-CreERT hearts at E15.5. Left, total number of differentially expressed genes identified by RNA-seq (BH adjusted p<0.05; abs(logFC)>0.5) in E15.5 Dll4flox;Cdh5-CreERT hearts. Numbers indicate upregulated genes (red) and downregulated genes (blue). Right, circular plot showing representative differentially expressed genes associated to selected IPA functions belonging to the Cardiovascular System Development and Function category. Activation z-score scale: green repression; orange, activation; white, unchanged. LogFC scale: red, upregulated; blue, downregulated; white, unchanged. Right, circular plot showing representative differentially expressed genes depending of selected upstream regulators. Colour codes for z-score and logFC scale as in Left . (C) Induced Dll4 deletion disrupts arterial differentiation. ISH for the arterial markers Efnb2, Dll4, and Fabp4 on E15.5 heart sections from control and Dll4flox;Cdh5-CreERTmice tamoxifen-induced at E12.5. Scale bars, 100 μm.
Figure 4 with 1 supplement
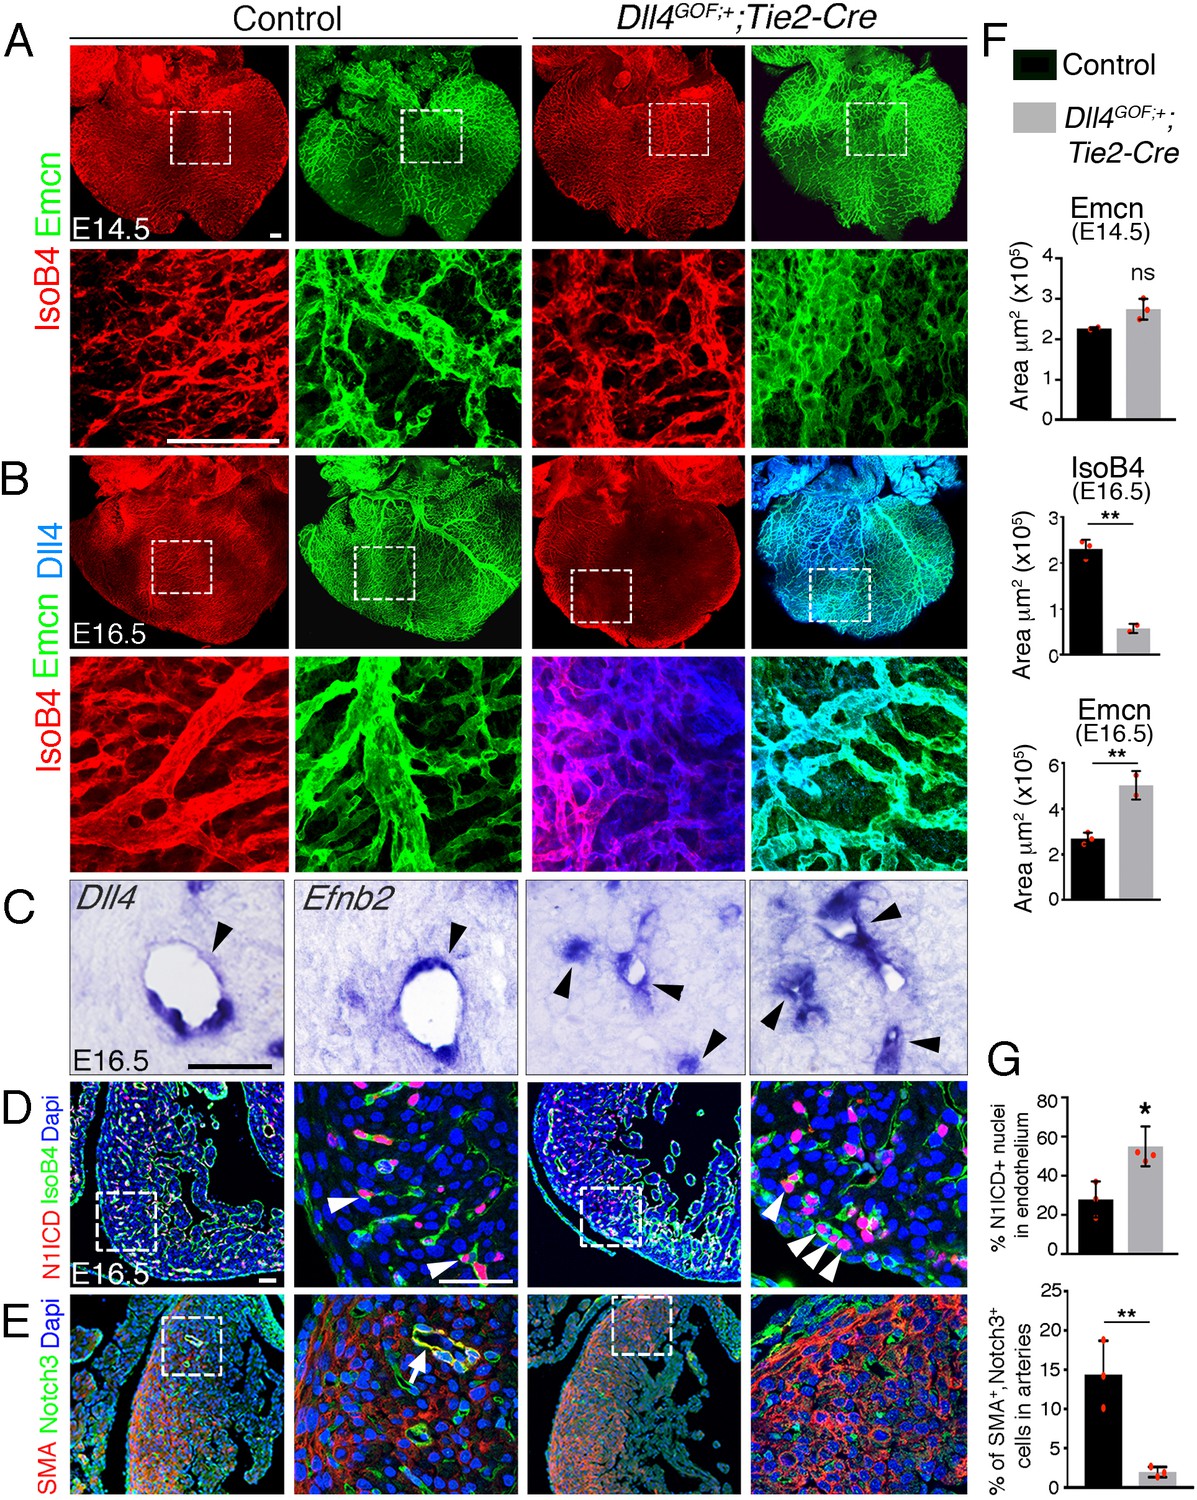
Forced Dll4 expression in endothelium disrupts coronary arteriovenous differentiation and remodeling.
(A) Dorsal view of whole-mount immunochemistry for IsoB4 (red), labeling arteries, and Emcn (green), labeling veins and capillaries, in E14.5 control and Dll4GOF;Tie2-Cre heart. Scale bar, 100 μm. (B) Dorsal view of whole-mount immunochemistry for IsoB4 (red) and Emcn (green) in E16.5 control and Dll4GOF;Tie2-Cre mutant heart. Scale bar, 100 μm. (C) ISH of Dll4 and Efnb2 on E16.5 control and Dll4GOF;Tie2-Cre heart sections. Arrowheads indicate coronary arteries. Scale bar, 50 μm. (D) Immunohistochemistry for N1ICD (red) and IsoB4 (green) on E16.5 control and Dll4GOF;Tie2-Cre heart sections. Dapi counterstain (blue). Arrowheads indicate N1ICD-stained nuclei. Scale bar, 50 μm. (E) Immunohistochemistry for SMA (red) and Notch3 (green) on E16.5 control and Dll4GOF;Tie2-Cre heart sections. Dapi counterstain (blue). The arrow points to a coronary vessel stained by SMA and Notch3. Scale bar, 50 μm. Microscope: Nikon A1-R. Software: NIS Elements AR 4.30.02. Build 1053 LO, 64 bits. Objectives: Plan Apo VC 20x/0,75 DIC N2 dry; Plan Fluor 40x/1,3 Oil DIC H N2 Oil. (F) Quantified data for control and Dll4GOF;Tie2-Cre hearts: E14.5, area covered by veins (Emcn-positive vessels). Data are mean ± s.d, (n = 2 control embryos and n = 3 mutant embryos); E16.5, area covered by coronary arteries (IsoB4-positive vessels), and area covered by veins (Emcn-positive vessels). Data are mean ± s.d, (n = 3 control embryos and n = 2 mutant embryos). (G) Quantified data of the percentage of N1ICD-positive nuclei in E16.5 endothelium as a percentage (%) of total nuclei; and SMA-Notch3 co-immunostaining in coronary arteries. Data are mean ± s.d, (n = 3 sections from 3control embryos and n = 4 sections from 3 mutant embryos) *p<0.05, **p<0.01, by Student’s t-test; ns. not significant.
Figure 4—figure supplement 1
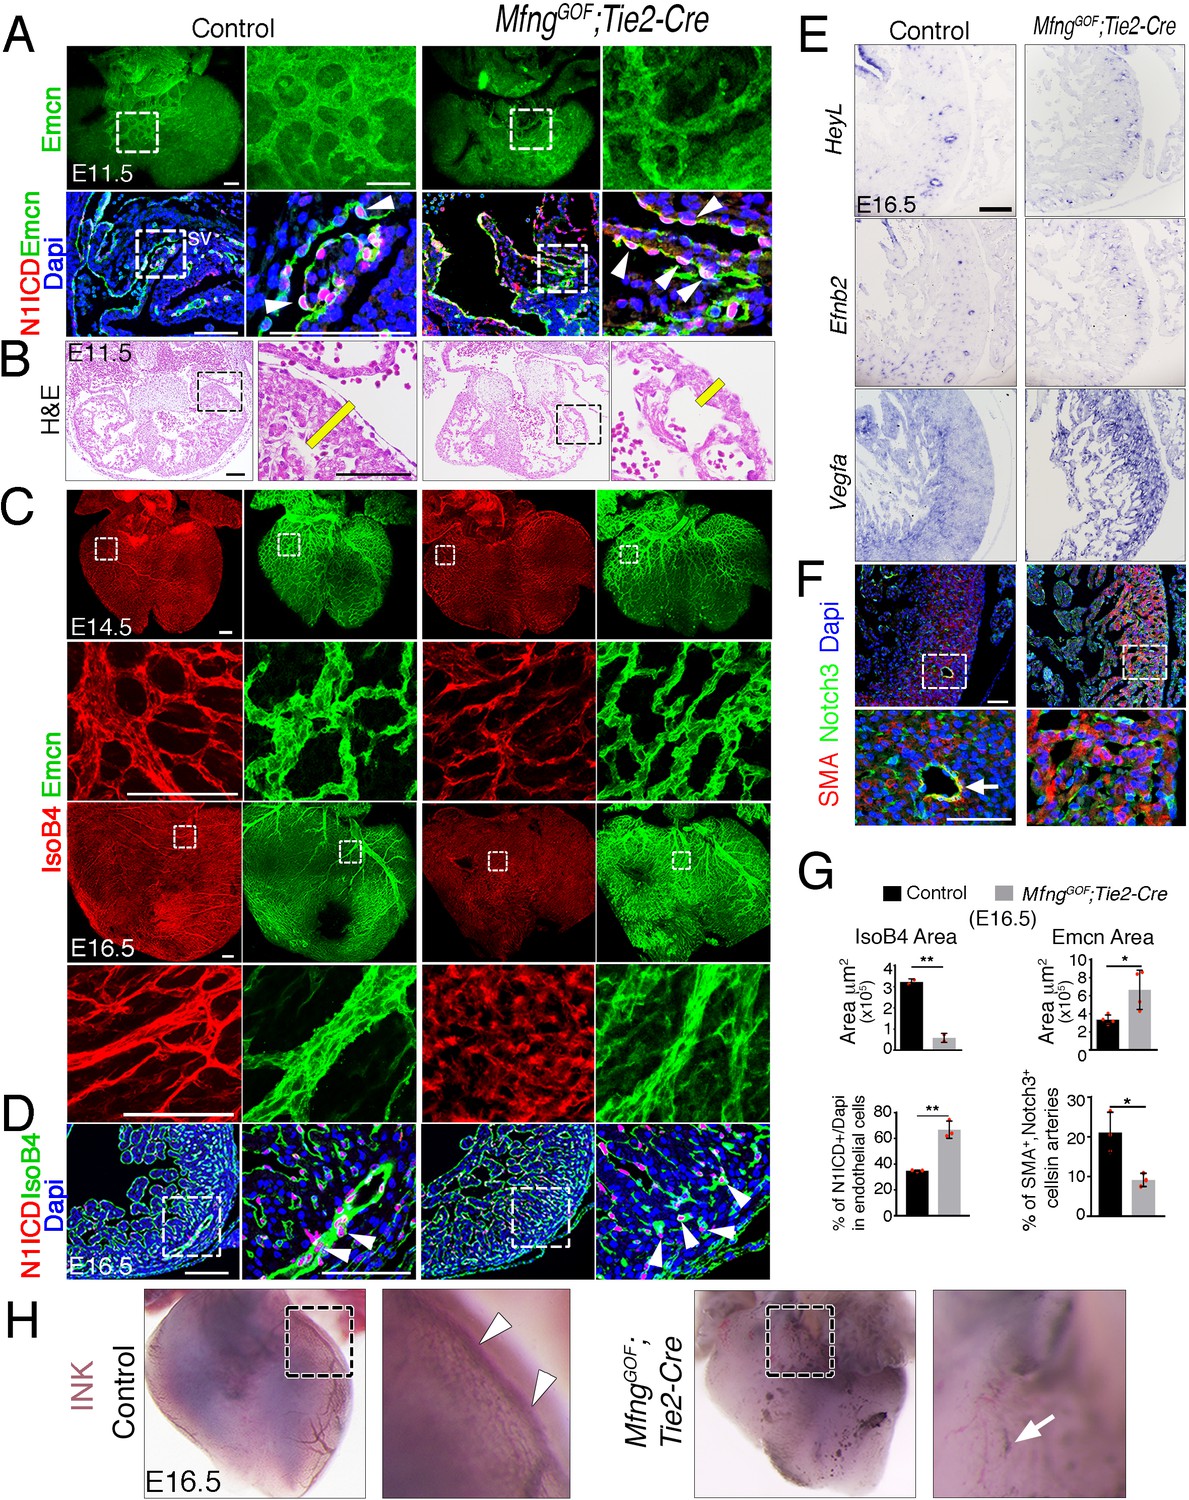
Forced Mfng expression disrupts arterio-venous differentiation and arterial endothelial integrity.
(A) Top, Dorsal view of whole-mount immunochemistry for Emcn (labeling SV endothelium, green) in E11.5 control and MfngGOF;Tie2-Cre hearts. Bottom, Immunohistochemistry for N1ICD (red) and Emcn (green) on E11.5 control and MfngGOF;Tie2-Cre heart sections. Dapi counterstain (blue). Arrowheads indicate N1ICD-stained nuclei. sv, sinus venosus. Scale bars, 100 μm. (B) H & E staining of E11.5 control and MfngGOF;Tie2-Cre heart sectionas showing reduced compact myocardium (CM) thickness in transgenic embryo (yellow bar). Scale bars, 100 μm. (C) Dorsal view of whole-mount immunohistochemistry for IsoB4 (red), labeling arteries and Emcn (green), labeling veins and capillaries, in E14.5 and E16.5 control and MfngGOF;Tie2-Cre hearts. Scale bars, 100 μm. (D) Immunohistochemistry for N1ICD (red) and IsoB4 (green) on E16.5 WT and MfngGOF;Tie2-Cre heart sections. Arrowheads indicate N1ICD-stained nuclei. Scale bars, 100 μm. (E) ISH of HeyL, Efnb2, and Vegfa on E16.5 control and MfngGOF;Tie2-Cre heart sections. Scale bar, 100 μm. (F) Immunohistochemistry for SMA (red) and Notch3 (green) on E16.5 control and MfngGOF;Tie2-Cre heart sections. Dapi counterstain (blue). The arrow indicates SMA-Notch3 co-immunostaining in coronary vessels. Scale bar, 50 μm. Microscope: Nikon A1-R. Software: NIS Elements AR 4.30.02. Build 1053 LO, 64 bits. Objectives: Plan Apo VC 20x/0,75 DIC N2 dry; Plan Fluor 40x/1,3 Oil DIC H N2 Oil. (G) Quantified data for E16.5 control and MfngGOF;Tie2-Cre hearts: area covered by coronary arteries (IsoB4-positive vessels). Data are mean ± s.d. (n = 2 control embryos and 2 mutant embryos); area covered by veins (Emcn-positive vessels). Data are mean ± s.d. (n = 4 control embryos and 4 mutant embryos); percentage of N1ICD-positive nuclei in endothelium as a percentage (%) of total nuclei; and SMA-Notch3-co-immunostaining in coronary arteries. Data are mean ±s.d. (n = 3 sections from 3 control embryos and n = 3 from 3 transgenic embryos). *p<0.05, **p<0.01 by Student’s t-test. (H) Visualization of the coronary arterial vasculature at E16.5. Whole–mount aortic ink perfusion of the left coronary artery in control and MfngGOF;Tie2-Cre hearts. Note normal artery perfusion in the control (arrowheads) and the interrupted hemorrhaging artery in the transgenic heart (arrow).
Figure 5 with 1 supplement
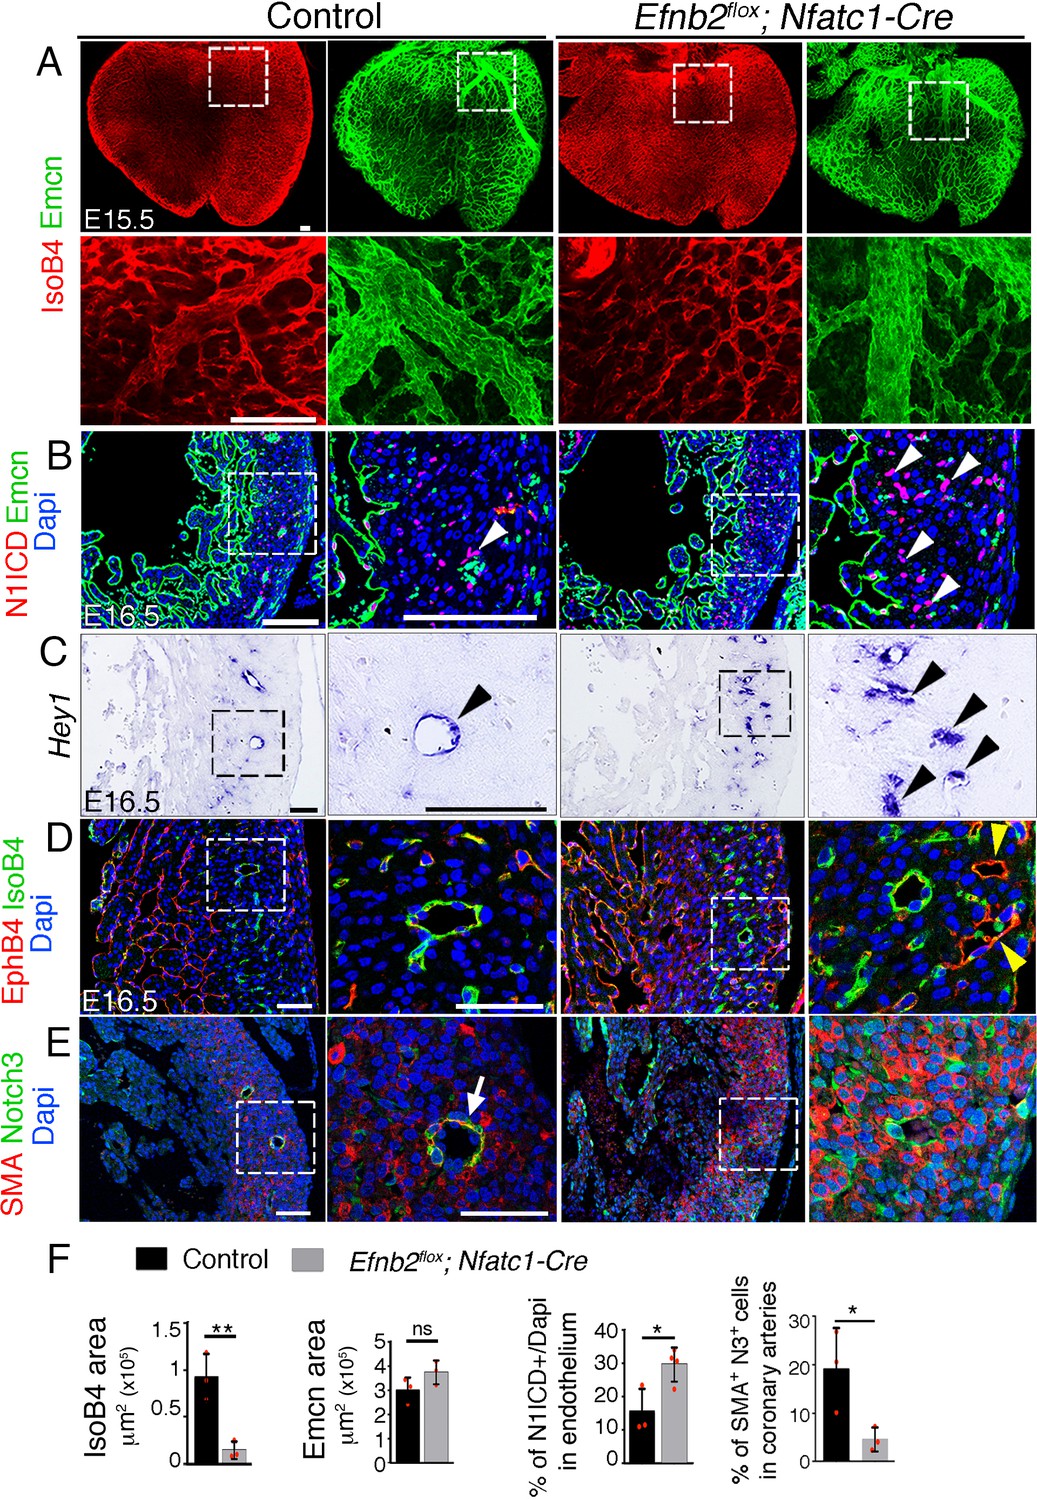
Endocardial Efnb2 inactivation disrupts coronary artery differentiation and remodeling.
(A) Dorsal view of whole-mount immunochemistry for IsoB4 (red), labelling arteries and Emcn (green), labeling veins and capillaries, in E15.5 control and Efnb2flox;Nfatc1-Cre hearts. Scale bars,100 μm. (B) Immunohistochemistry of N1ICD (red) and Emcn (green) on E16.5 control and Efnb2flox;Nfatc1-Cre heart sections. Dapi-counterstain (blue). Arrowheads indicate N1ICD-stained nuclei. Scale bars,100 μm. (C) ISH of Hey1 on E16.5 control and Efnb2flox;Nfatc1-Cre heart sections. Arrowheads indicate Hey1-expressing coronaries. Scale bars, 100 μm. (D) Immunohistochemistry for EphB4 (red) and IsoB4 (green) on E16.5 control and Efnb2flox;Nfatc1-Cre heart sections. Dapi-counterstain (blue). Yellow arrowheads indicate EphB4-stained vessels. Scale bar, 50 μm. (E) Immunohistochemistry for SMA (red) and Notch3 (green) on E16.5 control and Efnb2flox;Nfatc1-Cre heart sections. Dapi-counterstain (blue). Arrow points to a coronary artery stained by SMA and Notch3. Microscope: Nikon A1-R. Software: NIS Elements AR 4.30.02. Build 1053 LO, 64 bits. Objectives: Plan Apo VC 20x/0,75 DIC N2 dry; Plan Fluor 40x/1,3 Oil DIC H N2 Oil. (F) Quantified data for control and E16.5 WT and Efnb2flox;Nfatc1-Cre hearts: E15.5, area covered by coronary arteries (IsoB4-positive vessels), area covered by veins (Emcn-positive vessels). Data are mean ± s.d, (n = 3 control embryos and n = 3 mutant embryos), and percentage of N1ICD-stained nuclei in endothelium as percentage (%) of total nuclei Data are mean ± s.d. (n = 3 sections from 3 control embryos and n = 3 sections from 4 mutant embryos); E16.5, SMA-Notch3 co-immunostaining in coronary arteries. Data are mean ± s.d. (n = 3 sections from three control embryos and n = 3 sections from 3 mutant embryos). *p<0.05, **p<0.01 by Student’s t-test; n.s., not significant.
Figure 5—figure supplement 1
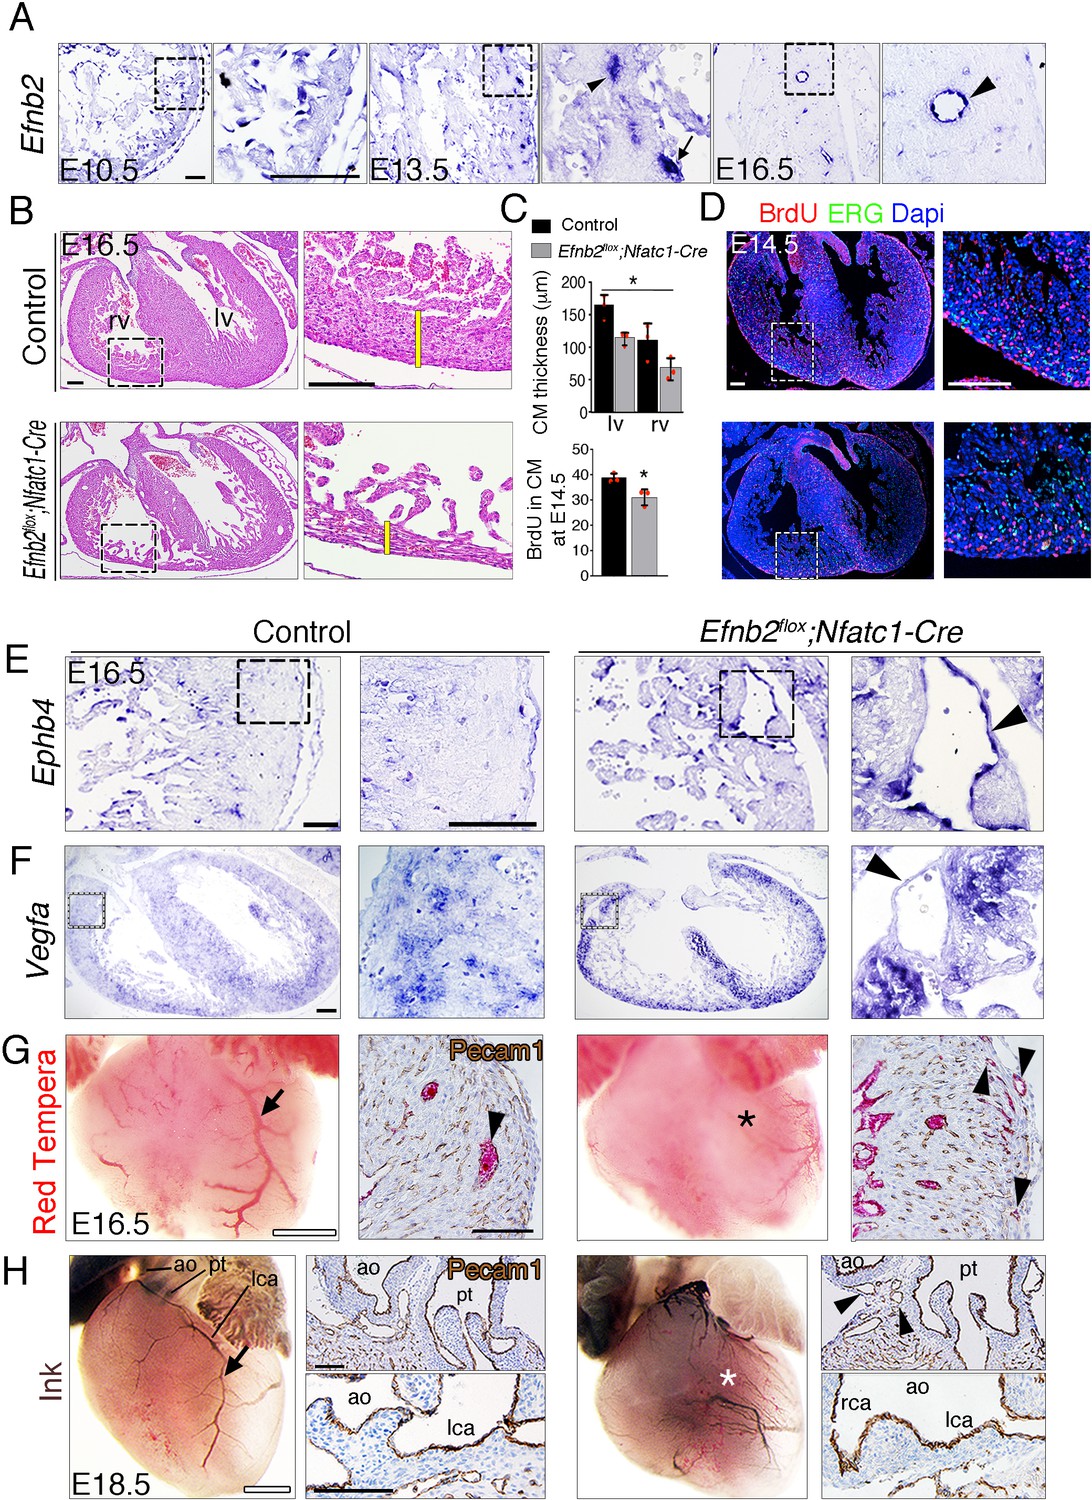
Endocardial Efnb2 deletion disrupts myocardial proliferation, arterio-venous differentiation, and arterial endothelial integrity.
(A) ISH in control embryos, showing Efnb2 expression in chamber endocardium at E10.5 (arrowheads); coronary arteries (arrowheads) and a coronary vein (arrow) at E13.5; and a coronary artery at E16.5 (arrowhead). Scale bars, 50 μm. (B) H a&E staining of transverse heart sections of E16.5 control and Efnb2flox;Nfatc1-Cre hearts. Yellow bars indicate compact myocardium (CM) thickness. BrdU (red) and ERG (green) staining in E14.5 control and Efnb2flox;Nfatc1-Cre hearts. Scale bars, 100 μm. (C) Charts showing CM thickness in left ventricle (lv) and right ventricle (rv) and BrdU-stained nuclei in CM as a percentage (%) of all Dapi-stained nuclei. Data are mean ± s.d. (n = 3 sections from 3 control embryos, and n = 3 sections from 3 mutant embryos). (D) BrdU (red) and ERG (green) staining in E14.5 control and Efnb2flox;Nfatc1- Cre hearts. Scale bars, 100 μm. Microscope: Nikon A1-R. Software: NIS Elements AR 4.30.02. Build 1053 LO, 64 bits. Objectives: Plan Apo VC 20x/0,75 DIC N2 dry; Plan Fluor 40x/1,3 Oil DIC H N2 Oil. (E) ISH of the venous marker Ephb4 in E16.5 control and Efnb2flox;Nfatc1-Cre hearts, showing increased Ephb4 expression and a severe arterio-venous malformation or fistula in the mutant (arrowhead). (F) ISH of Vegfa in E16.5 control and Efnb2flox;Nfatc1-Cre hearts, showing increased Vegfa expression in myocardium and an arterio-venous fistula (arrowhead). Scale bars, 50 μm. (G) Visualization of the coronary arterial vasculature at E16.5; whole-mount heart aortic Red Tempera perfusion reveals perfusion of the left coronary artery in the control (arrow) and the absence of perfusion in the Efnb2flox;Nfatc1-Cre mutant (asterisk). Scale bars, 500 μm. Pecam-1 staining of histological sections shows larger perfused coronaries in the control heart (arrowhead) and smaller perfused coronaries in the mutant (arrowheads). Scale bars, 100 μm. (H) Visualization of the coronary arterial vasculature at E18.5; whole-mount heart aortic ink perfusion reveals perfusion of the left coronary artery (lca) in control (arrow) and its absence in the Efnb2flox;Nfatc1-Cre mutant (asterisk). Scale bars, 500 μm. Pecam-1 staining of histological sections shows numerous peritruncal vessels surrounding the pulmonary trunk (pt) in the mutant ( arrowheads), while lca rooting to the aorta (ao) is maintained. rca, right coronary artery. Scale bars, 100 μm.
Figure 6
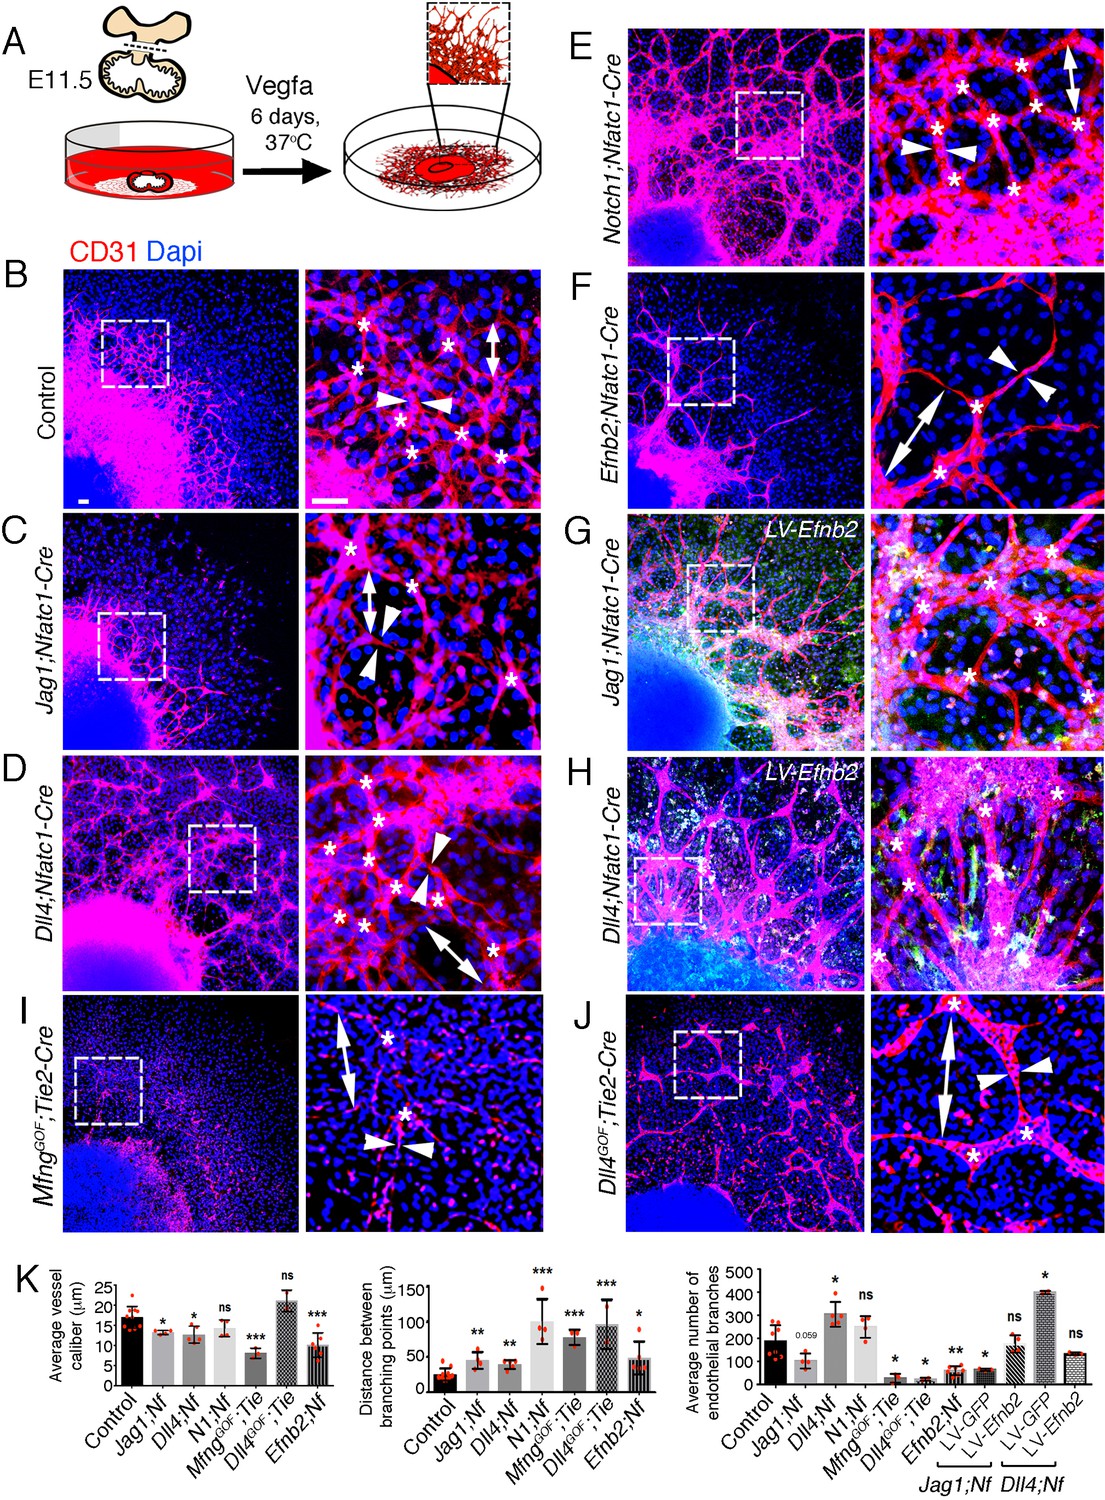
EPHRINB2 rescues disrupted arterial branching in ventricular explants from Jag1 and Dll4 mutant hearts.
(A) Ventricular explant assay procedure. (B–J) Representative images of E11.5 cultured ventricular explants from the following embryos: (B) control (n = 8–10), (C) Jag1flox;Nfatc1-Cre (n = 4), (D) Dll4flox;Nfatc1-Cre (n = 5), (E) Notch1flox;Nfatc1-Cre (n = 4), (F) MfngGOF;Tie2-Cre (n = 3), (G) Dll4GOF;Tie2-Cre (n = 3), (H) Efnb2flox;Nfatc1-Cre (n = 5–7), (I) Dll4flox;Nfatc1-Cre infected with Efnb2-overexpressing lentivirus (n = 5–7). Microscope: Nikon A1-R. Software: NIS Elements AR 4.30.02. Build 1053 LO, 64 bits. Objectives: Plan Apo VC 20x/0,75 DIC N2 dry; Plan Fluor 40x/1,3 Oil DIC H N2 Oil. (J) Quantification of vessel caliber (arrowheads), branching point distance (double ended arrowhead), and mean endothelial branch (asterisk) number. Data are means ± s.d. ***p<0.001; **p<0.01; *p<0.05, by Student’s t-test; Benjamini-Hochberg adjusted p-value. n.s not significant. Scale bars, 100 μm.
Figure 7 with 1 supplement
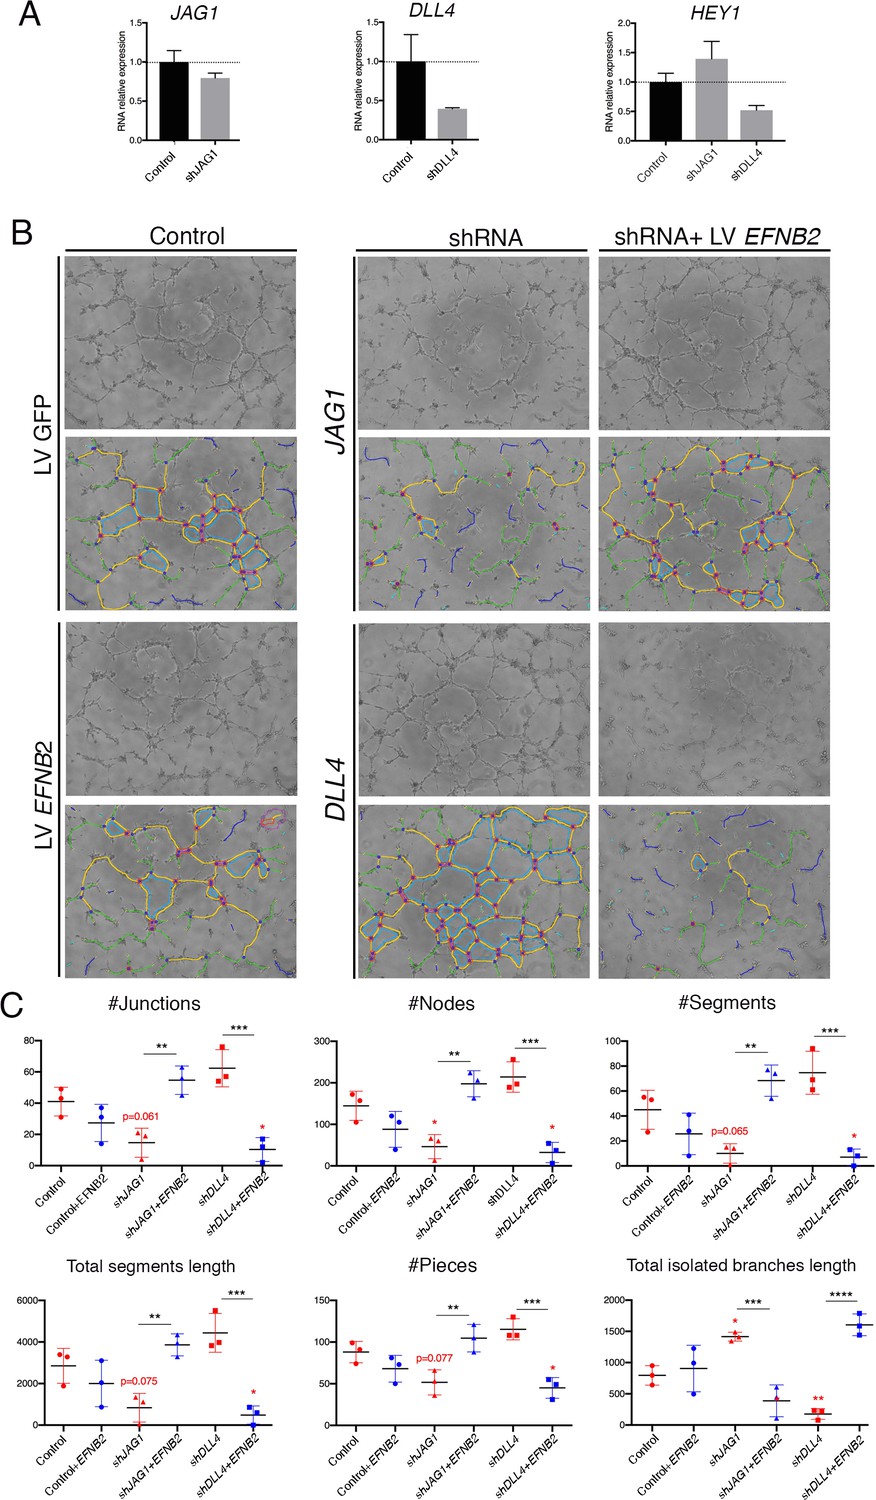
EPHRINB2 rescues defective capillary network formation resulting from shRNA-mediated silencing of JAG1 and DLL4 in HUVEC.
(A) qRT-PCR of JAG1, DLL4 and HEY1 after transduction of shRNA. (B) Representative phase contrast images (1 of 2 experiments) of the HUVEC network, after transduction of indicated shRNA and rescue by EFNB2 analyzed by the Angiogenesis Analyzer from ImageJ. (C) Significantly changed measurements in the analyzed area: nodes surrounded by junctions (red dot surrounded by dark blue circle). Isolated elements (dark blue line). Segments (yellow). Number of branches (green) and meshes (light blue) were not significantly altered (not shown). Total segments length: sum of length of the segments. Number of pieces: sum of number of segments, isolated elements and branches detected. Total isolated branches length: sum of the length of the isolated elements. Red asterisks refer to comparisons between experimental and control situations. Black asterisks refer to comparisons between shRNA-mediated inhibition and LV-mediated rescue. Data are means ± s.d. ****p<0.0001; ***p<0.001; **p<0.01; *p<0.05, by ANOVA.
Figure 7—figure supplement 1
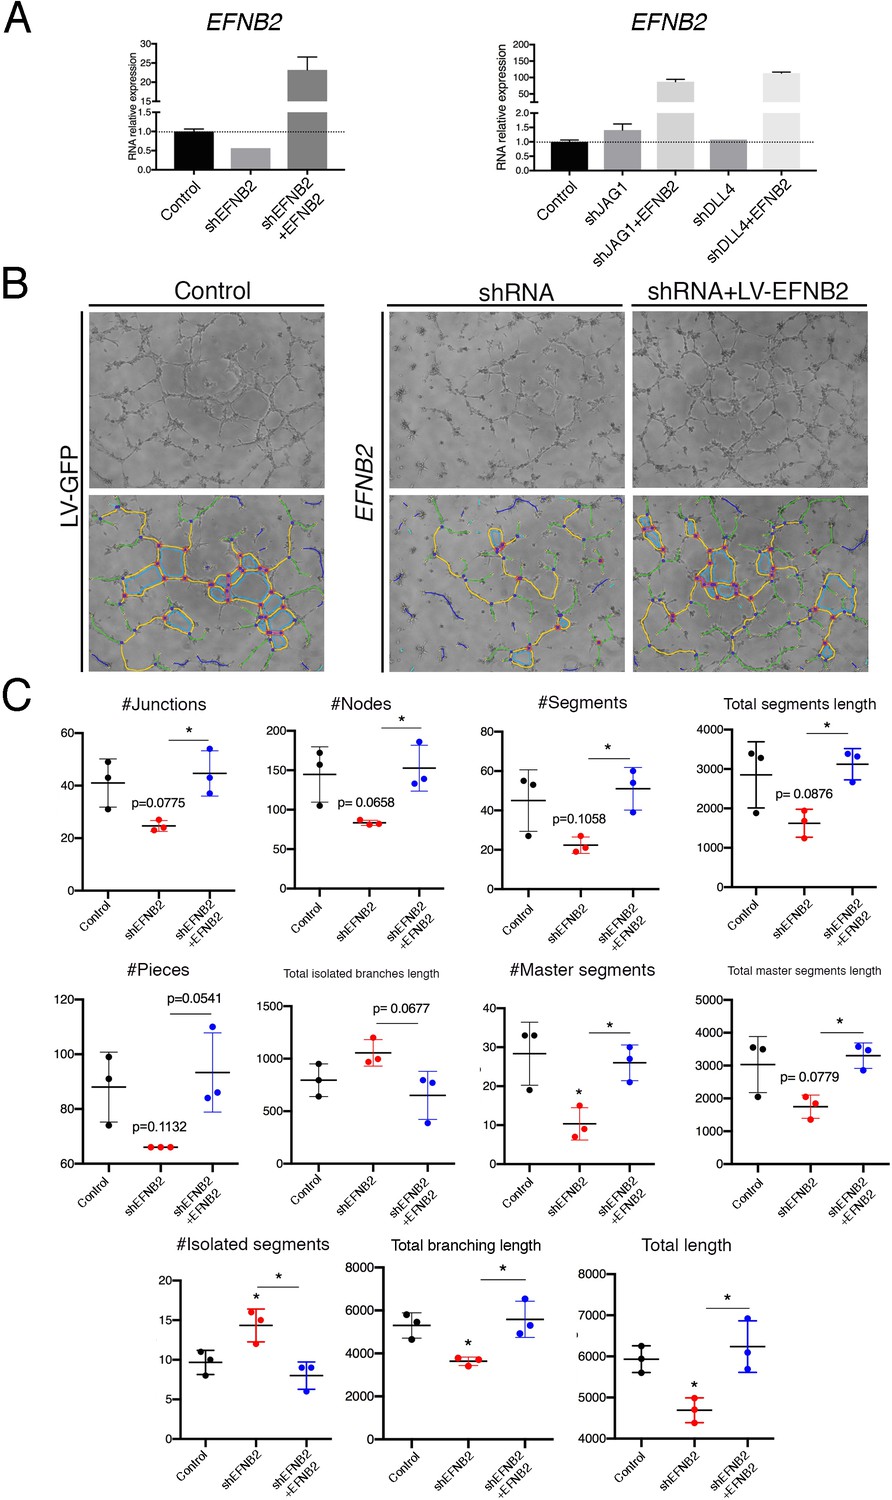
EPHRINB2 rescues defective capillary network formation after shRNA-mediated silencing of EFNB2.
(A) qRT-PCR of expression of EFNB2 after transduction of indicated shRNA. (B) Representative phase contrast images (1 of 2 experiments) of the HUVEC network, after transduction of indicated shRNA and rescue by EFNB2 analyzed by the Angiogenesis Analyzer fromImageJ. (C) Informative measurements in the analyzed area: nodes surrounded by junctions (red dot surrounded by dark blue circle). Isolated elements (dark blue line). Segments (yellow). Total segments length: sum of length of the segments. Number of pieces: sum of number of segments, isolated elements and branches detected. Total isolated branches length: sum of the length of the isolated elements. Red asterisks refer to comparisons between experimental and control situations. Black asterisks refer to comparisons between shRNA-mediated inhibition and LV-mediated rescue. Data are means ± s.d. ****p<0.0001; ***p<0.001; **p<0.01; *p<0.05, by ANOVA.
Figure 8
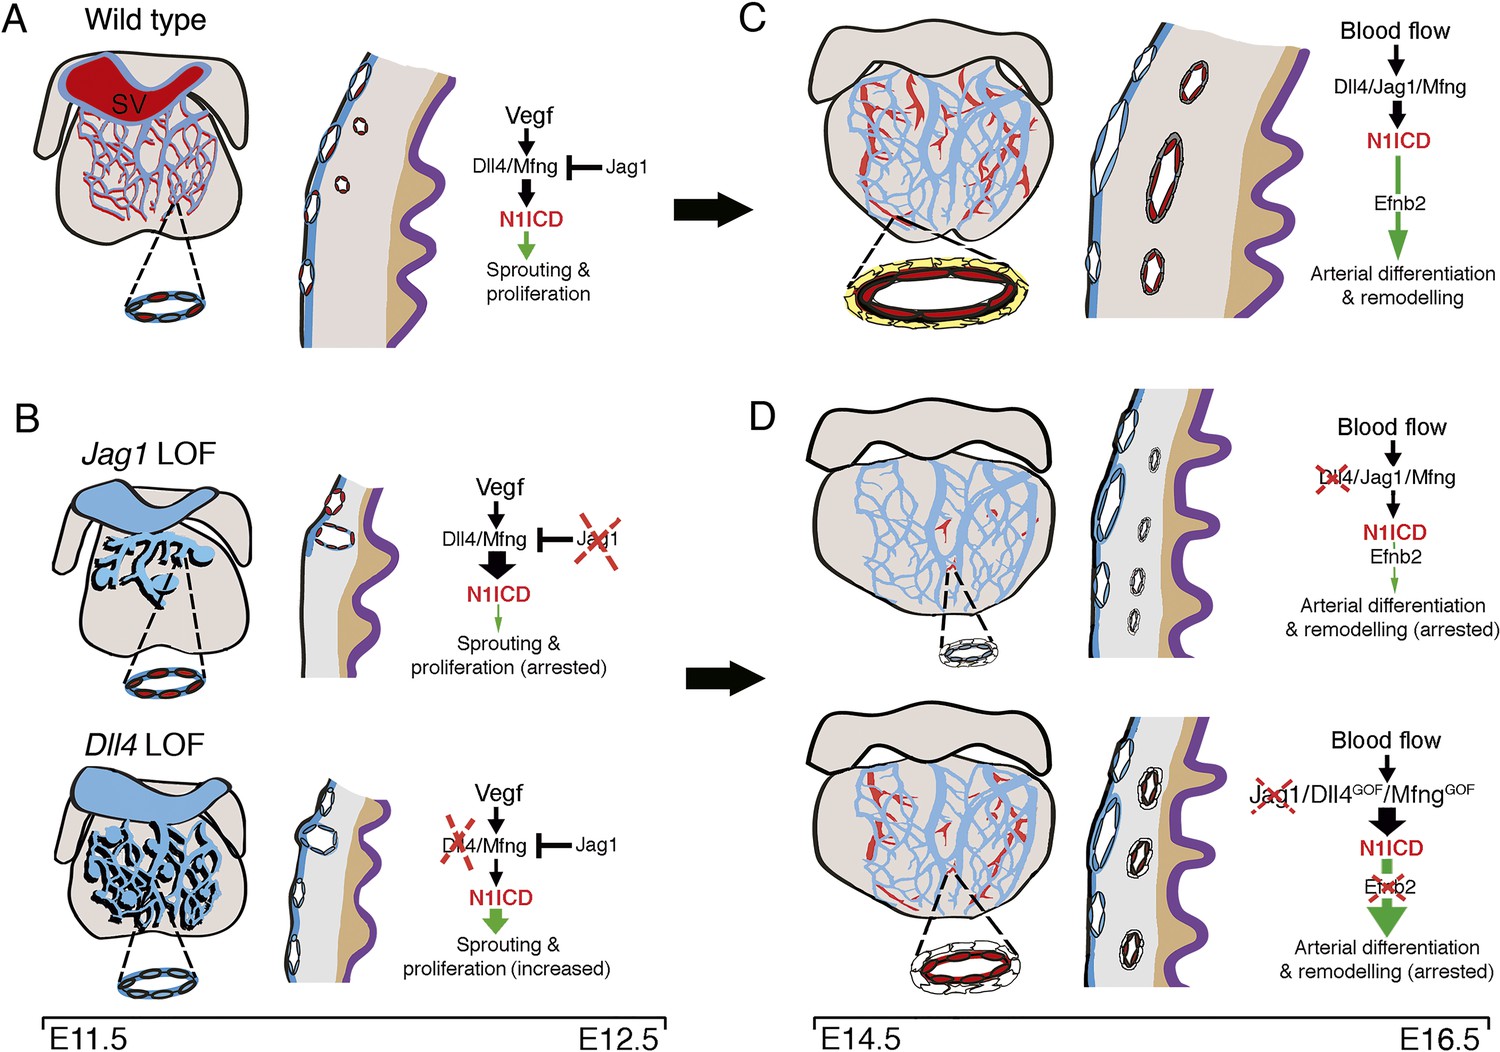
Coronary arterial development is regulated by a Dll4-Jag1-EphrinB2 signaling cascade.
(A,B) Embryonic stages E11.5-E12.5. Development of the primitive coronary plexus. (A) Left: sinus venous (SV)-derived vessels covering the dorsal side of a wild-type heart. Zoomed view showing a subepicardial vessel with a subset of ECs expressing N1ICD (red). These N1ICD-expressing cells are equivalent to pre-artery cells defined by Su et al. (2018). Center: cross-section through the ventricular wall. SV-derived ECs invade the sub-epicardial space over the myocardium to cover the heart dorsally. Some pre-artery ECs invade the myocardium and begin to differentiate into arteries. Right: during EC sprouting and proliferation, a regulatory balance between Dll4/Mfng and Jag1 modulates Notch signaling output downstream of Vegf. (B) Left: E12.5 Jag1flox;Nfatc1-Cre (Jag1LOF; top) exhibit arrested coronary angiogenesis, Dll4flox;Nfatc1-Cre mutants (Dll4LOF; bottom) display increased angiogenesis, and both mutants display vascular malformations. The zoomed views show details of a sub-epicardial vessels with increased N1ICD expression in the Jag1LOF mutants (red), and decreased expression in the Dll4LOF mutants (blue). Center: the sub-epicardial capillary plexus is either poorly developed in Jag1LOF mutants or over-developed in Dll4LOF mutants, and with vascular malformations. Mutant hearts have a thin myocardial wall, but maintain myocardial patterning (grey-brown boundary). Right: Endocardial Jag1 deletion disrupts the regulatory balance with Dll4/Mfng, leading to increased N1ICD and arrested migration and proliferation. In contrast, endocardial Dll4 deletion results in decreased N1ICD signaling, and increased network complexity and proliferation. (C,D) Embryonic stages E14.5-E16.5. Arterial differentiation and plexus remodeling. (C) Left: coronary vasculature at the dorsal aspect of the wild-type heart. Zoomed view showing a coronary artery with an inner layer of ECs expressing N1ICD (red) and an outer layer of smooth muscle cells (yellow). Center: capillary differentiation and patterning give rise to large veins sub-epicardially and large arteries intra-myocardially. Right: systemic blood flow activates Dll4/Jag1/Mfng/N1ICD/EphrinB2 signaling to drive terminal arterial differentiation and remodeling. (D) Left: in coronary endothelial-Dll4flox;Pdgfb-iCreERT2 or -Jag1flox;Pdgfb-iCreERT2 mutants, the coronary vasculature is mis-patterned. Zoomed view detailing near absence of arteries in Dll4 mutants, and comparatively smaller caliber coronary artery in Jag1 mutants. The arteries in both mutants have an inner layer of a ‘leaky’ endothelium and an outer layer of poorly differentiated perivascular cells (white). Center: Dll4 mutants are characterized by the near-absence of coronary arteries while arteries in Jag1 mutants are decreased. In either case, veins are unaffected. Mutant hearts have a thin myocardial wall but maintain myocardial patterning (grey-brown boundary). Right: Coronary endothelial-Jag1 or Dll4LOF leads to increased or decreased N1ICD respectively, causing arrested arterial differentiation and remodeling. Inactivation of Efnb2 leads to a similar phenotype. Endothelial Notch gain-of-function (GOF), resulting from Dll4 or Mfng overexpression, also leads to increased N1ICD and disrupted arterial differentiation and remodeling.
Author response image 1

GSEA analysis of Jag1flox;Nfatc1Creand Dll4flox;Nfatc1Cre RNA-seq datasets compared against respective controls (Ctrl).
Figure 2. GSEA analysis of Jag1flox;Nfatc1Cre and Dll4flox;Nfatc1Cre expression profiles, compared against their respective WT controls. An angiocrine factor gene set consisting of 52 genes was obtained from a previous publication (see Author response table 1 and Nolan et al. Dev Cell. 2013 Jul 29; 26(2)). Of the 52 angiocrine factors, 38 were detected as expressed in the Dll4 contrast (14,302 genes), and 34 in the Jag1 contrast (13,982 genes), as represented by the Venn diagrams at the upper left corner (panel A). GSEA results indicated that angiocrine factors were enriched among the genes that are more expressed in both Jag1 and Dll4 mutant backgrounds, as indicated by the respective enrichment profiles (panels B and C). In these profiles, red to blue gradient stripes represent the complete collections of expressed genes, sorted by decreasing fold change value in mutant versus WT contrasts: red colours indicate higher expression in mutant background (positive fold change), and blue colours indicate higher expression in WT background (negative fold change). Angiocrine factors, represented by black segments perpendiculary oriented along the gradient stripes, tend to concentrate in positive regions, as indicated by the green enrichment curves. Normalized enrichment score (NES) was therefore positive for both contrasts (1.54 and 0.93, for the Jag1 and Dll4 contrasts, respectively), although enrichment was statistically significant only for the Jag1 analysis (FDR = 0.04). Black rectangles indicate the groups of genes that contribute mostly to calculated NES values, which casually consisted in 11 genes for both analyses. The two leading edge subsets shared 7 genes (VEGFA, PDGFB, ANGPT2, EDN1, FGF9, CCL9 and BMP6), as represented by the Venn diagrams at the lower left corner (panel F). The central scatterplot (panel D) compares the fold change rank of the set of 34 angiocrine factors that were detected in both contrasts, and indicates (with a colour code) which of them were detected as differentially expressed (with p-value < 0.05) in each of the contrasts. Six leading edge subset angiocrine factors were detected as differentially expressed in at least one contrast, and four of them (VEGFA, BMP6, EDN1 and PDGFB) were detected in both. Heatmaps represent relative expression values for 38 angiocrine factors in Dll4 KO samples and their respective WT controls (panel E), and 34 angiocrine factors in Jag1 KO samples and the respective WT controls (panel G). Red and blue colours represent expression values above and below average, respectively. The four genes with asterisks in panel E are those that were detected as expressed only in the DLL4 contrast.
Tables
Key resources table
| Reagent type (species) or resource | Designation | Source or reference | Identifiers | Additional information |
|---|---|---|---|---|
| Genetic reagent | Mus Musculus (Mouse strain) | (Nowotschin et al., 2013) | CBF1:H2B-Venus | |
| Genetic reagent | Mus Musculus (Mouse strain) | (Kisanuki et al., 2001) | Tie2-Cre | |
| Genetic reagent | Mus Musculus (Mouse strain) | (Wu et al., 2012) | Nfatc1-Cre | |
| Genetic reagent | Mus Musculus (Mouse strain) | (Wang et al., 2010) | Pdgfb-iCreERT2 | |
| Genetic reagent | Mus Musculus (Mouse strain) | (Wang et al., 2010) | Cdh5-CreERT2 | |
| Genetic reagent | Mus Musculus (Mouse strain) | (Koch et al., 2008) | Dll4flox | |
| Genetic reagent | Mus Musculus (Mouse strain) | (Mancini et al., 2005) | Jag1flox | |
| Genetic reagent | Mus Musculus (Mouse strain) | (Grunwald et al., 2004) | Efnb2flox | |
| Genetic reagent | Mus Musculus (Mouse strain) | (Radtke et al., 1999) | Notch1flox | |
| Genetic reagent | Mus Musculus (Mouse strain) | (D’Amato et al., 2016) | MfngGOF | |
| Sequenced-based reagent | FH1_DLL4 | 5’-GTTACACAGTGAAAAGCCAG-3’ | KiCqStart_ SIGMA qPCR primer | |
| Sequenced-based reagent | RH1_DLL4 | 5’-CTCTCCTCTGATATCAAACAC-3’ | KiCqStart_ SIGMA qPCR primer | |
| Sequenced-based reagent | FH1_JAG1 | 5’-ACTACTACTATGGCTTTGGC-3’ | KiCqStart_ SIGMA qPCR primer | |
| Sequenced-based reagent | RH1_JAG1 | 5’-ATAGCTCTGTTACATTCGGG-3’ | KiCqStart_ SIGMA qPCR primer | |
| Squenced-based reagent | FH1_HEY1 | 5’-CCGGATCAATAACAGTTTGTC -3’ | KiCqStart_ SIGMA qPCR primer | |
| Sequenced-based reagent | RH1_HEY1 | 5’-CTTTTTCTAGCTTAGCAGATCC-3’ | KiCqStart_ SIGMA qPCR primer | |
| Sequenced-based reagent | FH1_EFNB2 | 5’-AAAGTTGGACAAGATGCAAG-3’ | KiCqStart_ SIGMA qPCR primer | |
| Sequenced-based reagent | RH1_EFNB2 | 5’-TGTACCAGCTTCTAGTTCTG-3’ | KiCqStart_ SIGMA qPCR primer | |
| Transfected construct (human) | VSV-G | Viral Vectors Unit, CNIC, Spain | Lentiviral construct to transfect shRNA | |
| Cell line (include species here) | HUVEC | Lonza | ||
| Transfected construct (mouse) | pRLL-IRESeGFP | Addgene | | Lentiviral construct to transfect eGFP or Full-length murine EphrinB2 |
| Transfected construct (human) | shRNA to JAG1 | SIGMA | SHCLNG-NM_000214 Clone ID:NM_000214.2-3357s21c1;Clone ID:NM_000214.2-1686s21c1 | transfected construct (human) |
| Transfected construct (human) | shRNA to DLL4 | SIGMA | SHCLNV-NM_019074 Clone ID:NM_019074.2-2149s21c1; Clone:NM_019074.2-2276s21c1 | transfected construct (human) |
| Antibody | Anti-CD31/Pecam1 (Monoclonal Rat) | BD Biosciences Pharmingen | 550274 MEC13.3 | IF=1:100 |
| Antibody | Dll4 (Polyclonal Rabbit) | Santa Cruz Biotechnology | Sc-28915 | IF=1:100 |
| Antibody | Endomucin (Polyclonal Rat) | Santa Cruz Biotechnology | sc-65495 V.7C7 | IF=1:200 |
| Antibody | Jag1 (Monoclonal Rabbit) | Cell Signaling Technology | 2620 28H8 | IF=1:100 |
| Antibody | NFATc1 (Monoclonal Mouse) | Enzo Life Sciences | ALX- 804-022-R100 7A6 | IF=1:100 |
| Antibody | Cleaved Notch1 (Val1744) (Monoclonal Rabbit) | Cell Signaling Technology | 4147 D3B8 | IF=1:100 |
| Antibody | p27 (Polyclonal Mouse) | Medical and Biological Laboratories | K0082-3 p27 Kip1 | IF=1:100 |
| Antibody | Notch 3 (Polyclonal Rabbit) | Abcam | ab23426 G00041 | IF=1:100 |
| Antibody | ERG (Monoclonal Rabbit) | Abcam | ab110639 EPR3863 | IF=1:100 |
| Antibody | Glut1 (Polyclonal Rabbit) | MERCK Millipore | 07-1401 C00222 | IF=1:100 |
| Antibody | BrdU (Monoclonal Mouse) | BD Biosciences | 347580 B-44 | IF=1:50 |
| Antibody | Isolectin IB4- Alexa Fluor 647 | Molecular Probes | I32450 | IF=1:300 |
| Antibody | Biotin Anti-rat | Vector laboratories | BA4001 | IF=1:200 |
| Antibody | Biotin Anti-rabbit | Jackson | 111-066-003 | IF=1:200 |
| Antibody | Anti-mouse Alexa Fluor 647 | Jackson | 115-606-003 | IF=1:200 |
| Antibody | Anti-mouse Alexa Fluor 488 | Invitrogen | A-11029 | IF=1:200 |
| Antibody | Anti-rat | Invitrogen | A-11006 | IF=1:200 |
| Peptide, recombinant protein | Human-Vegf165 | Human Peprotech | 100-20 | 10ng/ml |
| Commercial assay or kit | Click-iT EdU Imaging Kit | Thermo Fisher Scientific | C10340 | |
| Commercial assay or kit | HydroxyprobeTM-1 Plus Kit | Hydroxyprobe, Inc (HPI). | (Pimonidazole Hydrochloride CAS#70132-50-3) | |
| Other | Matrigel | Corning | 354234 | |
| Software | Cutadapt v1.6 | (Martin, 2011) | ||
| Software | RSEM v1.2.20 | (Li and Dewey, 2011) | ||
| Software | Limma | (Ritchie et al., 2015) | Bioconductor package | |
| Software | GOplot | (Walter et al., 2015) | ||
| Software | IPA | http://www.ingenuity.com |
Author response table 1
List of angiocrine gene from Nolan et al. (2013) compared with our RNA-seq data from Jag1flox;Nfatc1-Cre and Dll4flox;Nfatc1-Cre embryos (Figure 2A and Supplementary file 3).
| Nolan (52 genes) | Dll4 (38 genes) | Jag1 (34 genes) | Dll4 and Jag1 (34 genes) | Not common to Dll4 and Jag1 (14 genes) | Dll4 specific (4 genes) |
| ANGPT2 | ANGPT2 | ANGPT2 | ANGPT2 | CCL3 | CCL6 |
| BMP2 | BMP2 | BMP2 | BMP2 | CXCL2 | CXCL13 |
| BMP5 | BMP5 | BMP5 | BMP5 | DKKL1 | FGF7 |
| BMP6 | BMP6 | BMP6 | BMP6 | GJB2 | IL1F9 |
| CCL2 | CCL2 | CCL2 | CCL2 | IL1A | |
| CCL3 | CCL6 | CCL9 | CCL9 | IL6 | |
| CCL6 | CCL9 | COL14A1 | COL14A1 | LAMA-4 | |
| CCL9 | COL14A1 | COL4A1 | COL4A1 | LAMB1-1 | |
| COL14A1 | COL4A1 | CXCL12 | CXCL12 | MMP13 | |
| COL4A1 | CXCL12 | DKK2 | DKK2 | MMP27 | |
| CXCL12 | CXCL13 | EDN1 | EDN1 | MMP8 | |
| CXCL13 | DKK2 | EGFL7 | EGFL7 | MMP9 | |
| CXCL2 | EDN1 | ELN | ELN | TNF | |
| DKK2 | EGFL7 | ESM1 | ESM1 | WNT8A | |
| DKKL1 | ELN | FGF1 | FGF1 | ||
| EDN1 | ESM1 | FGF9 | FGF9 | ||
| EGFL7 | FGF1 | FN1 | FN1 | ||
| ELN | FGF7 | GJA1 | GJA1 | ||
| ESM1 | FGF9 | GJA4 | GJA4 | ||
| FGF1 | FN1 | GJC1 | GJC1 | ||
| FGF7 | GJA1 | IGF1 | IGF1 | ||
| FGF9 | GJA4 | IL33 | IL33 | ||
| FN1 | GJC1 | JAG1 | JAG1 | ||
| GJA1 | IGF1 | KITL | KITL | ||
| GJA4 | IL1F9 | LAMB2 | LAMB2 | ||
| GJB2 | IL33 | LAMC1 | LAMC1 | ||
| GJC1 | JAG1 | PDGFB | PDGFB | ||
| IGF1 | KITL | PDGFC | PDGFC | ||
| IL1A | LAMB2 | PDGFD | PDGFD | ||
| IL1F9 | LAMC1 | TGFB2 | TGFB2 | ||
| IL33 | PDGFB | VEGFA | VEGFA | ||
| IL6 | PDGFC | VEGFC | VEGFC | ||
| JAG1 | PDGFD | WNT2 | WNT2 | ||
| KITL | TGFB2 | WNT5A | WNT5A | ||
| LAMA-4 | VEGFA | ||||
| LAMB1-1 | VEGFC | ||||
| LAMB2 | WNT2 | ||||
| LAMC1 | WNT5A | ||||
| MMP13 | |||||
| MMP27 | |||||
| MMP8 | |||||
| MMP9 | |||||
| PDGFB | |||||
| PDGFC | |||||
| PDGFD | |||||
| TGFB2 | |||||
| TNF | |||||
| VEGFA | |||||
| VEGFC | |||||
| WNT2 | |||||
| WNT5A | |||||
| WNT8A |
Additional files
-
Source data 1
Numerical data that are represented as a graph in a Figure or figure supplement, distributed in sheets corresponding to a given Figure or figure supplement by their order of appearance in the text, where they are also referred to.
- https://cdn.elifesciences.org/articles/49977/elife-49977-data1-v4.xlsx
-
Supplementary file 1
Lethality phases of Jag1flox;Nfatc1-Cre, Dll4flox;Nfatc1-Cre, Jag1flox;Pdgfb-iCreERT2, Dll4flox;Cdh5-iCreERT2 Dll4flox;Cdh5-CreERT2, MfngGof;Tie2-Cre, Efnb2flox;Nfatc1-Cre embryos.
- https://cdn.elifesciences.org/articles/49977/elife-49977-supp1-v4.xlsx
-
Supplementary file 2
Lists of differentially expressed genes identified after analysis of RNA-seq data, for contrasts between E12.5 Jag1flox;Nfatc1-Cre (Jag1Nfatc1 211 Deg); E12.5 Dll4flox;Nfatc1-Cre (Dll4Nfatc1 274 Deg); E16.5 Dll4flox;Cdh5-CreERT2 (Dll4Cdh5 163 Deg) and their control counterparts.
Upregulated genes appear in red background and downregulated genes in blue.
- https://cdn.elifesciences.org/articles/49977/elife-49977-supp2-v4.xlsx
-
Supplementary file 3
Results obtained with IPA for the sets of genes detected as differentially expressed (adjusted P value < 0.05) in contrasts between Jag1flox;Nfatc1-Cre (JAG1NF), Dll4flox;Nfatc1-Cre (Dll4NF), Dll4flox;Cdh5-CreERT2 (Dll4Cdh5) and their control counterparts.
Upstream Regulator analyses results, in sheets labelled as ‘UpRegTransc’, are restricted to molecules of type ‘transcription regulator’. For each predicted upstream regulator, tables describe expression log ratio (when available), predicted activation state, activation z-score, enrichment p_value and the collection of differentially expressed genes that are targets of the regulator. Downstream Effect analyses results, in sheets labelled as ‘CardSystDevFunc’, are restricted to functions of category ‘Cardiovascular System Development and Function’. For each functional term, tables describe enrichment p value, predicted activation state, activation z-score and the collection of differentially expressed genes associated to that particular function. Positive and negative z-score values suggest activation or inhibition of the corresponding upstream regulator or function in the mutant or control condition, respectively; abs(z-score)>2 and p value < 0.05 are considered significant.
- https://cdn.elifesciences.org/articles/49977/elife-49977-supp3-v4.xlsx
-
Supplementary file 4
List of primary and secondary antibodies used in this study to immunodetect proteins in whole-mount or paraffin sections.
- https://cdn.elifesciences.org/articles/49977/elife-49977-supp4-v4.xlsx
-
Transparent reporting form
- https://cdn.elifesciences.org/articles/49977/elife-49977-transrepform-v4.docx
Download links
A two-part list of links to download the article, or parts of the article, in various formats.
Downloads (link to download the article as PDF)
Open citations (links to open the citations from this article in various online reference manager services)
Cite this article (links to download the citations from this article in formats compatible with various reference manager tools)
Coronary arterial development is regulated by a Dll4-Jag1-EphrinB2 signaling cascade
eLife 8:e49977.
https://doi.org/10.7554/eLife.49977


