Compartmentalized oskar degradation in the germ plasm safeguards germline development
- Princeton University, United States
Figures
Figure 1 with 2 supplements
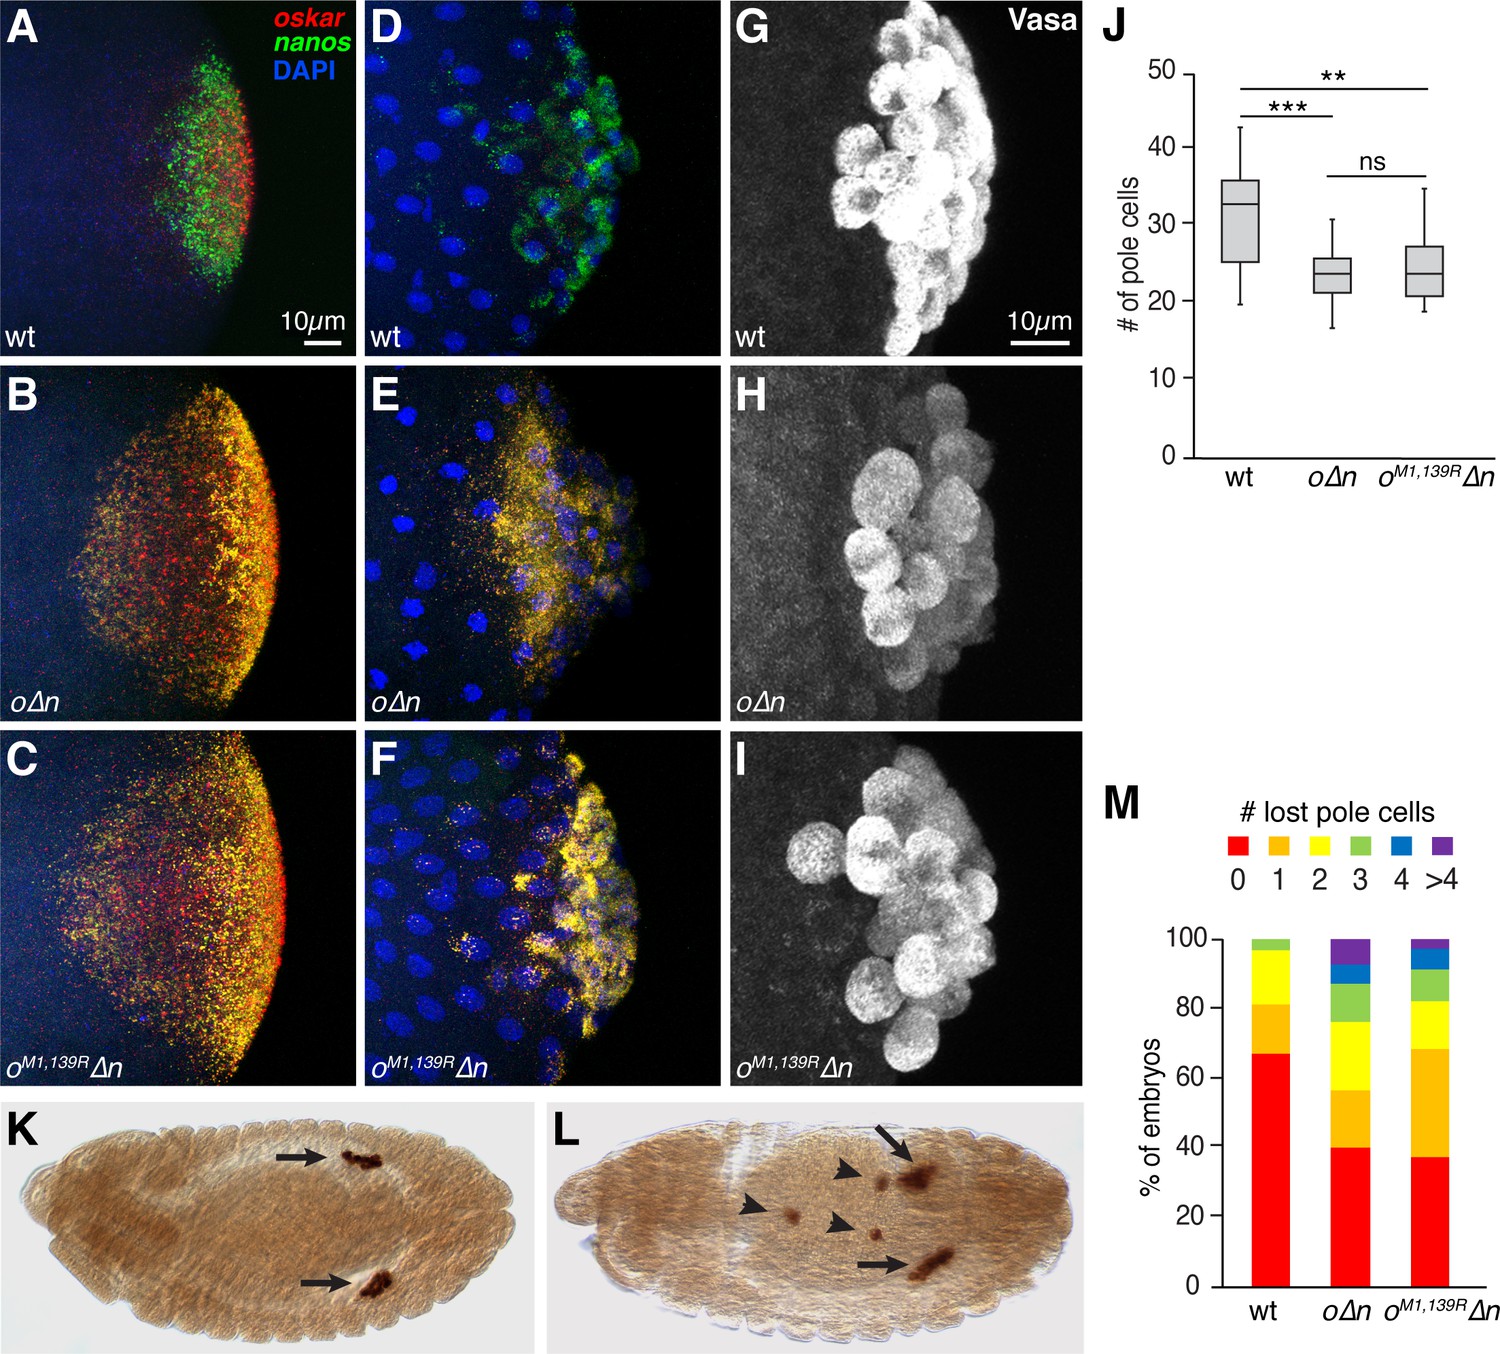
Incorporation of oskar mRNA into pole cells hinders their development independent of translation.
(A–F) Confocal z-series projections of the posterior region of wild-type (wt) embryos (A,D), o∆n embryos (B, E) and oM1,139R∆n (C,F). oskar (red) and nanos (green) mRNAs were detected by FISH in embryos prior to (A–C) and after (D–F) pole cell formation. Both endogenous oskar (in founder granules) and the transgenic oskar transcripts (co-localized with nanos in germ granules) are detected in (B,C,E,F). (G–I) Confocal z-series projections of pole cells, marked by anti-Vasa immunofluorescence, in wt (G), o∆n (H), and oM1,139R∆n (I) embryos. (J) Quantification of the number of pole cells formed in genotypes shown in (G–I), n = 15 embryos each. Box and whisker plot shows median, upper and lower quartiles, and range. (K, L) Anti-Vasa immunostaining of stage 13 oM1,139R∆n embryos showing examples of proper pole cell migration (K) and defective migration (L). Arrows indicated pole cells coalescing into gonads. Arrowheads indicate ‘lost’ pole cells that fail to reach the gonad. (M) Quantification of the frequency of embryos with the indicated numbers of lost pole cells observed in late-stage embryos; n = 91–136 embryos each. **p<0.01, ***p<0.001 as determined by Student's t-test. In this and all subsequent figures, embryos are oriented with the posterior end to the right, dorsal side toward the top.
-
Figure 1—source data 1
Related to Figure 1J and M.
- https://cdn.elifesciences.org/articles/49988/elife-49988-fig1-data1-v2.xlsx
Figure 1—figure supplement 1
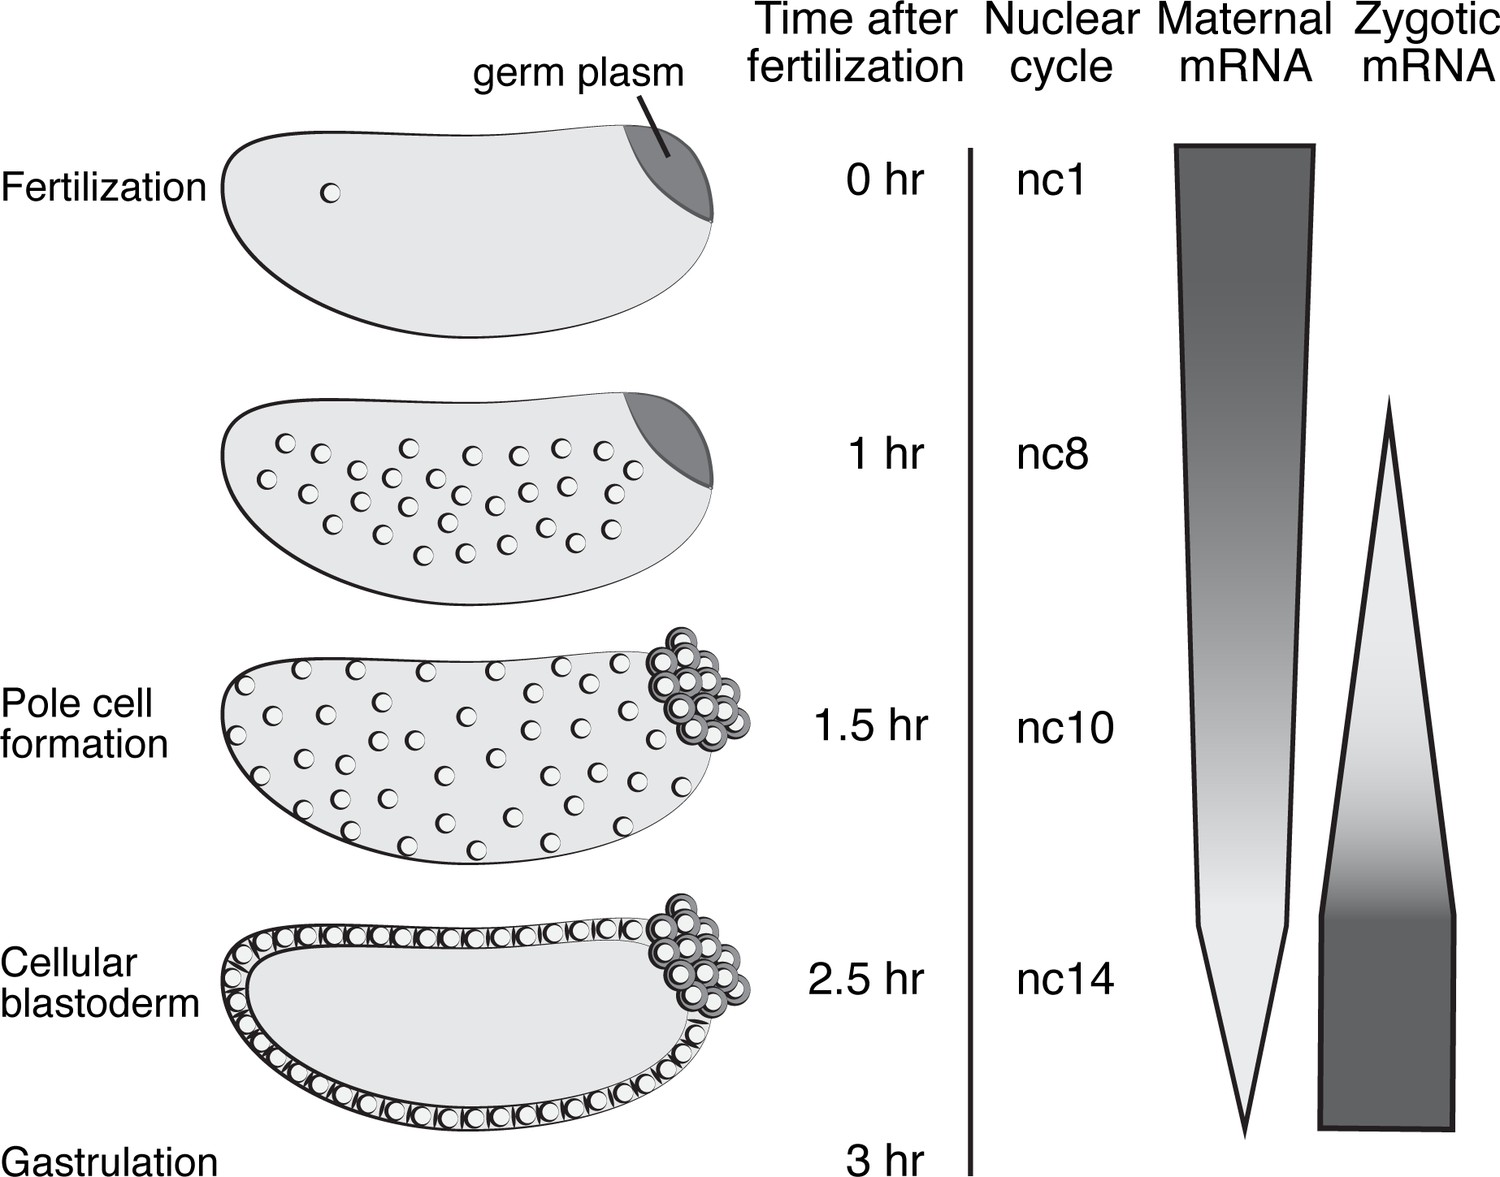
Overview of Drosophila nuclear cycles and MZT.
Representative embryos from nuclear cycle (nc) 1–14 are depicted, along with the corresponding time elapsed after fertilization. Pole cells form precociously during nc 10; the remaining somatic nuclei become cellularized during nc14 and gastrulation begins. Maternal mRNA degradation follows a variety of decay profiles that have been compressed in this figure, with some mRNAs requiring only maternal degradation machinery, some requiring both maternal and zygotic machinery, and some requiring only zygotic machinery. ZGA occurs in two waves, a minor ZGA beginning at nc8 and a major ZGA during nc14. Embryos are oriented with the posterior end to the right, dorsal side toward the top.
Figure 1—figure supplement 2
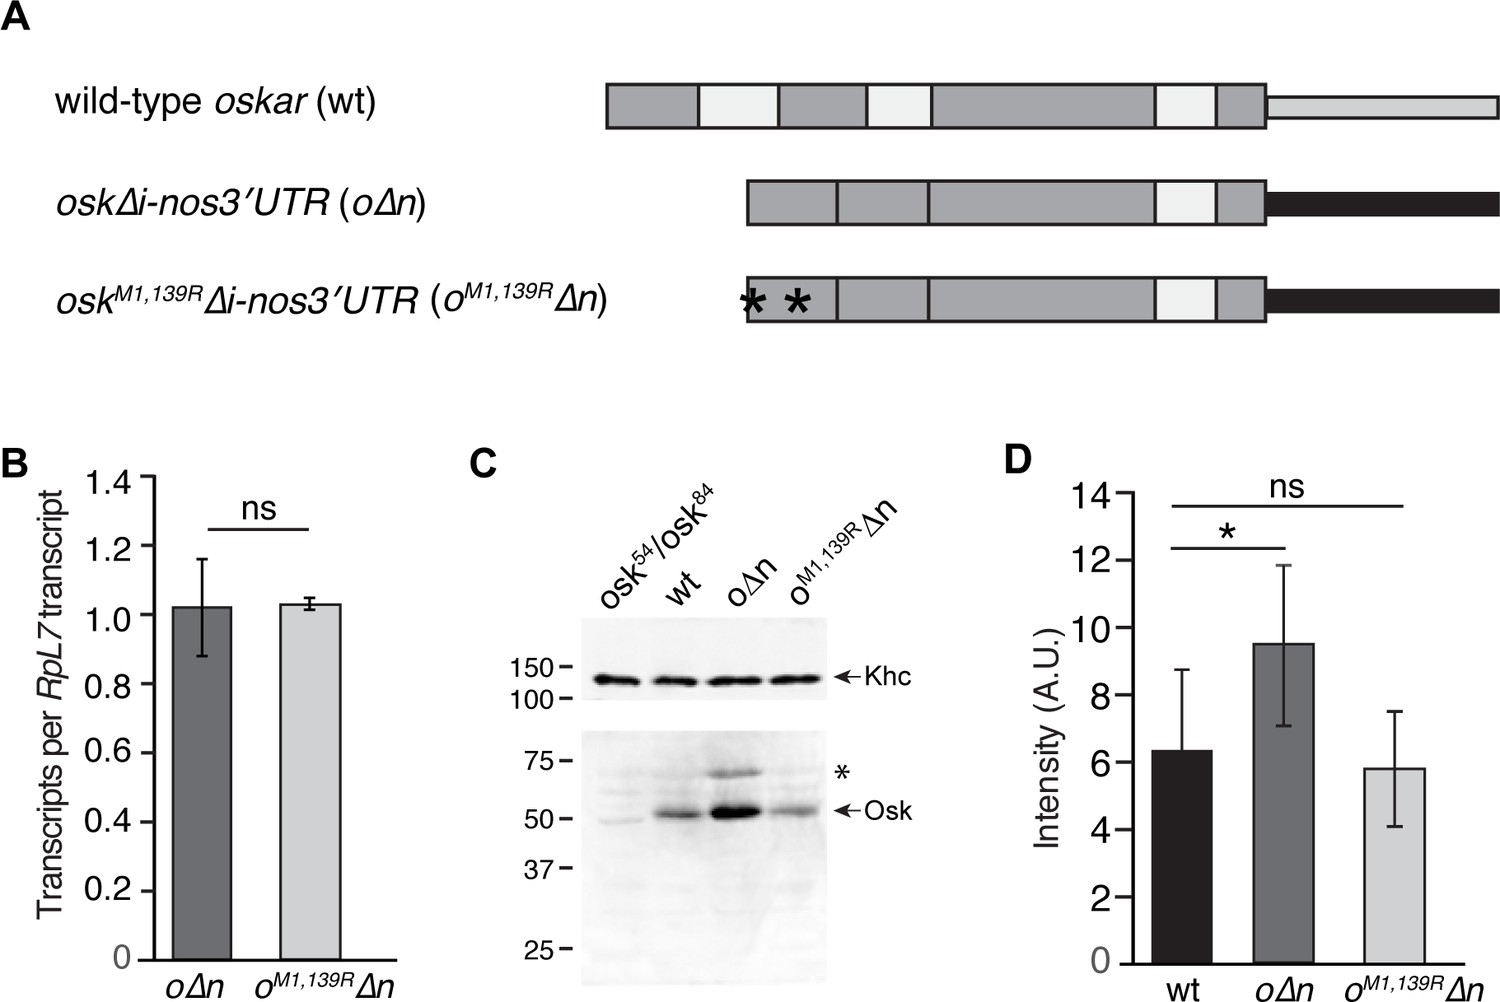
Quantification of transgene mRNA and protein levels.
(A) Schematic of transgenes: thick gray boxes indicate oskar coding sequences; thin gray box indicates oskar 3'UTR; white boxes indicate introns; black box indicates nanos 3'UTR. Asterisks indicate M to R mutations. The UASp sequences are not shown. (B) RT-qPCR quantification of o∆n and oM1,139R∆n mRNA levels in 0–1 hr embryos normalized to RpL7. Values shown are mean ± s.d. for three biological replicates. (C) Immunoblotting of ovary extracts from osk54/oskA87, wild-type (wt), o∆n, and oM1,139R∆n females with anti-Oskar and anti-Kinesin heavy chain (Khc; loading control) antibodies (the membrane was cut just below the 100 kDa marker, see Materials and methods). o∆n and oM1,139R∆n females also express endogenous, wild-type oskar mRNA; therefore the elevated level of Oskar in o∆n embryos reflects Oskar protein produced from both native and transgenic mRNA. The low abundance long isoform of Oskar is indicated by the asterisk. (D) Quantification of transgenic protein in the germ plasm by total localized Oskar IF intensity. Values are mean ± s.d. for three biological replicates.
-
Figure 1—figure supplement 2—source data 1
Related to Figure 1—figure supplement 2B and D.
- https://cdn.elifesciences.org/articles/49988/elife-49988-fig1-figsupp2-data1-v2.xlsx
Figure 2
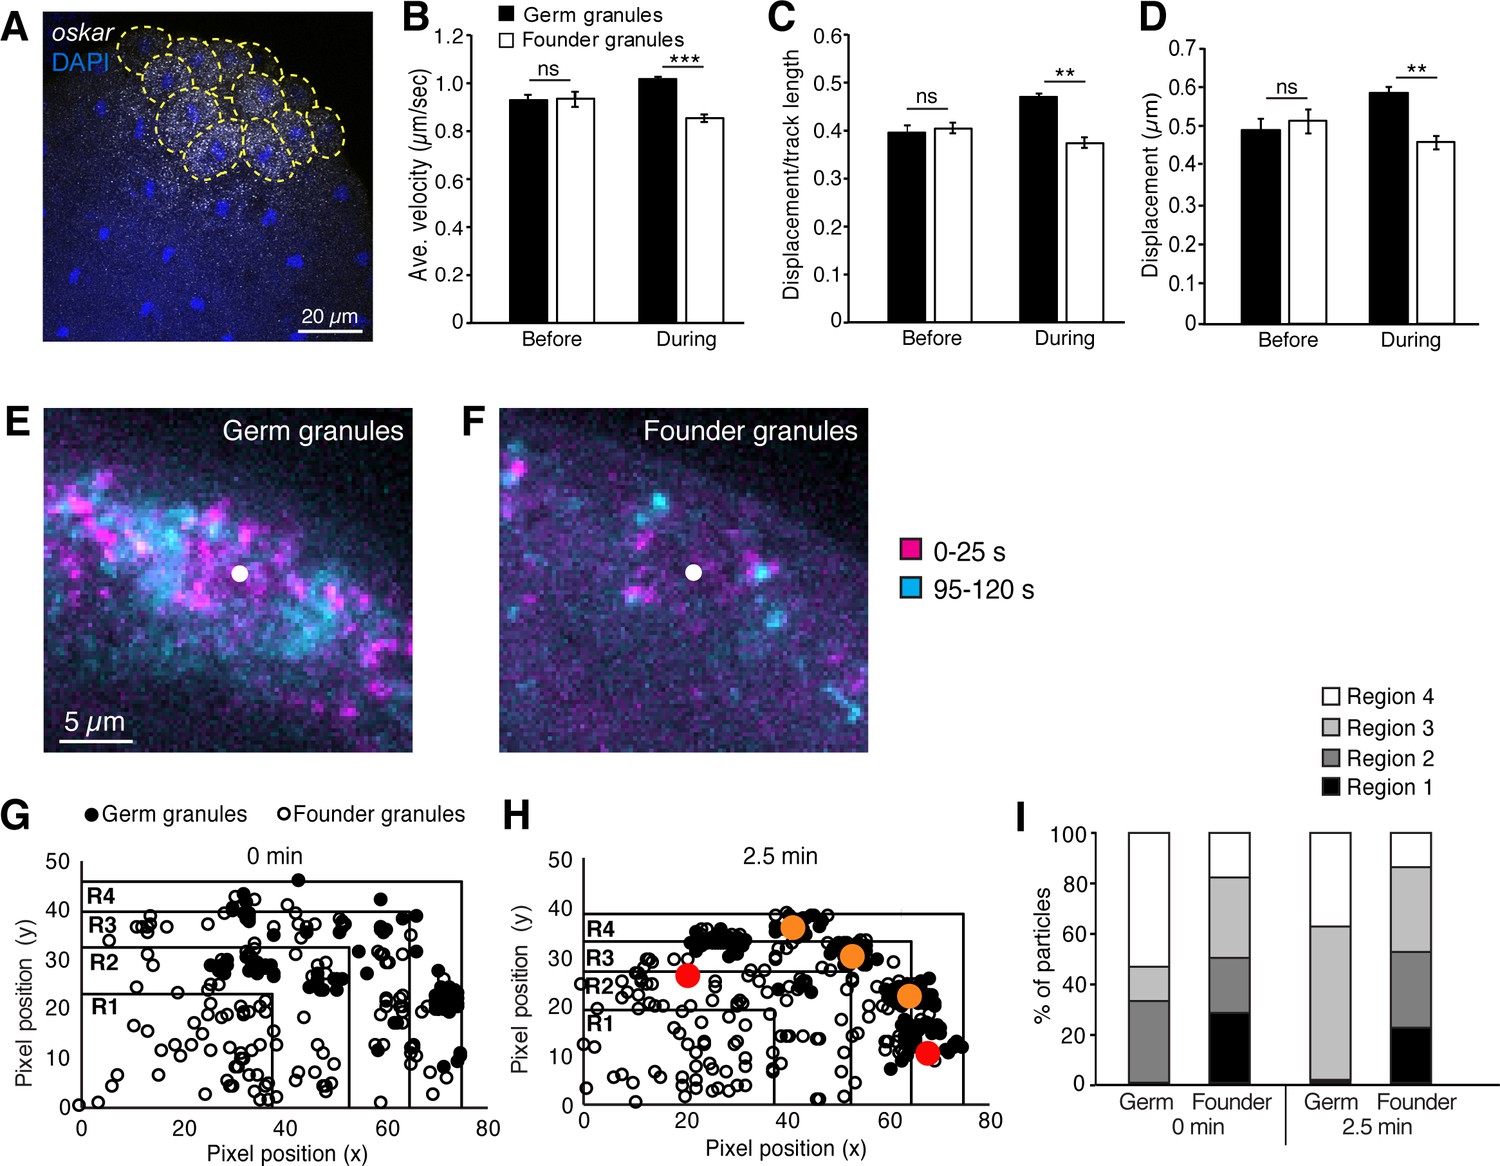
Founder granules are less motile than germ granules during pole cell formation.
(A) Confocal z-series projection showing oskar mRNA in an embryo at nc10. Yellow dashed lines outline pole cells. (B–D) Quantification of germ granule and founder granule motility prior to and during pole cell formation: average velocity (B); linearity (C); and displacement (D). For each time point, three 2 min movies, 491–3221 tracks each, were analyzed. (E, F) Maximum projections of the first 25 s (magenta) and last 25 s (cyan) of a 2 min movie taken during pole cell formation showing the positions of germ granules (E) and founder granules (F) at the start and end of each movie. The white dot indicates the center of the nucleus. Images are cropped to show one pole cell each from Video 1. (G–I) Quantification of the distribution of germ granules and founder granules before and during pole cell formation. Plots of the locations of germ granules (filled circles) and founder granules (open circles) as the onset of (G) and 2.5 min into pole cell formation (H). Red and orange dots indicate approximate positions of nuclei in and out of the frame, respectively. Plots are divided into 4 regions of equal area with region four closest to the cortex and region one farthest from the cortex. The number of each type of granule within each region is quantified in (I); n = 108–248 particles. Values are mean ± s.e.m.; **p<0.01; ***p<0.001 as determined by Student's t-test.
-
Figure 2—source data 1
Related to Figure 2B.
- https://cdn.elifesciences.org/articles/49988/elife-49988-fig2-data1-v2.xlsx
-
Figure 2—source data 2
Related to Figure 2C.
- https://cdn.elifesciences.org/articles/49988/elife-49988-fig2-data2-v2.xlsx
-
Figure 2—source data 3
Related to Figure 2D.
- https://cdn.elifesciences.org/articles/49988/elife-49988-fig2-data3-v2.xlsx
-
Figure 2—source data 4
Related to Figure 2G–I.
- https://cdn.elifesciences.org/articles/49988/elife-49988-fig2-data4-v2.xlsx
Figure 3 with 1 supplement
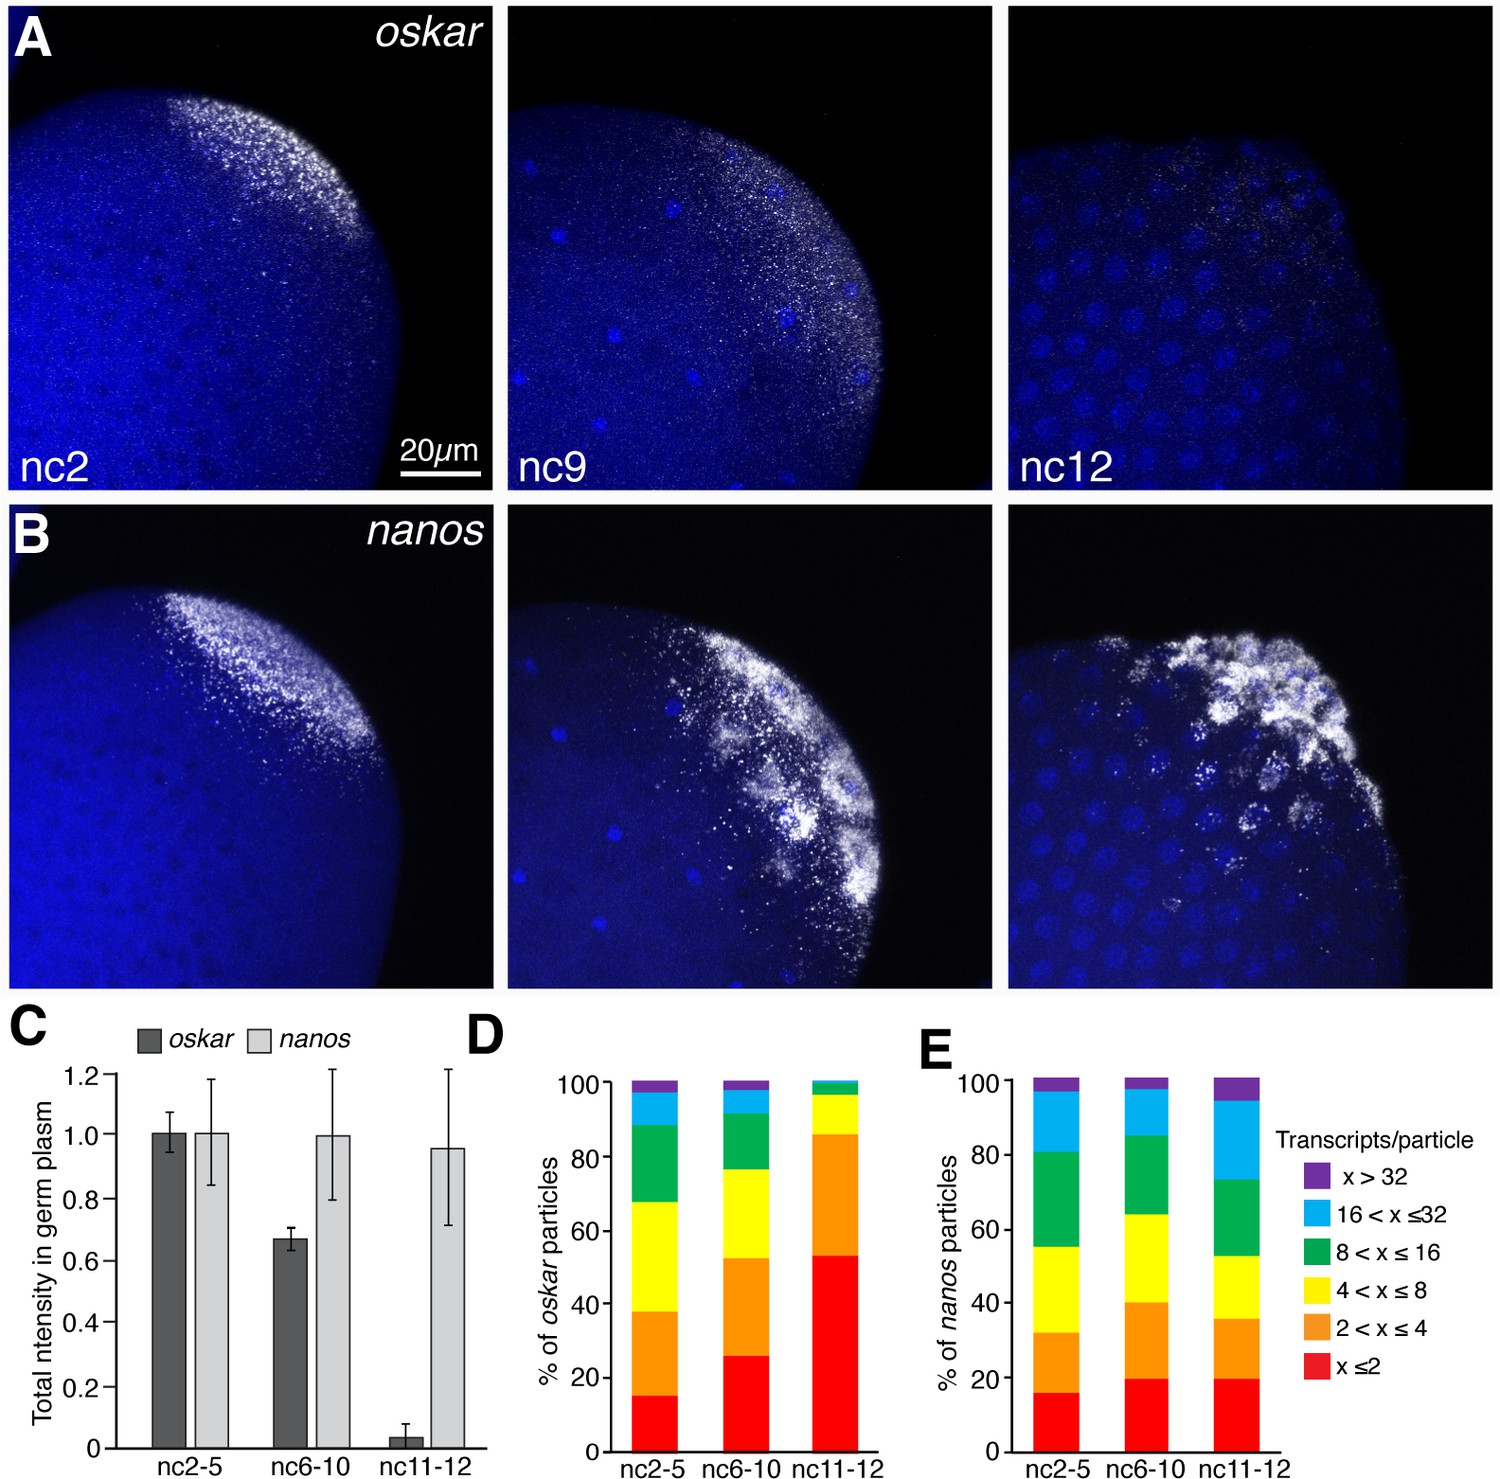
oskar mRNA is preferentially degraded during pole cell formation.
(A,B) Confocal z-series maximum intensity projections of the posterior pole of Drosophila embryos at nc2, nc9, and nc12, with oskar (A) or nanos (B) mRNAs detected by FISH. By nc9, nuclei have arrived at the cortex and by nc12, pole cells have formed. (C) Quantification of average total fluorescence intensities of germ plasm localized oskar and nanos during nc2-5, nc6-10, and nc11-12; n = 7–10 embryos per time period for oskar, n = 5 embryos per time period for nanos. Values are mean ± s.d., normalized to the values at nc2-5 for each mRNA. (D,E) Quantification of the size distributions of founder granules (D) and germ granules (E) as measured by the number of oskar or nanos transcripts per particle detected, respectively, from nuclear cycles 2 through 12; (n = 4–20 embryos per time period for germ granules, n = 11–28 embryos per time period for founder granules). Values are mean ± s.d.; ***p<0.001 for oskar values at nc6-9 and nc11-12 compared to nc2-5 as determined by Student's t-test.
-
Figure 3—source data 1
Related to Figure 3C.
- https://cdn.elifesciences.org/articles/49988/elife-49988-fig3-data1-v2.xlsx
-
Figure 3—source data 2
Related to Figure 3D,E.
- https://cdn.elifesciences.org/articles/49988/elife-49988-fig3-data2-v2.xlsx
Figure 3—figure supplement 1
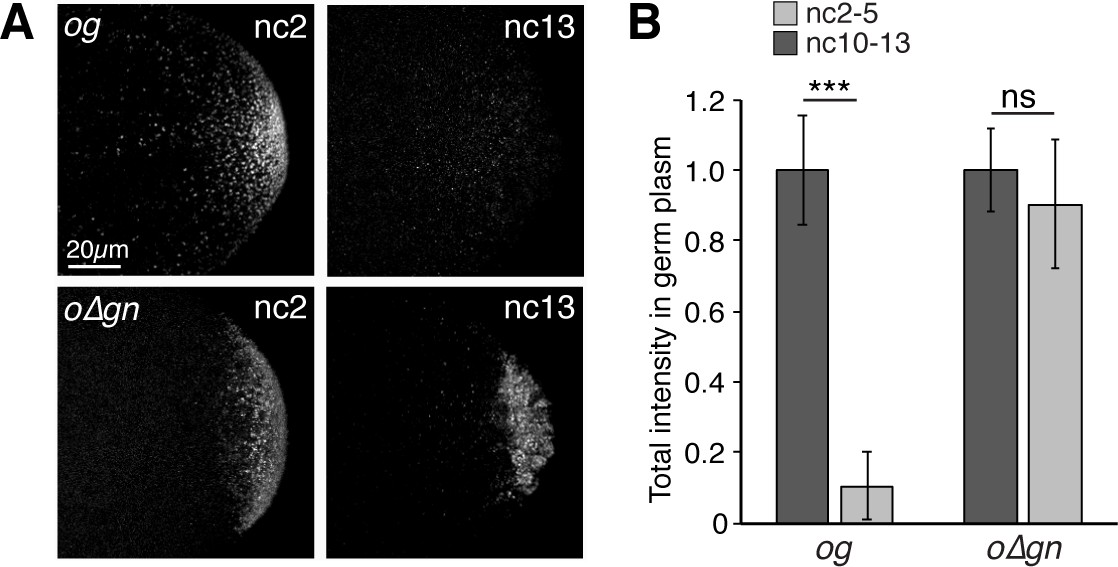
Targeting to germ granules prevents oskar degradation.
(A) Confocal z-series projections of the germ plasm of og and o∆gn embryos. The transgenic mRNAs are were detected with sfgfp probes. og and o∆gn embryos also contain endogenous, wild-type oskar mRNA; (B) Quantification of average total fluorescence intensities of og and o∆gn mRNAs in the germ plasm (n = 8 embryos for og; n = 9–12 embryos for o∆gn). Values are mean ± s.d., normalized to the value at nc2-5 for each genotype; ***p<0.001 as determined by Student's t-test.
-
Figure 3—figure supplement 1—source data 1
Related to Figure 3—figure supplement 1B.
- https://cdn.elifesciences.org/articles/49988/elife-49988-fig3-figsupp1-data1-v2.xlsx
Figure 4 with 1 supplement
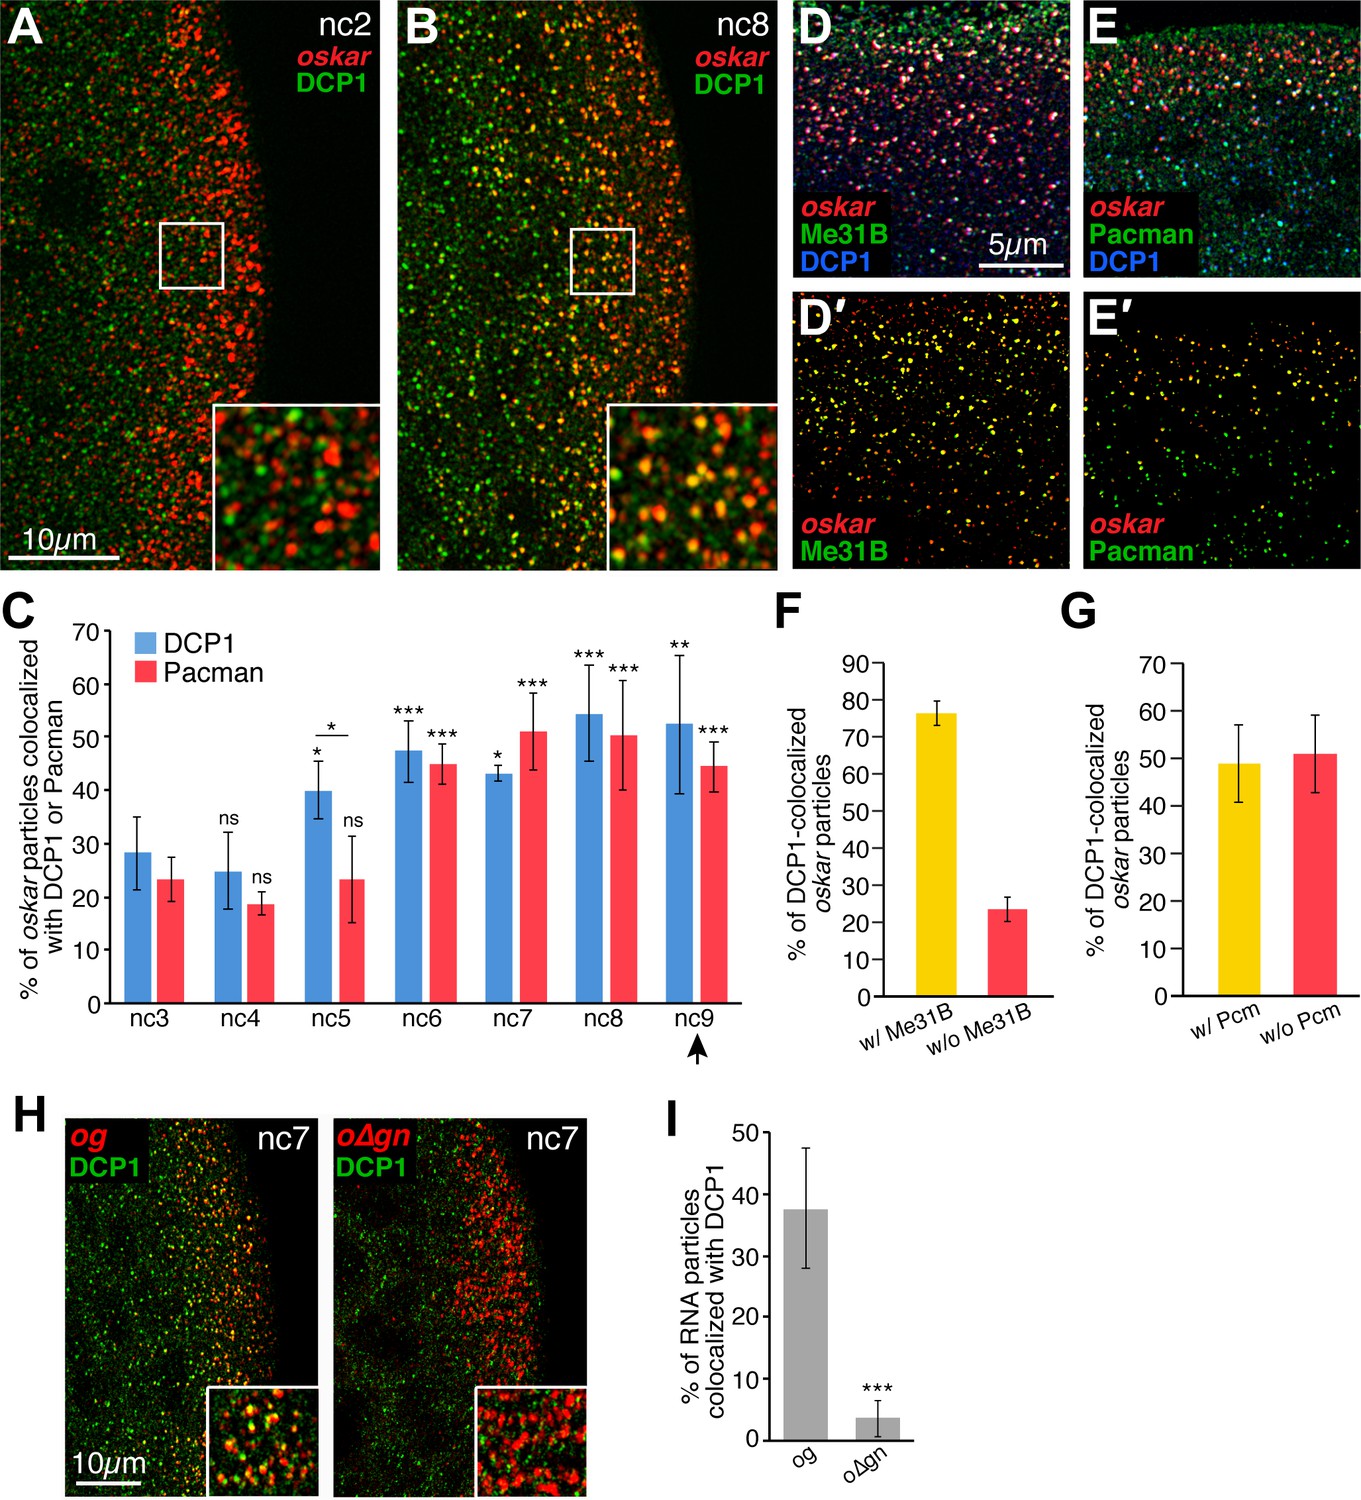
Founder granules associate with decapping and degradation factors in the germ plasm in advance of pole cell formation.
(A,B) Confocal z-series projections of the posterior of nc2 (A) and nc8 (B) embryos. Anti-DCP1 immunofluorescence (green) was performed together with FISH for oskar mRNA (red). Enlargements of the boxed germ plasm regions show colocalization of oskar and DCP1 in particles at nc8 but not at nc2. (C) Quantification of the proportion of oskar particles detected that also contain DCP1 (i.e., are colocalized with DCP1; blue) or Pacman (red) from nc3 to nc9; n = 5–8 embryos for each nc. Arrowhead indicates time of pole cell formation. (D,D',E,E') Confocal z-series projections showing oskar mRNA detected by FISH (red) together with DCP1 immunofluorescence (blue) and either direct Me31B-EGFP fluorescence (green; D,D') or Pacman immunofluorescence (green; E,E') in the germ plasm of nc7 embryos. Images in (D',E') are masked by the DCP1 channel so that only the oskar and either Me31B (D') or Pcm (E') fluorescence signals that overlap with the DCP1 fluorescence signals are visible. (F,G) Quantification of the proportion of oskar particles colocalized with DCP1 and Me31B (F) or DCP1 and Pacman (Pcm; G) as compared to the proportion colocalized only with DCP1 in the same images; n = 7 embryos each for Pacman, n = 5 embryos each for Me31B. (H) Confocal z-series projections of the posterior of og and o∆gn embryos at nc 7. Anti-DCP1 immunofluorescence (green) was performed together with FISH to detect sfgfp sequences (red). Enlargements of the boxed germ plasm regions show colocalization of DCP1 with og but not o∆gn RNA particles in the germ plasm. (I) Quantification of the proportion of og and o∆gn RNA particles detected that also contain DCP1; n = 8 embryos each. Values are mean ± s.d.; **p<0.01, ***p<0.001 as determined by Student's t-test. In (C) each DCP1 or Pacman is compared to the corresponding value at nc3. DCP1 and Pacman differ significantly at nc5 (p=0.001).
-
Figure 4—source data 1
Related to Figure 4C.
- https://cdn.elifesciences.org/articles/49988/elife-49988-fig4-data1-v2.xlsx
-
Figure 4—source data 2
Related to Figure 4F,G,I.
- https://cdn.elifesciences.org/articles/49988/elife-49988-fig4-data2-v2.xlsx
Figure 4—figure supplement 1
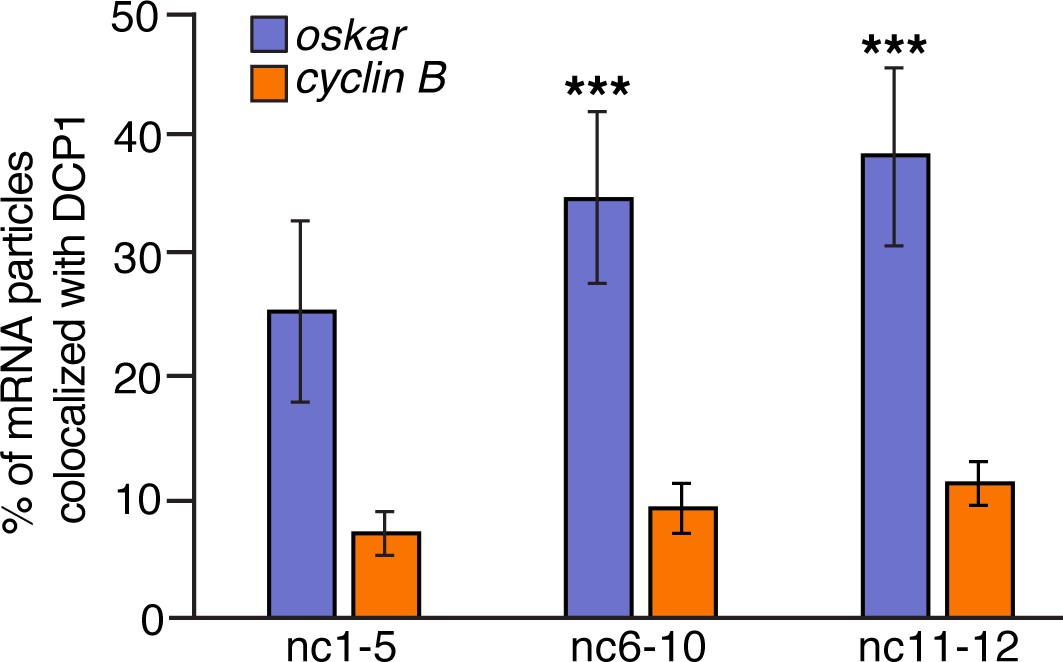
DCP1 colocalizes with oskar but not with germ granule mRNA.
Quantification of the proportion of oskar or cyclin B particles colocalized with DCP1 from nc2 to nc12 (n = 6–7 embryos each). ***p<0.001 as determined by Student's t-test.
-
Figure 4—figure supplement 1—source data 1
Related to Figure 4—figure supplement 1.
- https://cdn.elifesciences.org/articles/49988/elife-49988-fig4-figsupp1-data1-v2.xlsx
Figure 5

Founder granule disassembly follows oskar degradation.
(A) Quantification of total fluorescence intensity of oskar in the germ plasm from nc2 to nc12 normalized to the average intensity at nc2; n = 5–13 embryos for each nc. (B) Quantification of the average number of mRNAs per detected oskar particle from nc2 to nc12; n = 4–10 embryos for each nc. (C) Quantification of the average fluorescence intensity (size) of Staufen particles in the germ plasm from nc3 to nc12; n = 3–8 embryos for each nc. (D) Quantification of the proportion of detected Staufen particles colocalized with oskar from nc2 to nc12; n = 4–10 embryos for each nc. (E) Quantification of the proportion of detected oskar particles colocalized with Staufen from nc2 to nc12; n = 4–10 embryos for each nc. (F) Ratio of the average fluorescence intensities for 5' and 3' oskar probes measured particles of the indicated sizes in nc3-4 versus nc7-8 embryos (n = 10 embryos each time period). (G,H) Proportion of oskar particles in the germ plasm containing the indicated number of mRNAs that are colocalized with DCP1 (G) and proportion of all oskar particles in the germ plasm with the indicated number of mRNA (H); n = 6–9 embryos for each nc. Values in (A), (D), and (E) are mean ± s.d; values in (B,C,F) are mean ± s.e.m. Student's t-tests were performed comparing each nuclear cycle to nc2 (A,B,D,E), nc3 (C), and nc3-4 (F); *p<0.05, **p<0.01, ***p<0.001 as determined by Student's t-test. Arrowheads indicates time of pole cell formation.
-
Figure 5—source data 1
Related to Figure 5A,B.
- https://cdn.elifesciences.org/articles/49988/elife-49988-fig5-data1-v2.xlsx
-
Figure 5—source data 2
Related to Figure 5C–E.
- https://cdn.elifesciences.org/articles/49988/elife-49988-fig5-data2-v2.xlsx
-
Figure 5—source data 3
Related to Figure 5F.
- https://cdn.elifesciences.org/articles/49988/elife-49988-fig5-data3-v2.xlsx
-
Figure 5—source data 4
Related to Figure 5G,H.
- https://cdn.elifesciences.org/articles/49988/elife-49988-fig5-data4-v2.xlsx
Figure 6

oskar mRNA is degraded earlier in the germ plasm than in the bulk cytoplasm.
(A,B) Confocal z-series projections taken at posterior pole (germ plasm, A) or the middle region (bulk cytoplasm, B) of embryos at nc3, nc7, and nc12 with oskar mRNA detected by FISH. Images in (B) were captured with higher laser power than images in (A) in order to detect small oskar RNPs (see Materials and methods). (C) Quantification of oskar FISH fluorescence intensity per volume in the germ plasm and bulk cytoplasm from nc2 to nc12 normalized to the value at nc2. The first significant changes from nc2 in the germ plasm and bulk cytoplasm occur at nc7 and nc12, respectively; n = 5 embryos for each nc. (D) Confocal z-series projection encompassing both the bulk cytoplasm and germ plasm. Anti-DCP1 immunofluorescence (green) was performed together with FISH for oskar mRNA (red). Enlargements of the boxed regions show colocalization of oskar and DCP1 in the germ plasm but not in the bulk cytoplasm. (E) Quantification of the proportion of detected oskar particles colocalized with DCP1 in the bulk cytoplasm and in the germ plasm; n = 6–9 embryos for each nc. Values are mean ± s.d. Student's t-tests were performed comparing each nuclear cycle to nc2 for the same region of the embryo; *p<0.05, **p<0.01, ***p<0.001. Asterisks for bulk cytoplasm data points are positioned below the error bars for visibility. Arrowheads indicates time of pole cell formation.
-
Figure 6—source data 1
Related to Figure 6C.
- https://cdn.elifesciences.org/articles/49988/elife-49988-fig6-data1-v2.xlsx
-
Figure 6—source data 2
Related to Figure 6E.
- https://cdn.elifesciences.org/articles/49988/elife-49988-fig6-data2-v2.xlsx
Figure 7 with 1 supplement
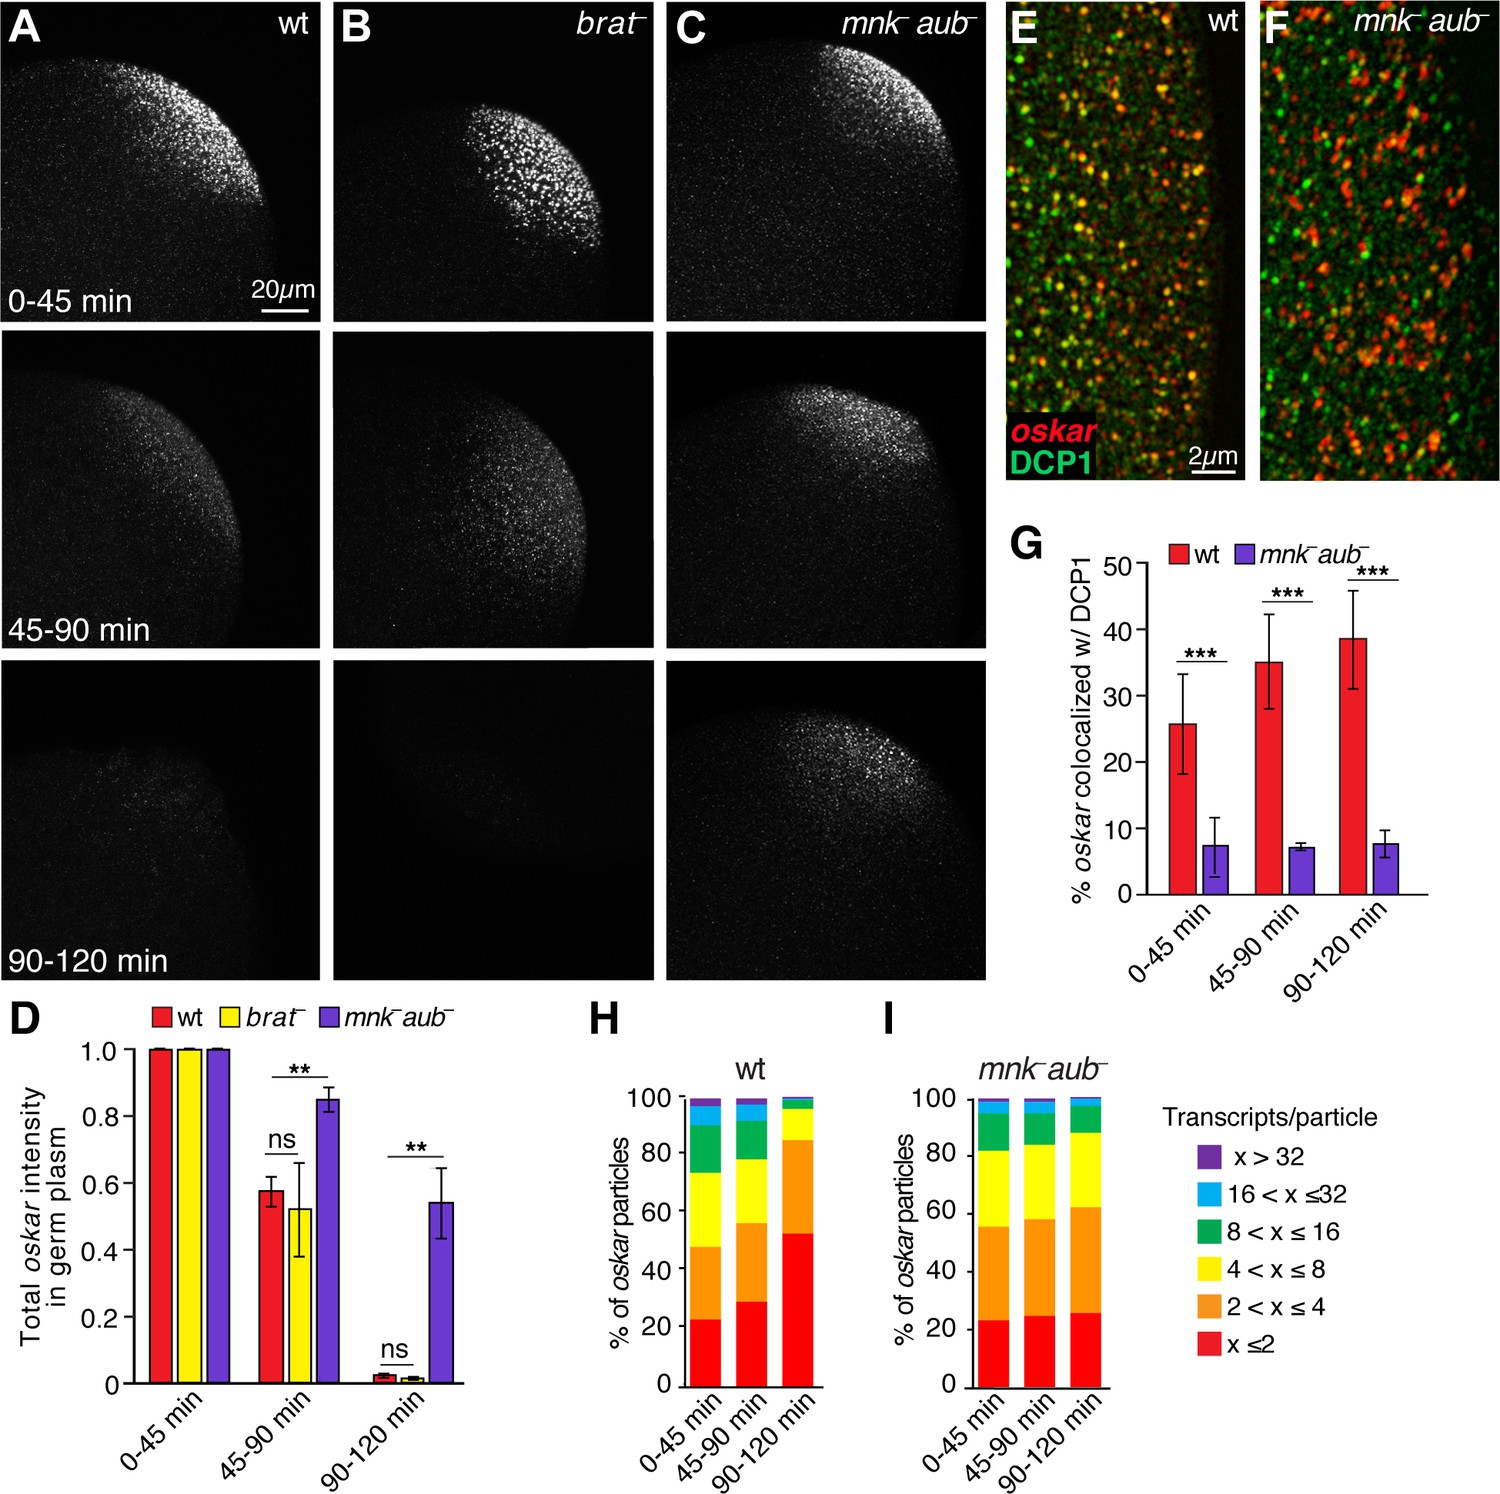
Aubergine is required for oskar degradation in the germ plasm.
(A–C) Confocal z-series projections of the germ plasm of wild-type (wt; A), brain tumor mutant (brat–; B), and aubergine mutant (mnk– aub–; C) embryos with oskar mRNA detected by FISH. The mnk mutation (in chk2) bypasses the indirect effect of aubergine mutants on oskar translation during oogenesis and consequent defects in oskar mRNA localization (Becalska et al., 2011; Klattenhoff et al., 2007); see Materials and methods). (D) Quantification of total oskar fluorescence intensity in the germ plasm in wt, mnk– aub– and brat–embryos. Three biological replicates were performed, each with n = 5–10 embryos per time period for wt; n = 3–7 embryos for mnk– aub–; n = 3–8 embryos for brat–. (E,F) Confocal z-series projections of a region of the germ plasm in age matched wt (E) and mnk– aub– (F) embryos; oskar detected by FISH (red) with anti-DCP1 immunofluorescence (green). (G) Quantification of colocalization of oskar and DCP1 in wt and mnk– aub– embryos (n = 5–44 embryos each time period). (H,I) Quantification of the proportion of detected oskar particles with the indicated number of mRNAs per particle number in the germ plasm of wt (H) and mnk– aub– (I) embryos; (n = 4–5 embryos each time period for mnk– aub–, n = 11–28 embryos for wt). Values are mean ± s.e.m., normalized to the value at 0–45 min for each genotype (D) and mean ± s.d. (G); *p<0.05, **p<0.01, ***p<0.001 as determined by Student's t-test.
-
Figure 7—source data 1
Related to Figure 7D.
- https://cdn.elifesciences.org/articles/49988/elife-49988-fig7-data1-v2.xlsx
-
Figure 7—source data 2
Related to Figure 7G.
- https://cdn.elifesciences.org/articles/49988/elife-49988-fig7-data2-v2.xlsx
-
Figure 7—source data 3
Related to Figure 7H,I.
- https://cdn.elifesciences.org/articles/49988/elife-49988-fig7-data3-v2.xlsx
Figure 7—figure supplement 1
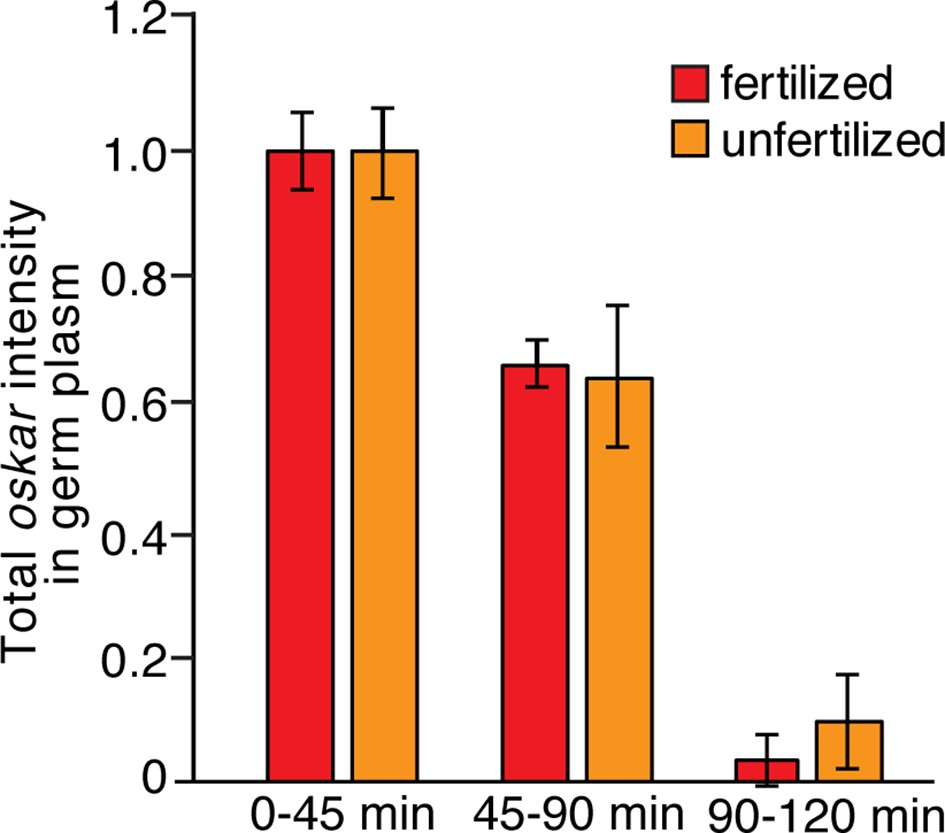
Comparison of oskar stability in fertilized and unfertilized embryos.
Quantification of average total oskar fluorescence intensity in the germ plasm in wild-type fertilized and unfertilized embryos (n = 3–10 embryos each). Values are mean ± s.d., normalized to the value at 0–45 min for each genotype.
-
Figure 7—figure supplement 1—source data 1
Related to Figure 7—figure supplement 1.
- https://cdn.elifesciences.org/articles/49988/elife-49988-fig7-figsupp1-data1-v2.xlsx
Figure 8
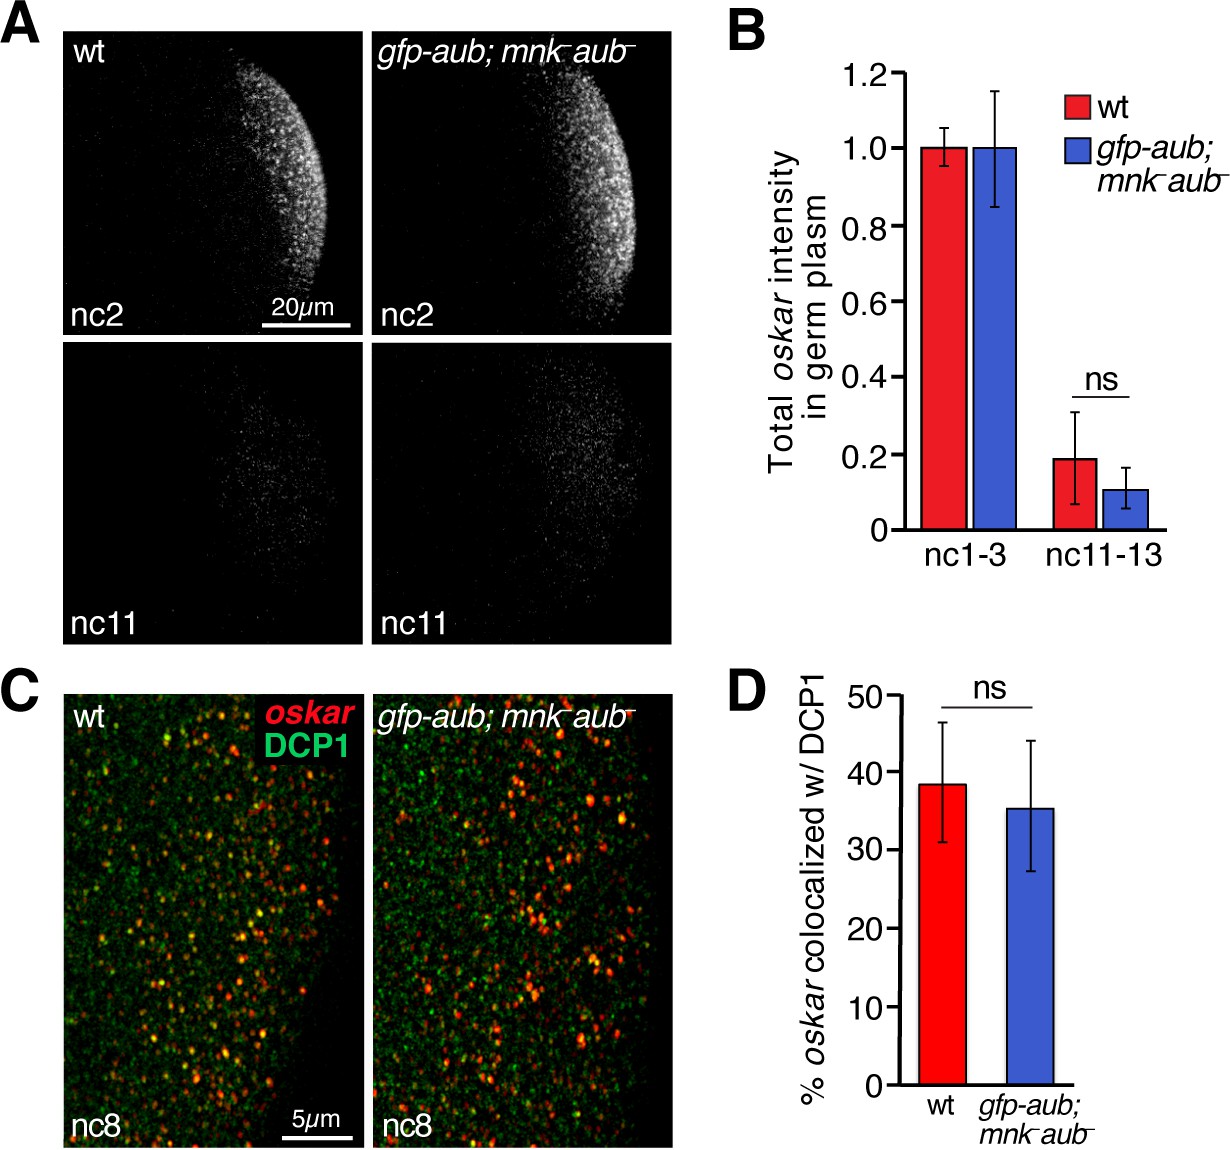
Rescue of oskar degradation and DCP1 recruitment by gfp-aub.
(A) Confocal z-series projections of the germ plasm of wild-type (wt) embryos and aubergine mutant embryos expressing gfp-aub (gfp-aub; mnk– aub–), with oskar mRNA detected by FISH. (B) Quantification of oskar fluorescence intensity in the germ plasm in wt and gfp-aub; mnk– aub– embryos (n = 7–11 embryos per time period). (C) Confocal z-series projections of a region of the germ plasm in age matched wt and gfp-aub; mnk– aub– embryos; oskar detected by FISH (red) with anti-DCP1 immunofluorescence (green). (D) Quantification of colocalization of oskar and DCP1 in wt and gfp-aub; mnk– aub– embryos (n = 5 embryos each). Values are mean ± s.d.; ***p<0.001 as determined by Student's t-test.
-
Figure 8—source data 1
Related to Figure 8B,D.
- https://cdn.elifesciences.org/articles/49988/elife-49988-fig8-data1-v2.xlsx
Videos
Video 1
Behavior of germ granules and founder granules prior to pole cell formation.
Time-lapse movie of germ granules labeled with Vasa-mCherry (green) and founder granules labeled with GFP-Staufen (red). The movie starts as nuclei have reached the posterior of the embryo and induce release of granules from the cortex. Embryo is oriented with the posterior toward the top of the frame. Images were captured at five frames/second for a total of 600 frames and the movie is shown at 100 frames/second.
Additional files
Download links
A two-part list of links to download the article, or parts of the article, in various formats.
Downloads (link to download the article as PDF)
Open citations (links to open the citations from this article in various online reference manager services)
Cite this article (links to download the citations from this article in formats compatible with various reference manager tools)
Compartmentalized oskar degradation in the germ plasm safeguards germline development
eLife 9:e49988.
https://doi.org/10.7554/eLife.49988


