Transcriptional adaptation in Caenorhabditis elegans
- Max Planck Institute for Heart and Lung Research, Germany
- Goethe University, Germany
- University of Würzburg, Germany
Figures
Figure 1 with 3 supplements
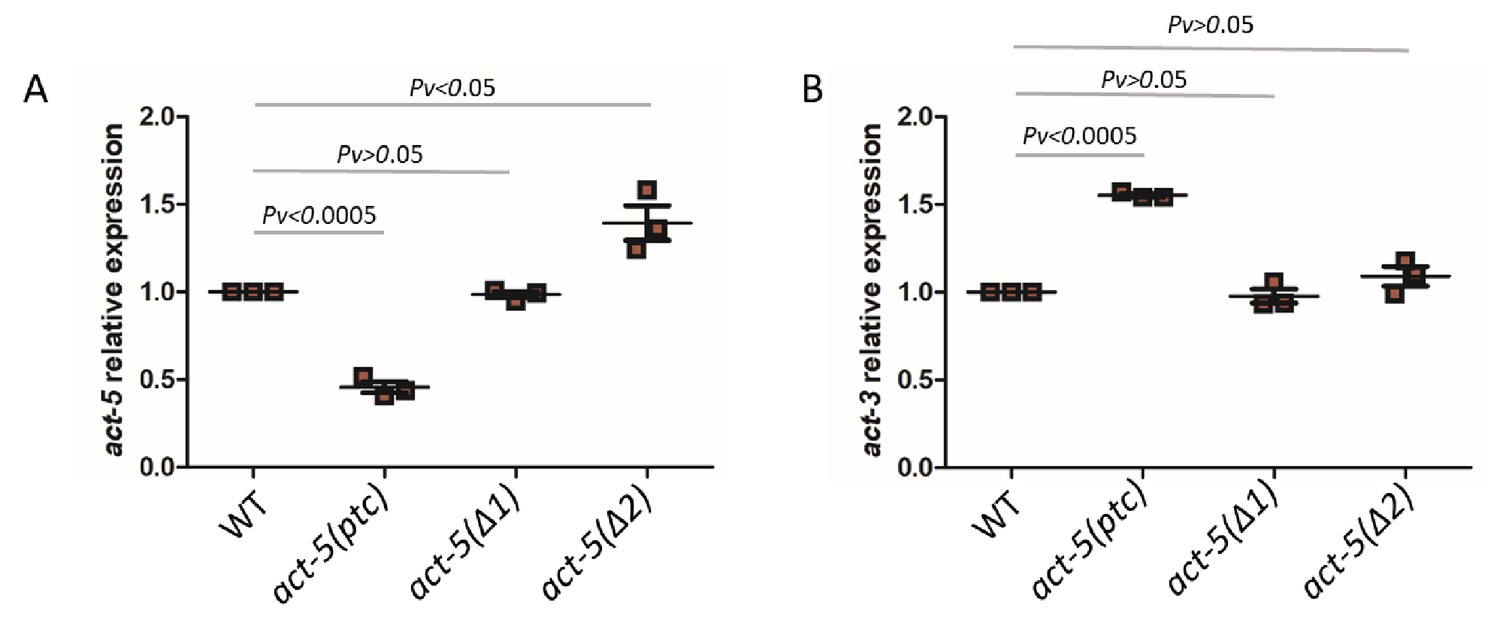
mRNA levels of act-5 and act-3 in WT and mutant alleles.
qPCR analysis of act-5 (A) and act-3 (B) mRNA levels in WT and act-5(ptc), act-5(Δ1), and act-5(Δ2) mutants. act-3 mRNA levels are upregulated when act-5 mutant mRNA levels are reduced (i.e., only in the act-5(ptc) allele). WT expression levels are set at 1. Data are mean ± S.E.M.; average dCt values are shown in Figure 1—source data 1. Two-tailed Student’s t-test was used to calculate P values.
-
Figure 1—source data 1
Average dCt values from qPCR analysis of act-5 and act-3 mRNA levels in WT and act-5 mutants.
- https://cdn.elifesciences.org/articles/50014/elife-50014-fig1-data1-v1.pdf
-
Figure 1—source data 2
Average dCt values from qPCR analysis of act-1, act-2 and act-4 mRNA levels in WT and act-5(ptc) mutants.
- https://cdn.elifesciences.org/articles/50014/elife-50014-fig1-data2-v1.pdf
Figure 1—figure supplement 1

Organization of act-5 locus.
(A) Schematic of all known act-5 isoforms and alleles used in this study. Black boxes indicate the deletion and nonsense alleles used in this study; black arrows point to the position of the qPCR primers. The act-5(ok1397) isoform was only identified in the act-5(Δ2) allele. (B) Partial sequence of act-5 (WT, ptc and Δ1 alleles). The PTC in the act-5(ptc) allele is 264 nucleotides from the next exon-intron junction and 888 nucleotides from the stop codon. Red indicates the mutation; PTC is underlined; ‘nnn’ and ‘---’ indicate deleted nucleotides in the act-5(Δ1) allele. The dt2017 deletion leads to a PTC which is located in the last exon (153 bases from the stop codon) and is thus predicted not to trigger NMD (Kashima et al., 2010; Lindeboom et al., 2016). act-5(dt2019) = act-5(ptc); act-5(dt2017) = act-5(Δ1); act-5(ok1397) = act-5(Δ2).
Figure 1—figure supplement 2
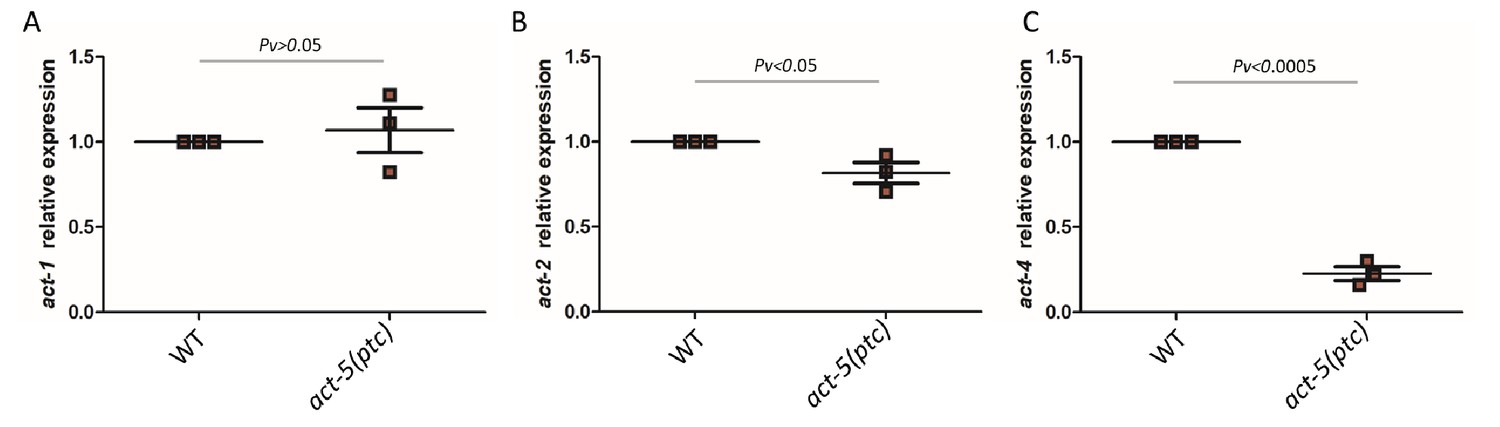
mRNA levels of act-1 (A), act-2 (B) and act-4 (C) in WT and act-5(ptc) mutants.
WT expression levels are set at 1. Data are mean ± S.E.M.; average dCt values are shown in Figure 1—source data 2. Two-tailed Student’s t-test was used to calculate P values.
Figure 1—figure supplement 3
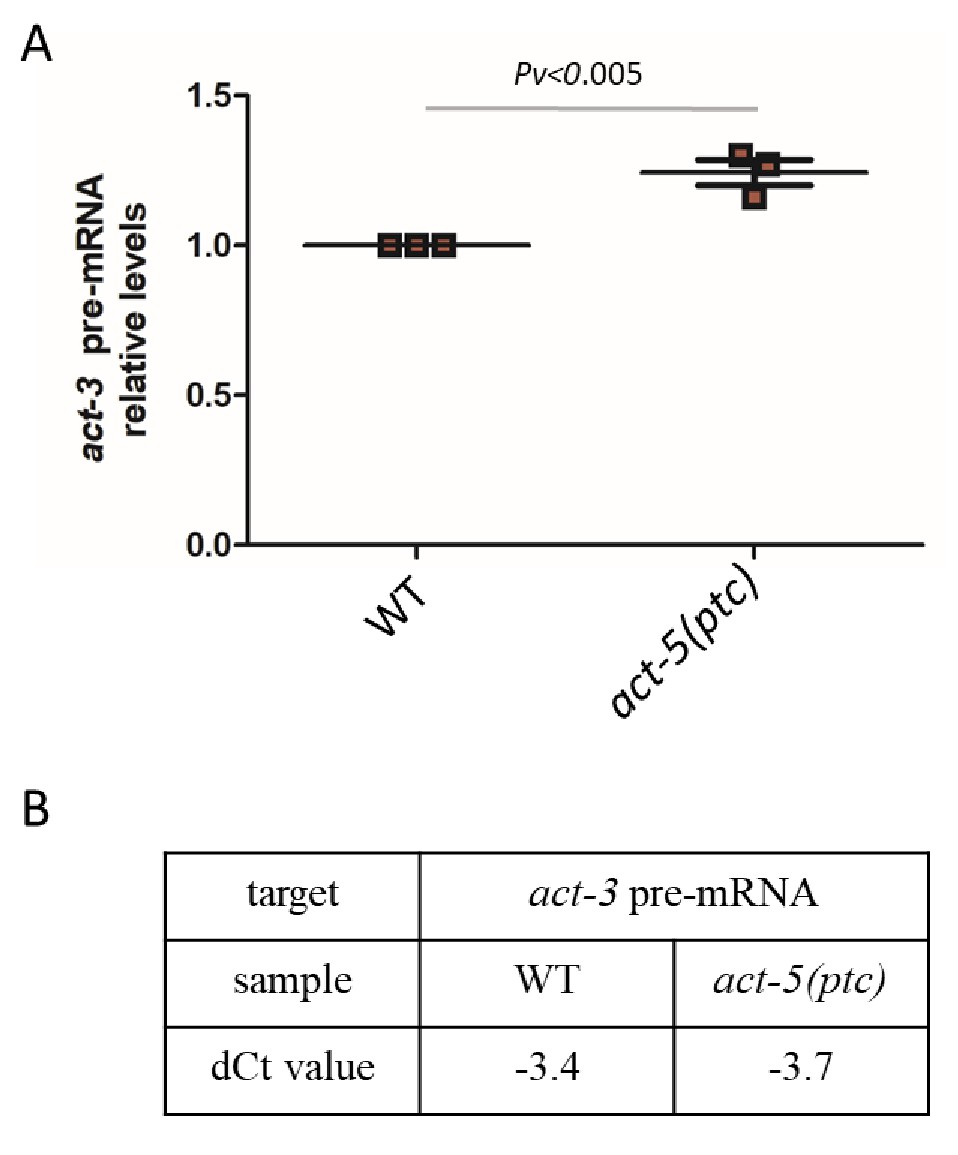
Pre-mRNA levels of act-3 in WT and act-5(ptc) mutants.
(A) qPCR analysis of act-3 pre-mRNA levels in WT and act-5(ptc) mutants. (B) Average dCt values from qPCR analysis of act-3 pre-mRNA levels in WT and act-5(ptc) mutants. WT expression levels are set at 1. Data are mean ± S.E.M.. Two-tailed Student’s t-test was used to calculate P values.
Figure 2 with 1 supplement
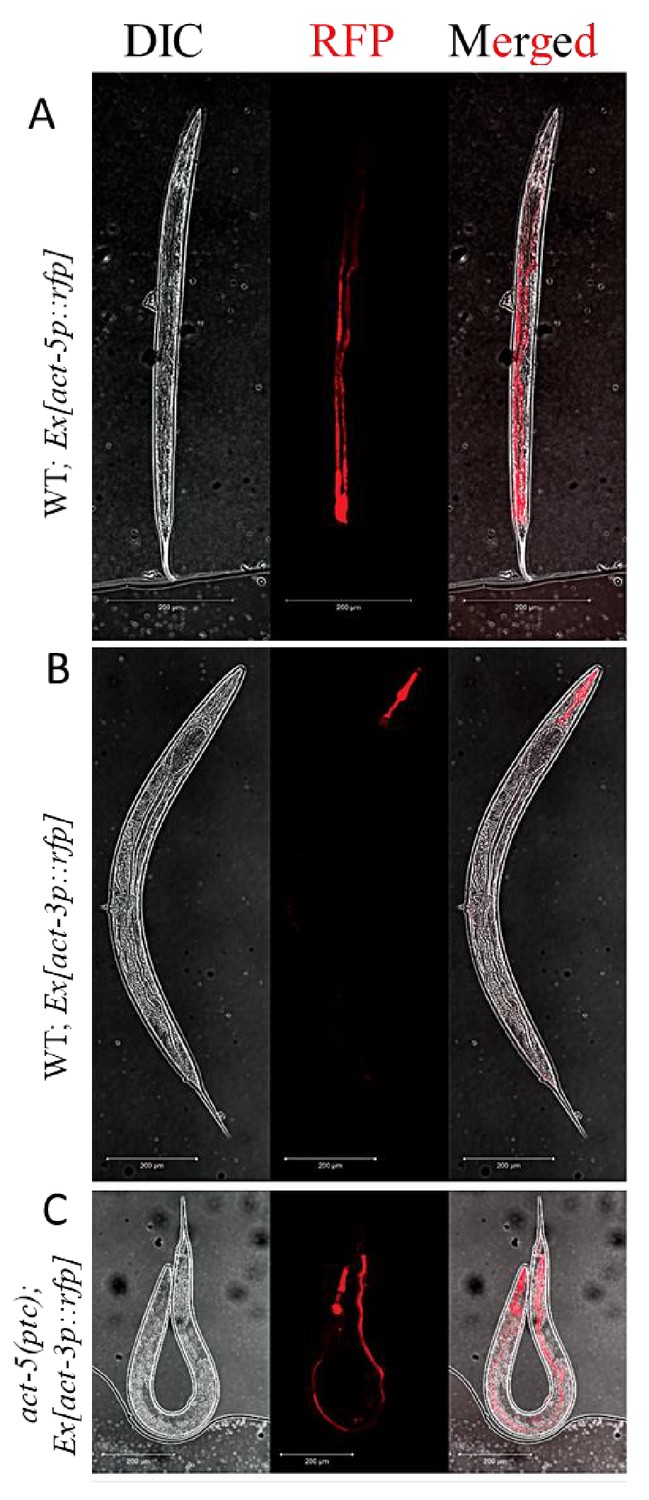
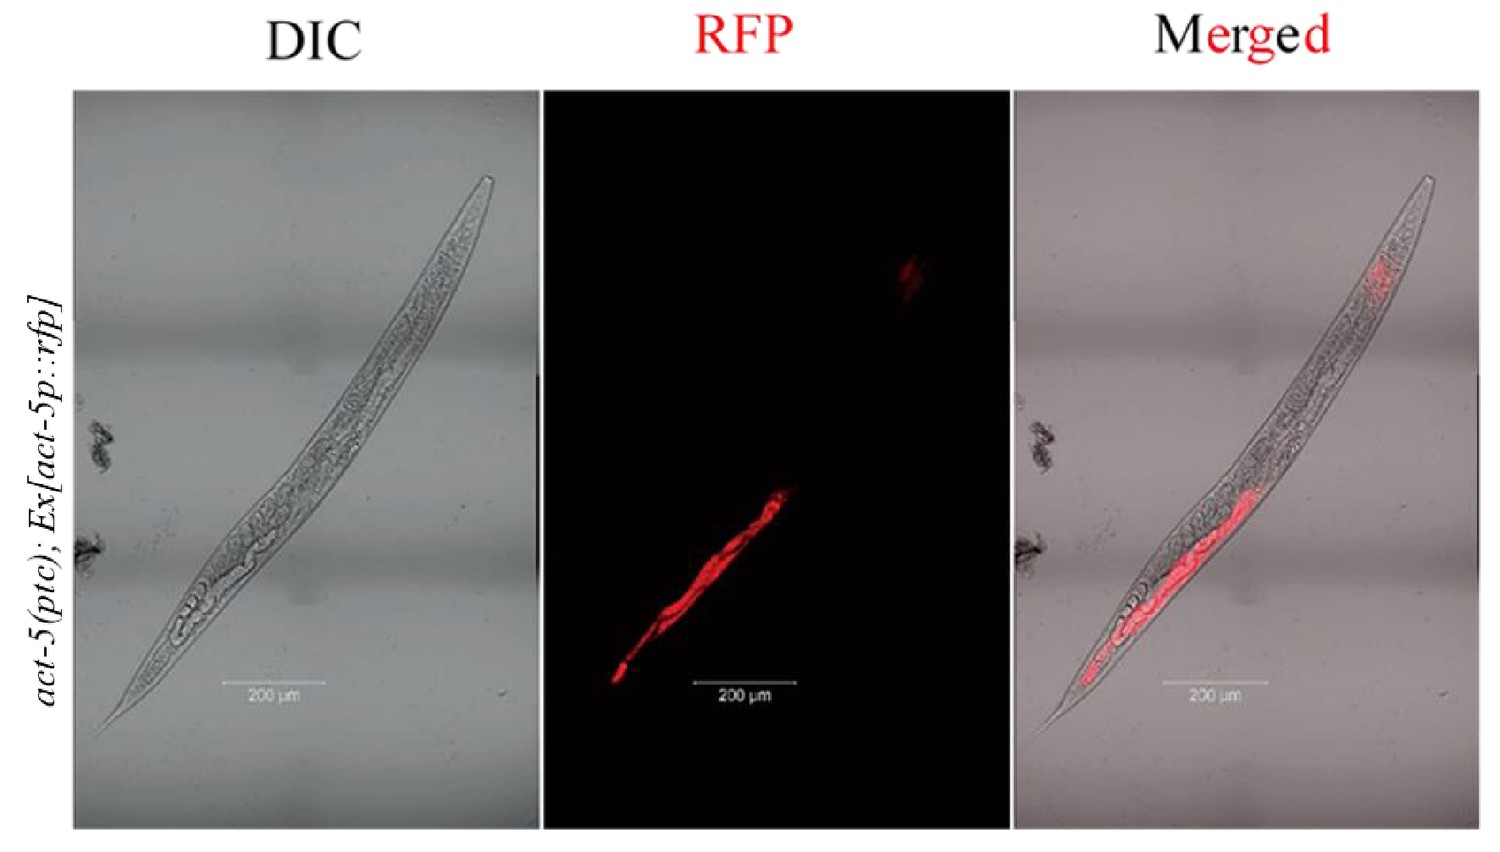
Extrachromosomal reporter expression in WT and mutant alleles.
(A) act-5p::rfp extrachromosomal reporter expression was observed in the intestine in 153 of 300 WT animals. (B) act-3p::rfp extrachromosomal reporter expression was observed in the pharynx in 182 of 400 WT animals. (C) act-3p::rfp extrachromosomal reporter expression was observed in the pharynx and intestine in 138 of 320 act-5(ptc) mutants.
Figure 2—figure supplement 1
act-5p::rfp extrachromosomal reporter expression.
act-5p::rfp extrachromosomal reporter expression was observed in the pharynx and intestine in 148 of 300 act-5(ptc) mutants.
Figure 3 with 3 supplements
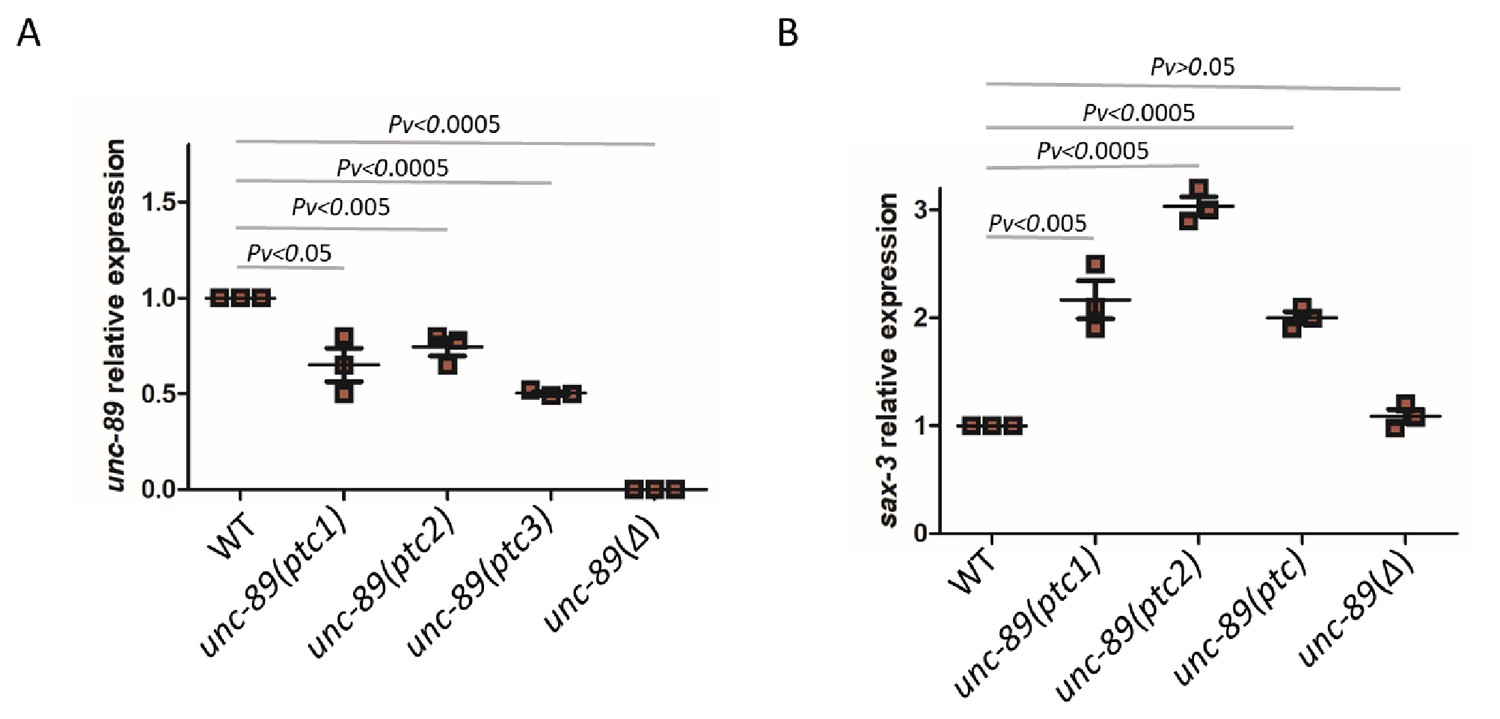
mRNA levels of unc-89 and sax-3 in WT and mutant alleles.
qPCR analysis of unc-89 (C) and sax-3 (D) mRNA levels in WT and unc-89(ptc1), unc-89(ptc2), unc-89(ptc3), and unc-89(Δ) mutants. sax-3 mRNA levels in unc-89 alleles are upregulated when unc-89 mutant mRNA levels are reduced, except in the deletion allele. WT expression levels are set at 1. Data are mean ± S.E.M.; average dCt values are shown in Figure 3—source data 2. Two-tailed Student’s t-test was used to calculate P values.
-
Figure 3—source data 1
List of ttn-1 paralogous genes based on WormBase release WS266.
- https://cdn.elifesciences.org/articles/50014/elife-50014-fig3-data1-v1.pdf
-
Figure 3—source data 2
Average dCt values from qPCR analysis of unc-89 and sax-3 mRNA levels in WT and unc-89 mutants.
- https://cdn.elifesciences.org/articles/50014/elife-50014-fig3-data2-v1.pdf
-
Figure 3—source data 3
Distance, in nucleotides, from each PTC to the next exon-intron junction and to the stop codon in each unc-89 isoform in the unc-89(ptc1), unc-89(ptc2), and unc-89(ptc3) alleles.
‘-’ indicates the absence of the PTC from the isoform.
- https://cdn.elifesciences.org/articles/50014/elife-50014-fig3-data3-v1.pdf
Figure 3—figure supplement 1
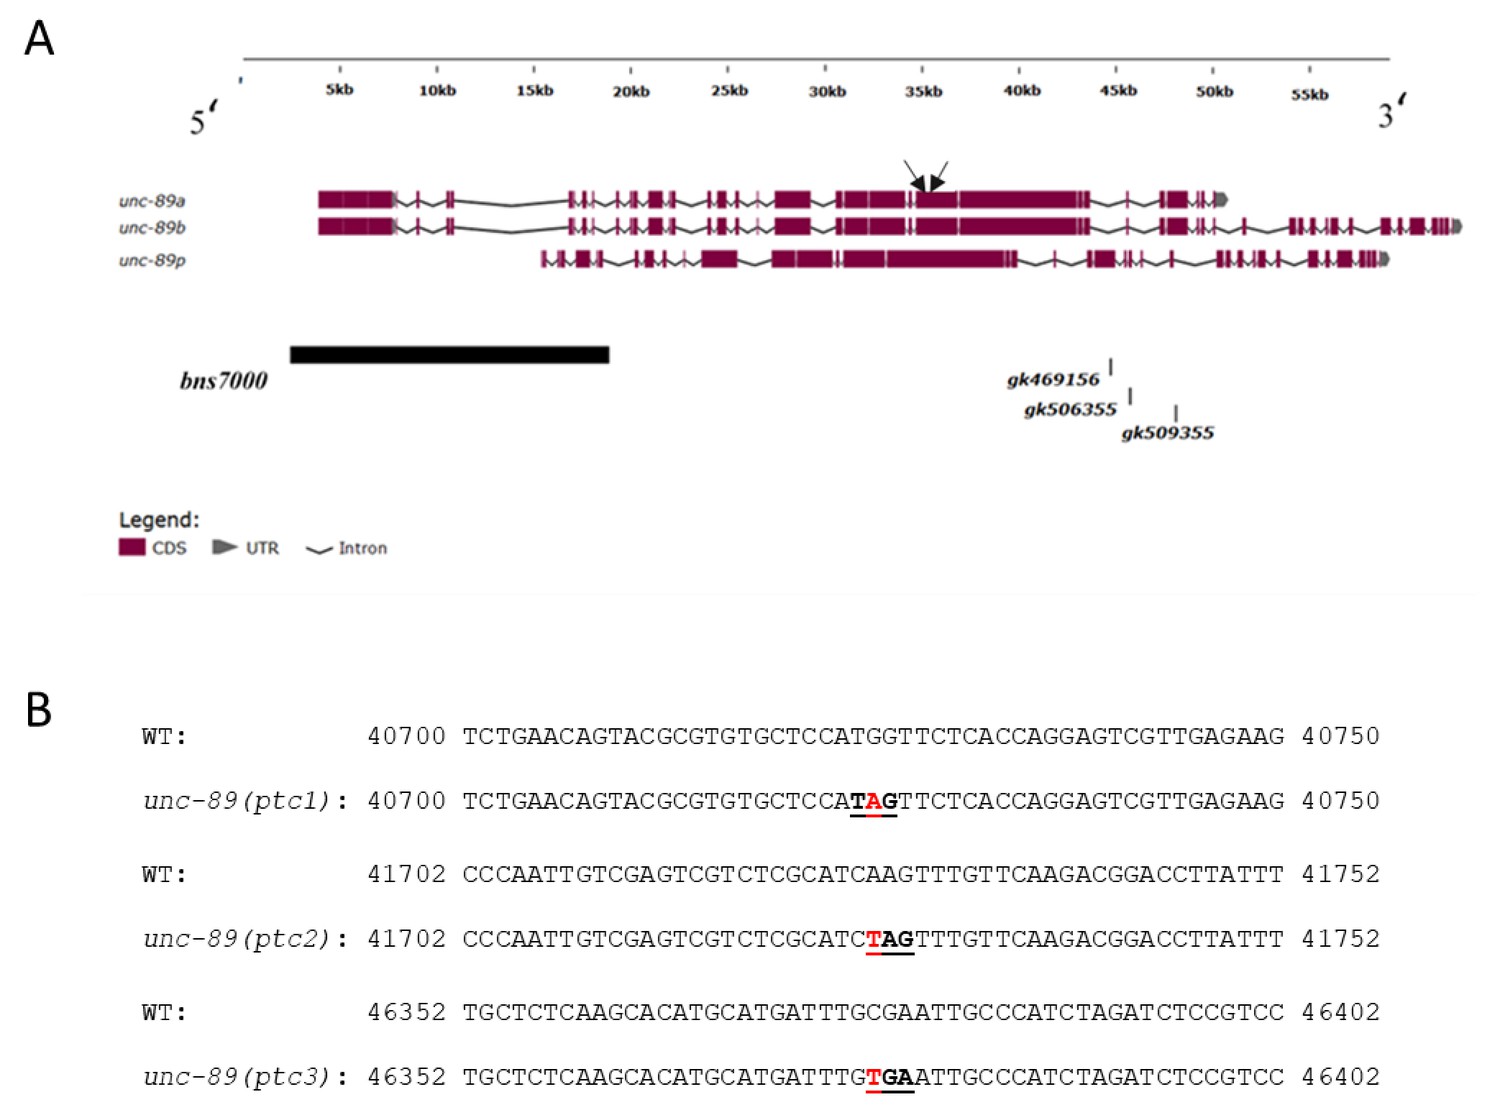
Organization of unc-89 locus.
Schematic of a subset of the 16 known unc-89 isoforms as well as the deletion and nonsense alleles used in this study (black boxes). Black arrows point to the position of the qPCR primers. (B) Partial sequence of the longest unc-89 isoform with the single nucleotide change causing PTCs. Red indicates the mutations; PTCs are underlined. The distance from each PTC to the next exon-intron junction and to the stop codon is shown in Figure 3—source data 3. unc-89 (gk469156) = unc-89(ptc1); unc-89 (gk506355) = unc-89(ptc2); unc-89 (gk509355) = unc-89(ptc3); unc-89(bns7000) = unc-89(Δ).
Figure 3—figure supplement 2
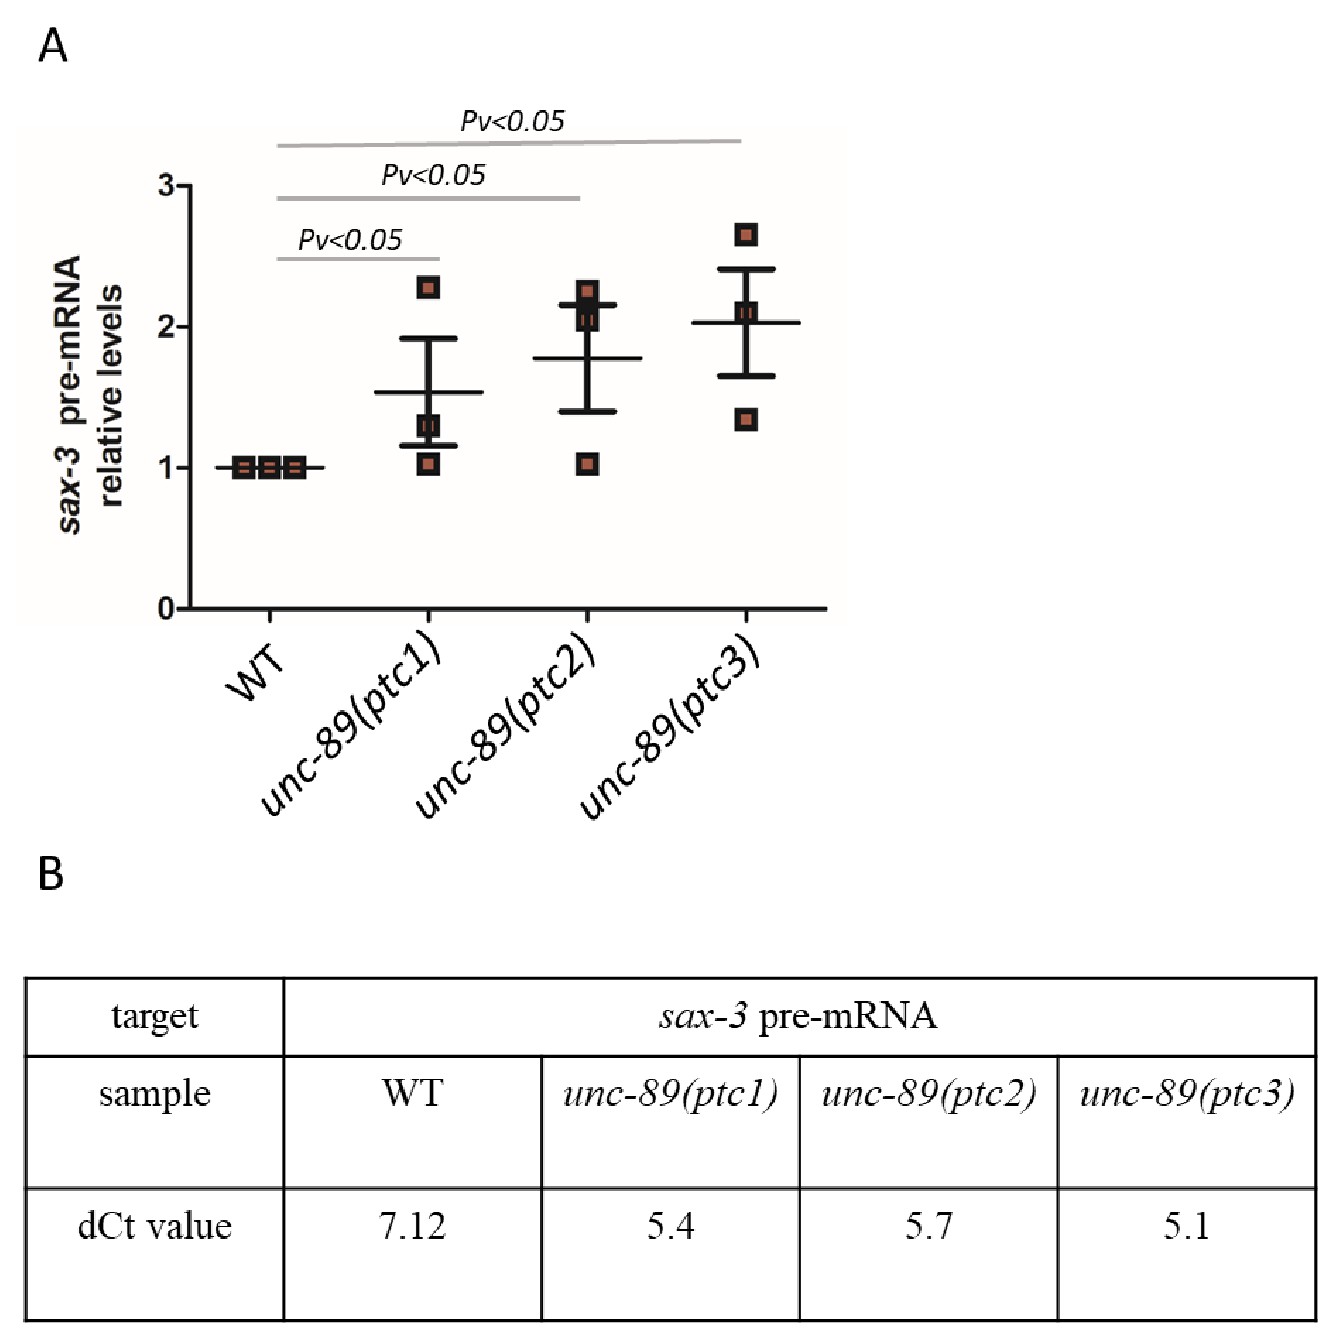
Pre-mRNA levels of sax-3 in WT and unc-89(ptc1), unc-89(ptc2), unc-89(ptc3) mutants.
(A) qPCR analysis of sax-3 pre-mRNA levels in WT and unc-89(ptc1), unc-89(ptc2), unc-89(ptc3) mutants. (B) Average dCt values from qPCR analysis of sax-3 pre-mRNA levels in WT and unc-89(ptc1), unc-89(ptc2), unc-89(ptc3) mutants. WT expression levels are set at 1. Data are mean ± S.E.M.. Two-tailed Student’s t-test was used to calculate P values.
Figure 3—figure supplement 3
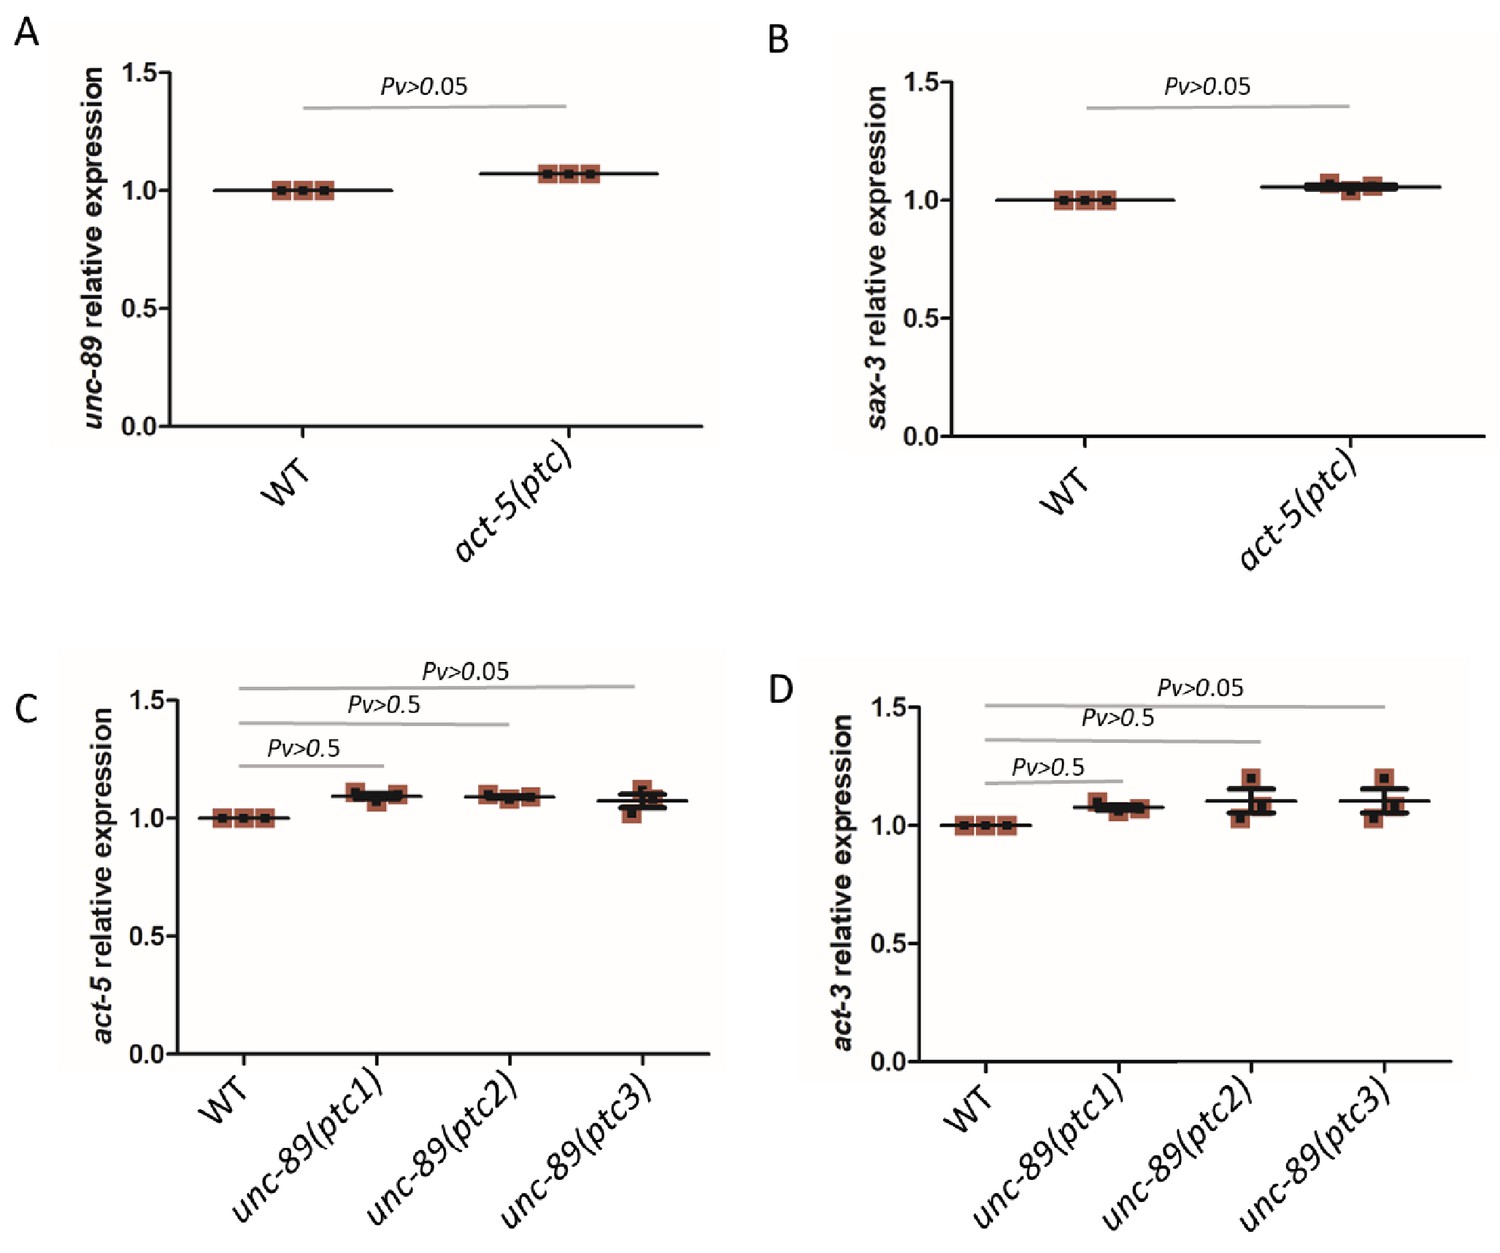
mRNA levels in WT and mutant alleles.
qPCR analysis of unc-89 (A) and sax-3 (B) mRNA levels in WT and act-5(ptc) mutants as well as of act-5 (C) and act-3 (D) in WT and unc-89(ptc1), unc-89(ptc2) and unc-89(ptc3) mutants. WT expression levels are set at 1. Data are mean ± S.E.M.; Two-tailed Student’s t-test was used to calculate P values.
Figure 4 with 3 supplements
Factors regulating transcriptional adaptation identified in RNAi-mediated knockdown screen.
-
Figure 4—source data 1
List of genes and RNAi clones tested in the screen; average dCt values of qPCR analyses of act-5 and act-3 mRNA levels in WT and act-5 mutants as well as of unc-89 and sax-3 mRNA levels in WT and unc-89 mutants.
- https://cdn.elifesciences.org/articles/50014/elife-50014-fig4-data1-v1.xlsx
Figure 4—figure supplement 1
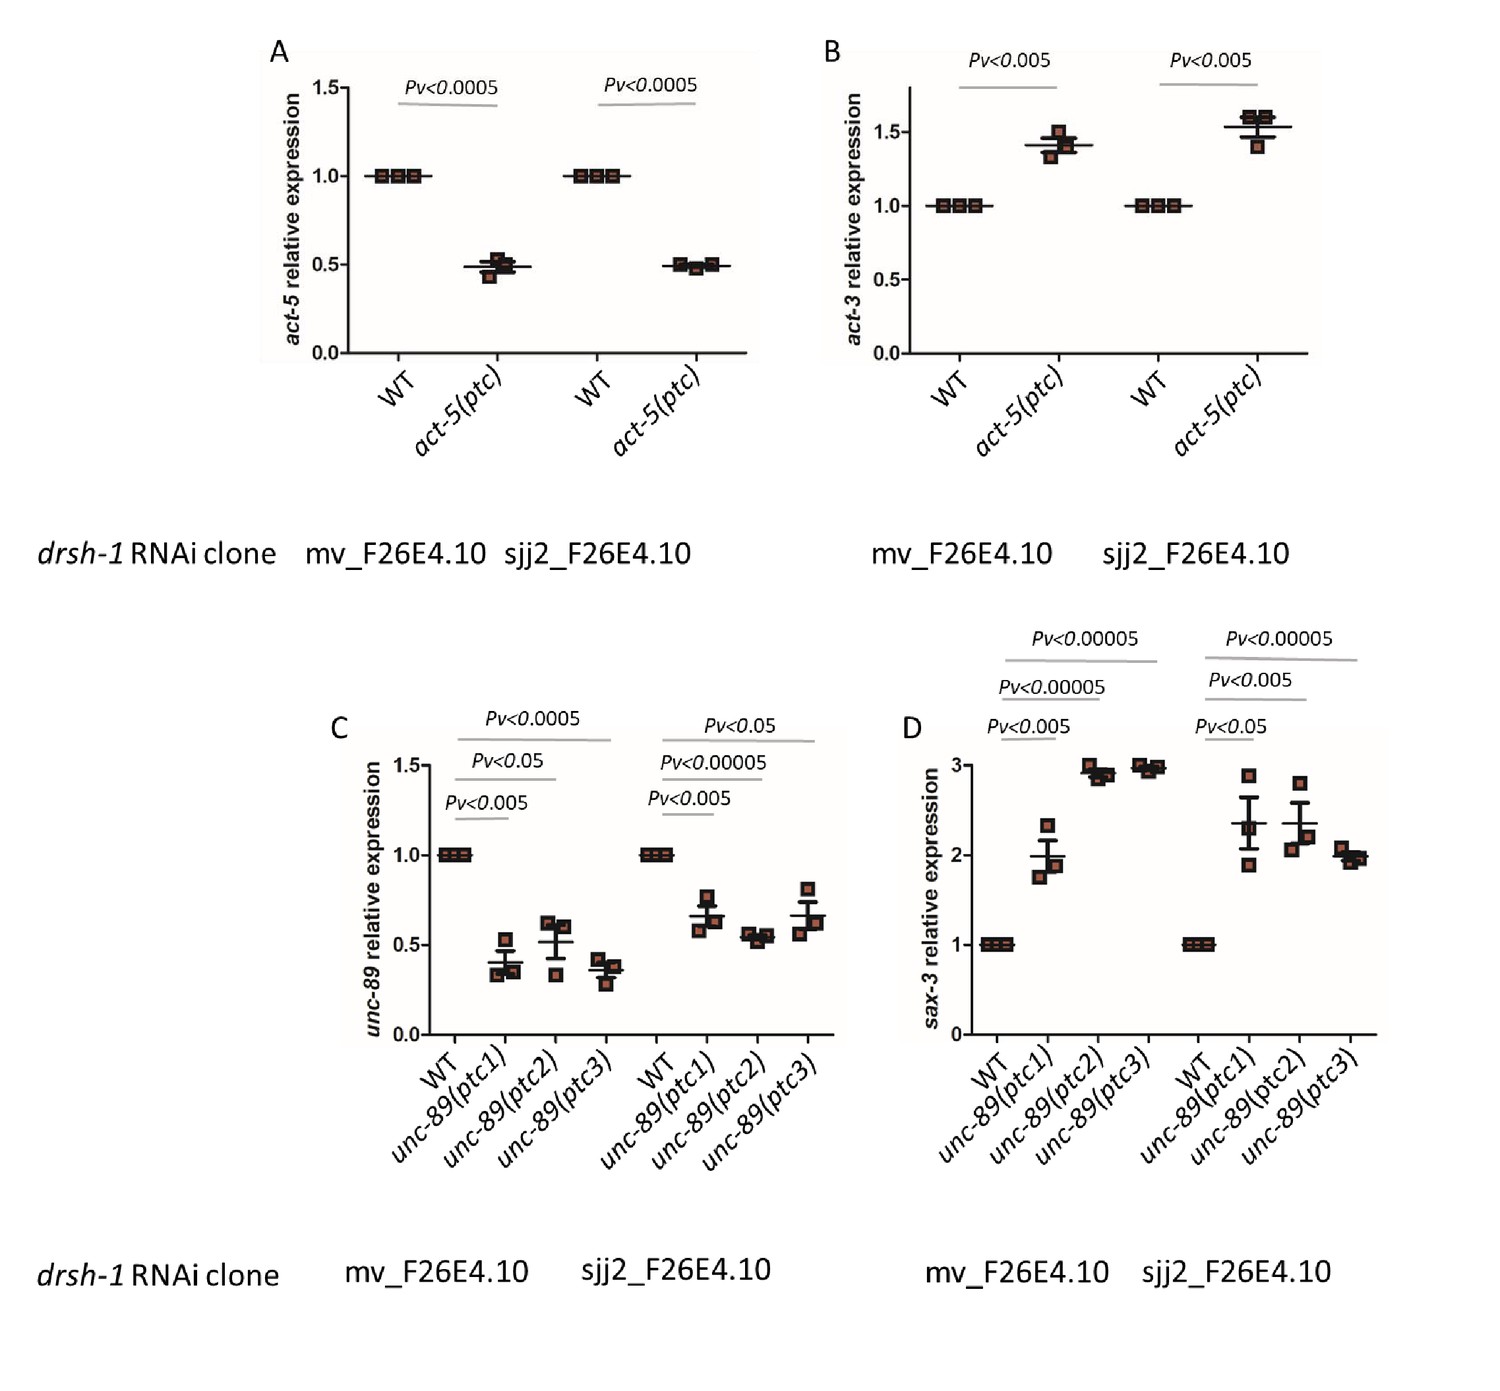
qPCR analysis of act-5 (A) and act-3 (B) mRNA levels in WT and act-5(ptc) mutants as well as of unc-89 (C) and sax-3 (D) mRNA levels in WT and unc-89(ptc) mutants upon drsh-1 RNAi-mediated knockdown by two independent clones.
WT expression levels are set at 1. Data are mean ± S.E.M.; average dCt values are shown in Figure 4—source data 1. Two-tailed Student’s t-test was used to calculate P values.
Figure 4—figure supplement 2
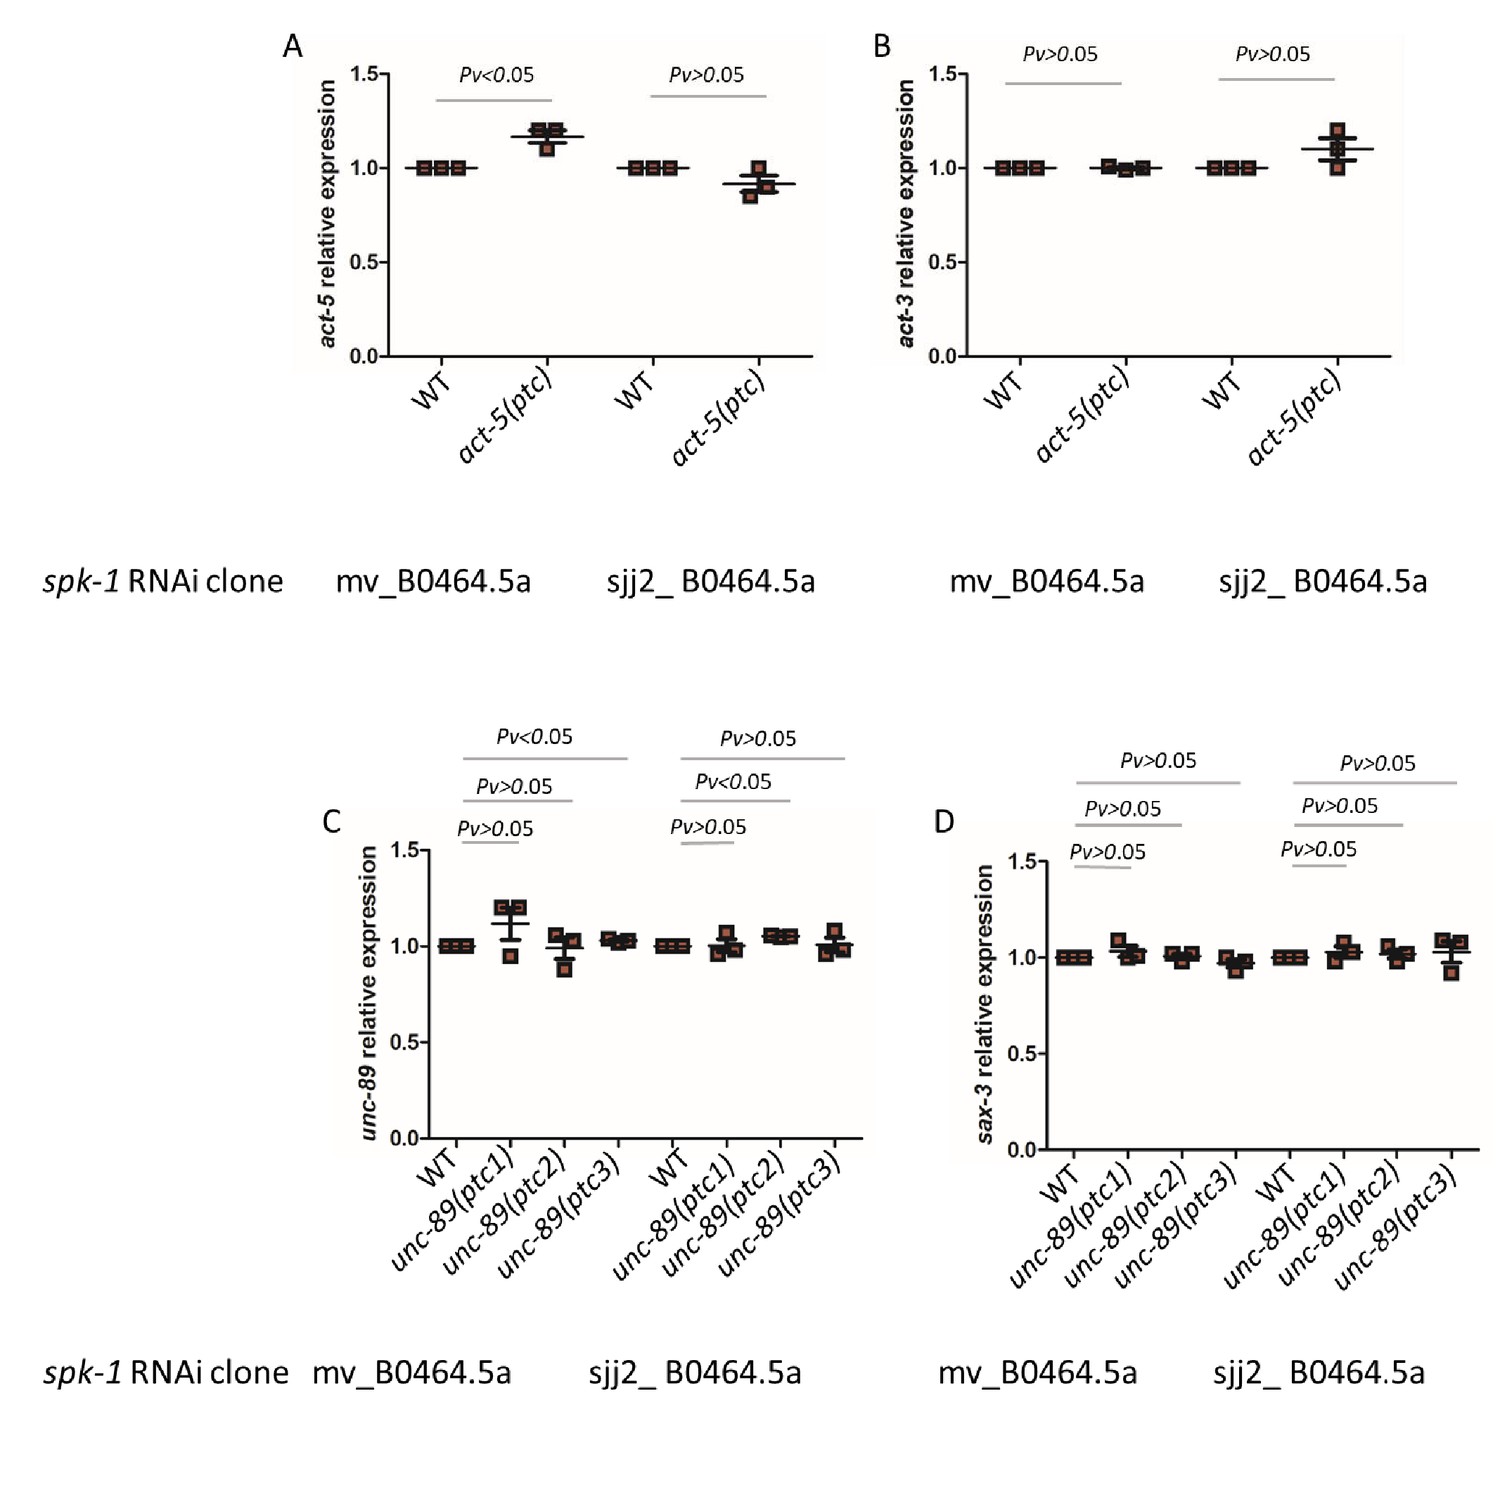
qPCR analysis of act-5 (A) and act-3 (B) mRNA levels in WT and act-5(ptc) mutants as well as of unc-89 (C) and sax-3 (D) mRNA levels in WT and unc-89(ptc) mutants upon spk-1 RNAi-mediated knockdown by two independent clones.
WT expression levels are set at 1. Data are mean ± S.E.M.; average dCt values are shown in Figure 4—source data 1. Two-tailed Student’s t-test was used to calculate P values.
Figure 4—figure supplement 3

qPCR analysis of act-5 (A) and act-3 (B) mRNA levels in WT and act-5(ptc) mutants as well as of unc-89 (C) and sax-3 (D) mRNA levels in WT and unc-89(ptc) mutants upon nrde-3 RNAi-mediated knockdown by two independent clones.
WT expression levels are set at 1. Data are mean ± S.E.M.; average dCt values are shown in Figure 4—source data 1. Two-tailed Student’s t-test was used to calculate P values.
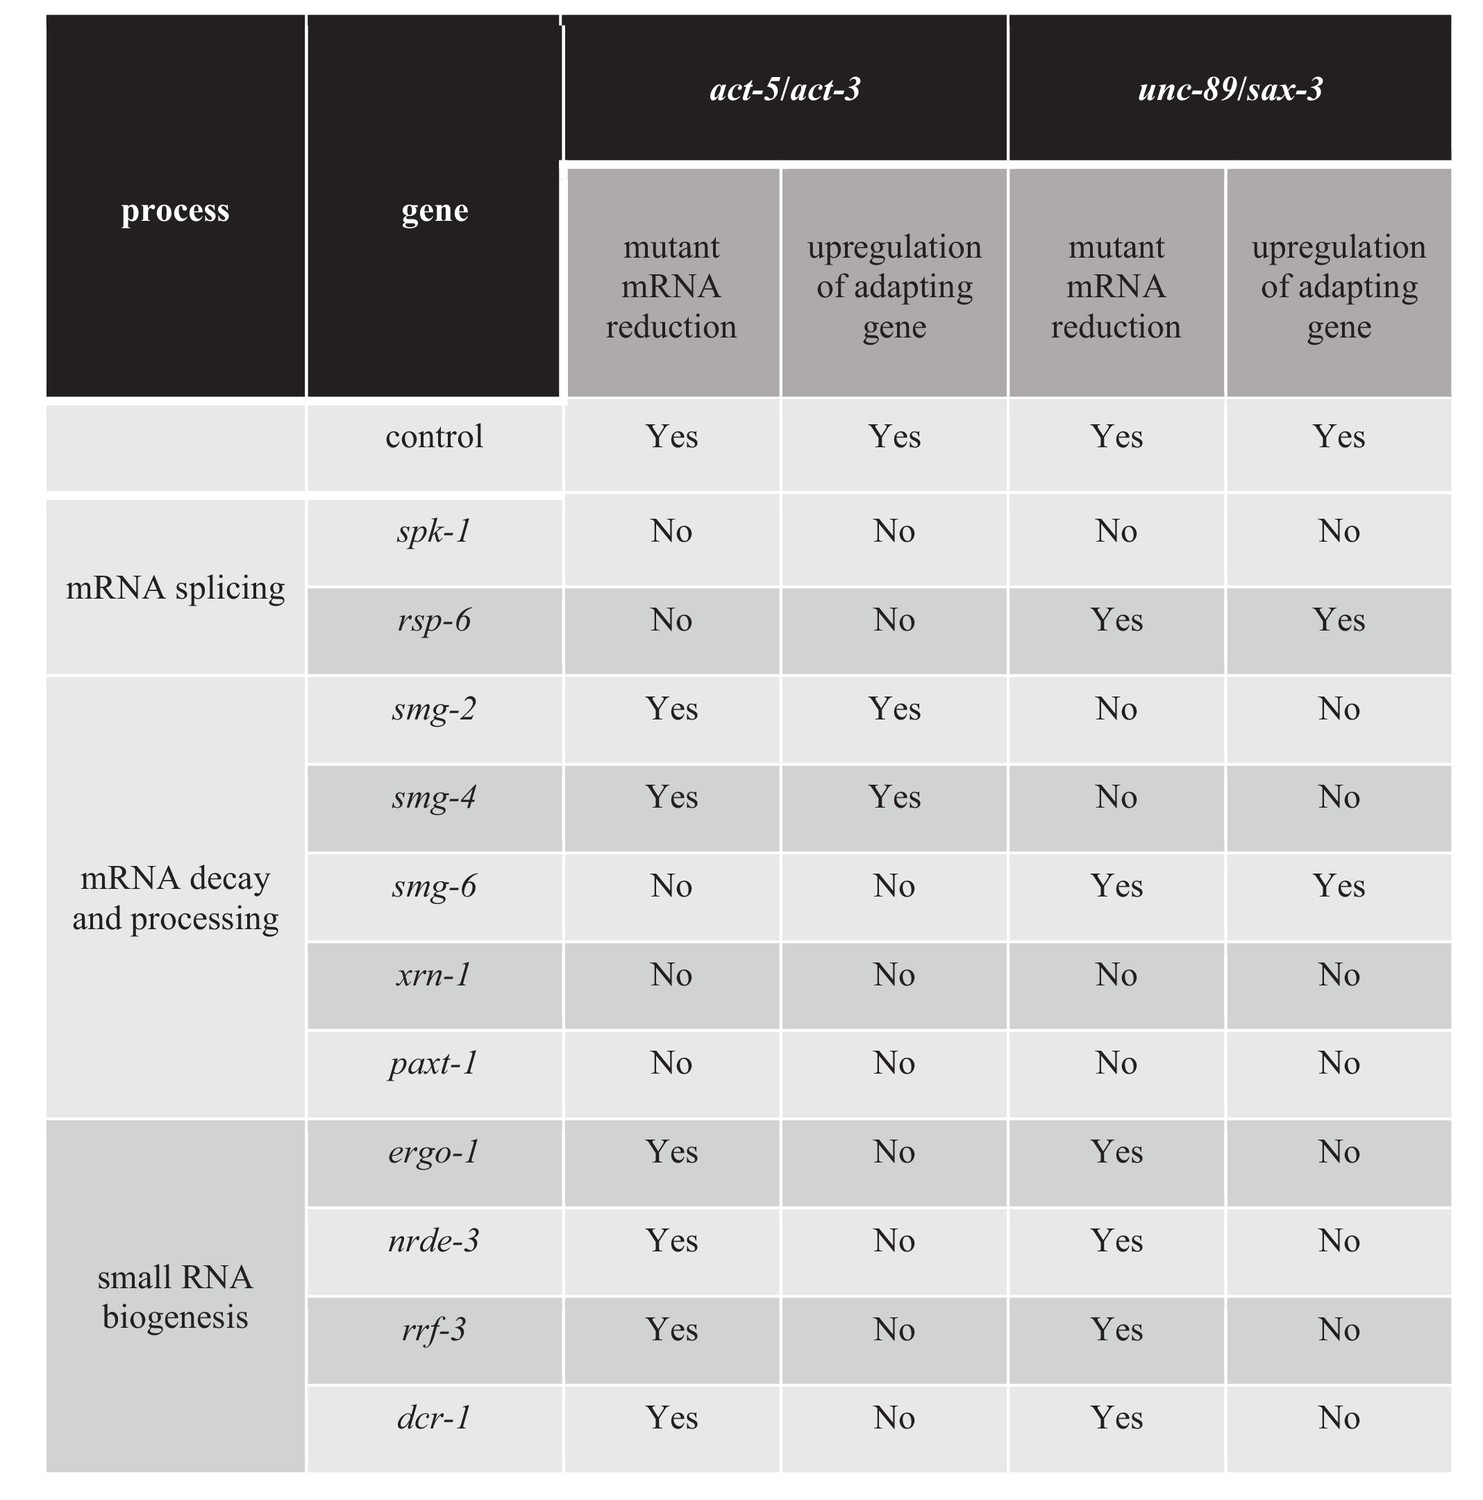
Figure 5 with 1 supplement

Factors regulating transcriptional adaptation analyzed in double mutants.
-
Figure 5—source data 1
List of genes and alleles for each gene tested in the double mutant analysis; average dCt values from qPCR analyses of act-5 and act-3 mRNA levels in WT and act-5 mutants as well as of unc-89 and sax-3 mRNA levels in WT and unc-89 mutants.
- https://cdn.elifesciences.org/articles/50014/elife-50014-fig5-data1-v1.xlsx
Figure 5—figure supplement 1
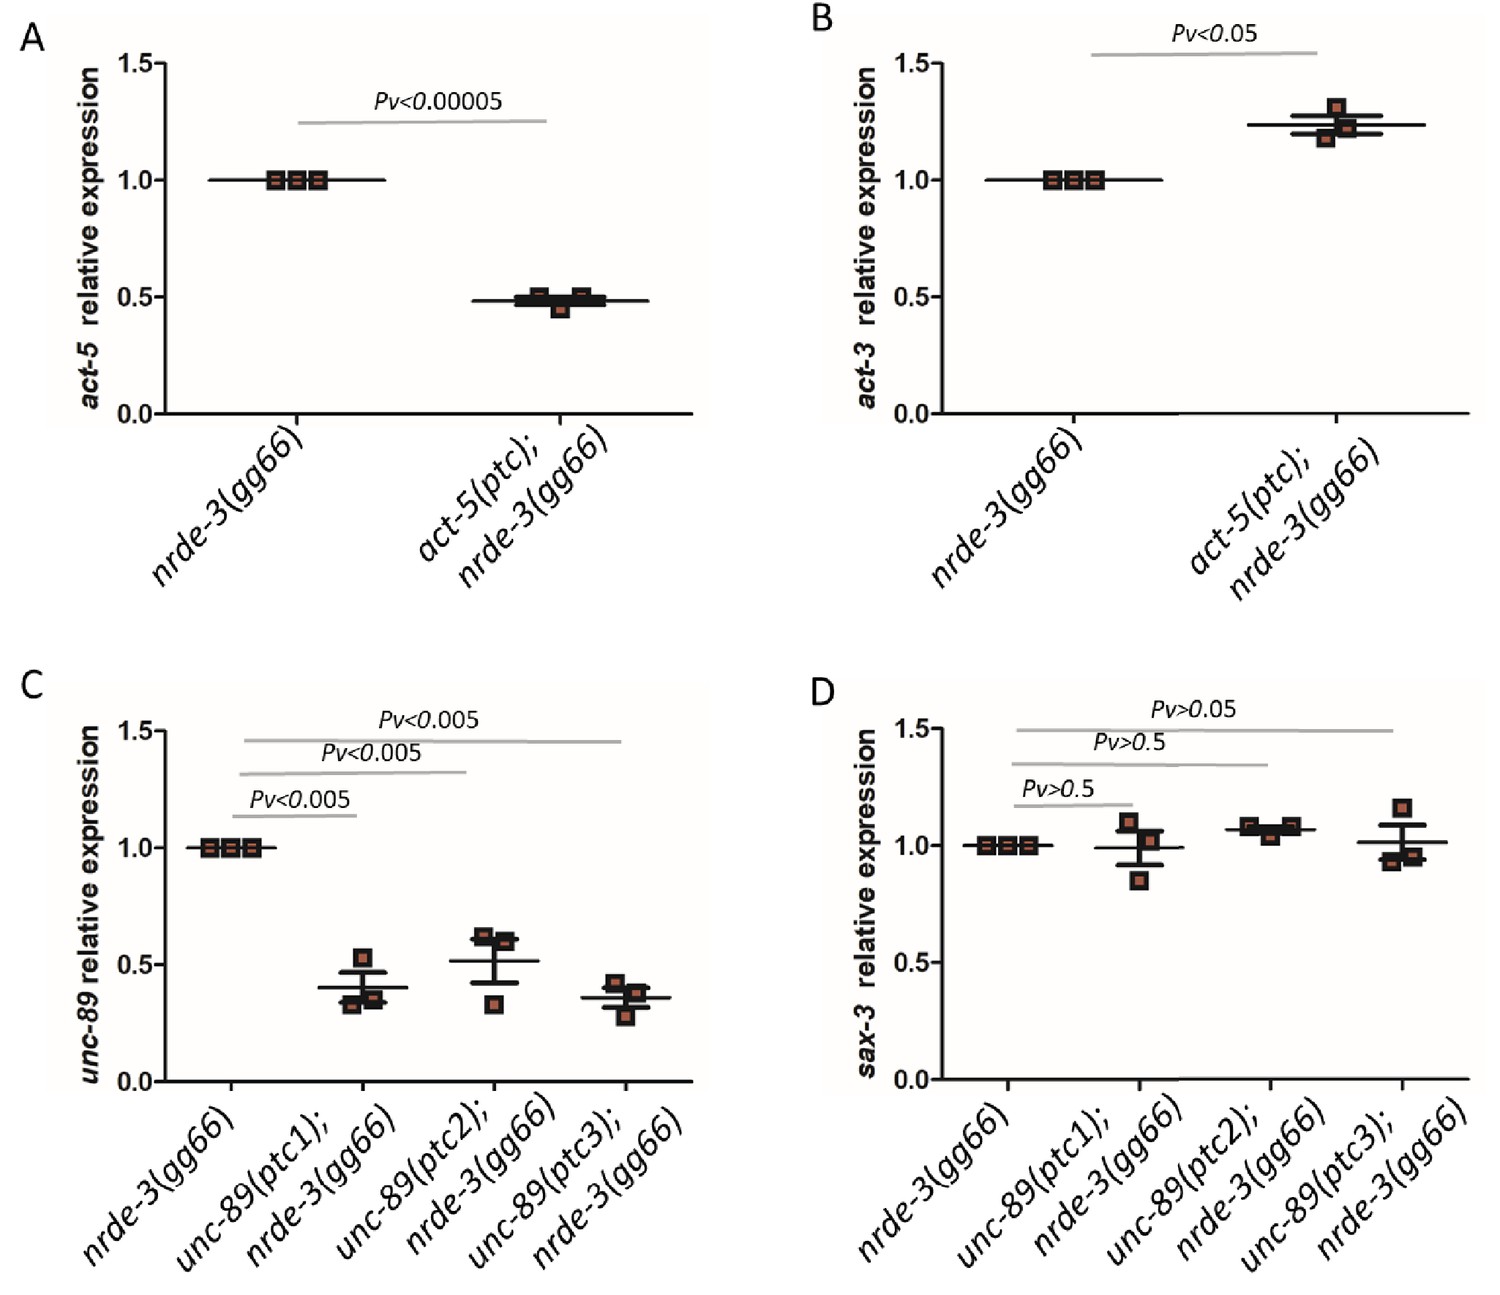
Partial data from double mutant analysis.
qPCR analysis of act-5 (A) and act-3 (B) mRNA levels in nrde-3(gg66) mutants and act-5(ptc); nrde-3(gg66) double mutants as well as of unc-89 (C) and sax-3 (D) mRNA levels in nrde-3(gg66) and unc-89(ptc); nrde-3(gg66) double mutants. Single mutant nrde-3(gg66) expression levels are set at 1. Data are mean ± S.E.M.; average dCt values are shown in Figure 5—source data 1. Two-tailed Student’s t-test was used to calculate P values.
Tables
Key resources table
| Reagent type (species) or resource | Designation | Source or reference | Identifiers | Additional information |
|---|---|---|---|---|
| Gene (Caenorhabditis elegans) | act-1 | CELE_T04C12.6 | WormBase ID: WBGene00000063 | |
| Gene (Caenorhabditis elegans) | act-2 | CELE_T04C12.5 | WBGene00000064 | |
| Gene (Caenorhabditis elegans) | act-3 | CELE_T04C12.4 | WBGene00000065 | |
| Gene (Caenorhabditis elegans) | act-4 | CELE_M03F4.2 | WBGene00000066 | |
| Gene (Caenorhabditis elegans) | act-5 | CELE_T25C8.2 | WBGene00000067 | |
| Gene (Caenorhabditis elegans) | unc-89 | CELE_C09D1.1 | WBGene00006820 | |
| Gene (Caenorhabditis elegans) | sax-3 | CELE_ZK377.2 | WBGene00004729 | |
| Strain, strain background (C. elegans) | N2 | CGC, Bristol strain | wild type | |
| Strain, strain background (C. elegans) | IN2049 | MacQueen et al., 2005 | act-5(ptc); dtIs419[act-5+ rol-6(d)] | |
| Strain, strain background (C. elegans) | IN2051 | MacQueen et al., 2005 | act-5(Δ1); dtIs419[act-5+ rol-6(d)] | |
| Strain, strain background (C. elegans) | VC971 | CGC, Estes et al., 2011 | +/mT1; act-5(Δ2)/mT1 [dpy-10(e128)]. | |
| Strain, strain background (C. elegans) | CB4043 | CGC, Hodgkin et al., 1989 | smg-2(e2008);him-5(e1490) | |
| Strain, strain background (C. elegans) | CB4355 | CGC, Pulak and Anderson, 1993 | smg-4(ma116);him-8(e1490) | |
| Strain, strain background (C. elegans) | TR1396 | CGC, Pulak and Anderson, 1993 | smg-6(r896) | |
| Strain, strain background (C. elegans) | YY168 | CGC, Pavelec et al., 2009 | ergo-1(gg100) | |
| Strain, strain background (C. elegans) | YY158 | CGC, Guang et al., 2008 | nrde-3(gg66) | |
| Strain, strain background (C. elegans) | YY13 | CGC, Pavelec et al., 2009 | rrf-3(mg373) | |
| Strain, strain background (C. elegans) | DYS0005 | This study, crossed IN2049 to N2 | act-5(ptc) | |
| Strain, strain background (C. elegans) | DYS0004 | This study, crossed IN2049 to N2 | +/act-5(Δ1) | |
| Strain, strain background (C. elegans) | DYS0012 | This study, injected in N2 | Ex[act-5p::RFP] | |
| Strain, strain background (C. elegans) | DYS0014 | This study, injected in N2 | Ex[act-3p::RFP] | |
| Strain, strain background (C. elegans) | DYS0015 | This study, crossed DYS0014 to DYS0004 | act-5(ptc);Ex[act-3p::RFP] | |
| Strain, strain background (C. elegans) | DYS0042 | This study, crossed DYS0012 to DYS0005 | act-5(ptc);Ex[act-5p::RFP] | |
| Strain, strain background (C. elegans) | VC40114 | CGC, Million Mutation Project | unc-89(ptc1) | |
| Strain, strain background (C. elegans) | VC40193 | CGC, Million Mutation Project | unc-89(ptc2) | |
| Strain, strain background (C. elegans) | VC40199 | CGC, Million Mutation Project | unc-89(ptc3) | |
| Strain, strain background (C. elegans) | DYS0028 | This study, crossed VC40114 to N2 | unc-89(ptc1) | |
| Strain, strain background (C. elegans) | DYS0030 | This study, crossed VC40193 to N2 | unc-89(ptc2) | |
| Strain, strain background (C. elegans) | DYS0031 | This study, crossed VC40199 to N2 | unc-89(ptc3) | |
| Strain, strain background (C. elegans) | DYS0037 | This study, induced by CRISPR/Cas9 | unc-89(Δ) | |
| Strain, strain background (C. elegans) | DYS0008 | This study, crossed DYS0005 to CB4043 | smg-2(e2008); act-5(ptc) | |
| Strain, strain background (C. elegans) | DYS0057 | This study, crossed DYS0005 to CB4355 | act-5(ptc); smg-4(ma116) | |
| Strain, strain background (C. elegans) | DYS0047 | This study, crossed DYS0028 to CB4355 | unc-89(ptc1); smg-4(ma116) | |
| Strain, strain background (C. elegans) | DYS0048 | This study, crossed DYS0030 to CB4355 | unc-89(ptc2); smg-4(ma116) | |
| Strain, strain background (C. elegans) | DYS0050 | This study, crossed DYS0031 to CB4355 | unc-89(ptc3); smg-4(ma116) | |
| Strain, strain background (C. elegans) | DYS0053 | This study, crossed DYS0028 to TR1396 | unc-89(ptc1); smg-6(r896) | |
| Strain, strain background (C. elegans) | DYS0055 | This study, crossed DYS0030 to TR1396 | unc-89(ptc2); smg-6(r896) | |
| Strain, strain background (C. elegans) | DYS0056 | This study, crossed DYS0031 to TR1396 | unc-89(ptc3); smg-6(r896) | |
| Strain, strain background (C. elegans) | DYS0010 | This study, crossed DYS0005 to YY168 | act-5(ptc); ergo-1(gg100) | |
| Strain, strain background (C. elegans) | DYS0054 | This study, crossed DYS0028 to YY168 | unc-89(ptc1); ergo-1(gg100) | |
| Strain, strain background (C. elegans) | DYS0051 | This study, crossed DYS0030 to YY168 | unc-89(ptc2); ergo-1(gg100) | |
| Strain, strain background (C. elegans) | DYS0052 | This study, crossed DYS0031 to YY168 | unc-89(ptc3); ergo-1(gg100) | |
| Strain, strain background (C. elegans) | DYS0045 | This study, crossed DYS0005 to YY158 | act-5(ptc); nrde-3(gg66) | |
| Strain, strain background (C. elegans) | DYS0065 | This study, crossed DYS0028 to YY158 | unc-89(ptc1); nrde-3(gg66) | |
| Strain, strain background (C. elegans) | DYS0072 | This study, crossed DYS0030 to YY158 | unc-89(ptc2); nrde-3(gg66) | |
| Strain, strain background (C. elegans) | DYS0066 | This study, crossed DYS0031 to YY158 | unc-89(ptc3); nrde-3(gg66) | |
| Strain, strain background (C. elegans) | DYS0046 | This study, crossed DYS0005 to YY13 | rrf-3(mg373); act-5(ptc) | |
| Strain, strain background (C. elegans) | DYS0070 | This study, crossed DYS0028 to YY13 | unc-89(ptc1); rrf-3(mg373) | |
| Strain, strain background (C. elegans) | DYS0062 | This study, crossed DYS0030 to YY13 | unc-89(ptc2); rrf-3(mg373) | |
| Strain, strain background (C. elegans) | DYS0063 | This study, crossed DYS0031 to YY13 | unc-89(ptc3); rrf-3(mg373) | |
| Commercial assay or kit | In-Fusion HD Cloning | Clontech | Clontech:639647 | |
| Commercial assay or kit | Superscript III reverse transcriptase | Takara | Cat. No: 18080–044 | |
| Commercial assay or kit | SMARTer RACE cDNA Amplification Kit | Takara | Cat. N. 634860 | |
| Commercial assay or kit | Advantage 2 PCR kit | Takara | Cat. N. 639207 | |
| RNAi construct | mv_C18D11.4 | BioScience | rsp-8 | |
| RNAi construct | sjj2_C18D11.4 | BioScience | rsp-8 | |
| RNAi constructs | mv_C33H5.12 | BioScience | rsp-6 | |
| RNAi constructs | sjj2_C33H5.12 | BioScience | rsp-6 | |
| RNAi constructs | mv_W02B12.3 | BioScience | rsp-1 | |
| RNAi constructs | sjj2_W02B12.3 | BioScience | rsp-1 | |
| RNAi constructs | mv_D2089.1 | BioScience | rsp-7 | |
| RNAi constructs | sjj2_D2089.1 | BioScience | rsp-7 | |
| RNAi constructs | mv_B0464.5 | BioScience | spk-1 | |
| RNAi constructs | sjj2_B0464.5 | BioScience | spk-1 | |
| RNAi constructs | mv_R05D11.6 | BioScience | paxt-1 | |
| RNAi constructs | sjj2_R05D11.6 | BioScience | paxt-1 | |
| RNAi constructs | mv_F43E2.8 | BioScience | hsp-4 | |
| RNAi constructs | sjj2_F43E2.8 | BioScience | hsp-4 | |
| RNAi constructs | sjj2_Y39G8C.1 | BioScience | xrn-1 | |
| RNAi constructs | mv_Y48G8AL.6 | BioScience | smg-2 | |
| RNAi constructs | sjj2_Y48G8AL.6 | BioScience | smg-2 | |
| RNAi constructs | sjj2_F46B6.3 | BioScience | smg-4 | |
| RNAi constructs | mv_Y54F10AL.2 | BioScience | smg-6 | |
| RNAi constructs | sjj2_Y54F10AL.2 | BioScience | smg-6 | |
| RNAi constructs | mv_F26B1.2 | BioScience | hrpk-1 | |
| RNAi constructs | sjj2_F26B1.2 | BioScience | hrpk-1 | |
| RNAi constructs | mv_F26E4.10 | BioScience | drsh-1 | |
| RNAi constructs | sjj2_F26E4.10 | BioScience | drsh-1 | |
| RNAi constructs | mv_T22A3.5 | BioScience | pash-1 | |
| RNAi constructs | sjj2_T22A3.5 | BioScience | pash-1 | |
| RNAi constructs | sjj2_F26A3.8 | BioScience | rrf-1 | |
| RNAi constructs | mv_ R06C7.1 | BioScience | wago-1 | |
| RNAi constructs | sjj2_ R06C7.1 | BioScience | wago-1 | |
| RNAi constructs | mv_F58G1.1 | BioScience | wago-4 | |
| RNAi constructs | sjj2_F58G1.1 | BioScience | wago-4 | |
| RNAi constructs | sjj2_F10B5.7 | BioScience | rrf-3 | |
| RNAi constructs | mv_M88.5 | BioScience | zbp-1 | |
| RNAi constructs | sjj2_M88.5 | BioScience | zbp-1 | |
| RNAi constructs | sjj2_K12H4.8 | BioScience | dcr-1 | |
| RNAi constructs | mv_T20G5.11 | BioScience | rde-4 | |
| RNAi constructs | sjj2_T20G5.11 | BioScience | rde-4 | |
| RNAi constructs | mv_F36H1.2 | BioScience | kdin-1 | |
| RNAi constructs | mv_K12B6.1 | BioScience | sago-1 | |
| RNAi constructs | sjj2_K12B6.1 | BioScience | sago-1 | |
| RNAi constructs | mv_K08H10.7 | BioScience | rde-1 | |
| RNAi constructs | sjj2_K08H10.7 | BioScience | rde-1 | |
| RNAi constructs | sjj2_R09A1.1 | BioScience | ergo-1 | |
| RNAi constructs | mv_R04A9.2 | BioScience | nrde-3 | |
| RNAi constructs | sjj2_R04A9.2 | BioScience | nrde-3 |
Download links
A two-part list of links to download the article, or parts of the article, in various formats.
Downloads (link to download the article as PDF)
Open citations (links to open the citations from this article in various online reference manager services)
Cite this article (links to download the citations from this article in formats compatible with various reference manager tools)
Transcriptional adaptation in Caenorhabditis elegans
eLife 9:e50014.
https://doi.org/10.7554/eLife.50014


