The lysosomal transporter MFSD1 is essential for liver homeostasis and critically depends on its accessory subunit GLMP
- Christian-Albrechts-University Kiel, Germany
- Rheinische-Friedrich-Wilhelms-University, Germany
- University Medical Center Hamburg-Eppendorf, Germany
- University of Heidelberg, Germany
- University of Oslo, Norway
Figures
Figure 1 with 1 supplement

MFSD1 is an ubiquitously expressed, non-glycosylated lysosomal protein that contains a dileucine-based lysosomal sorting motif.
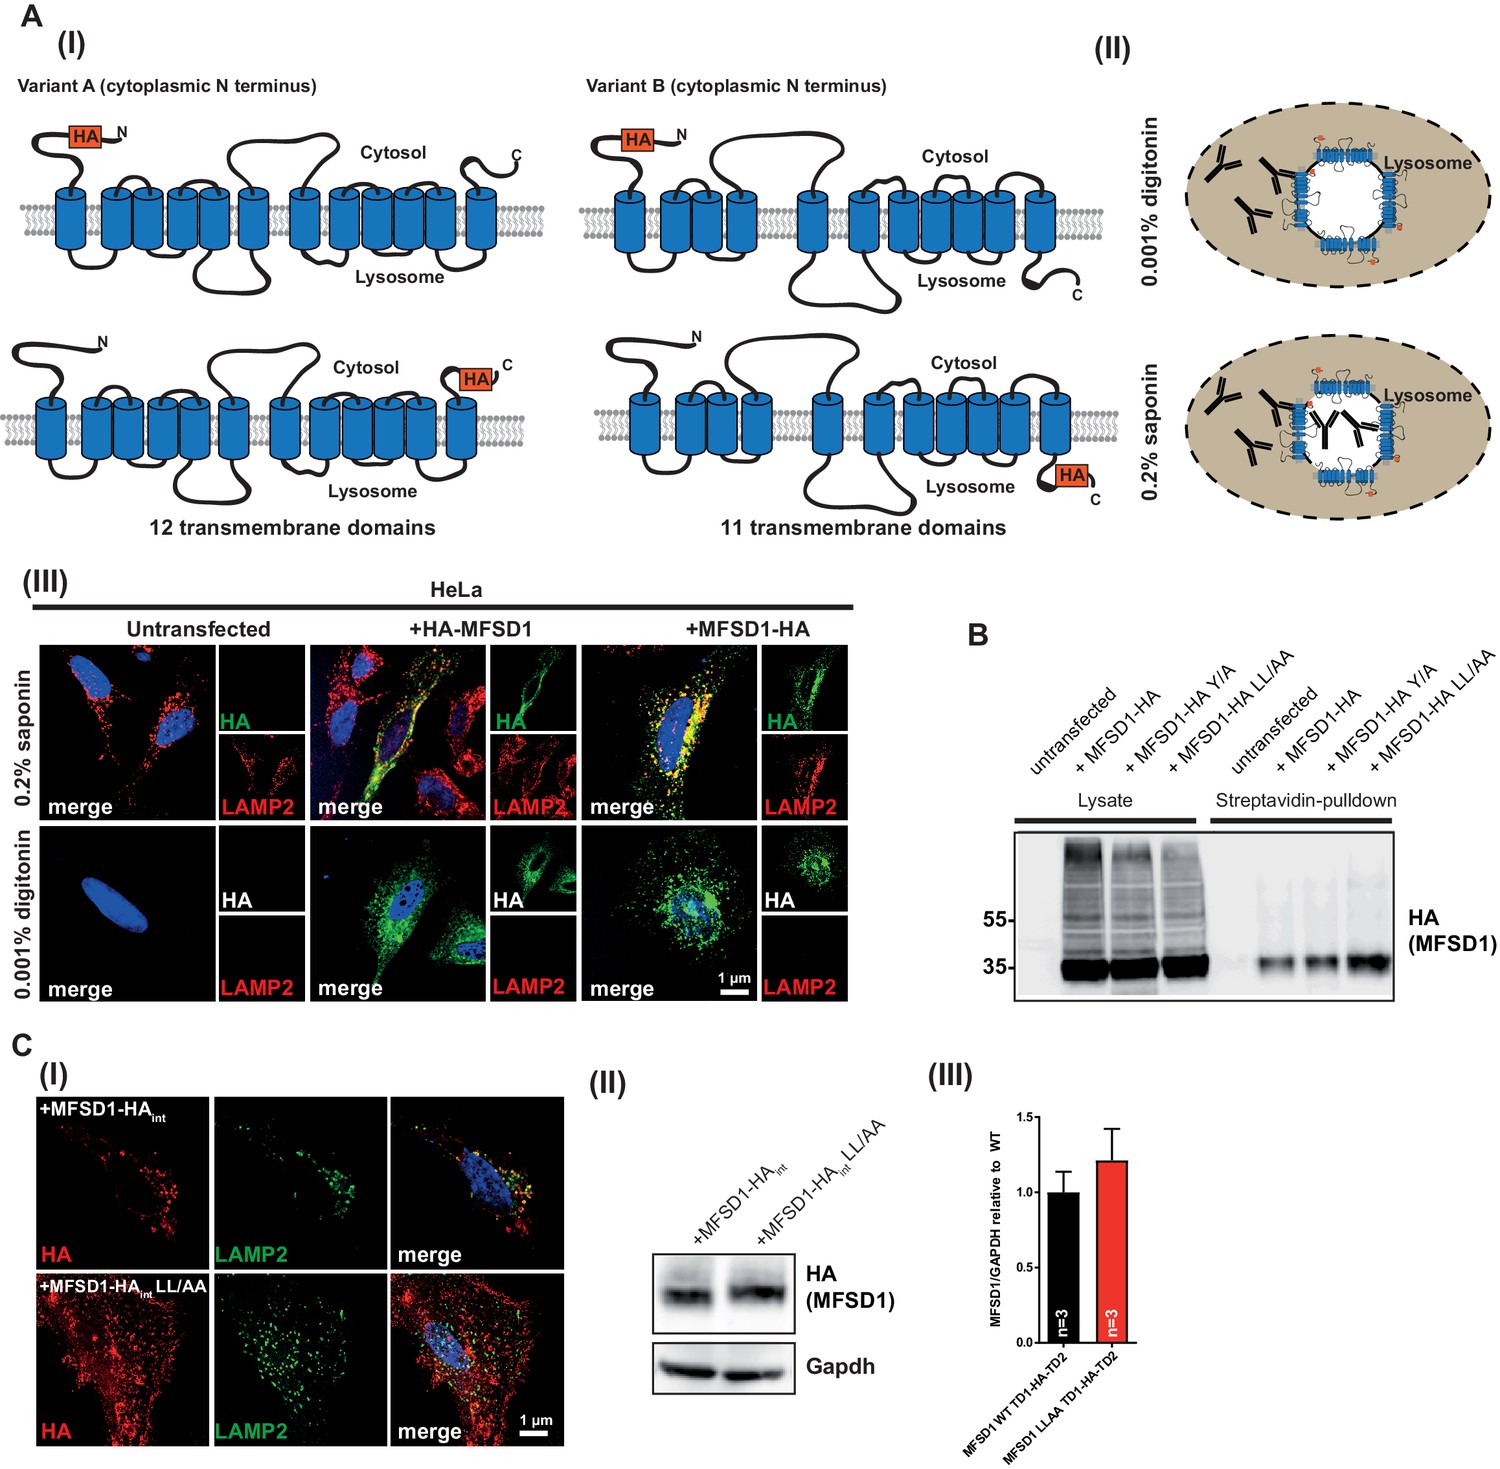
(A) Co-Immunofluorescence staining of HeLa cells overexpressing N- or C-terminally HA-tagged MFSD1 with antibodies against LAMP2 (red), HA (green) and an antibody against MFSD1 (magenta). (B) Immunoblot of HeLa cells transfected with untagged and N- or C-terminally tagged MFSD1 with antibodies against HA (left panel) and MFSD1 (right panel). Gapdh is depicted as loading control. MFSD1-specific bands are labeled with arrow-heads. (C) Co-immunofluorescence staining for LAMP1 (red) and endogenous MFSD1 (green) of wildtype MEF cells. (D) Immunoblot of the postnuclear supernatant and the lysosome-enriched fraction of magnetite-isolated lysosomes from wildtype MEFs probed with antibodies against MFSD1, LAMP1 (marker for lysosomes), GM130 (marker for the Golgi-apparatus), KDEL (marker for the endoplasmic reticulum) and VDAC (marker for mitochondria). (E) Immunoblot of crude membranes of the indicated wildtype mouse tissues probed with the antibody against MFSD1. N+/K+-ATPase is depicted as a loading control. An unspecific band is labeled with an asterisk. (F) Topology model of murine MFSD1. The putative dileucine-based lysosomal sorting motif is indicated. Amino acids confining the TMDs (numbered from 1 to 12) are indicated. (G) Alignment of the dileucine-based lysosomal sorting motifs-containing N-termini of the indicated proteins/species. The critical amino acids constituting the motif are depicted in gray. (H) Web-logo representation of the sequence containing the dileucine motif of MFSD1 orthologues from different species (Mus musculus, Rattus norvegicus, Homo sapiens, Bos taurus, Gallus gallus, Danio Rerio). (I) Co-immunofluorescence for LAMP2 (green) and HA (red) of HeLa cells transfected with N-terminally HA-tagged MFSD1LL/AA-mutant. (J) (I) Schematic representation of the MFSD1-construct with an internal-HA-tag between TMD 1 and 2 used for FACS. (II) FACS plots of untransfected HeLa cells, cells transfected with wildtype and MFSD1LL/AA-mutant with an internal HA tag after staining of HA without permeabilization. (III) Quantification of HA-positive cells from three FACS experiments. ***=p < 0.001. (K) Immunoblot of lysates from MFSD1-HA-transfected HeLa cells treated with PNGaseF or EndoH probed with an antibody against HA. Gapdh and LAMP2 are shown as loading controls and controls for efficient glycosidase-treatment, respectively. (L) Immunoblot of HeLa cells transfected with wildtype C-terminally HA-tagged MFSD1 or the indicated mutants N76Q/N449Q probed with an antibody against HA. Gapdh is shown as loading control.
Figure 1—figure supplement 1
Topology of MFSD1 and control/additional experiments validating plasma membrane localization of MFSD1LL/AA-mutant.
(A) (I) Schematic representation of the possible topology and transmembrane domain structures assuming 12 or 11 transmembrane domains, respectively of the N- and C-terminally HA-tagged MFSD1-constructs. Only topology models with a cytosolic N-terminus are depicted. (II) Scheme of the cell after permeabilization with saponin and selective permeabilization with digitonin. (III) Co-immunofluorescence of N-terminally HA-tagged HA-MFSD1 or C-terminally HA-tagged MFSD1-HA transfected and saponin-/digitonin permeabilized HeLa cells with antibodies against HA (green) and the luminal domain of LAMP2 (red). Nuclei are stained with DAPI (blue). (B) Immunoblot analysis of Streptavidin-pulldown fractions and corresponding input fractions (lysate) of surface-biotinylated HeLa cells transfected with the indicated constructs harboring mutations in putative lysosomal targeting motifs. (C) (I) Co-immunofluorescence for LAMP2 (green) and HA (red) of HeLa cells transfected with wildtype or MFSD1LL/AA-mutant with an internal HA-tag. (II) Immunoblot of HeLa cells transfected with wildtype or MFSD1LL/AA-mutant with an internal HA with antibodies against HA and with Gapdh as loading control. (III) A quantification of the blots is depicted.
Figure 2 with 5 supplements
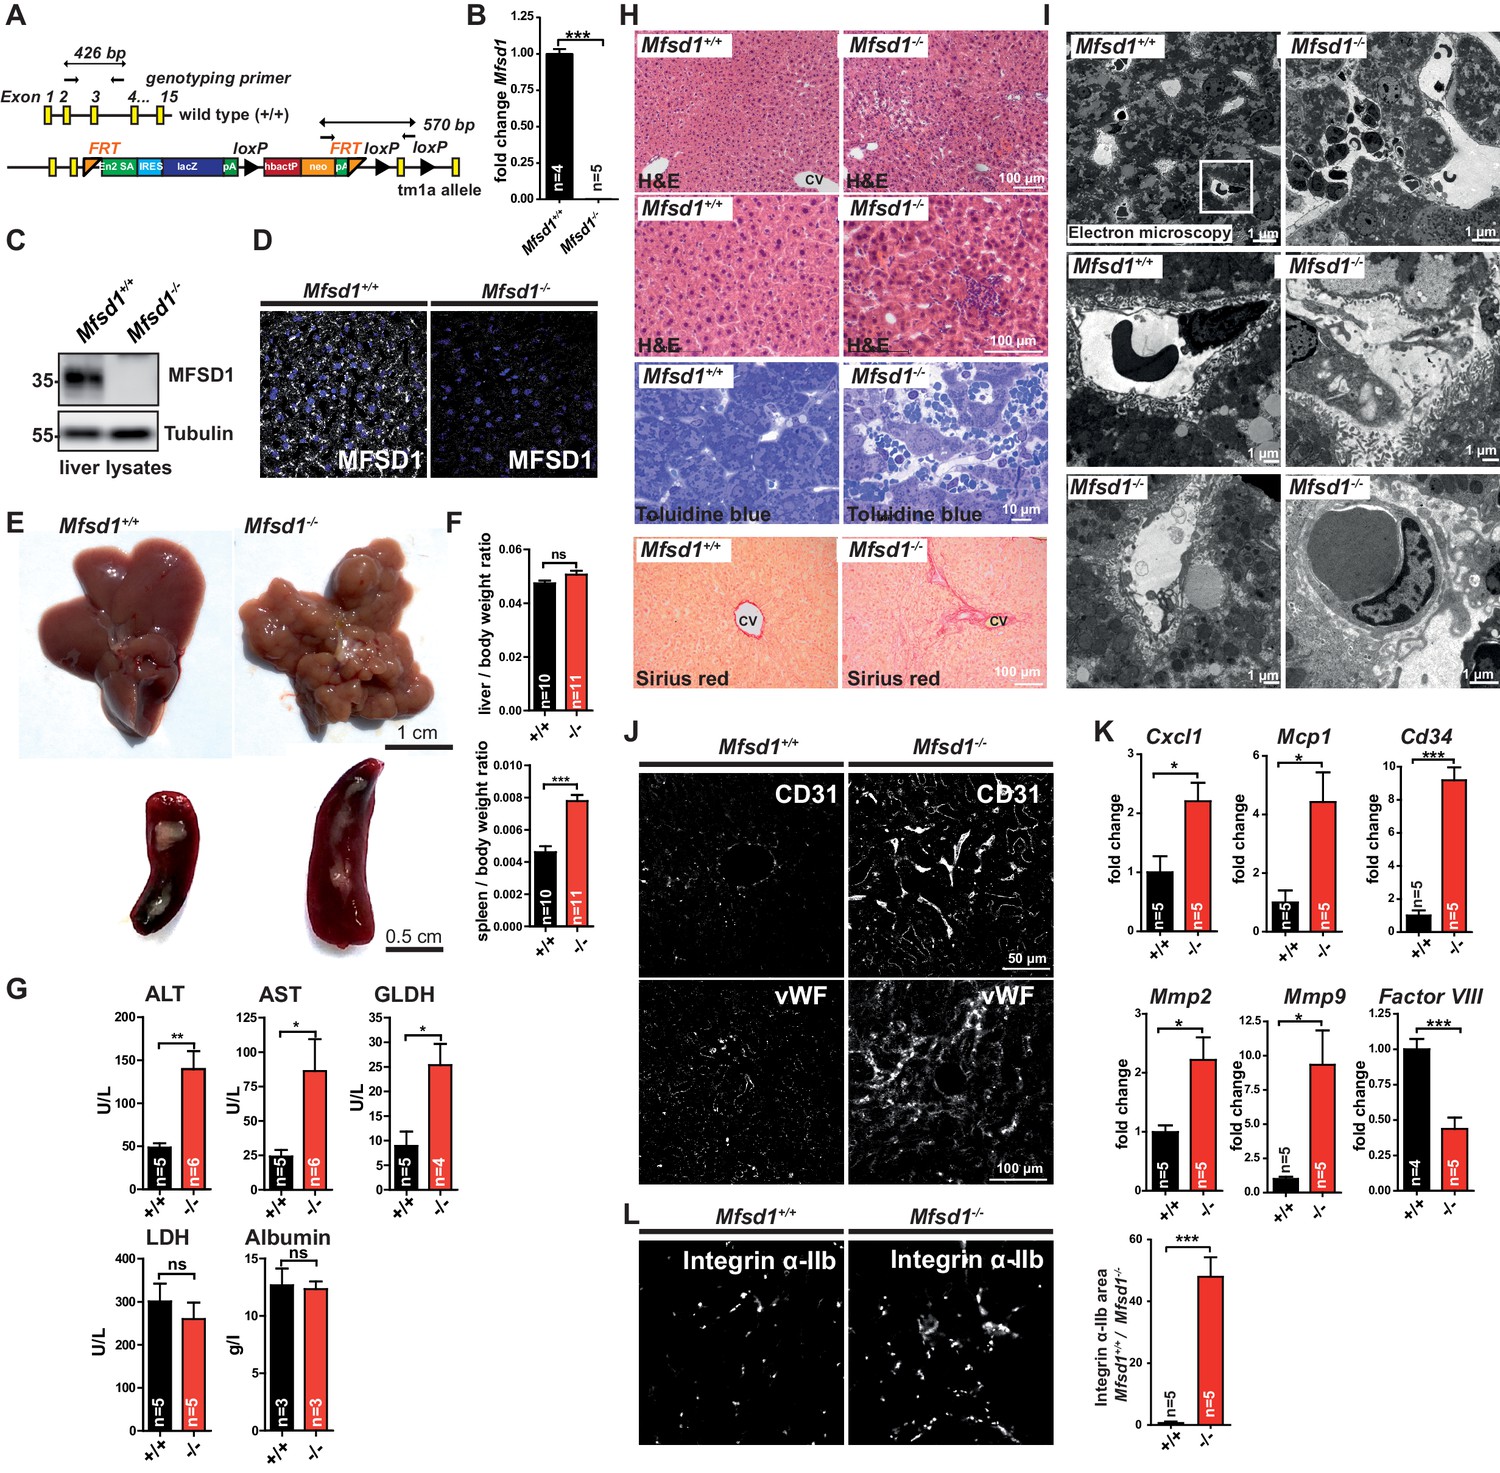
MFSD1 knockout mice develop focal LSEC degeneration followed by platelet aggregation and splenomegaly.
(A) Schematic representation of the tm1a targeting vector containing LacZ and Frt-/Cre recombinase sites. (B) qPCR of total liver mRNA from wildtype and Mfsd1 KO mice with primers specific for Mfsd1. Mfsd1-levels are normalized to Gapdh. n = 4–5 ***=p < 0.0001. (C) Immunoblot of total liver lysates from wildtype and Mfsd1 KO mice probed with an antibody against MFSD1. Tubulin is shown as loading control. (D) Immunofluorescence staining of liver sections from wildtype and Mfsd1 KO mice with an antibody against MFSD1 (white). Nuclei are stained with DAPI (blue). (E) Photomicrographs of the liver and the spleen of wildtype and Mfsd1 KO mice (age: 14 weeks). (F) Weight of the liver and spleen normalized to total bodyweight of wildtype and Mfsd1 KO mice (age: 14 weeks). (G) Serum-activity levels of alanine transaminase (ALT), aspartate aminotransferase (AST), glutamate dehydrogenase (GLDH), lactate dehydrogenase (LDH) and albumin from wildtype and Mfsd1 KO mice (age: 14 weeks). (H) Hematoxylin and Eosin, Toluidine blue and Sirius Red staining of the liver of wildtype and Mfsd1 KO mice (age: 14 weeks). CV = central vein. (I) Representative electron micrographs of liver sections from wildtype and Mfsd1 KO mice. (J) Immunofluorescence staining of liver sections of wildtype and MFSD1 KO mice for CD31 (upper panel) and von Willebrand-factor (vWF). (K) qPCR of liver total mRNA from wildtype and MFSD1 KO mice with primers specific for CXCL1, MCP1, CD34, MMP2, MMP9 and factor VIII. *=p < 0.05; ***=p < 0.0001. n = 4–5. (L) Immunofluorescence staining of liver sections of wildtype and Mfsd1 KO mice for Integrin α-Ilb. Quantification of the Integrin α-Ilb positive area is shown.
Figure 2—figure supplement 1
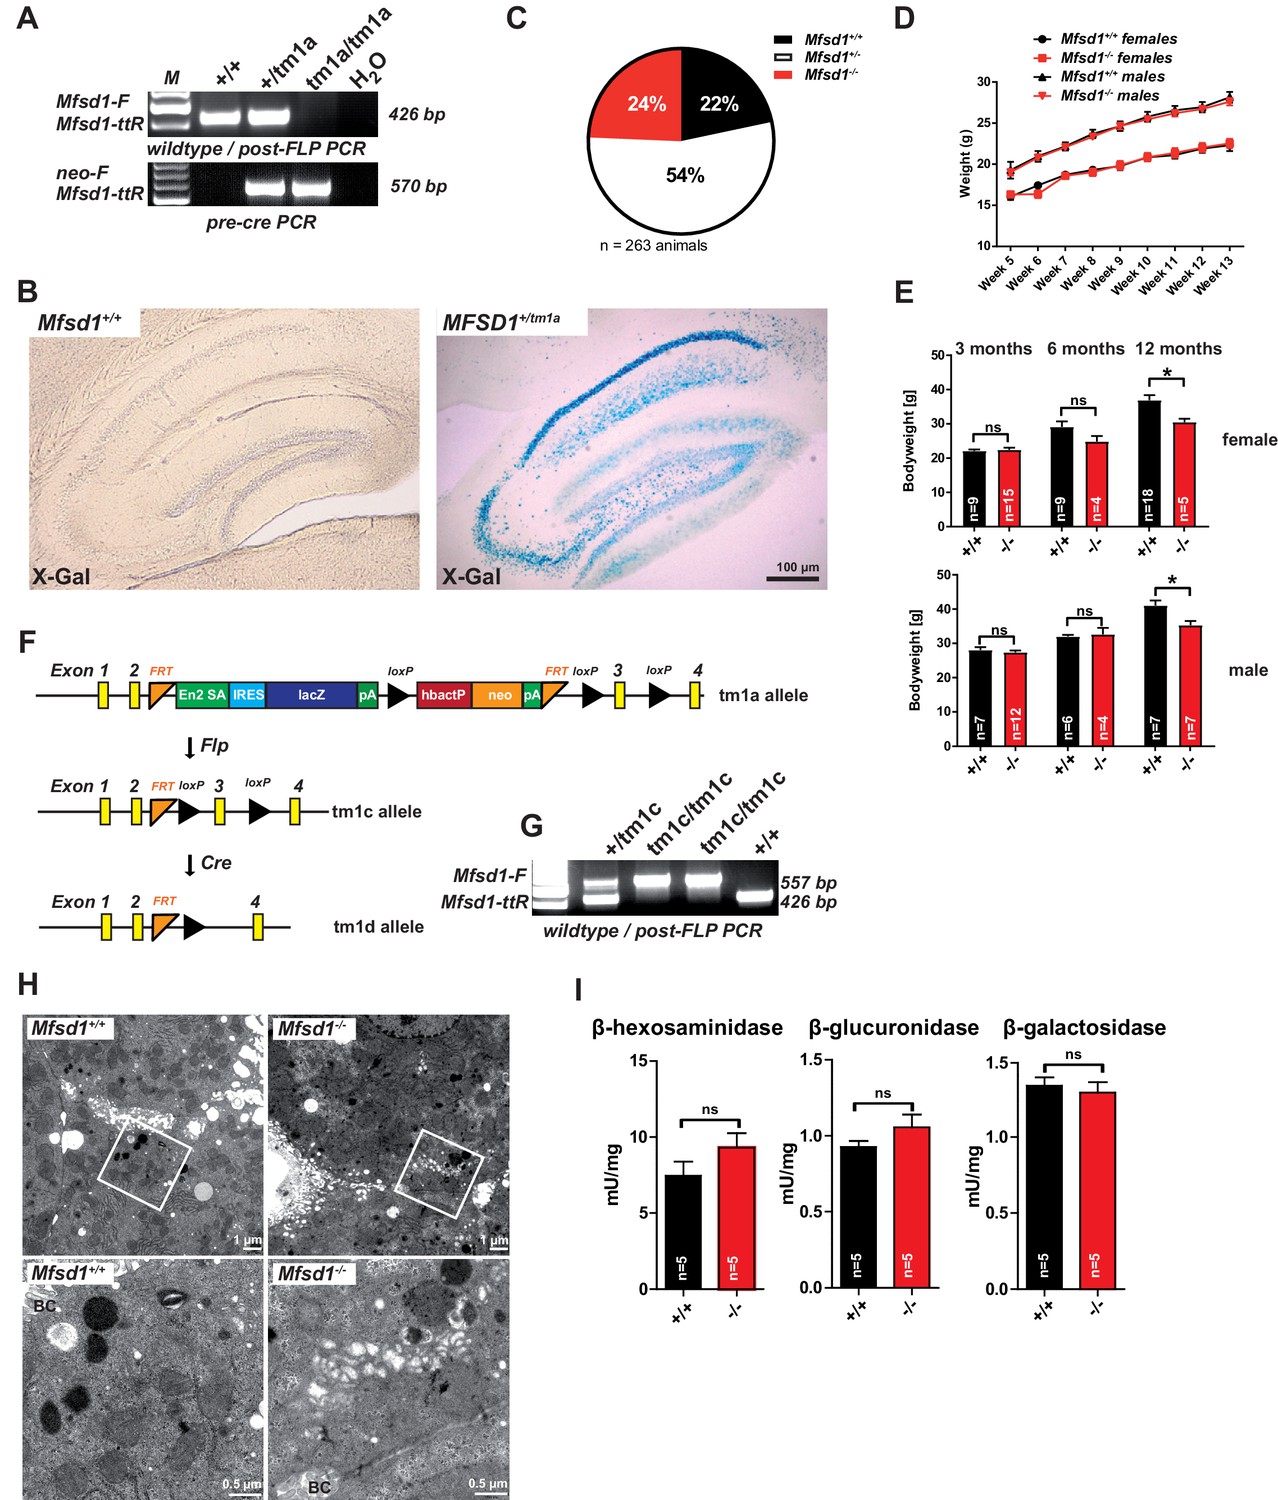
Generation of MFSD1-deficient mice.
(A) PCR products of wildtype/tm1c (upper panel) and tm1a (lower panel) PCR reactions from wildtype (+/+) and tm1a heterozygous (+/-) and homozygous (-/-) mouse tails. (B) X-gal staining of brain sections of wildtype and Mfsd1 tm1a heterozygous mice. (C) Schematic representation of the genotype distribution of the offspring resulting from a Mfsd1 tm1a heterozygous mice breeding. (D) Graph representing the longitudinal weight increase of wildtype and Mfsd1 KO male and female mice from week 5 of age to week 13. (E) Body weight of wildtype and Mfsd1 KO male and female mice at 3, 6 and 12 months of age (ns = not significant; *=p < 0.05). (F) Scheme of the strategy used to generate tm1c and tm1d alleles. (G) PCR products of wildtype/tm1c PCR reaction from wildtype (+/+), tm1c heterozygous (+/tm1c) and homozygous (tm1c/tm1c) mouse tails. (H) Electron microscopy of liver thin sections from wildtype and Mfsd1 KO. Peri canalicular lysosomes show a similar morphology and size in both wildtype and Mfsd1 KO mice. Age: 13 weeks. BC = bile canalicus. (I) Specific activity of the lysosomal enzymes β-hexosaminidase, β-galactosidase and β-glucuronidase in liver tissue lysates from wildtype and Mfsd1 KO mice. 3 months of age. Ns = not significant.
Figure 2—figure supplement 2
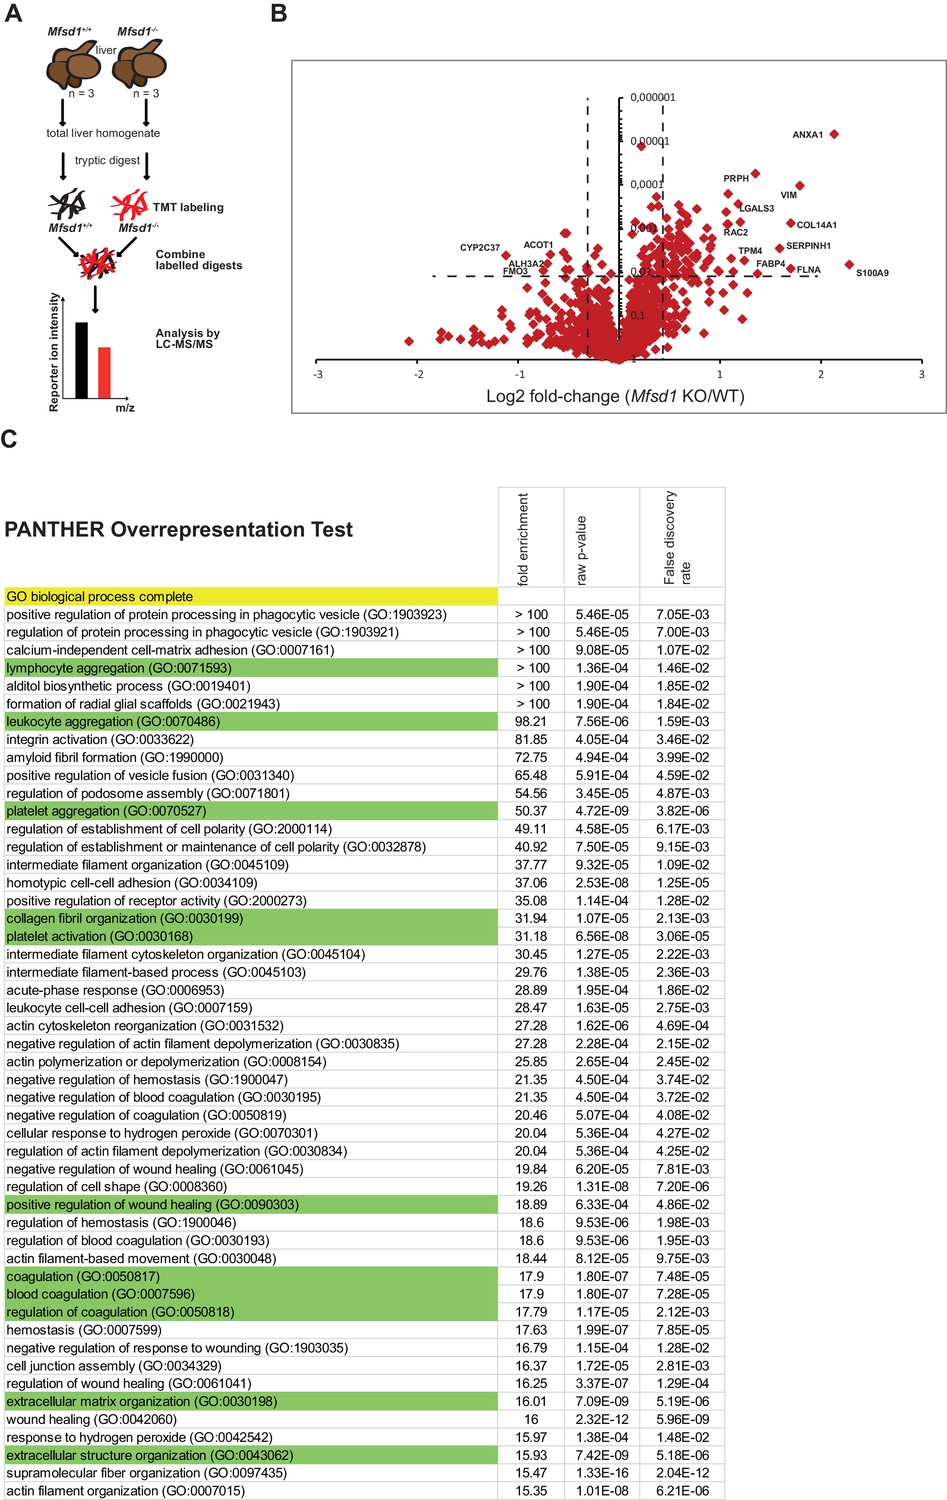
Gene ontology classification of differentially expressed proteins using the ‘Panther’ classification system.
(A) Scheme of the experimental workflow for Tandem Mass Tag (TMT)-based differential proteomics of total liver homogenates. (B) Volcano-plot representation of differential protein levels of liver from wildtype and Mfsd1 KO mice determined by mass spectrometry. n = 3. (C) Table representing the gene ontology annotation using the ‘Panther’-classification. Pathways that are enriched in proteins that show altered expression in the liver of Mfsd1 KO mice relative to wildtype mouse livers are represented. ‘Fold enrichment’ specifies how many times the number of altered proteins is overrepresented over the expected number of each GO term. The ‘raw p-value’ provides statistic evidence for overrepresentation without taking multiple testing in account. The ‘False discovery rate’ provides statistic evidence for overrepresentation of proteins in each GO term including multiple testing.
Figure 2—figure supplement 3
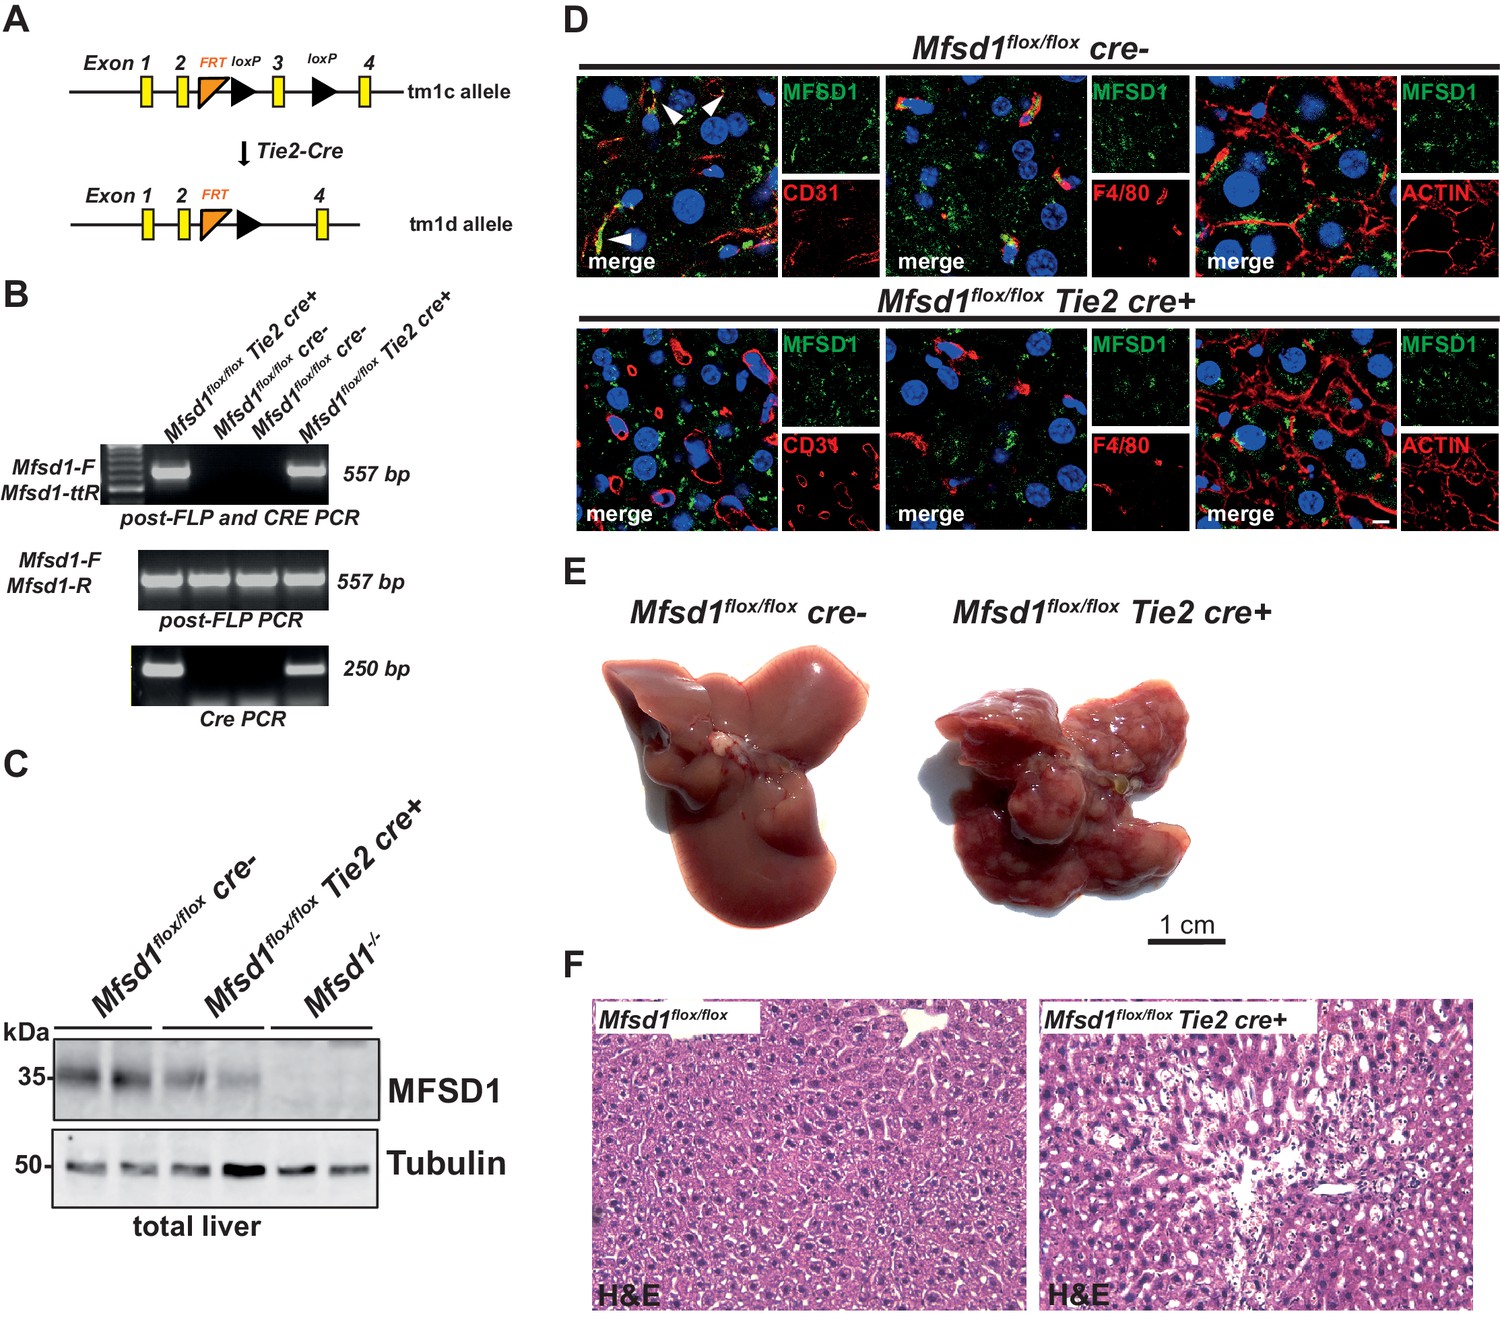
Tie2-conditional mice (Mfsd1flox/flox Tie2 cre) have the same tuberous liver appearance as the full KO.
(A) Scheme depicting the generation of tm1d allele by cre recombination of the tm1c allele. (B) PCR products of wildtype/tm1c (middle panel), tm1d (middle panel) and cre (lower panel) PCR reactions from Mfsd1flox/flox and Mfsd1flox/flox Tie2 cre mice with tail-DNA as template. (C) Immunoblot of total liver lysates of Mfsd1flox/flox, Mfsd1flox/flox Tie2 cre and Mfsd1 KO mice probed with an antibody against MFSD1. Tubulin is depicted as a loading control. (D) Co-immunofluorescence staining of liver of Mfsd1flox/flox, Mfsd1flox/flox Tie2 cre mice for MFSD1 (green) and CD31 (a marker for endothelial cells including LSECs) (left panel, red), F4/80 (a marker for Kupffer cells and macrophages) (central panel, red) or actin (right panel, red). Nuclei are stained with DAPI (blue). (E) Photomicrographs of the liver of Mfsd1flox/flox and Mfsd1flox/flox Tie2 cre mice. (F) Hematoxylin and eosin of liver sections of Mfsd1flox/flox and Mfsd1flox/flox Tie2 cre mice.
Figure 2—figure supplement 4
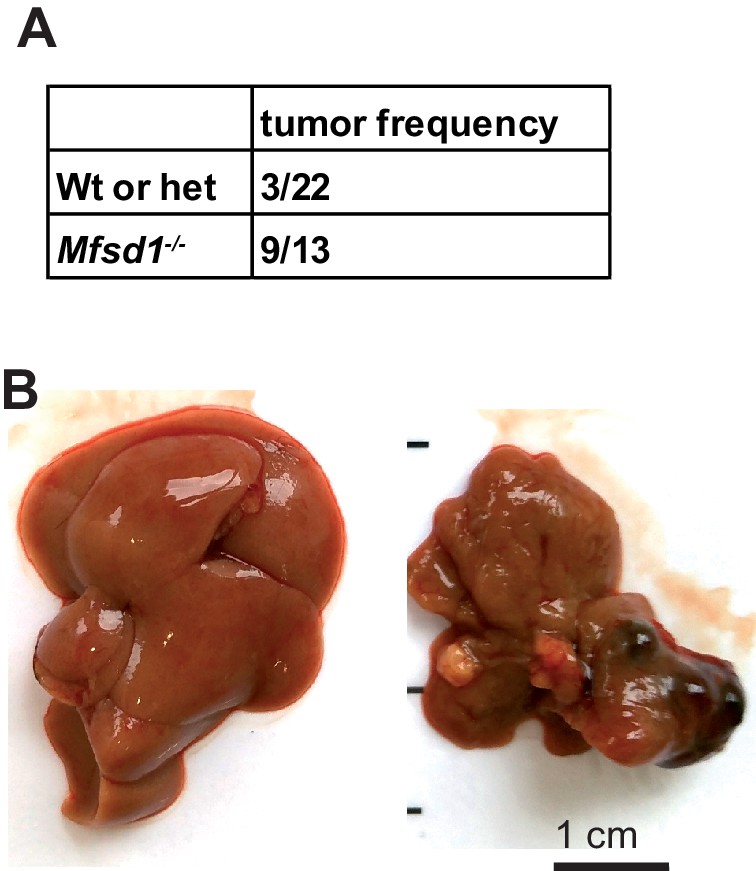
Increased frequency of liver tumors at an advanced age (>18 months) in Mfsd1 KO mice.
(A) Table representing the tumor frequency of Mfsd1 KO mice versus wildtype and Mfsd1+/- mice. (B) Representative images of the liver of mice at 18 months of age.
Figure 2—figure supplement 5
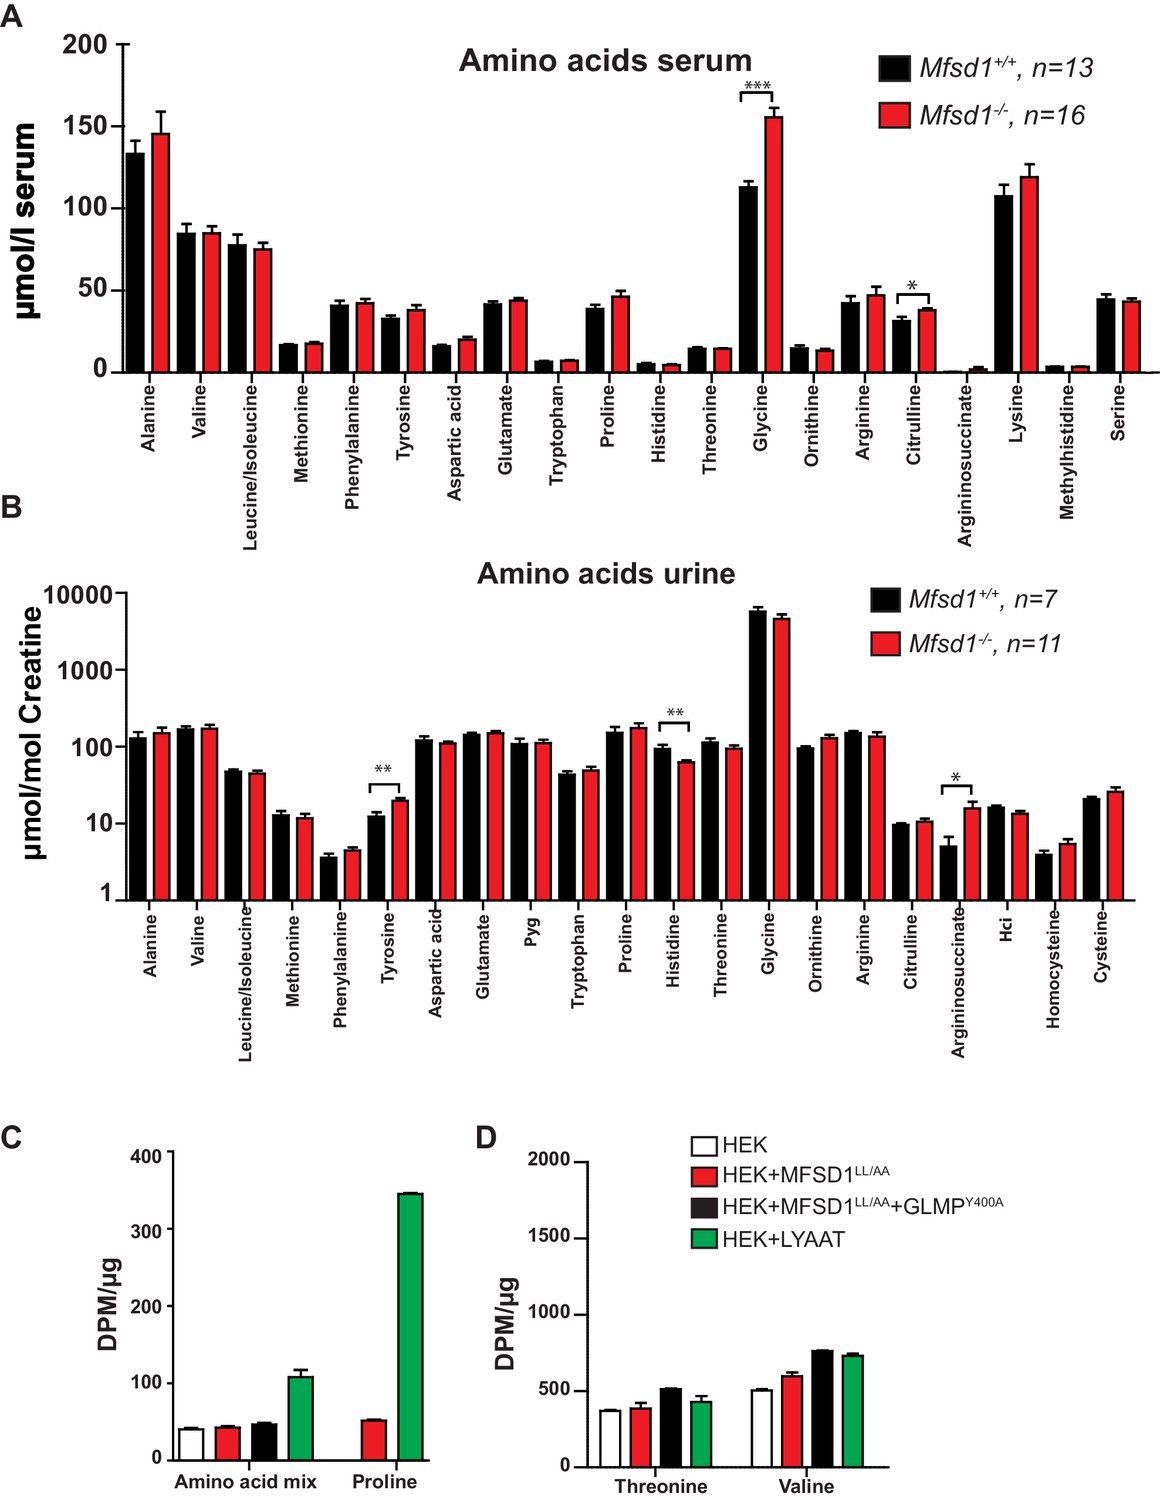
Mfsd1 knockout mice have normal levels of amino acids in serum and urine and overexpression of PM-localized MFSD1LL/AA does not increase the uptake of valine and threonine from acidified cell culture medium.
(A) The levels of different amino acids from wildtype and age-matched Mfsd1 KO mice in serum show no major differences between the two genotypes. (B) The levels of different amino acids (normalized to creatine) from wildtype and age-matched Mfsd1 KO mice in urine show no major differences between the two genotypes. (C) HEK cells were transfected with plasmids coding for MFSD1LL/AA, MFSD1LL/AA and GLMPY400A or LYAAT-1. 24 hr post-transfection, a buffer with a pH = 5.5 containing a mix of [3H] labeled aa, proline, threonine or valine was added to the transfected and untransfected cells for 15 min at room temperature. After several washes, the radioactivity of the cells was measured with liquid scintillation. The values are represented as the mean disintegration per minute corrected by the protein concentration. (D) The same experimental setup as described in (C) was applied with the single amino acids threonine or valine.
Figure 3
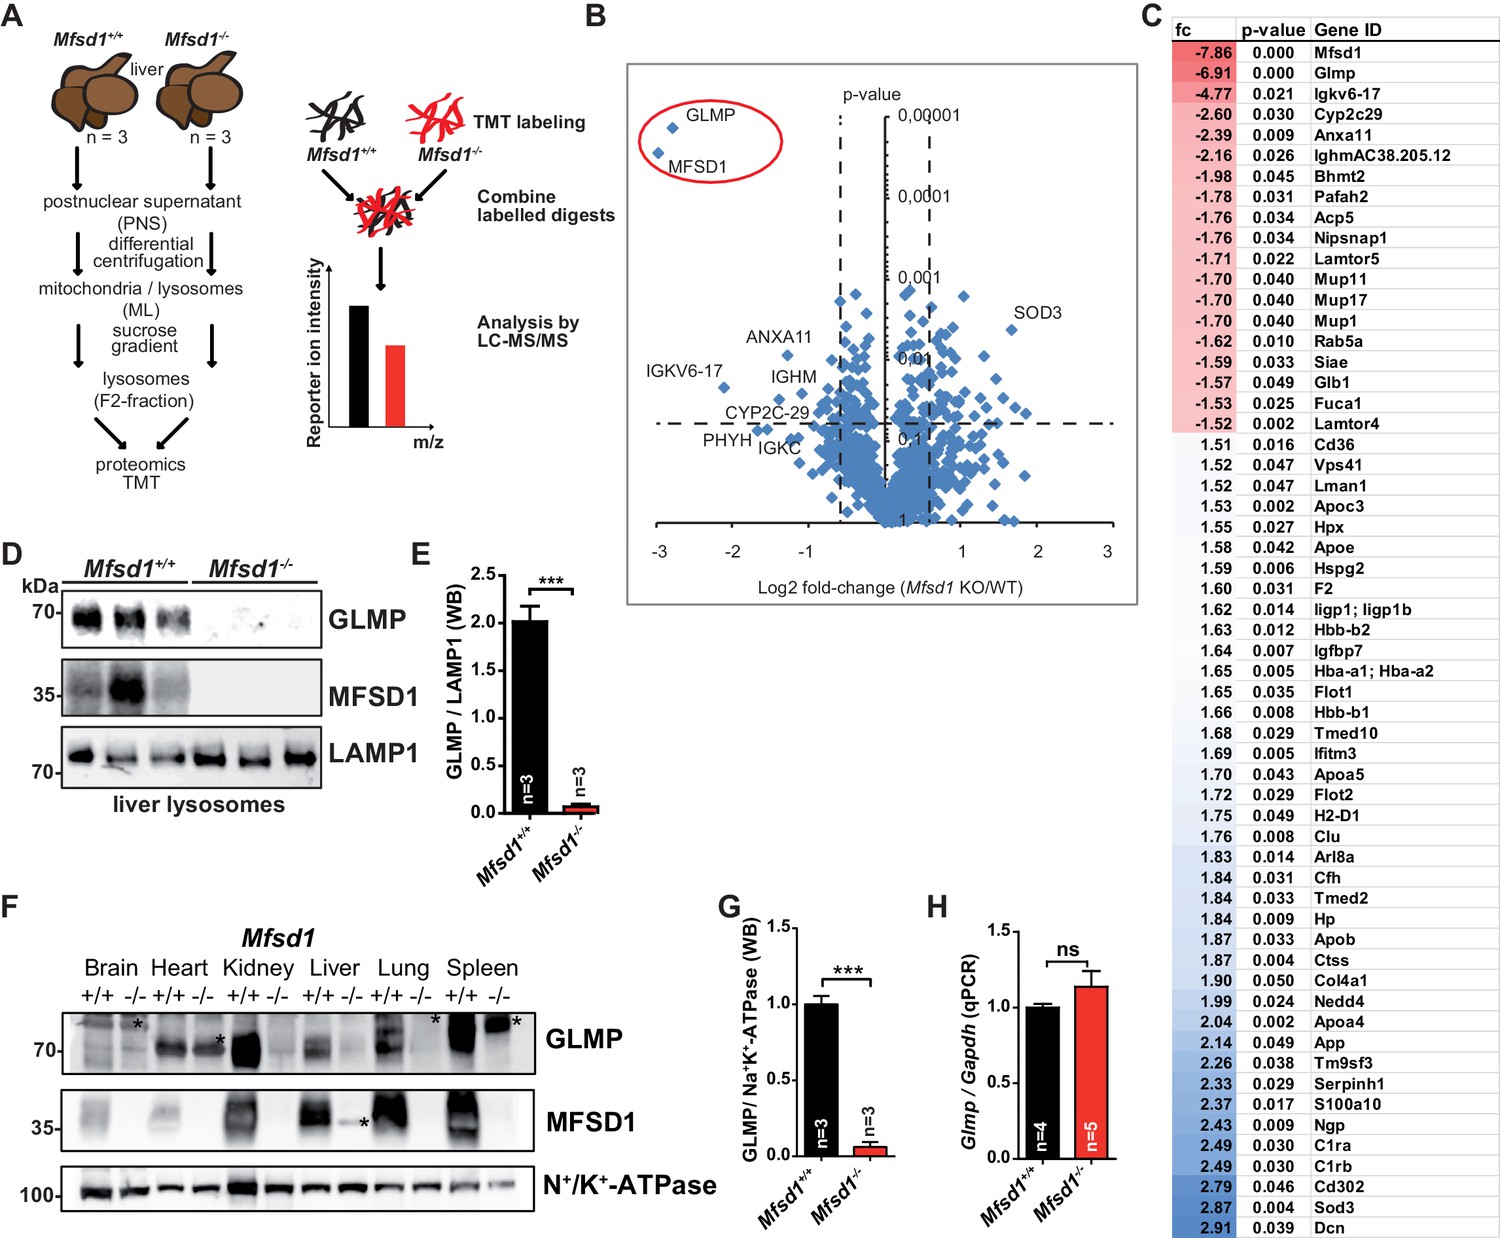
Deficiency of MFSD1 leads to specific depletion of GLMP.
(A) Scheme of the experimental workflow for subcellular fractionation and purification of lysosomes from the liver followed by Tandem Mass Tag (TMT)- based differential proteomics. (B) Volcano-plot representation of differential protein levels of isolated liver lysosomes from wildtype and Mfsd1 KO mice determined by mass spectrometry. n = 3. (C) Full list of proteins with differential expression levels between wildtype and Mfsd1 KO mice with a fold change >1.5 (blue)/−1.5 fold (red) and a p-value<0.05. (D) Immunoblot of isolated liver lysosomes from wildtype and Mfsd1 KO mice with antibodies against GLMP, MFSD1 and LAMP1. A quantification of the GLMP levels normalized to LAMP1 levels is depicted. (E) Quantification of the immunoblot depicted in (D). The ratio between the MFSD1 signal and the LAMP1 signal is shown. (F) Immunoblot of crude membrane extracts of the indicated tissues from wildtype and Mfsd1 KO mice for GLMP and MFSD1. N+/K+-ATPase is depicted as a loading control. An unspecific band is labeled with an asterisk. (G) A quantification of the immunoblot-signals for the GLMP levels in liver normalized to N+/K+-ATPase levels is depicted ***=p < 0.0001; n = 3. (H) qPCR of liver total mRNA from wildtype and Mfsd1 KO mice with primers specific for Glmp. Glmp transcript levels are normalized to Gapdh expression and expressed as fold change compared to the wildtype. ***=p < 0.0001; n = 3.
Figure 4
GLMP is essential for the maintenance of MFSD1 levels.
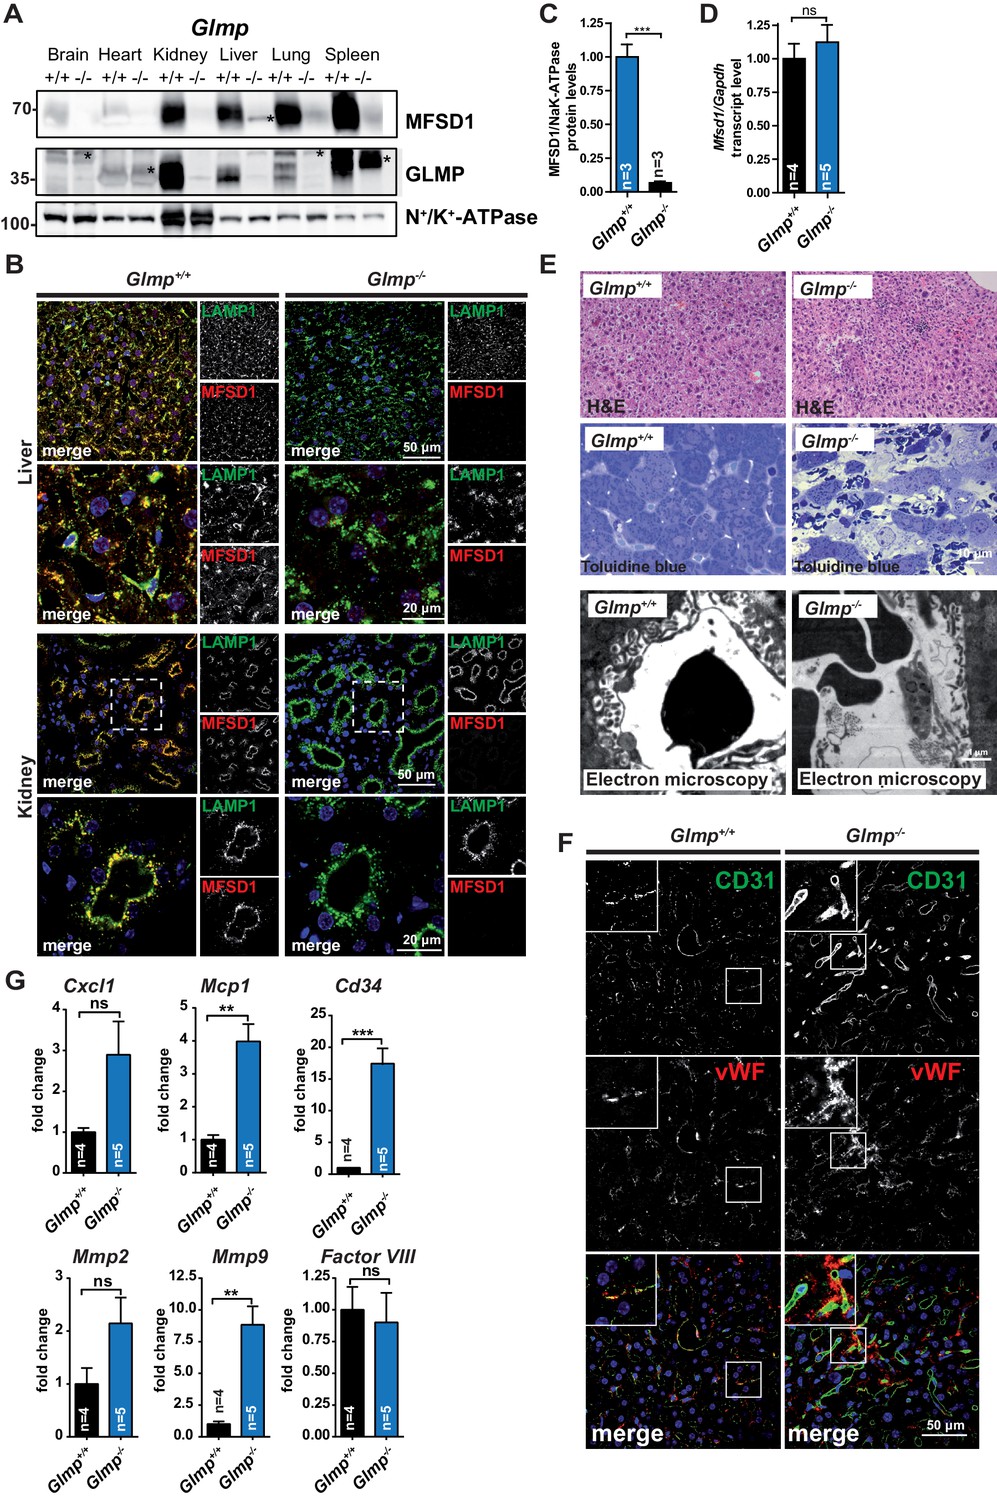
(A) Immunoblot of crude membrane extracts of the indicated tissues from wildtype and Glmp KO mice with antibodies against MFSD1 and GLMP. N+/K+-ATPase is depicted as a loading control. An unspecific band is labeled with an asterisk. Quantification of the MFSD1 levels in liver normalized to N+/K+-ATPase levels is depicted ***=p < 0.0001; n = 3. (B) Immunofluorescence staining of liver- (upper panel) and kidney-sections (lower panel) of wildtype and Glmp KO mice for MFSD1 (red) and LAMP1 (green). Nuclei are stained with DAPI (blue). (C) A quantification of the immunoblot-signals for the MFSD1 levels in liver normalized to N+/K+-ATPase levels is depicted ***=p < 0.001; n = 3. (D) qPCR of liver total mRNA from wildtype and Glmp KO mice with primers specific for Mfsd1. Mfsd1 transcript levels are normalized to Gapdh expression and expressed as fold change compared to the wildtype. ***=p < 0.0001; n = 3. (E) Hematoxylin and Eosin and Toluidine blue stainings and representative electron microscopy of liver sections of wildtype and Glmp KO mice (age: 14 weeks). (F) Representative immunofluorescence stainings of CD31 (green) and von Willebrand factor (vWF) (red) of liver sections from wildtype and GLMP KO mice. (G) qPCR of liver total mRNA from wildtype and Glmp KO mice with primers specific for Cxcl1, Mcp1, Cd34, Mmp2, Mmp9 and Factor VIII. *=p < 0.05; ***=p < 0.0001. n = 4–5.
Figure 5 with 1 supplement
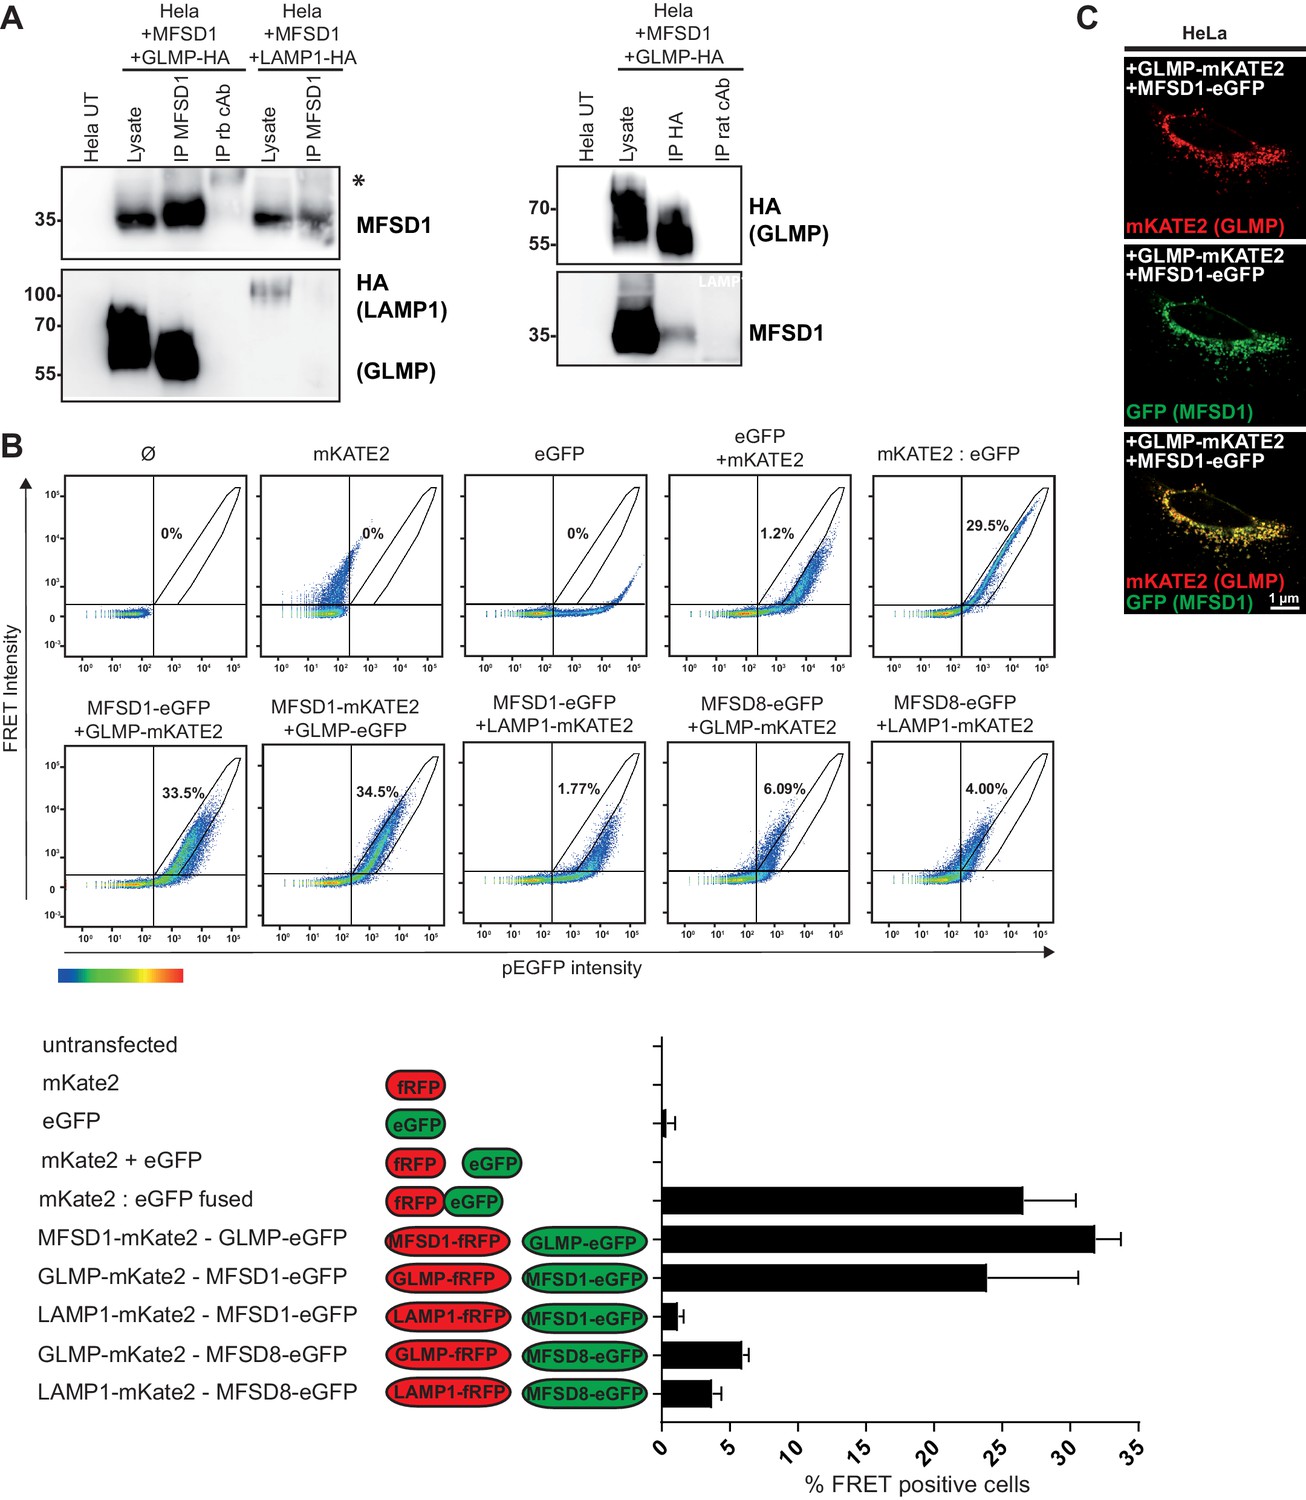
MFSD1 and GLMP physically interact.
(A) Co-immunoprecipitation of untagged MFSD1 and HA-tagged GLMP from transfected HeLa cell lysates with antibodies against HA and MFSD1. Isotype-matched primary antibodies (rb = rabbit) where used for immunoprecipitation as negative-controls. LAMP1 and GLMP were detected with the HA antibody, MFSD1 was detected with the MFSD1 antibody. (B) Flow cytometry-based FRET analysis of HeLa cells transfected with combinations of plasmids coding for MFSD1, GLMP, LAMP1 or MFSD8 tagged to either eGFP or mKATE2. FRET intensity is plotted against eGFP intensity. Cells inside the gate defined by the intensity of cells expressing fused eGFP:mKATE2 were considered FRET+. The number in the plot represents the average of the FRET+ cells alive for each condition, which is also represented in the bar graph. (C) Immunofluorescence of HeLa cells transfected with GLMP fused to mKATE2 (red) and MFSD1 fused to GFP (green). Both fusion proteins show a high degree of co-localization.
Figure 5—figure supplement 1
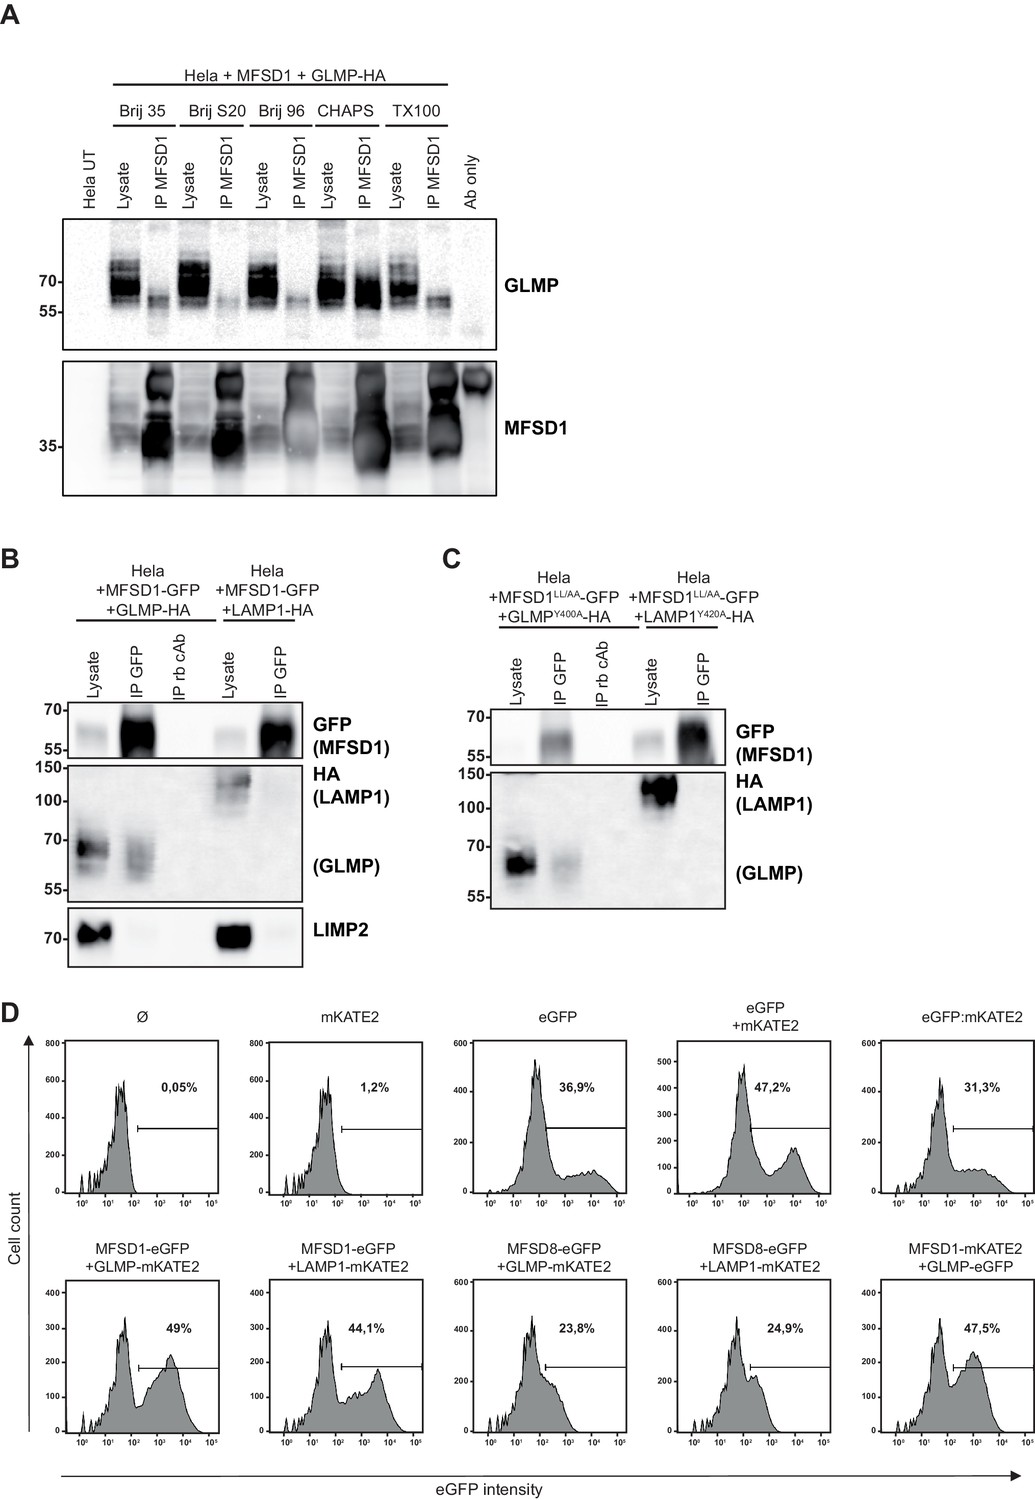
Screening of different detergents for the MFSD1-GLMP-interaction by co-immunoprecipitation and additional controls for FACS-based FRET and immunoprecipitation.
(A) Co-immunoprecipitation of untagged MFSD1 and HA-tagged GLMP from transfected HeLa cell lysates solubilized with different detergents with antibody against MFSD1. (B) Co-immunoprecipitation of C-terminal GFP-tagged MFSD1 and HA-tagged GLMP from transfected HeLa cell lysates solubilized with CHAPS. MFSD1-GFP was precipitated using an antibody against GFP or an unspecific control antibody (cAb). HA-tagged GLMP and LAMP1 (included as a negative control) were detected by immunoblot with an antibody against HA. LIMP2 was detected as an additional control and was exclusively detected in the lysates, but not the GFP-precipitate. (C) Co-immunoprecipitation of C-terminal GFP-tagged MFSD1LL/AA PM mutant and HA-tagged GLMPY400A from transfected HeLa cell lysates solubilized with CHAPS. MFSD1LL/AA-GFP was precipitated using an antibody against GFP or an unspecific control antibody (cAb). HA-tagged GLMPY400A and LAMP1Y414A (PM localized LAMP1 variant included as a negative control) were detected by immunoblot with an antibody against HA. (D) Plot of the GFP intensity of the HeLa cells transfected with different plasmids used for the flow cytometry-based FRET analysis. The number in the plot represents the percentage of GFP+ cells alive for each condition.
Figure 6 with 1 supplement
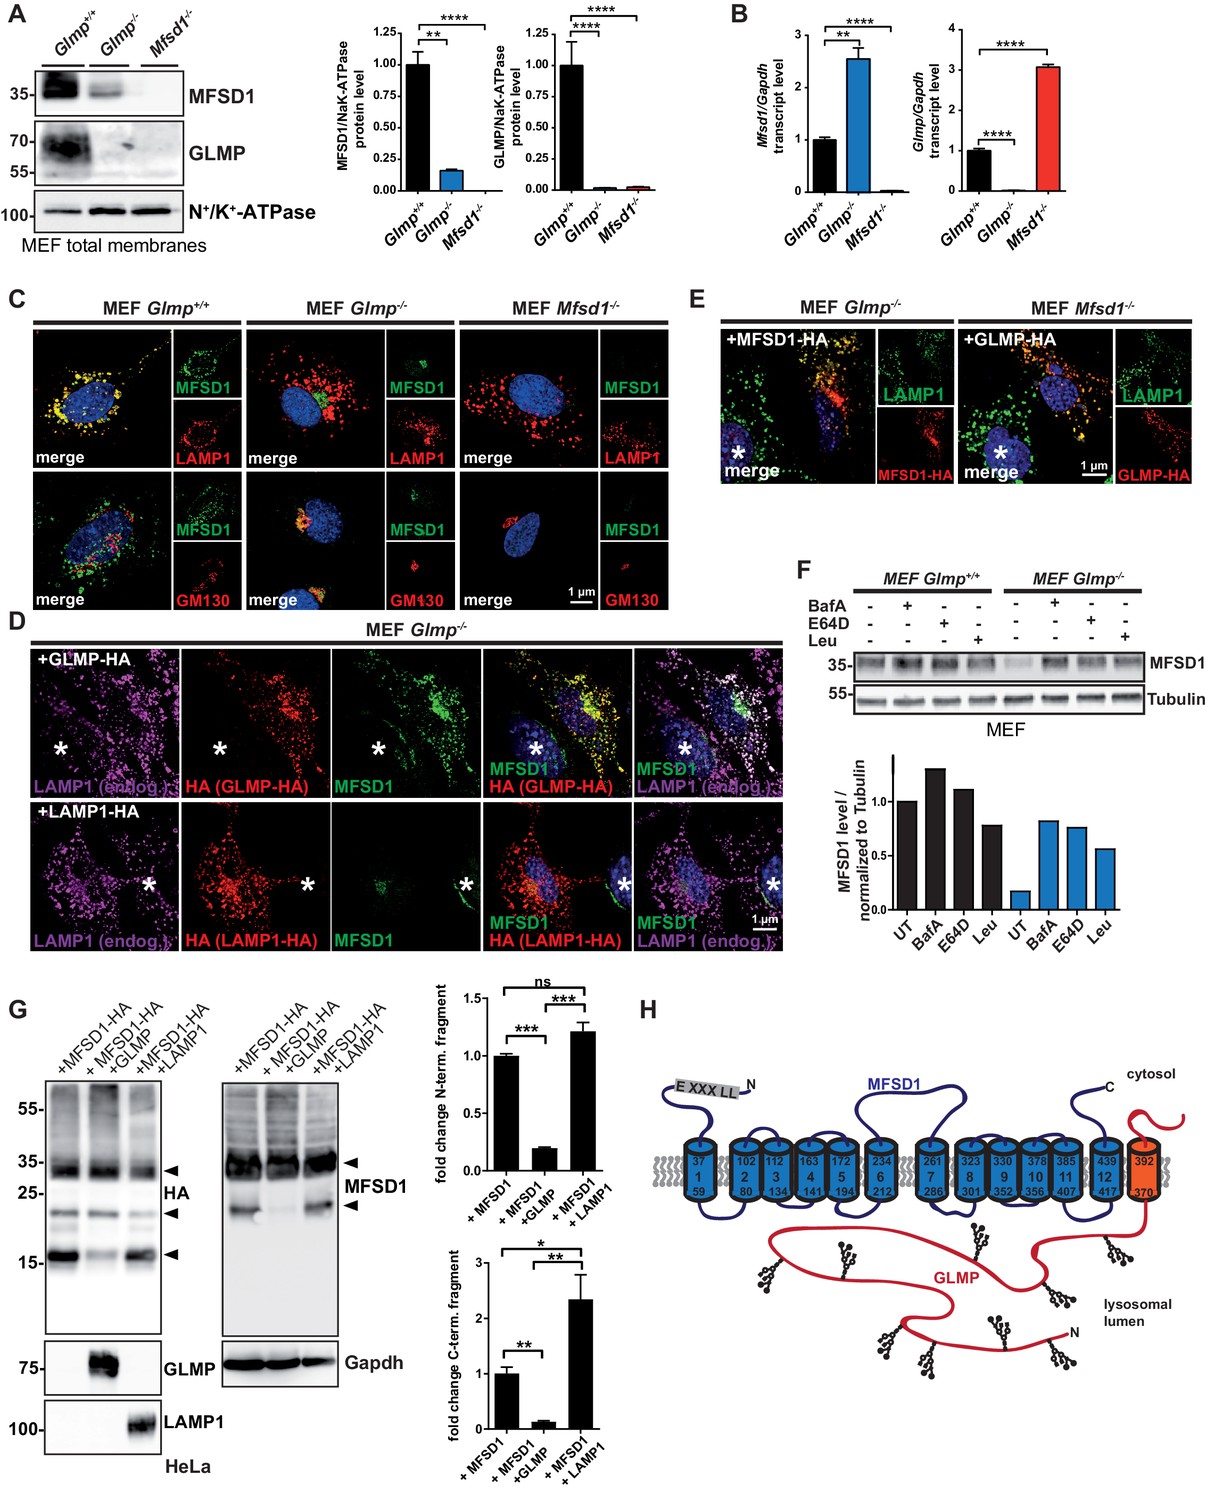
The interaction between MFSD1 and GLMP is dispensable for trafficking to lysosomes and GLMP protects MFSD1 from proteolytic degradation.
(A) Immunoblot of crude membrane extracts of wildtype, Glmp KO and Mfsd1 KO MEFs with antibodies against GLMP and MFSD1. N+/K+-ATPase is depicted as a loading control. A quantification of the GLMP and MFSD1 levels in MEFs normalized to N+/K+-ATPase levels is depicted ***=p < 0.0001; n = 3. **=p < 0.001; n = 3. (B) qPCR of MEF total mRNA from wildtype, Glmp KO and Mfsd1 KO mice with primers specific for Mfsd1 and Glmp. Mfsd1/Glmp transcript levels are normalized to Gapdh expression and expressed as fold change compared to the wildtype. ***=p < 0.0001; n = 3. (C) Co-immunofluorescence of wildtype, Glmp KO and Mfsd1 KO MEFs for endogenous MFSD1 (green) together with LAMP1 (upper panel, red) and the Golgi-marker GM130 (lower panel; red). (D) Co-immunofluorescence staining of MEFs from wildtype and Glmp KO mice transfected with HA-tagged GLMP (upper panel) or HA-tagged LAMP1 (lower panel) for endogenous MFSD1 (green) together with LAMP1 (magenta) and antibody against HA (red) to detect HA-tagged GLMP and HA-tagged LAMP1. An untransfected cell is labeled with an asterisk. (E) Co-immunofluorescence staining of MEFs from Glmp KO and Mfsd1 KO mice ectopically overexpressing HA-tagged MFSD1 or GLMP, respectively, for HA (red). Endogenous LAMP1 (green) is stained as a lysosomal marker. (F) Immunoblot analysis for MFSD1 of wildtype and Glmp KO MEFs treated with the indicated inhibitors (BafA = Bafilomycin A; E64D, Leu = Leupeptin) for 16 hr. Tubulin is depicted as a loading control. (G) Immunoblots of lysates from HeLa cells transfected with HA-tagged MFSD1 alone, co-transfected with GLMP or co-transfected with LAMP1 with antibodies against the HA-tag, MFSD1, GLMP and LAMP1. Gapdh is depicted as a loading control. MFSD1-specific bands are labeled with arrow-heads. A quantification of the blots of the proteolytic fragments is depicted (***=p < 0.0001; **=p < 0.001, *=p < 0.05; n = 3). (H) Schematic representation of the topology of the two interacting proteins MFSD1 (blue) and GLMP (orange).
Figure 6—figure supplement 1
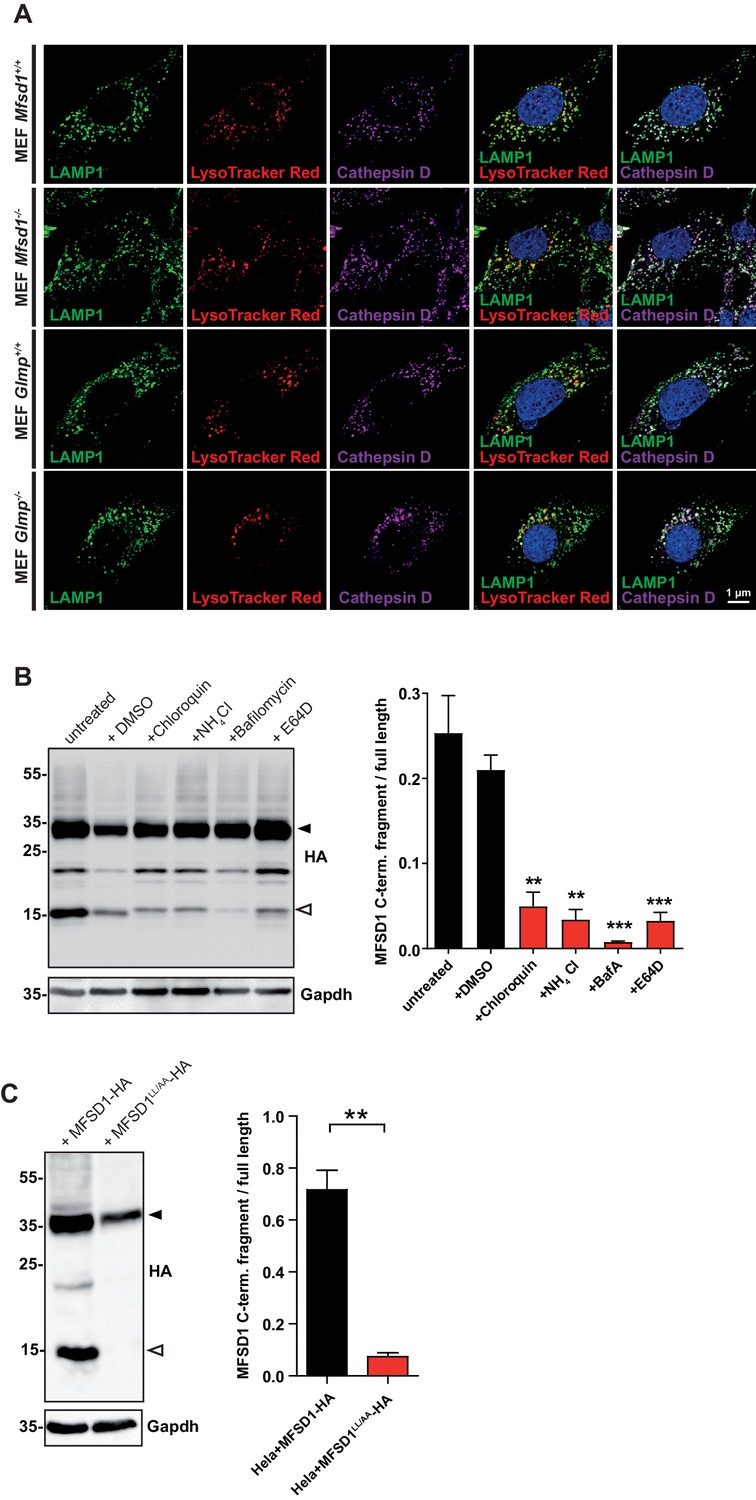
Treatment with lysosomal inhibitors decrease the generation of the MFSD1 C-terminal fragment.
(A) Immunocytochemistry of MEFs from the indicated genotypes from LAMP1 (green), cathepsin D (magenta) and LysoTracker staining (red). Nuclei are stained with DAPI (blue). (B) Immunoblot of HeLa cells transfected with C-terminally (HA)-tagged MFSD1 and treated 3 hr after transfection with 2.5% (v/v) DMSO, 40 µM chloroquine, 25 mM NH4Cl, 500 µM BafilomycinA or 20 µM E64D O/N with antibodies against HA and with Gapdh as loading control. A quantification of the signal intensity of the major C-terminal MFSD1-fragment (open asterisk) is depicted in relation to the signal intensity of the full-length MFSD1 protein (black asterisk) (***=p < 0.0001; **=p < 0.001; n = 3). (C) Immunoblot of HeLa cells transfected with C-terminally (HA)-tagged MFSD1 or MFSD1LL/AA-HA with antibodies against HA and with Gapdh as loading control. A quantification of the signal intensity of the major C-terminal MFSD1-fragment (open asterisk) is depicted in relation to the signal intensity of the full-length MFSD1 protein (black asterisk) (**=p < 0.001; n = 3).
Additional files
-
Supplementary file 1
TMT-based proteomic analysis of total liver homogenates.
Full list of proteins identified and quantified in three replicates of wildtype and Mfsd1 KO mouse liver samples. Accession numbers, GenId's and normalized abundance for each protein in each replicate are given.
- https://doi.org/10.7554/eLife.50025.017
-
Supplementary file 2
TMT-based proteomic analysis of isolated lysosomes from liver.
Full list of proteins identified and quantified in three replicates of wildtype and Mfsd1 KO mouse liver lysosome samples. Accession numbers, GenId's and normalized abundance for each protein in each replicate are given.
- https://doi.org/10.7554/eLife.50025.018
-
Supplementary file 3
Key Resources Table.
- https://doi.org/10.7554/eLife.50025.019
-
Transparent reporting form
- https://doi.org/10.7554/eLife.50025.020
Download links
A two-part list of links to download the article, or parts of the article, in various formats.
Downloads (link to download the article as PDF)
Open citations (links to open the citations from this article in various online reference manager services)
Cite this article (links to download the citations from this article in formats compatible with various reference manager tools)
The lysosomal transporter MFSD1 is essential for liver homeostasis and critically depends on its accessory subunit GLMP
eLife 8:e50025.
https://doi.org/10.7554/eLife.50025


