The guide sRNA sequence determines the activity level of box C/D RNPs
- European Molecular Biology Laboratory, Structural and Computational Biology, Germany
- Leibniz University Hannover, Centre for Biomolecular Drug Research, Germany
- University Grenoble Alpes, CEA, CNRS IBS, France
- Institut Laue-Langevin, France
- Helmholtz Centre for Infection Research, Group of Structural Chemistry, Germany
Figures
Figure 1 with 6 supplements
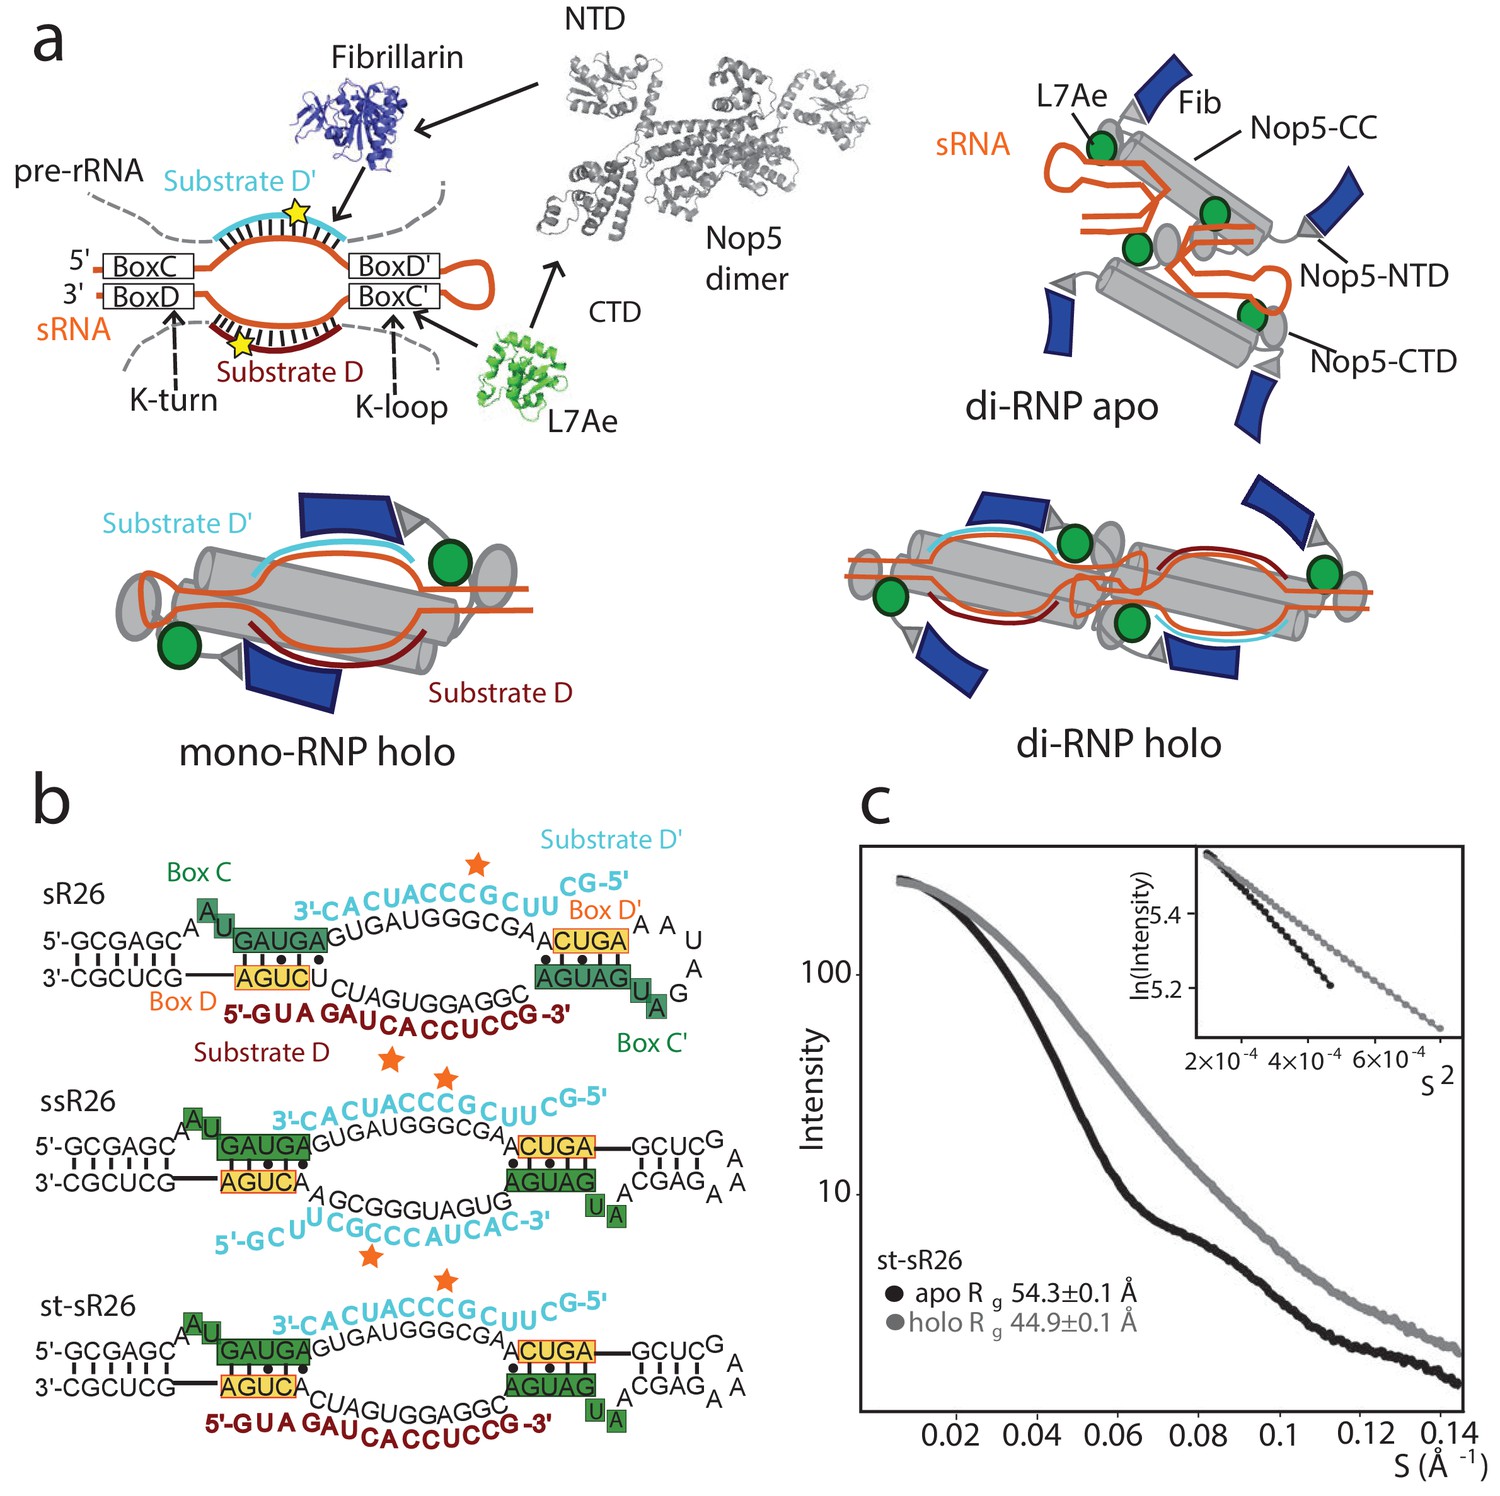
Oligomeric assembly states of the archaeal Box C/D RNP.
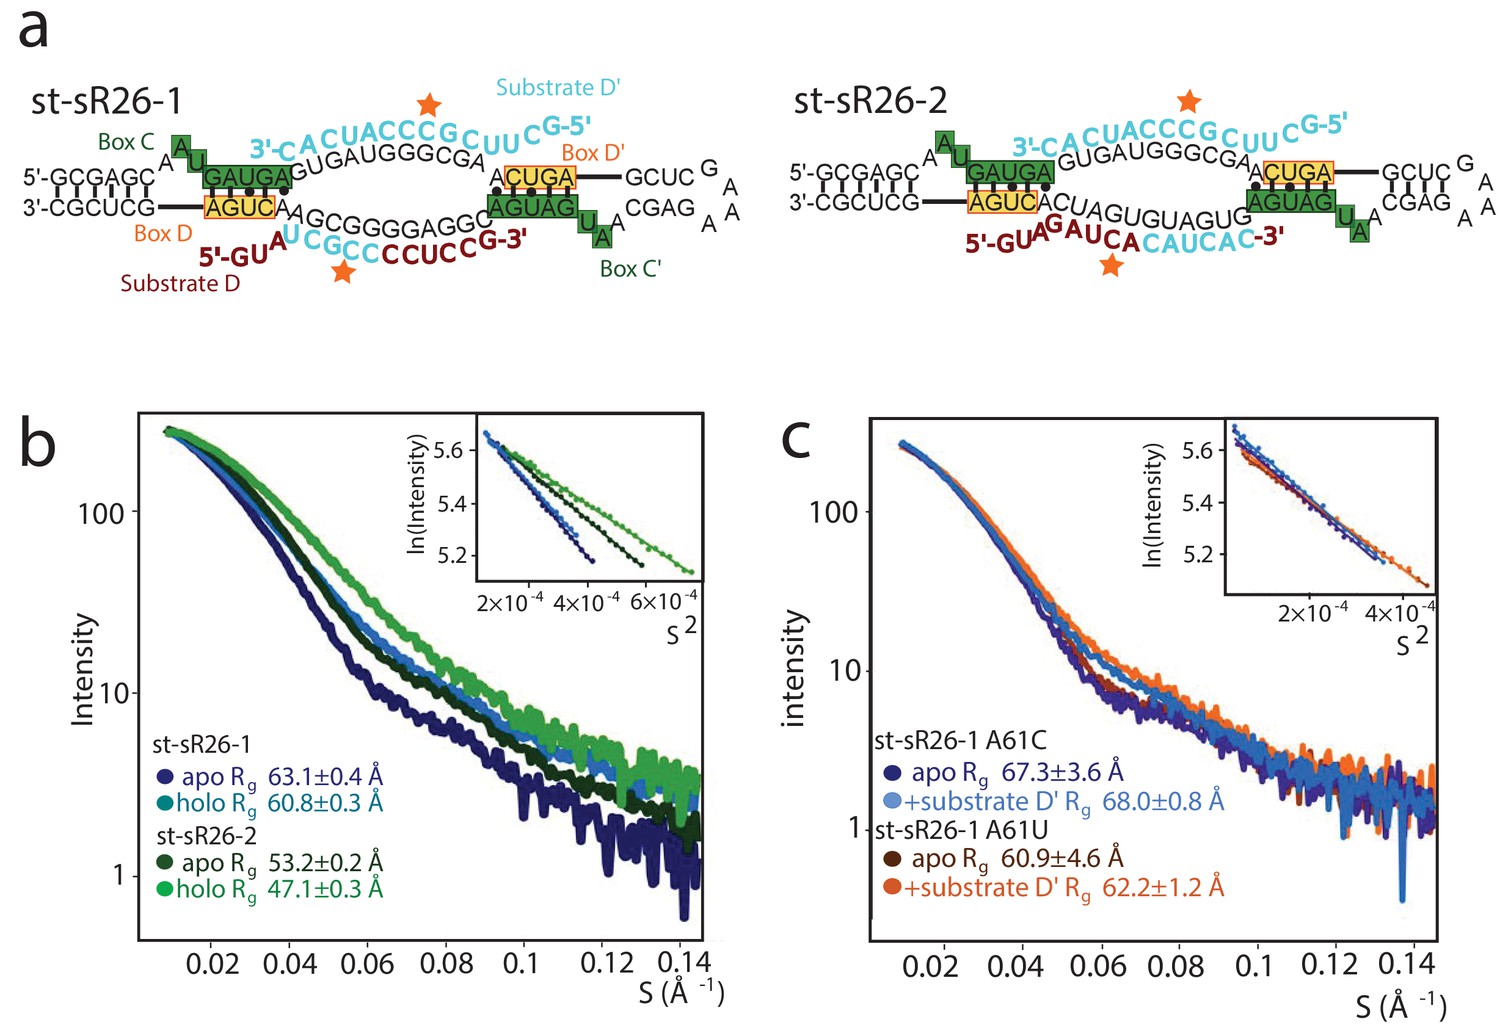
(a) Top-left: molecular components of the archaeal Box C/D sRNP. Top-right: schematic model of the apo sRNP. Bottom-left: schematic model of the holo mono-RNP from Lin et al. (2011) Bottom-right: schematic model of the holo di-RNP from Lapinaite et al. (2013). NTD: N-terminal domain; CTD: C-terminal domain; CC: coiled-coil. (b) Two RNA sequences (st-sR26 and ssR26) were derived from the Pf sR26 RNA and used to assemble the Box C/D sRNPs either in this (st-sR26) or previous studies (ssR26, Lapinaite et al., 2013). The sequence of st-sR26 is derived from the native sR26 RNA by substitution of the apical K-loop element with the more stable K-turn element. (c) SAXS curves with Guinier plots in the inserts of the Box C/D sRNPs reconstituted with st-sR26 before (apo) and after (holo) addition of 1.25 equivalents of each of substrate D and D’ at a concentration of 2 mg/ml. The transition from an apo di-RNP to a holo mono-RNP is evident from the respective Rg values (Figure 1—figure supplement 4). The data was collected at 40°C. All curves are scaled to the same forward scattering intensity.
Figure 1—figure supplement 1
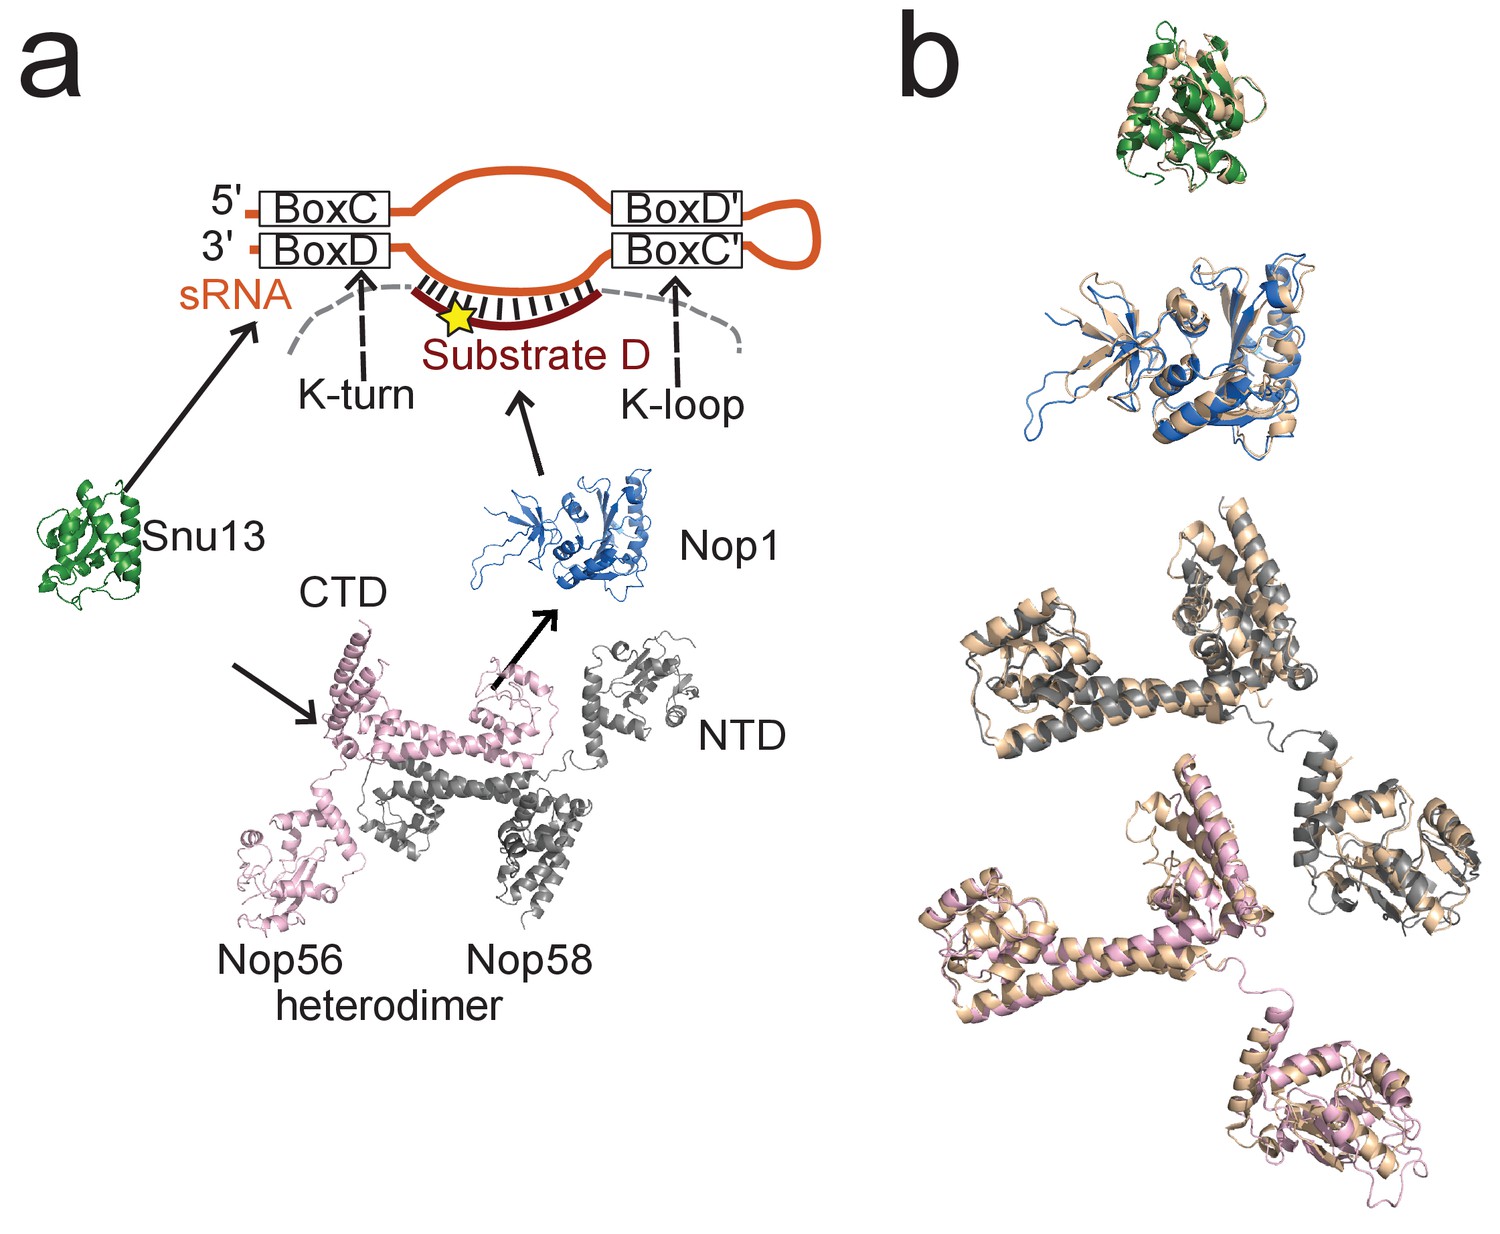
Conservation of the Box C/D RNP between archaea and yeast.
(a) Molecular components of the Box C/D snoRNP from S. cerevisiae. (b) Superposition of the structures of the yeast proteins (Snu13, Nop1, Nop56 and Nop58 are coloured green, blue, grey and pink, respectively) with the structures of their respective homologs in P. furiosus (all cream-colored). The Snu13 structure is from PDB entry 2ale; the structures of Nop1, Nop56 and Nop58 are taken from the structure of the U3 snoRNP present within the S. cerevisiae 90S pre-ribosome (PDB entry 5wyk). For Nop56 and Nop58, the CTD, coiled-coil and NTD domains are aligned onto the corresponding domains of Nop5 individually. The flexible loops connecting the domains in the eukaryotic proteins are not shown.
Figure 1—figure supplement 2
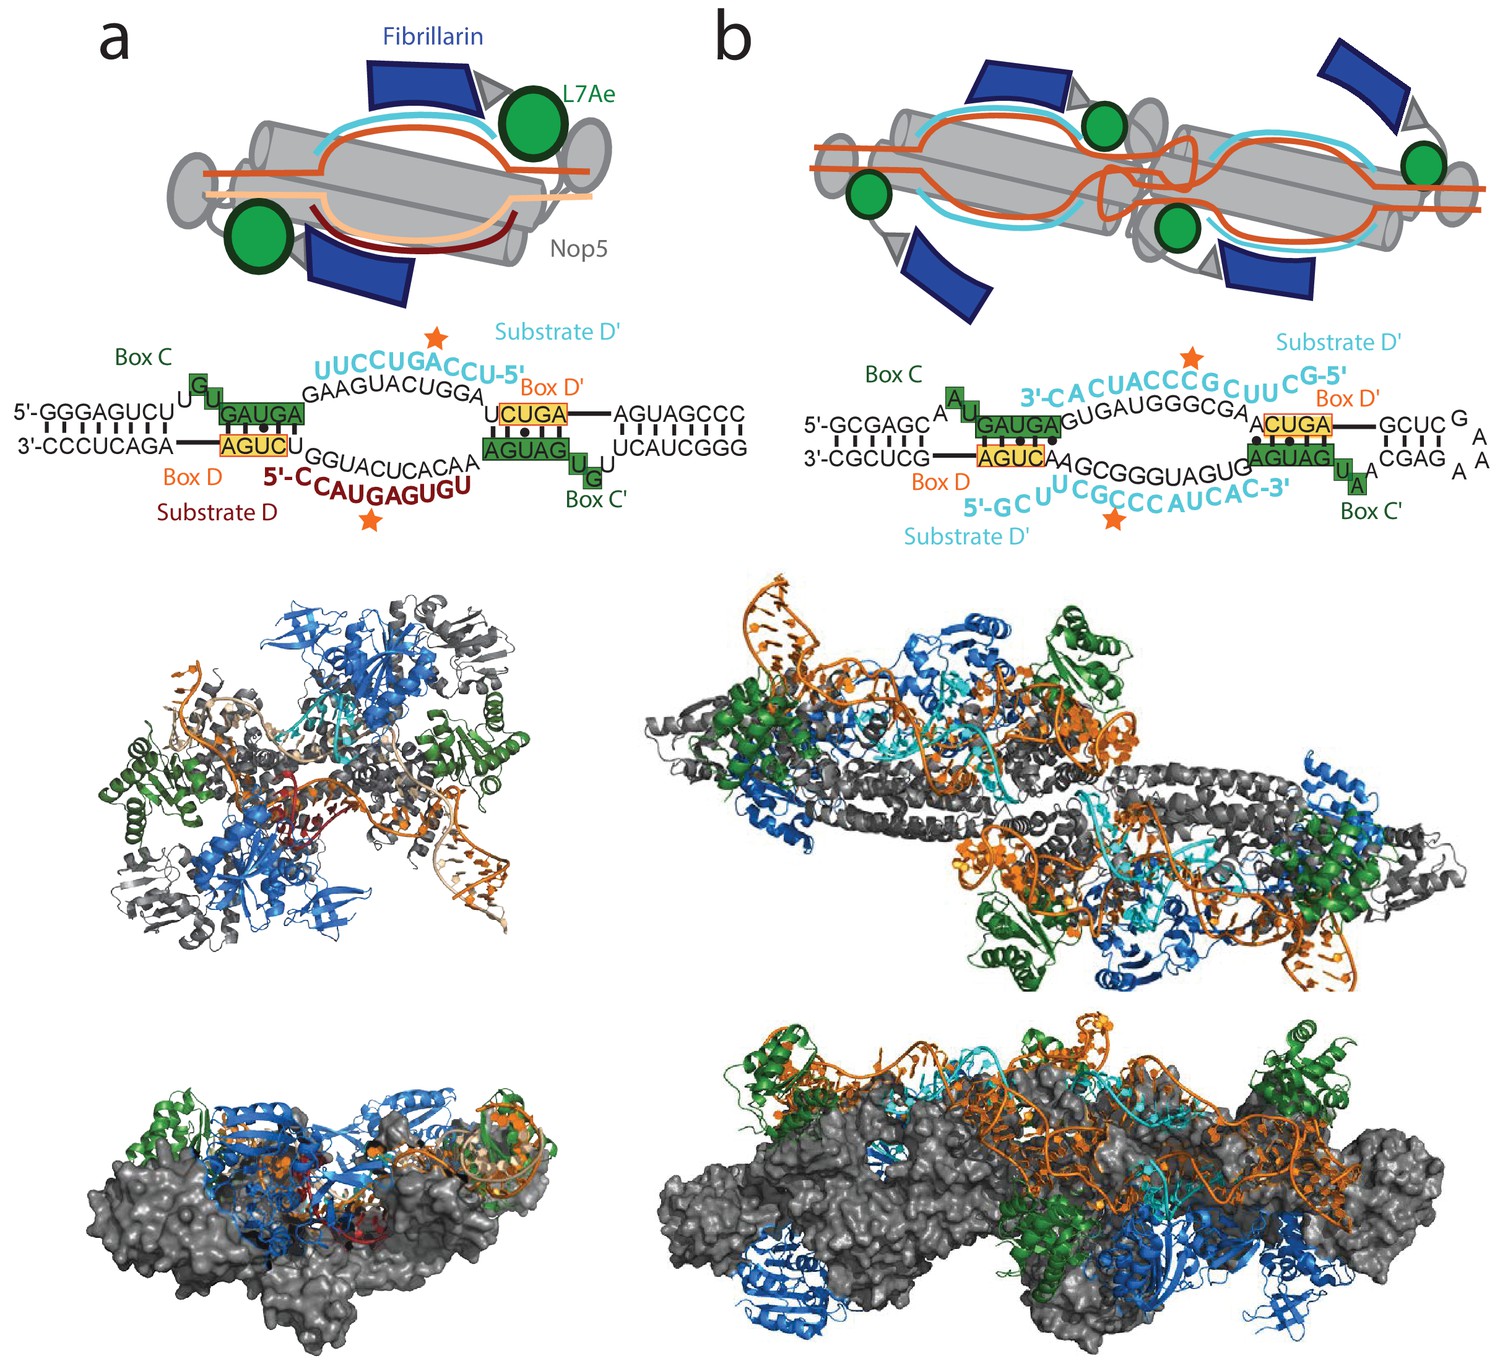
The mono- and di-RNP states of the archaeal holo sRNP.
(a) Top: schematic of the mono-RNP structure of the holo enzyme as observed by Lin et al. (2011). The sequence of the sRNA used in the study is displayed below the schematic. Middle: ribbon-representation of the crystallographic structure of the holo mono-RNP (PDB entry 3pla). Bottom: side-view of the structure with the Nop5 proteins displayed in surface-representation. Colour-code as in Figure 1. (b) Top: schematic of the di-RNP structure of the holo enzyme as observed by Lapinaite et al. (2013). The sequence of the sRNA used in the study is displayed below the schematic. Middle: ribbon-representation of the structure of the holo di-RNP (PDB entry 4by9). Bottom: side-view of the structure with the Nop5 proteins displayed in surface-representation.
Figure 1—figure supplement 3
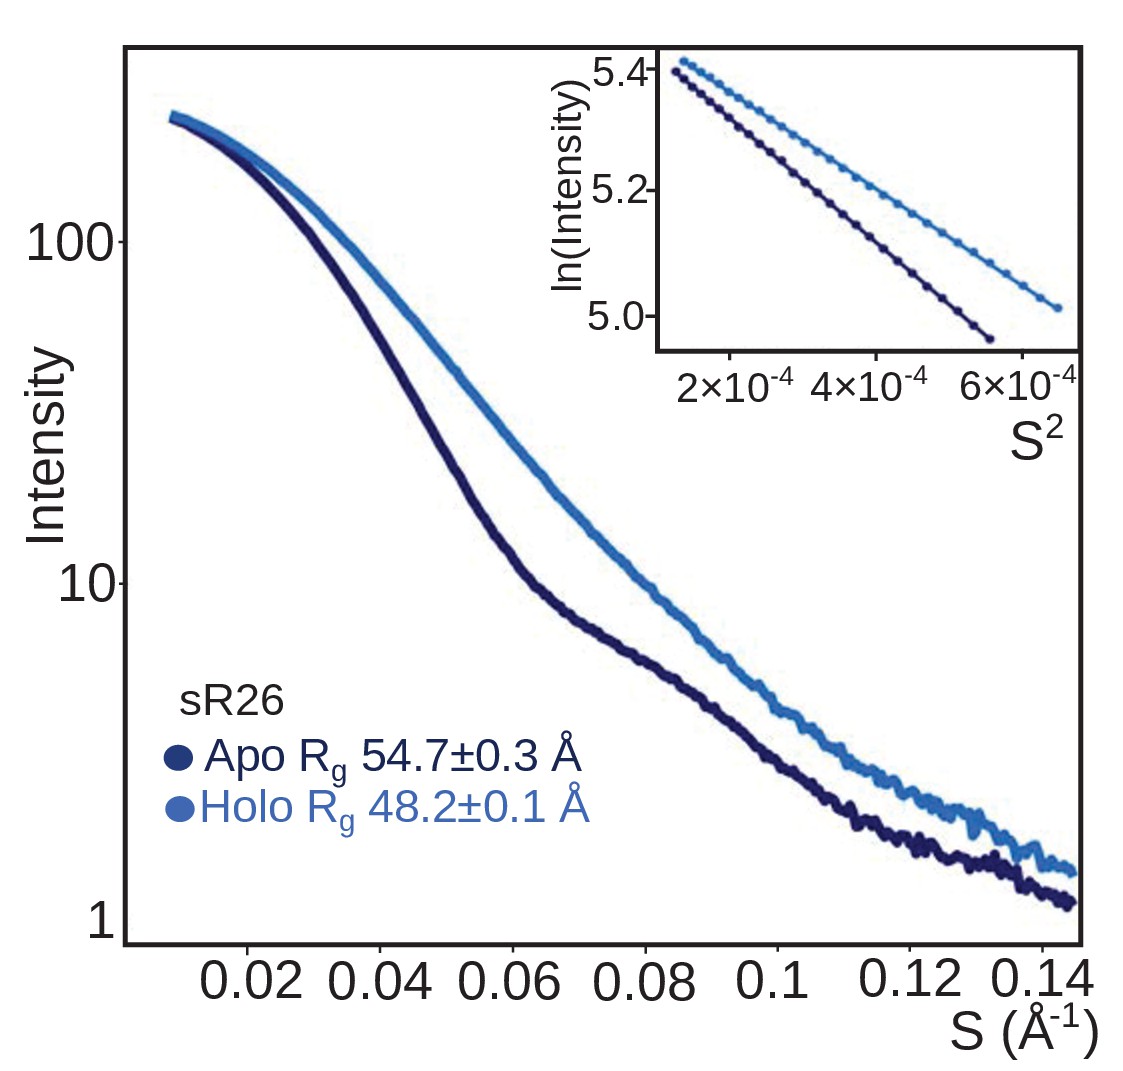
The sRNP assembled with sR26 has the same oligomerization behaviour as the sRNP assembled with st-sR26.
SAXS curves (with Guinier plots in the inserts) of the Box C/D sRNPs reconstituted with sR26 before (apo) and after (holo) addition of 1.25 equivalents of each of substrate D and D’ at a concentration of 2 mg/ml. As for the st-sR26 RNP, the transition from an apo di-RNP to a holo mono-RNP is evident from the respective Rg values (Figure 1—figure supplement 4). The data was collected at 40°C. All curves are scaled to the same forward scattering intensity.
Figure 1—figure supplement 4
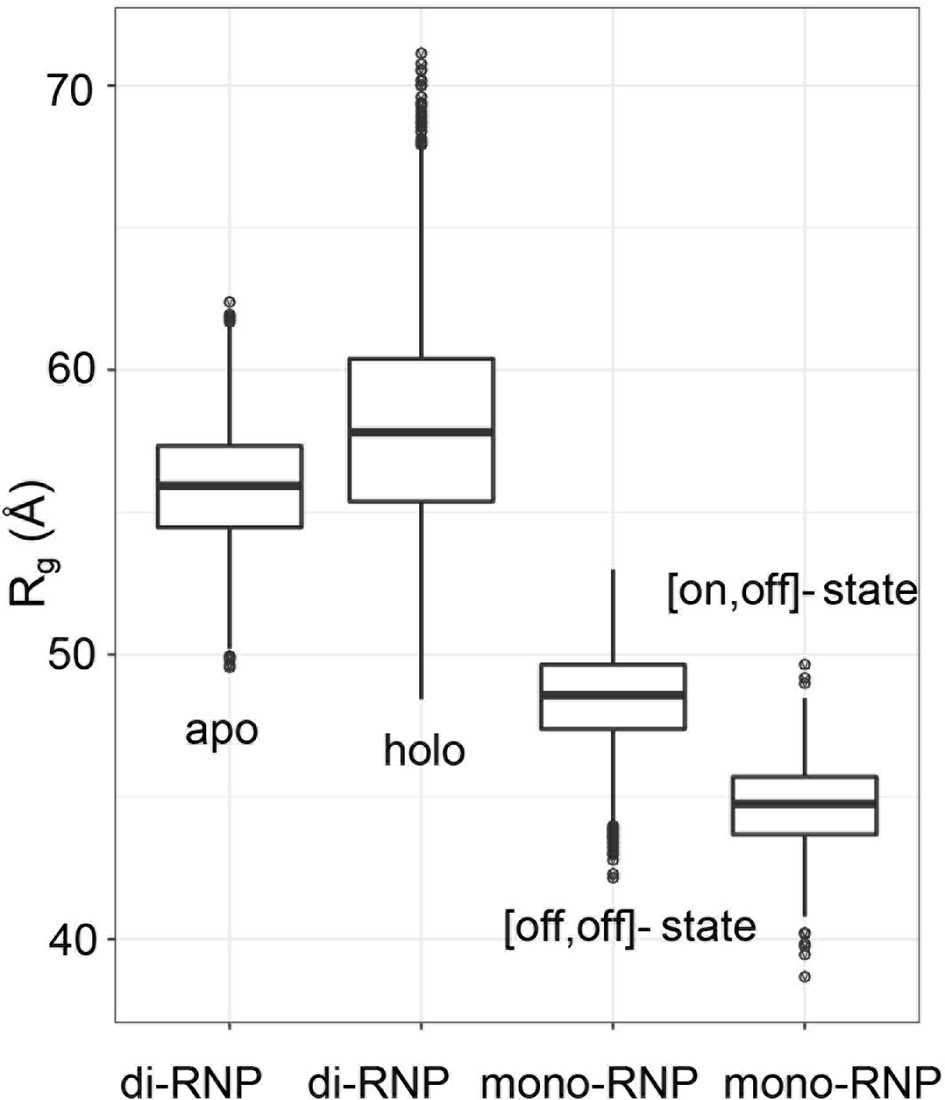
Ranges of radii of gyration for the mono- and di-RNP states of the archaeal sRNP.
Theoretical Rg distributions for sRNPs in the di-RNP and mono-RNP configurations represented in a box-and-whisker plot. 50% of the data around the median (thick line in the box) is defined as one interquartile range (IQR) and represented as a box. The whiskers are 1.5 IQR in length. The di-RNP distributions refer to 5000 models of the apo and holo forms generated during the process of structure calculation in Lapinaite et al. (2013). The mono-RNP distributions refer to 500 models of half-loaded mono-RNPs generated by a torsion-angle simulated-annealing procedure as in Lapinaite et al. (2013) assuming that either one ([on,off]-state) or no ([off,off]-state) fibrillarin copy is bound to the substrate–guide duplex.
Figure 1—figure supplement 5
Dependence of the oligomeric state of the holo sRNPs on the substrate-recognition sequence of the guide RNA.
(a) Sequences of the sRNAs derived from the st-sR26. The guide D sequence has been substituted with chimeric sequences consisting of the 3’ half or 5’ half of the guide D’ sequence and the 5’ half or 3’ half of the guide D sequence in st-sR26-1 or st-sR26-2, respectively. (b) SAXS curves of Box C/D sRNPs reconstituted with st-sR26-1 (dark- and light-blue) and st-sR26-2 (dark- and light-green) in their apo and holo forms. The st-sR26-1 complex remains a di-RNP upon addition of 1.25 equivalents of each substrate, while the st-sR26-2 complex transitions from the di-RNP to the mono-RNP state. The data was collected at 50°C. All curves are scaled to the same forward scattering intensity. (c) SAXS curves of the sRNP reconstituted with the st-sR26-1 RNA sequence containing the A61U mutation at the 3’ end of guide D. Similar to st-sR26-1, the complex retains the di-RNP state upon addition of 1.1 molar equivalents of substrate D’, as shown by the Rg values (Figure 1—figure supplement 4). A similar behaviour is observed for the A61C mutation. The scattering curves were acquired at 40°C; Guinier plots are shown in the insets.
Figure 1—figure supplement 6
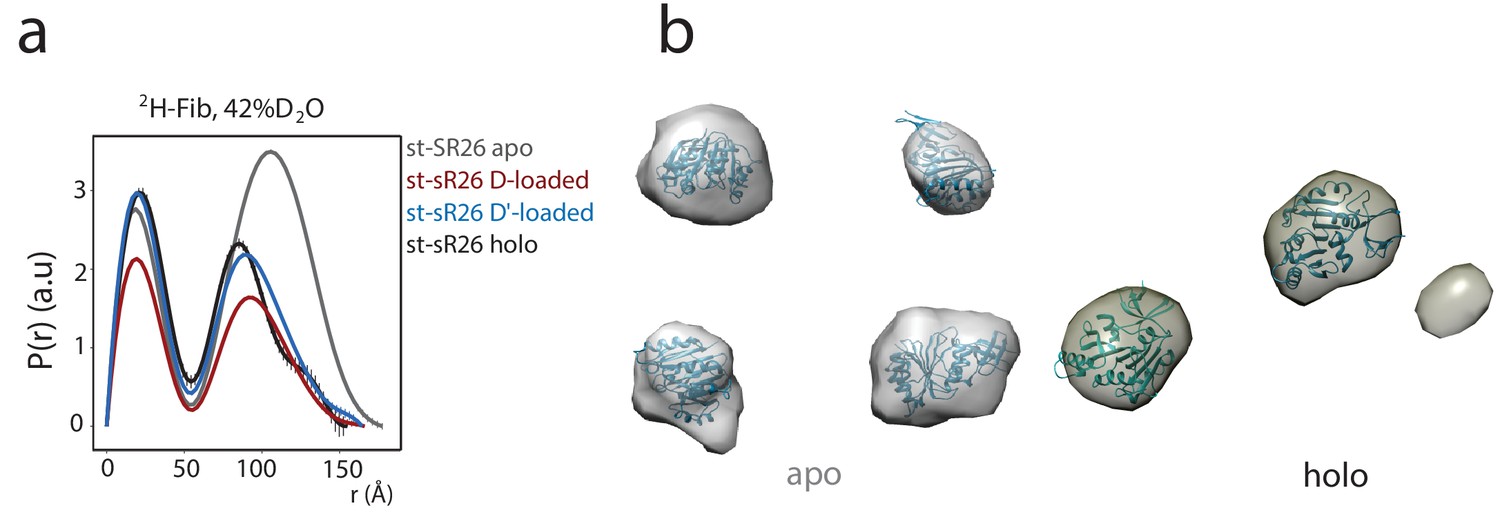
The SANS curves of 2H-Fib indicate the presence of either four or two copies of fibrillarin in the apo and substrate-loaded st-sR26 RNPs, respectively.
(a) P(r) distribution functions calculated from the 2H-Fib SANS curves acquired in 42%:58% D2O:H2O solvent mixture for the apo st-sR26 RNP (grey), the st-sR26 RNP loaded with substrate D (red), the st-sR26 RNP loaded with substrate D’ (light blue), the holo st-sR26 RNP (loaded with both substrates D and D’, black). Substrate RNAs were added at 1.25 molar equivalents. (b) Ab initio low-resolution envelopes computed using DAMMIN (Svergun, 1999) from the P(r) curves of the apo and holo complexes. Fibrillarin molecules are fitted into the envelopes using the program CHIMERA (Pettersen et al., 2004). The envelope representing the apo complex fits four fibrillarin copies, while that representing the holo complex can only fit two copies.
Figure 2 with 4 supplements
NMR and SAS of the half-loaded st-sR26 RNPs.
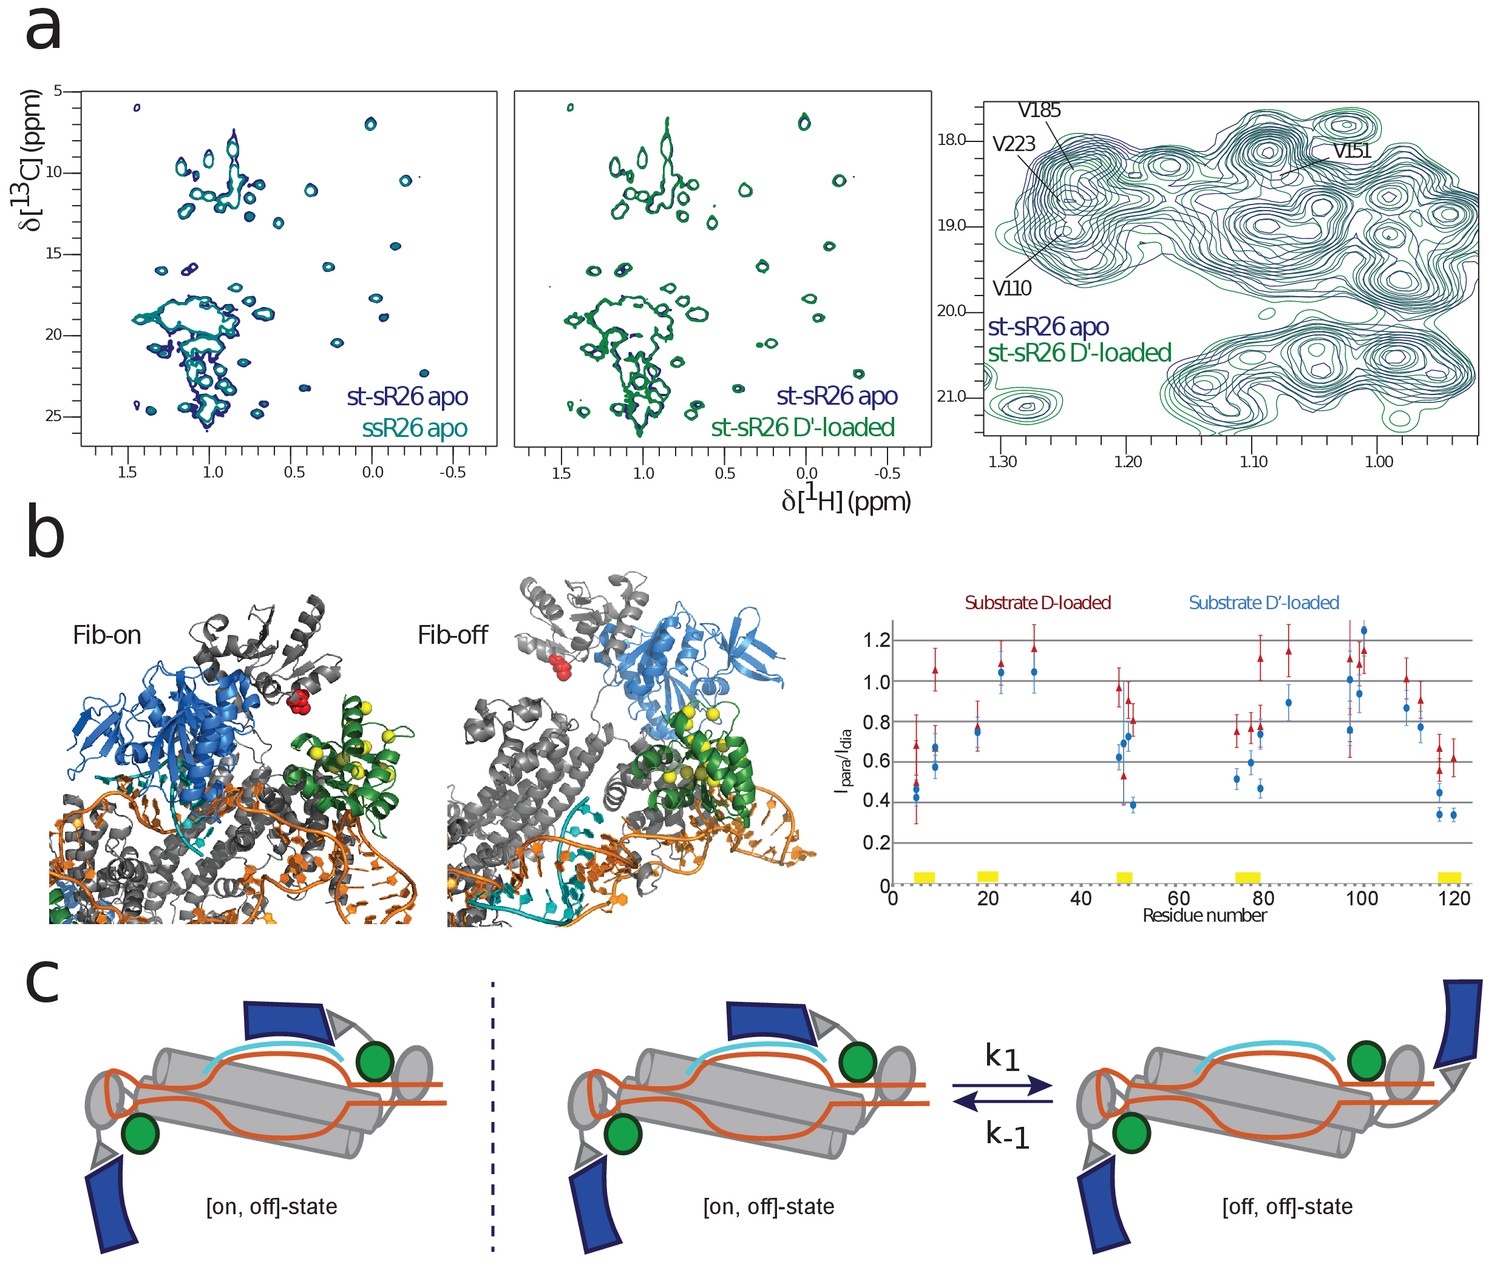
(a) Left, overlay of ILV-methyl 1H-13C spectra of fibrillarin in the apo ssR26 (turquoise) and apo st-sR26 (blue) RNPs. In both di-RNPs, all four fibrillarin copies are distant from the RNA and the two spectra are identical. Middle, overlay of ILV-methyl 1H-13C spectra of fibrillarin in the apo st-sR26 (blue) and substrate D’-loaded st-sR26 (green) RNPs. Right, expanded view of the overlay of ILV-methyl 1H-13C spectra of fibrillarin in the apo st-sR26 (blue) and substrate D’-loaded st-sR26 (green) RNPs. (b) Left, structural snapshots of the on- (left) and off- (right) states of one fibrillarin copy in the substrate D’-loaded mono-RNP. Upon binding of fibrillarin to the substrate–guide duplex, the Nop5-E65C spin-label (red) comes close to one L7Ae copy (green), leading to PRE intensity-ratios below 0.8 for the L7Ae-ILV residues shown as yellow spheres. In contrast, when fibrillarin is in the off-state (right), the Nop5-E65C spin-label is far from L7Ae and cannot induce any PRE-mediated attenuation of peak intensities. Colour-code as in Figure 1. Right, PRE effects (Ipara/Idia, ratio of the peak intensities when the spin-label is in the paramagnetic and diamagnetic state, respectively) of the Nop5-E65C tag on the L7Ae-ILV peaks in the substrate D-bound (red) and substrate D’-bound (blue) mono-RNPs. The yellow bars indicate the residues represented as yellow spheres in the left panel. (c) Left, cartoon representation of the [on,off]-conformer of the substrate D’-loaded mono-RNP; right, cartoon representation of the conformational equilibrium between the [on,off]- and [off,off]-conformers of the same complex.
Figure 2—figure supplement 1
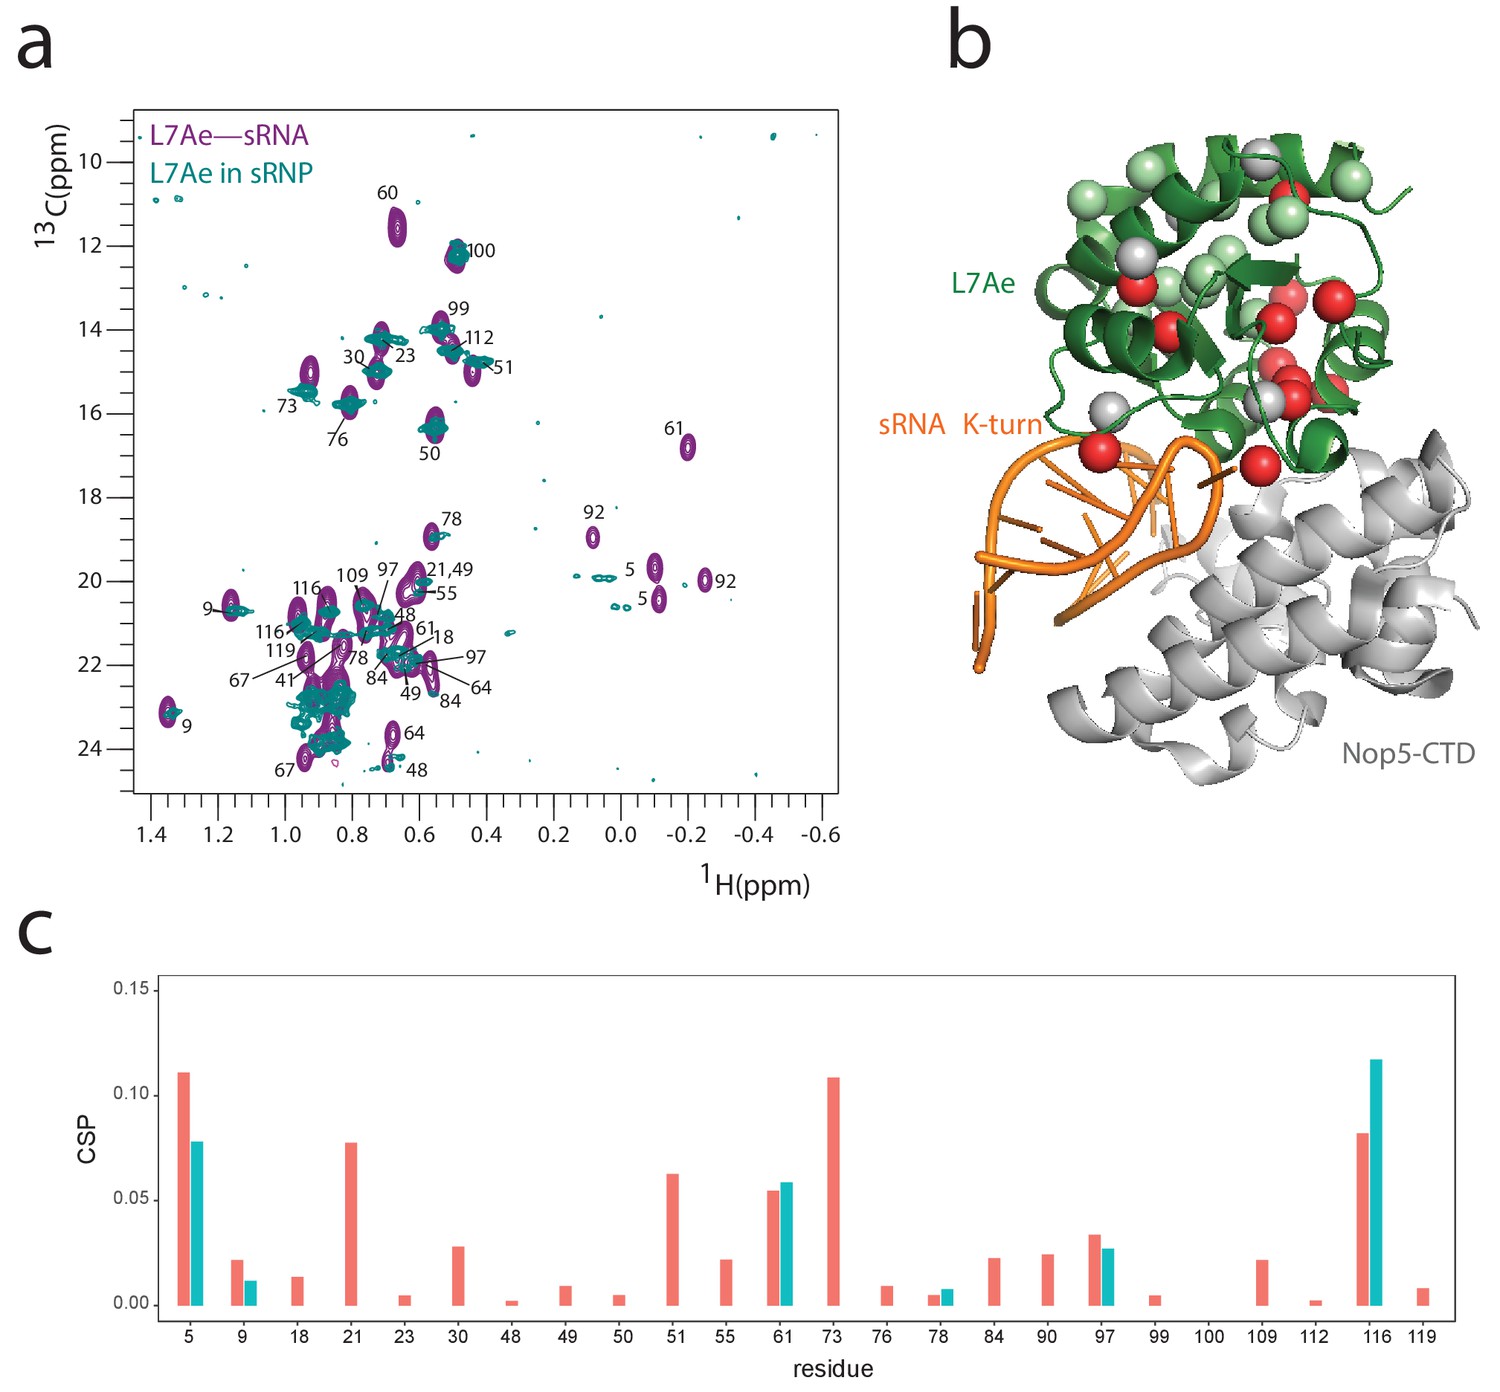
L7Ae in the Box C/D mono-RNP maintains the previously determined interaction interfaces with Nop5-CTD.
(a) Overlay of the 1H-13C methyl-group spectrum of L7Ae in complex with the K-turn sRNA (purple) and as part of the full st-sR26 RNP (turquoise). Methyl groups in contact with Nop5 in the full st-sR26 RNP are expected to show CSPs. (b) ILV amino acids with methyl groups showing CSPs greater than 0.05 ppm or disappearing in the spectra of a are shown in red (the spheres indicate Ile Cδ1, Val Cβ and Leu Cγ); they are mostly located at the interface with the Nop5-CTD, as predicted by the structure of PDB entry 3nmu. A few CSPs are located on the RNA side, as the RNAs in the L7Ae–K-turn sRNA complex and in the full st-sR26 RNP are slightly different in sequence and much different in length. ILV amino acids with methyl groups showing CSPs smaller than 0.05 ppm are shown in pale green, those for which data is not available are in grey. (c) Plot of the CSPs observed in the spectra of a versus L7Ae residue numbers. When values for both geminal methyl groups are available, they are displayed in different colours (red and light blue). Missing data indicates that the corresponding methyl groups are either not assigned or disappear in the spectrum of the st-sR26 RNP. CSPs were measured as recommended by Williamson (2013).
Figure 2—figure supplement 2
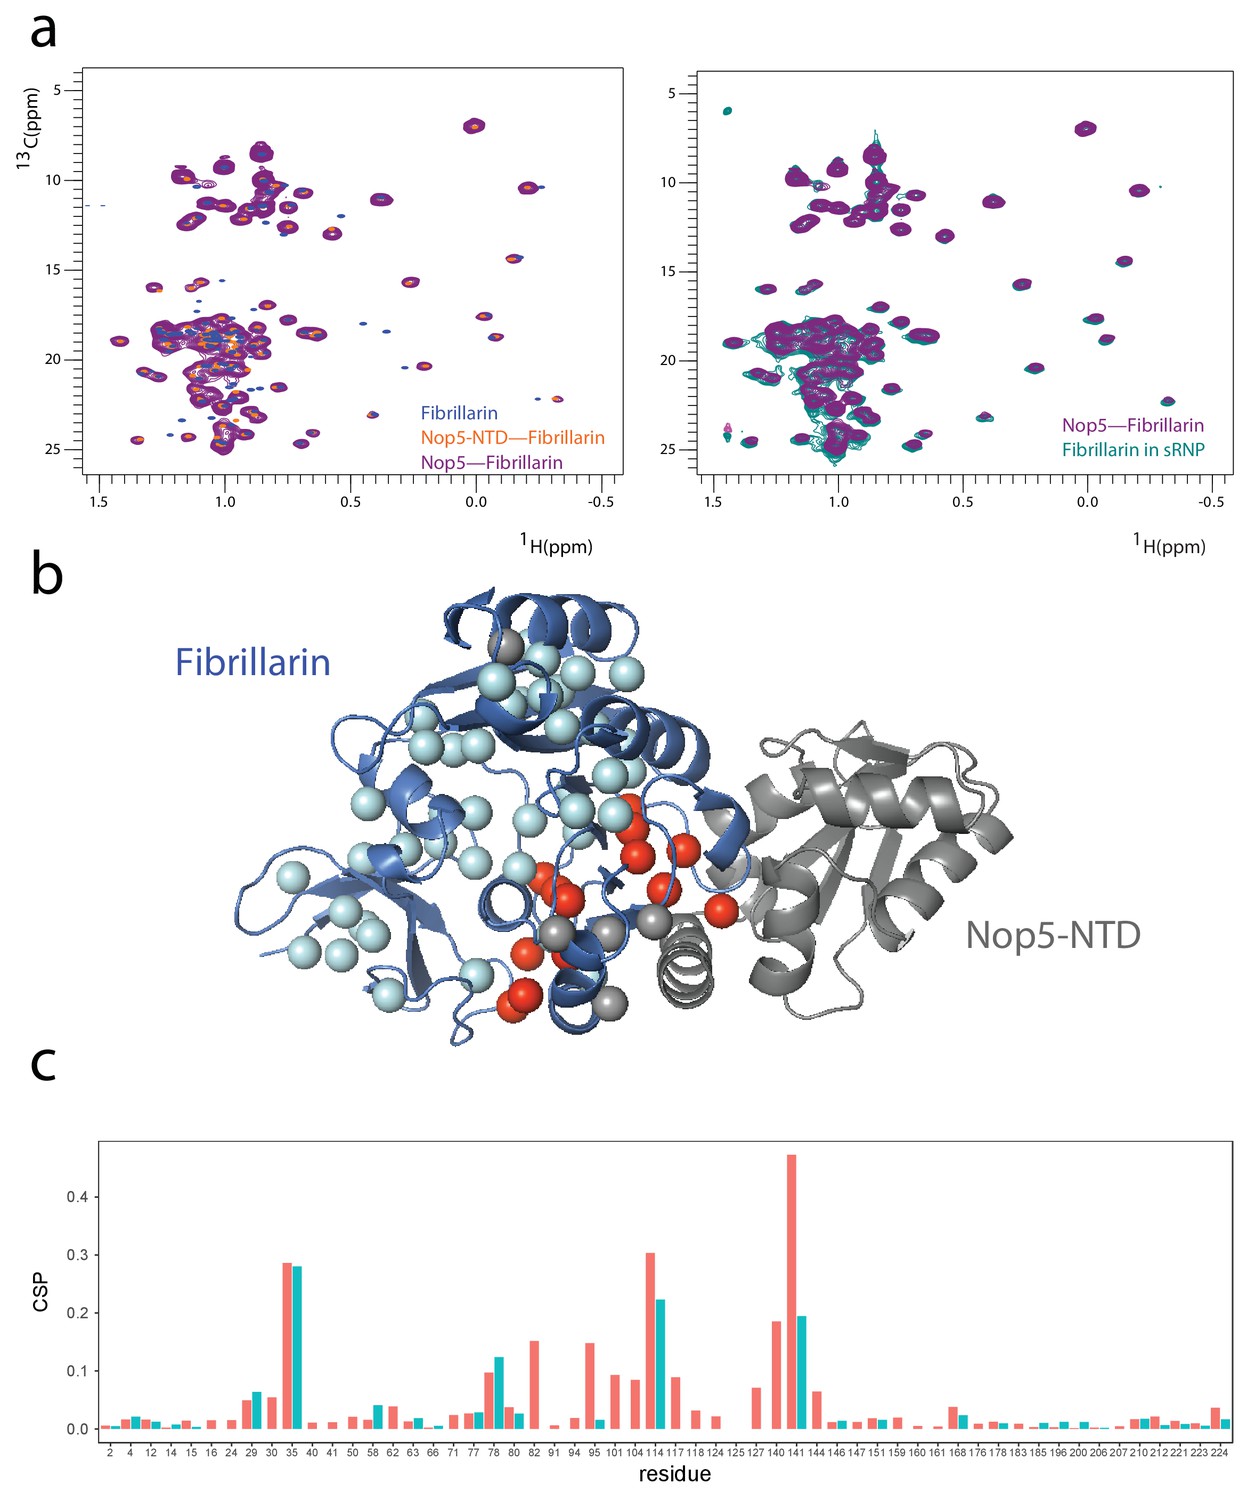
Fibrillarin in the Box C/D mono-RNP maintains the previously determined interaction interfaces with Nop5-NTD.
(a) Left, overlay of the 1H-13C methyl-group spectra of fibrillarin in isolation (blue), in complex with the Nop5-NTD (orange) and in complex with full-length Nop5 (purple). Right, overlay of the 1H-13C methyl-group spectra of fibrillarin in complex with Nop5 (purple) and as part of the Box C/D mono-RNP (turquoise). The orange, purple and turquoise spectra are identical demonstrating that fibrillarin interacts only with the Nop5-NTD in all complexes. (b) ILV amino acids with methyl groups showing CSPs greater than 0.05 ppm or disappearing in the spectra of a (blue vs orange) are shown in red (the spheres indicate Ile Cδ1, Val Cβ and Leu Cγ); they are all located at the interface with the Nop5-NTD, as predicted by the structure of PDB entry 3nmu. The Nop5-NTD–fibrillarin interface in the structure of PDB entry 3nmu is identical to the interface of all other Nop5–fibrillarin structures known to date. ILV amino acids with methyl groups showing CSPs smaller than 0.05 ppm are shown in cyan, those for which data is not available are in grey. CSPs were measured as recommended by Williamson (2013). (c) Plot of the CSPs observed in the spectra of a (blue vs orange) versus fibrillarin residue numbers. When values for both geminal methyl groups are available, they are displayed in different colours (red and light blue). Missing data indicates that the corresponding methyl groups are either not assigned or disappear in the spectrum of the st-sR26 RNP.
Figure 2—figure supplement 3
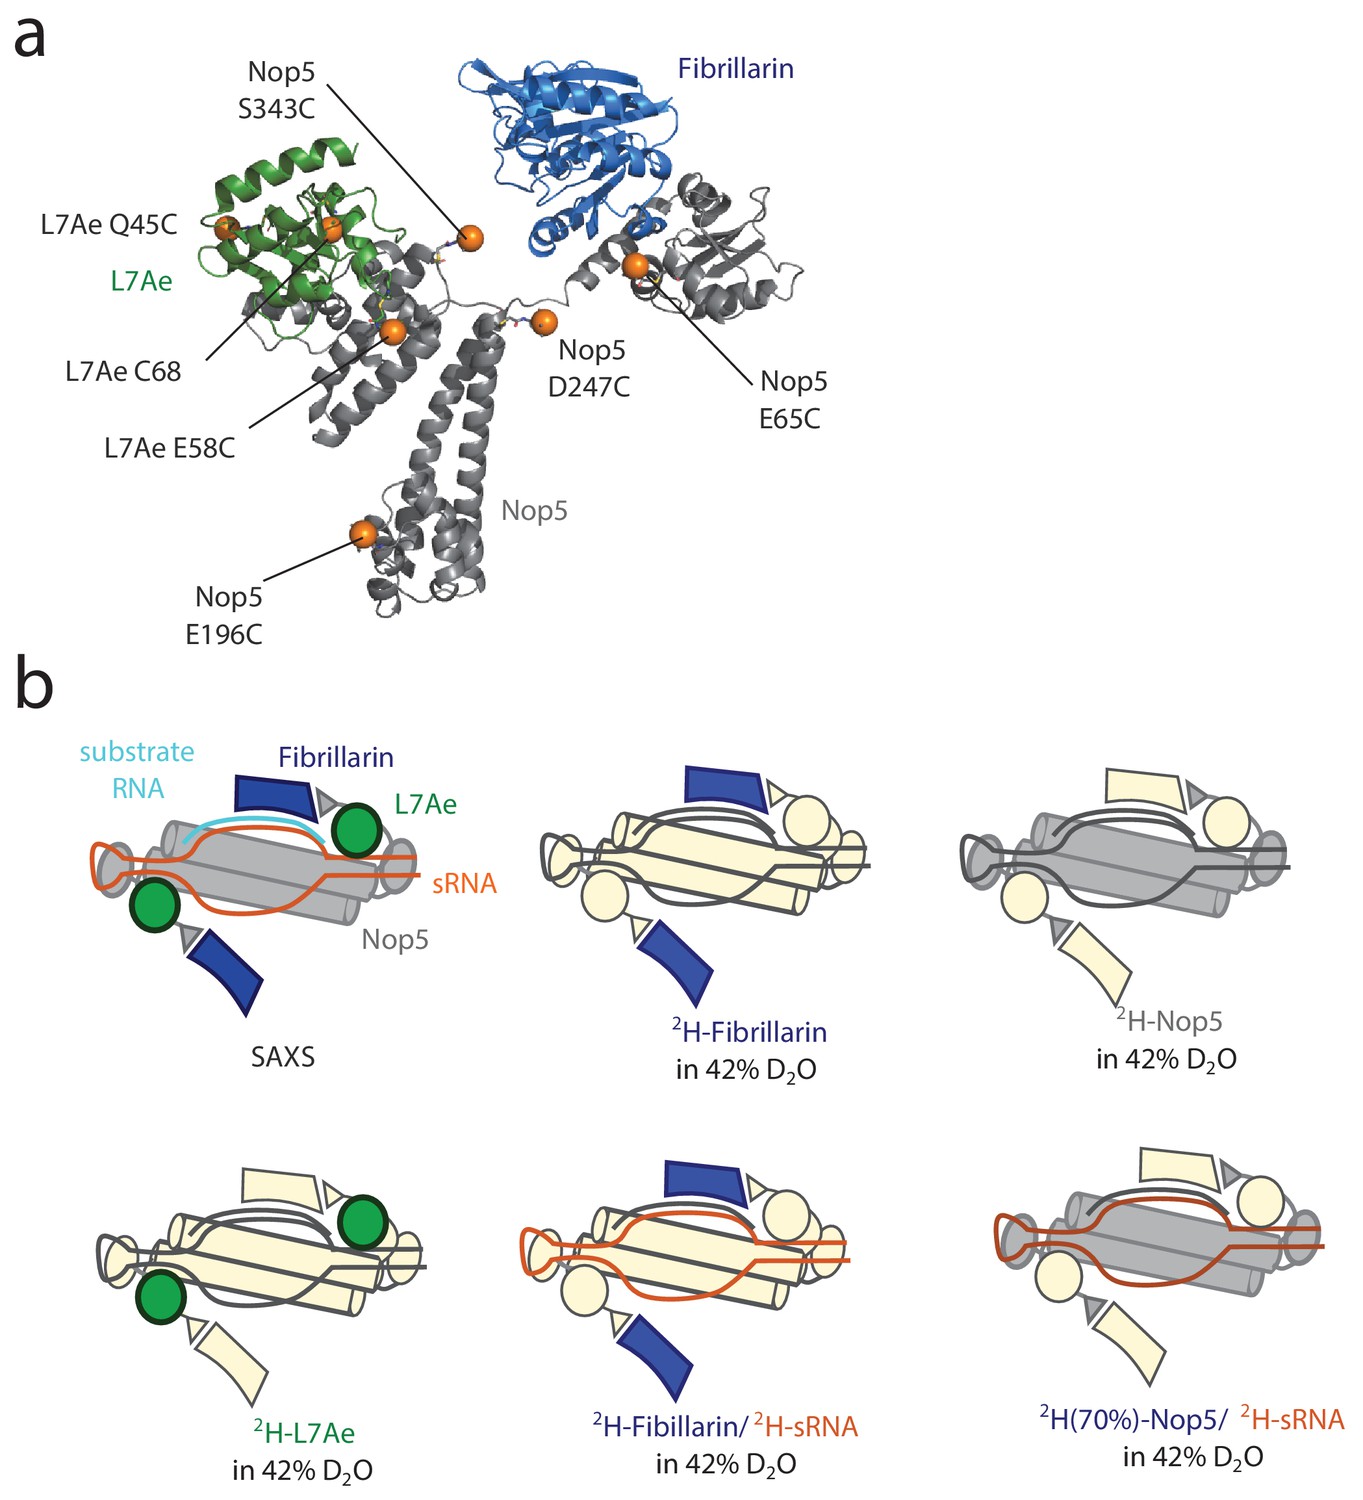
Schematic summary of the experimental data.
(a) The positions of the paramagnetic tags are shown as orange spheres on the L7Ae–Nop5–fibrillarin complex from PDB entry 3nmu. (b) Schematic representation of the labelling schemes employed for SANS experiments in this study. The colored proteins contribute to the scattering-intensity with positive contrast, while the proteins in ivory are effectively invisible due to contrast-matching with the solvent.
Figure 2—figure supplement 4
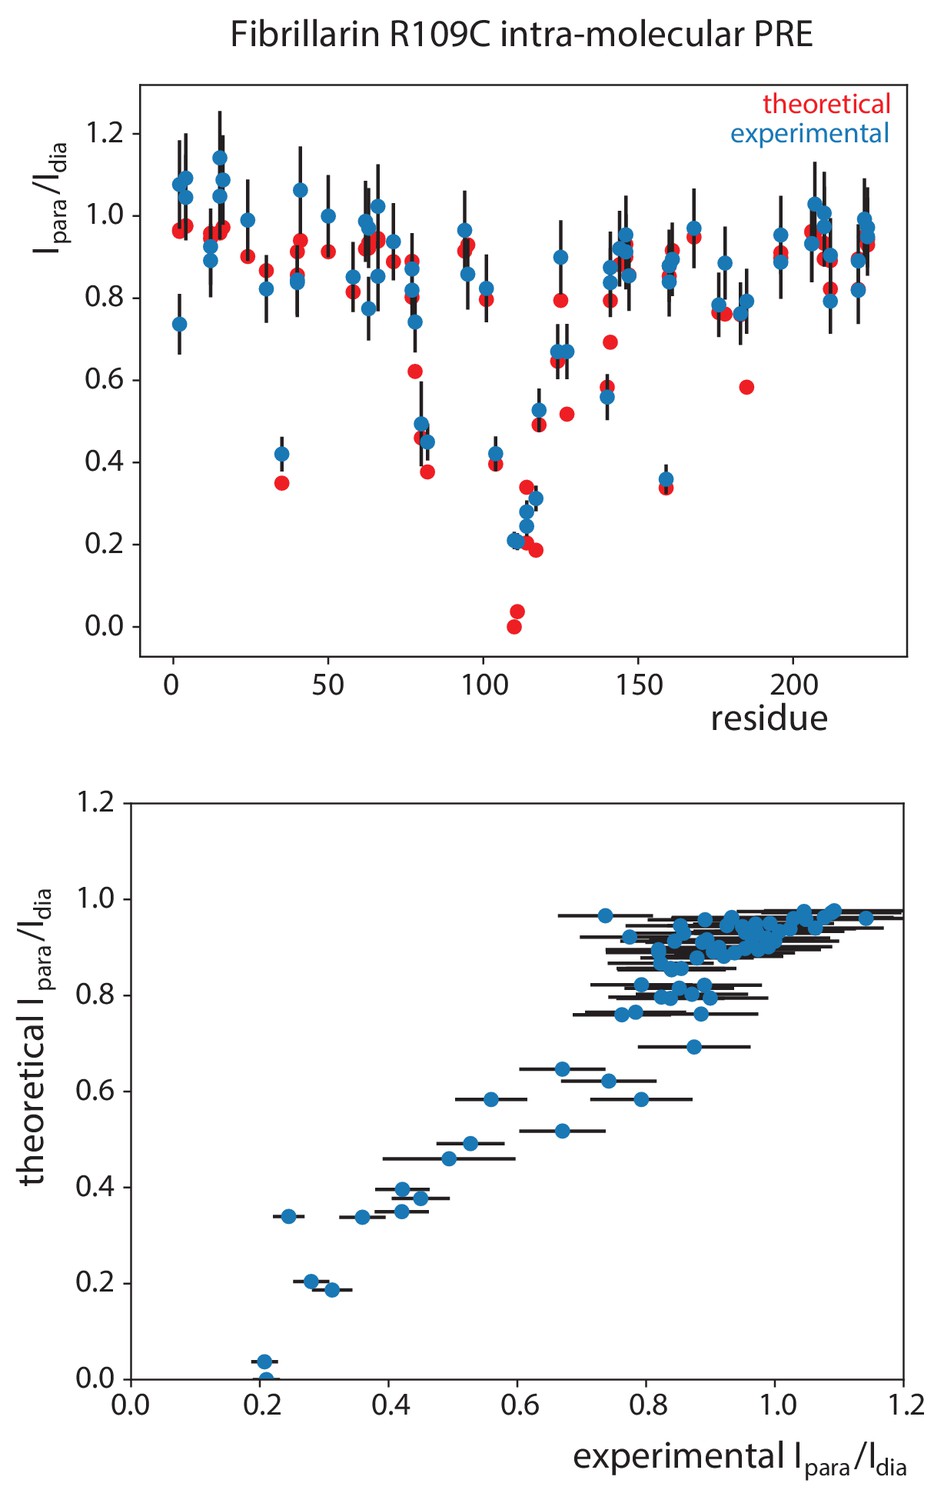
Validation of the PRE-derived distances.
Experimental PRE effects (Ipara/Idia, peak intensity-ratios when the spin-label is in the paramagnetic and diamagnetic state, respectively) of the Fib-R109C spin-label on the Fib-ILV resonances in the substrate D’-loaded sRNP compared with the PRE effects predicted from the structure of fibrillarin. The conformations of the spin-label and the electron—nucleus correlation time was optimized according to the protocol of Iwahara et al. (2004). The correlation between the the experimental and theoretical intensity-ratios for 0.2 < Ipara/Idia < 0.8 is excellent.
Figure 3 with 5 supplements

Ensembles of structures in agreement with the experimental data for the [on,off]- and [off,off]-states of substrate D’- and substrate D-loaded sRNPs.
The RMSD values of each ensemble (in parentheses) are calculated as the average of the RMSD values of the ensemble structures with respect to the structure closest to the mean over the Cα and P atoms of the protein and RNA structured domains, including the fibrillarin units not bound to the RNA. Colour-code as in Figure 1.
Figure 3—figure supplement 1

Structure-calculation algorithms.
(a) The structure-calculation protocol for the substrate D- or substrate D’-loaded sRNPs. Calculations are run in parallel assuming that the fibrillarin corresponding to the loaded side of the RNP is either in the methylation-competent position (on-state) or far from the RNA (off-state); the other fibrillarin copy is in the off-state. Restraint violations larger than 10 Å in either state are classified, to generate two separate restraint lists, representing either the [on,off]- or the [off,off]-state of the sRNP. The procedure is repeated iteratively to eliminate all violations. The lists are then used in a global torsion-angle dynamics (TAD) conformational search. A first selection-step is applied based on a stringent restraint-violation energy filter, combined with cut-offs based on fitness to the 2H-Nop5, 2H-L7Ae, 2H-RNA SANS curves acquired in 42%:58% D2O:H2O. The selected structure is then used as the basis for refinement in Cartesian space. The final ensemble is chosen by a strict filter based on the fitness to the 2H-Nop5, 2H-L7Ae, 2H-RNA and 2H-Nop5/2H-RNA SANS curves acquired in 42%:58% D2O:H2O, combined with a loose energy filter accounting for restraint violations, van der Waals and total energy. (b) Pseudo-genetic algorithm used for selection of structural ensembles with consensus fit to all PRE and SAS data. The number of conformers generated or selected at each step is given in parentheses. Representative mean structures of the four ensembles resulting from Cartesian refinement of [on,off]- and [off,off]-state structure calculations for both substrate D- and substrate D’-loaded sRNPs (Figure 3) are used as templates for a further round of torsion-angle simulated-annealing. For both [on,off]- and [off,off]-states, 300 structures are generated where the conformations of the spin-labels are randomized, and a further 3500 structures with randomized positions of the Nop5-NTD–fibrillarin modules not in contact with the RNA. This generates 4 conformer pools of [on,off]- and [off,off]-state structures, which are then sampled in 250 successive iterations, each containing 20 sub-sampling events. For each sub-ensemble, theoretical ensemble PREs and SAS scattering curves are computed, and fitness to the experimental data is calculated via χ2 (see Methods). Normalized consensus SAS fitness and PRE score are equally weighted in selecting the best sub-ensemble from each iteration. Structural ensembles were selected either exclusively from one pool of conformers ([on,off]- or [off,off]-conformers) or from both the pools of [on,off]- and [off,off]-conformers. In the final refinement step, the conformations of the paramagnetic tags are optimized for the best-fit ensemble selected at the previous step. Here, the conformation of each tag is randomized 3000 times and the best-fit conformations are selected scoring each PRE dataset individually. Both the positions of the fibrillarin modules and the relative populations of the ensemble conformers remain unaltered at this stage.
Figure 3—figure supplement 2
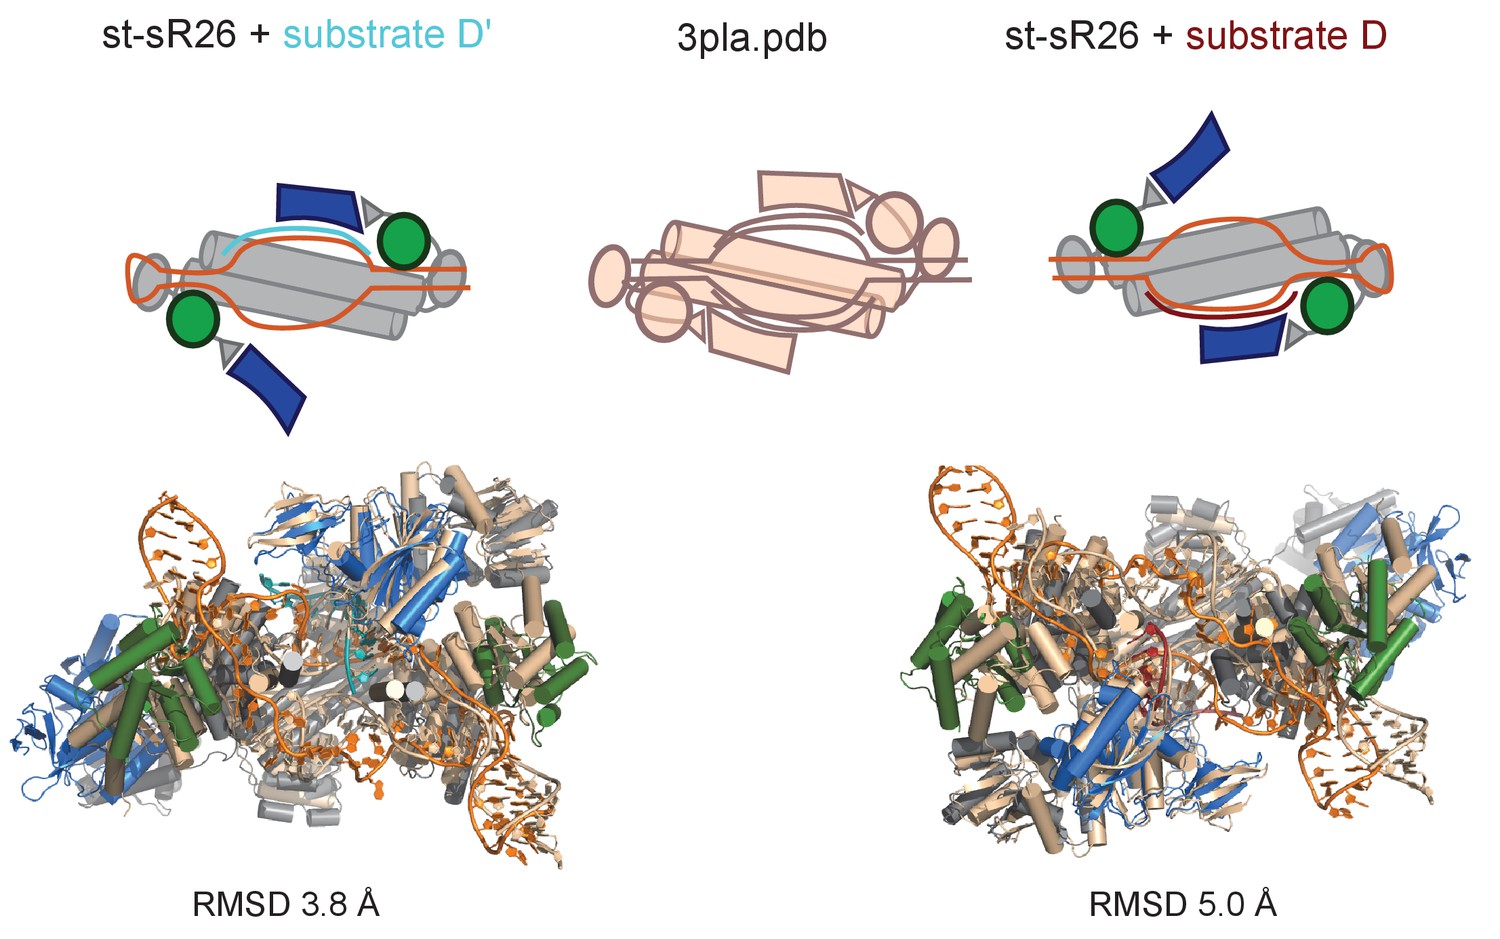
Structures of the half-loaded sRNPs in the [on,off]-state.
Top: schematic representation of the [on,off]-states of the half-loaded complexes reconstituted with st-sR26 (left: substrate D’-loaded; right: substrate D-loaded) and of the holo mono-RNP structure from Lin et al. (2011) (middle, PDB entry 3pla). Bottom: overlay of the structures of the [on,off]-states of substrate D’- and substrate D-loaded st-sR26 RNPs with the structure of the holo mono-RNP (PDB 3pla), aligned on substrate-bound fibrillarin. The st-sR26 RNPs are shown in colours (colour-code as in Figure 1); the 3pla structure is shown in beige. RMSDs to PDB entry 3pla are calculated over Cα and P atoms of the Nop5-NTD–fibrillarin module in the on-state, its neighbouring L7Ae copy, its neighbouring Nop5-CTD, the Nop5 coiled-coil domain and the guide RNA, excluding the free guide region.
Figure 3—figure supplement 3

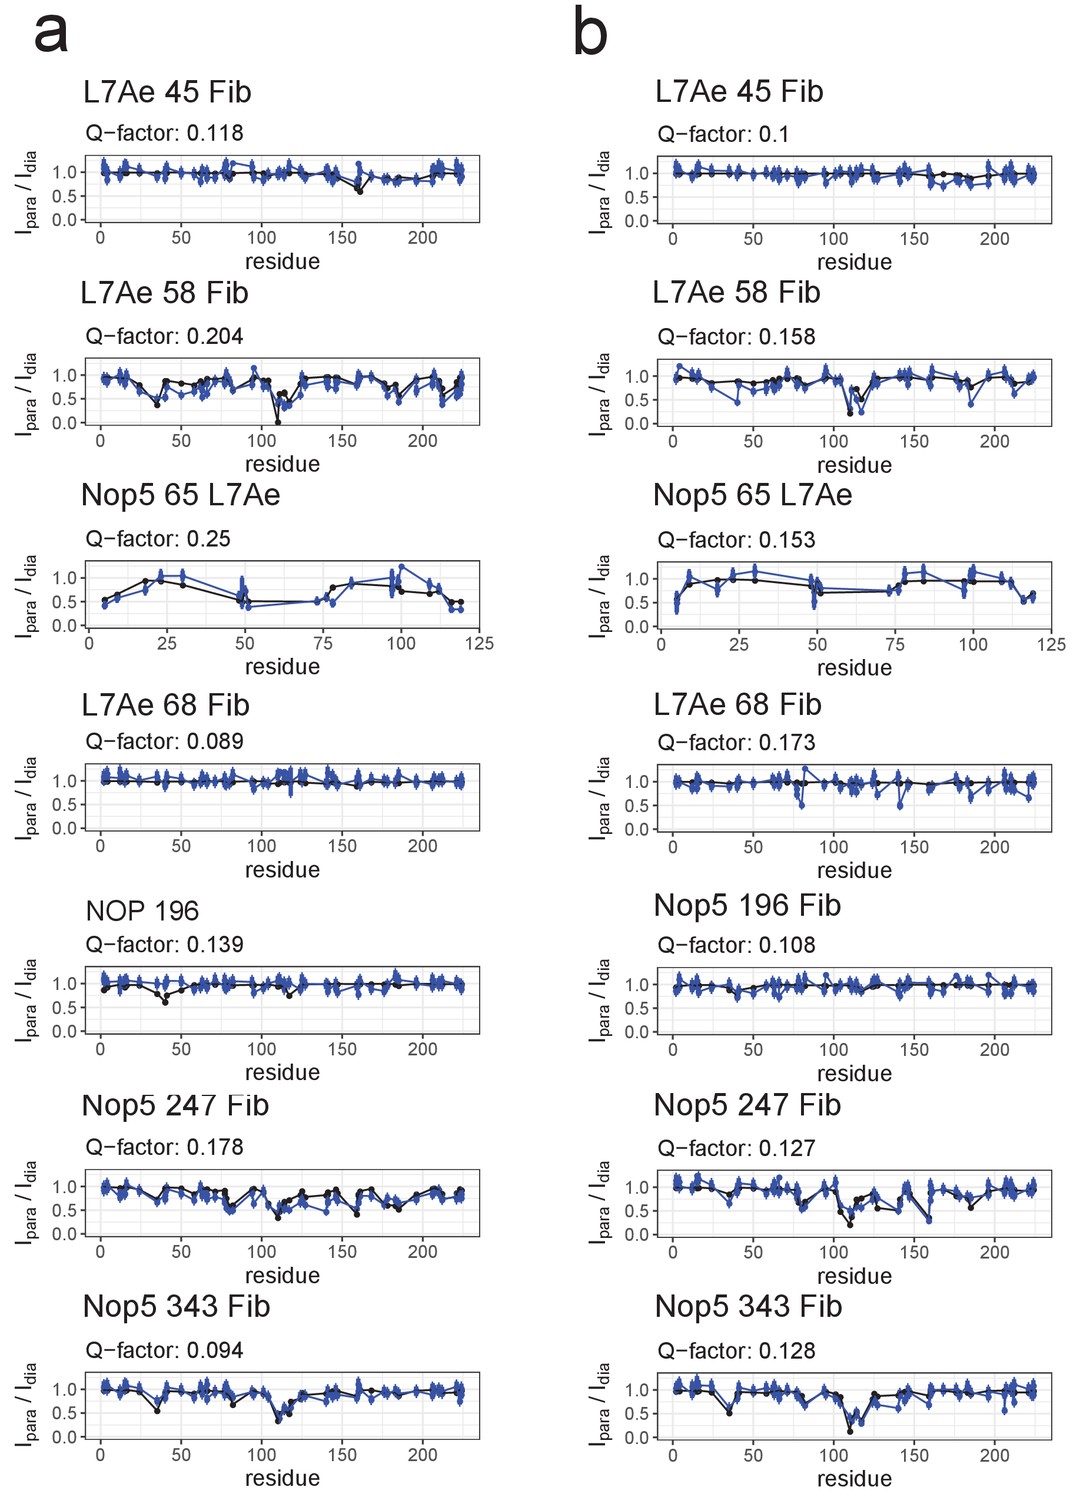
Fit of individual [on,off]- or [off,off]-conformers to the PRE data of the substrate D’-loaded sRNP.
(a) Comparison of the experimental Ipara/Idia ratios (blue) to the theoretical values (black) derived from the representative structure of the [on,off]-ensemble of Figure 3. (b) Comparison of the experimental Ipara/Idia ratios (blue) to the theoretical values (black) derived from the representative structure of the [off,off]-ensemble of Figure 3. The respective Q-factors are displayed on the top of each panel. In the title of each panel the first name indicates the spin-labelled protein, the number indicates the position of the spin-label and the second name indicates the protein whose ILV methyl groups were detected.
Figure 3—figure supplement 4
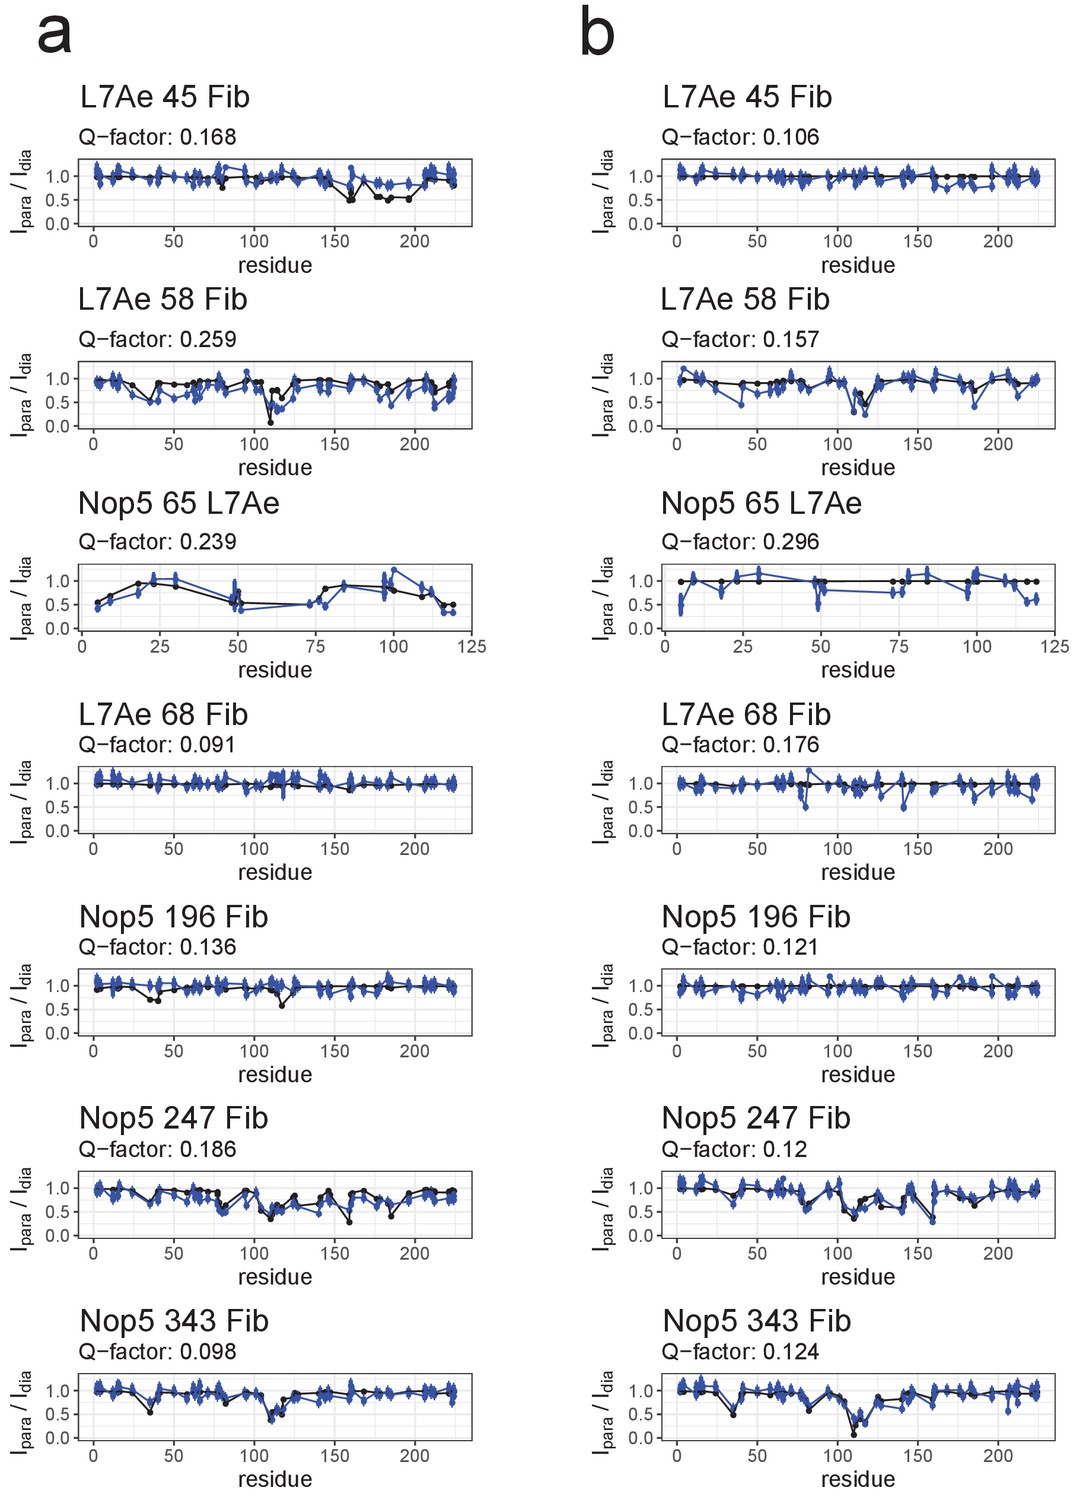
Fit of individual [on,off]- or [off,off]-conformers to the PRE data of the substrate D-loaded sRNP.
(a) Comparison of the experimental Ipara/Idia ratios (blue) to the theoretical values (black) derived from the the representative structure of the [on,off]-ensemble of Figure 3. (b) Comparison of the experimental Ipara/Idia ratios (blue) to the theoretical values (black) derived from the representative structure of the the [off,off]-ensemble of Figure 3. The respective Q-factors are displayed on the top of each panel. In the title of each panel the first name indicates the spin-labelled protein, the number indicates the position of the spin-label and the second name indicates the protein whose ILV methyl groups were detected.
Figure 3—figure supplement 5
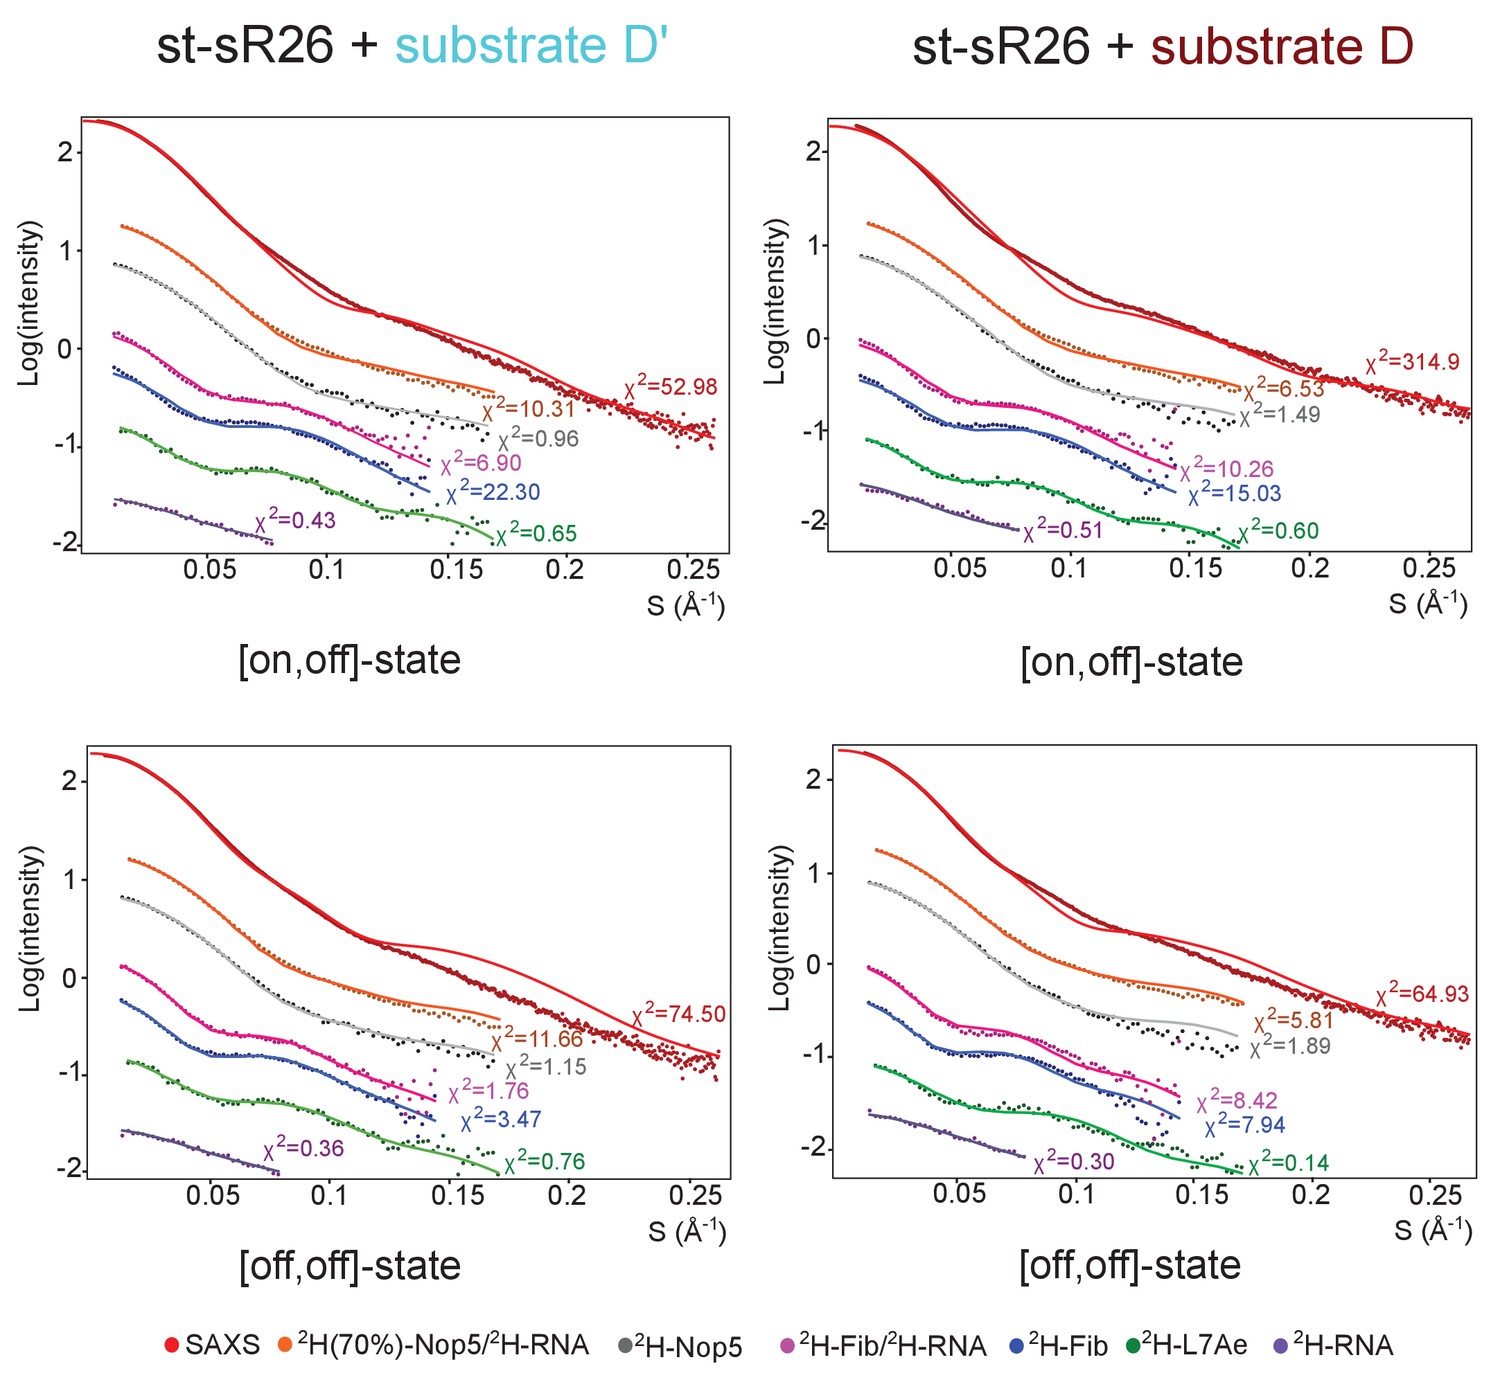
Fit of individual [on,off]- or [off,off]-states to the SAS data.
Fit to the SAS data of the representative structures of the [on,off]- and [off,off]-ensembles of the substrate D’- and substrate D-loaded sRNPs of Figure 3. The respective χ2 values are displayed next to each curve.
Figure 4 with 1 supplement

Fibrillarin binds the substrate–guide duplex more strongly in the substrate D’-loaded sRNP.
(a) The structural ensemble selected by the pseudo-genetic scoring algorithm (Methods) for the substrate D’-loaded sRNP, containing two [on,off]-state and one [off,off]-state conformers, with fibrillarin shown in shades of blue. The fits to the experimental SAS curves are shown on the right. All SANS curves were measured in 42%:58% D2O:H2O. (b) Structural ensemble selected by the pseudo-genetic scoring algorithm for the substrate D-loaded sRNP, containing three [on,off]-state and eight [off,off]-state conformers. In both a and b, the mean and standard deviation of the percentage of [on,off]-state structures in the three top-scoring ensembles across three independent scoring runs is shown in the title. The structural ensembles yield much better agreement with the SAS curves than do the individual [on,off]- and [off,off]-state structures (Figure 3—figure supplement 5).
Figure 4—figure supplement 1
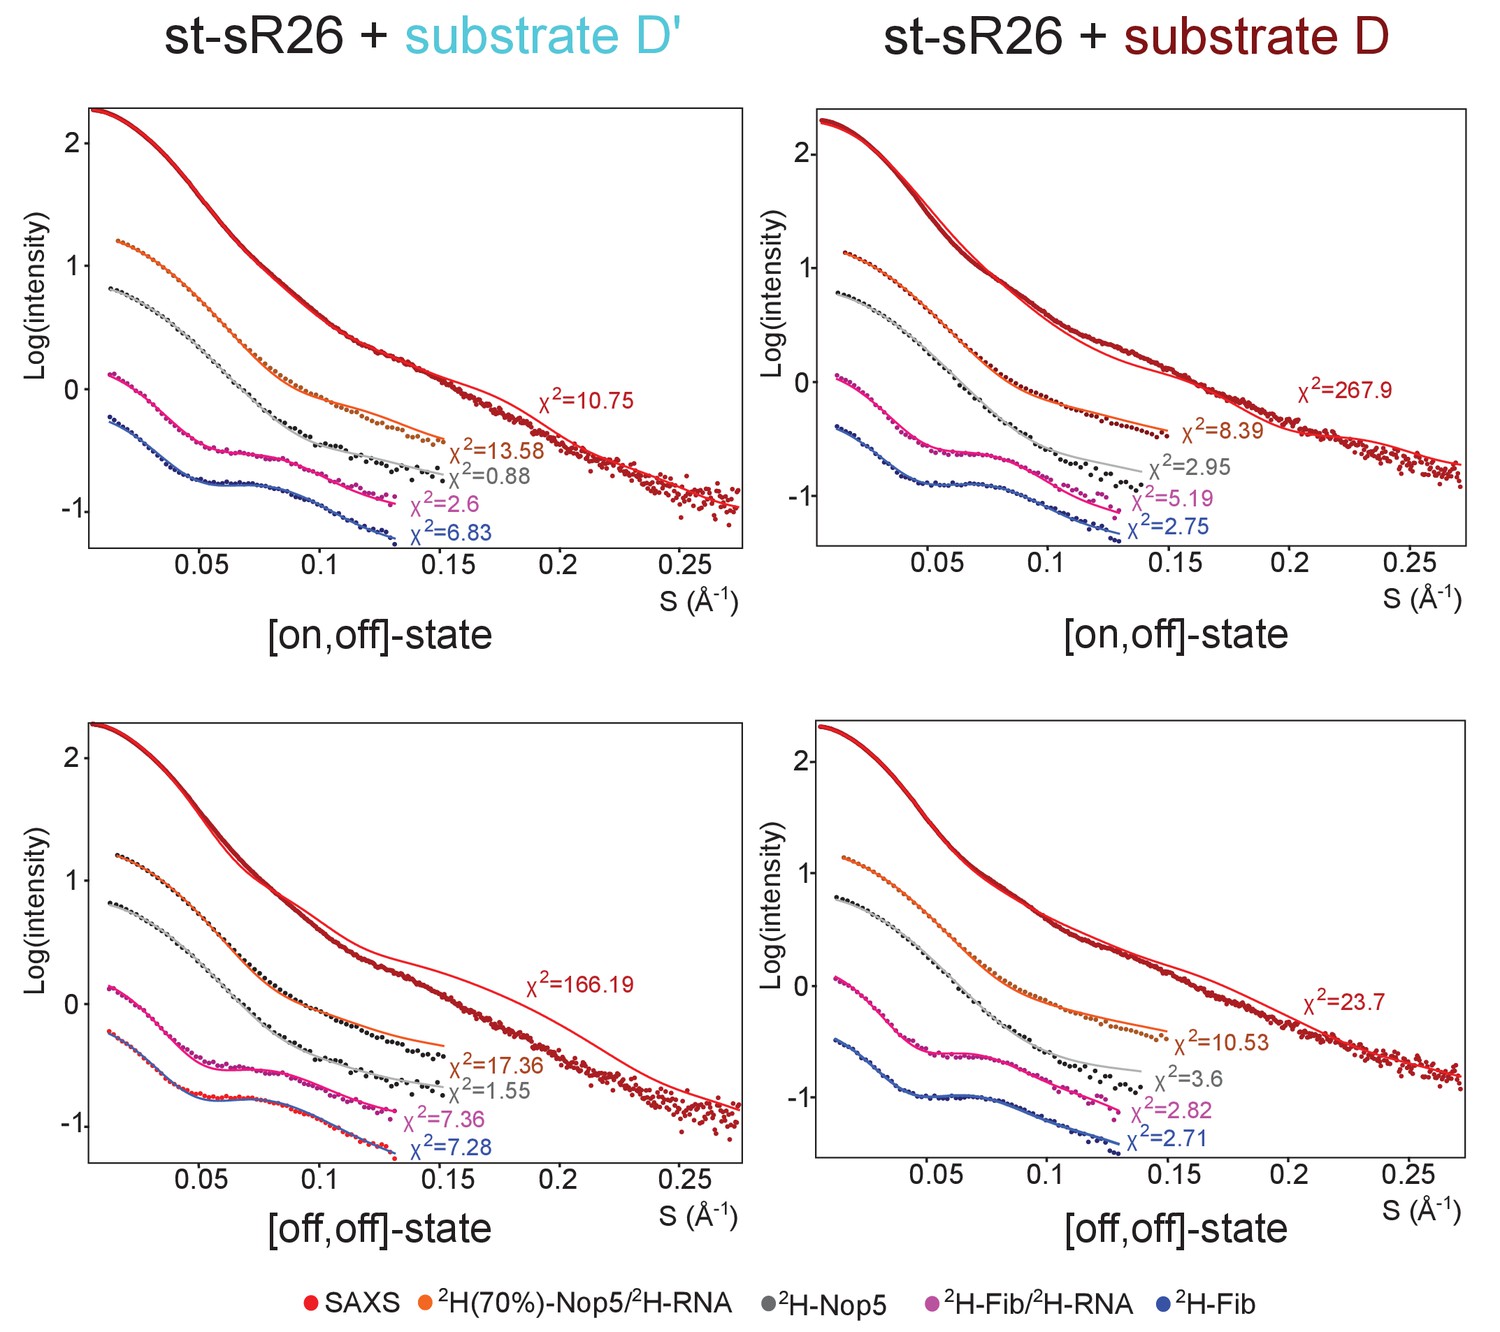
Fit to the SAS data of ensembles of only [on,off]- or [off,off]-conformers after randomisation of the position of the fibrillarin copy in the off-state.
Left, fit to the SAS data of ensembles containing either only [on,off]- or only [off,off]-conformers of the substrate D’-loaded sRNP. The respective χ2 values are displayed next to each curve. The ensembles were determined after randomisation of the Nop5-NTD–fibrillarin modules with the same algorithm used to select the ensembles of Figure 4, but allowing selection only of [on,off]- (top) or [off,off]- (bottom) conformers. Right, fit to the SAS data of the ensembles containing either only [on,off]- or only [off,off]-conformers of the substrate D-loaded sRNP. The respective χ2 values are displayed next to each curve.
Figure 5 with 1 supplement
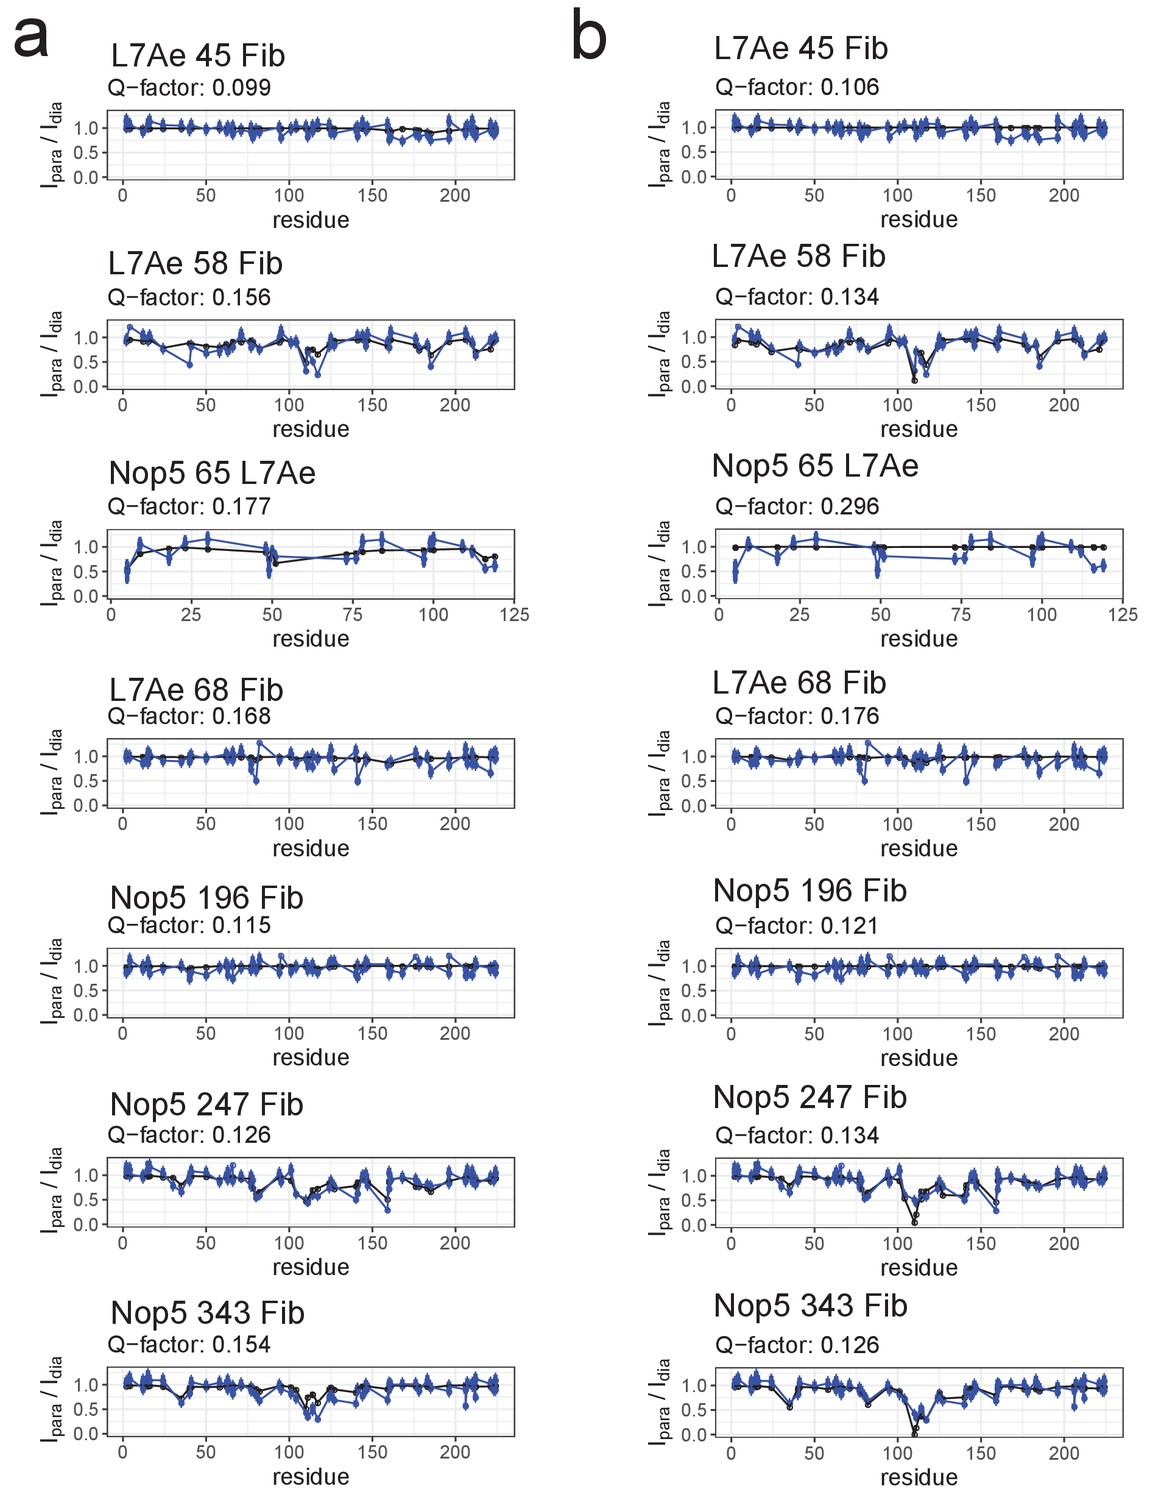
Fit of the ensemble structures representing the substrate–loaded RNPs to the PRE data.
(a) Comparison of Ipara/Idia ratios back-calculated from the selected ensemble of conformers of the substrate D’-loaded st-sR26 RNP shown in Figure 4a (blue) with the experimental ratios (black). The reported Q-factors were calculated as recommended by Clore and Iwahara (2009). In the title of each panel the first name indicates the spin-labelled protein, the number indicates the position of the spin-label and the second name indicates the protein whose ILV methyl groups were detected. (b) Comparison of Ipara/Idia ratios back-calculated from the selected ensemble of conformers of the substrate D-loaded st-sR26 RNP shown in Figure 4b (blue) with the experimental ratios (black). The structural ensembles yield better or similar agreement with the PRE data than do the individual [on,off]- and [off,off]-state structures Figure 3—figure supplements 3 and 4).
Figure 5—figure supplement 1
Fit to the PRE data of ensembles of only [on,off]- or [off,off]-conformers after randomisation of the position of the fibrillarin copy in the off-state.
(a) Comparison of the experimental Ipara/Idia ratios (blue) to the theoretical values (black) derived from the best ensemble of only [on,off]-conformers for the substrate D’-loaded sRNP. (b) Comparison of the experimental Ipara/Idia ratios (blue) to the theoretical values (black) derived from the best ensemble of only [off,off]-conformers for the substrate D-loaded sRNP. In the title of each panel the first name indicates the spin-labelled protein, the number indicates the position of the spin-label and the second name indicates the protein whose ILV methyl groups were detected.
Figure 6
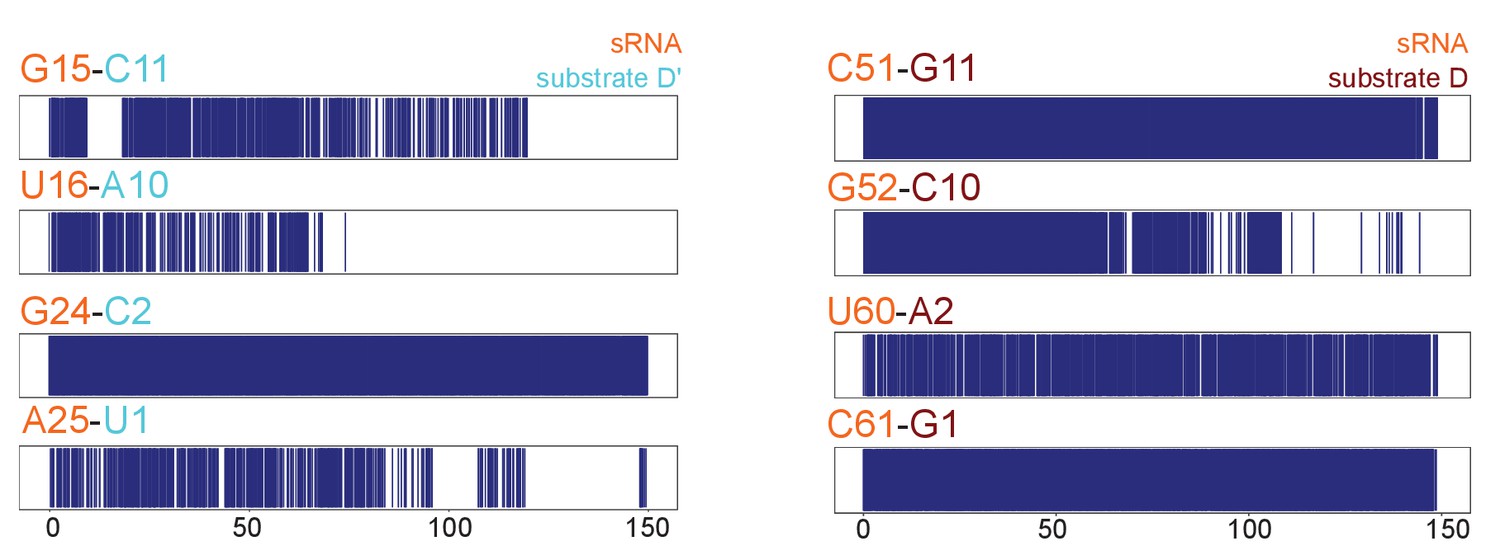
Substrate–guide duplex hydrogen-bonds throughout the molecular dynamics runs.
Plots showing the hydrogen bonding pattern across substrate–guide duplex 3' and 5' ends in the substrate D'-bound (left) and substrate D-bound (right) sRNPs over two 150-ns molecular dynamics simulations. A blue line indicates the presence of at least two hydrogen bonds between the corresponding bases. The numbering is according to Figure 1.
Figure 7
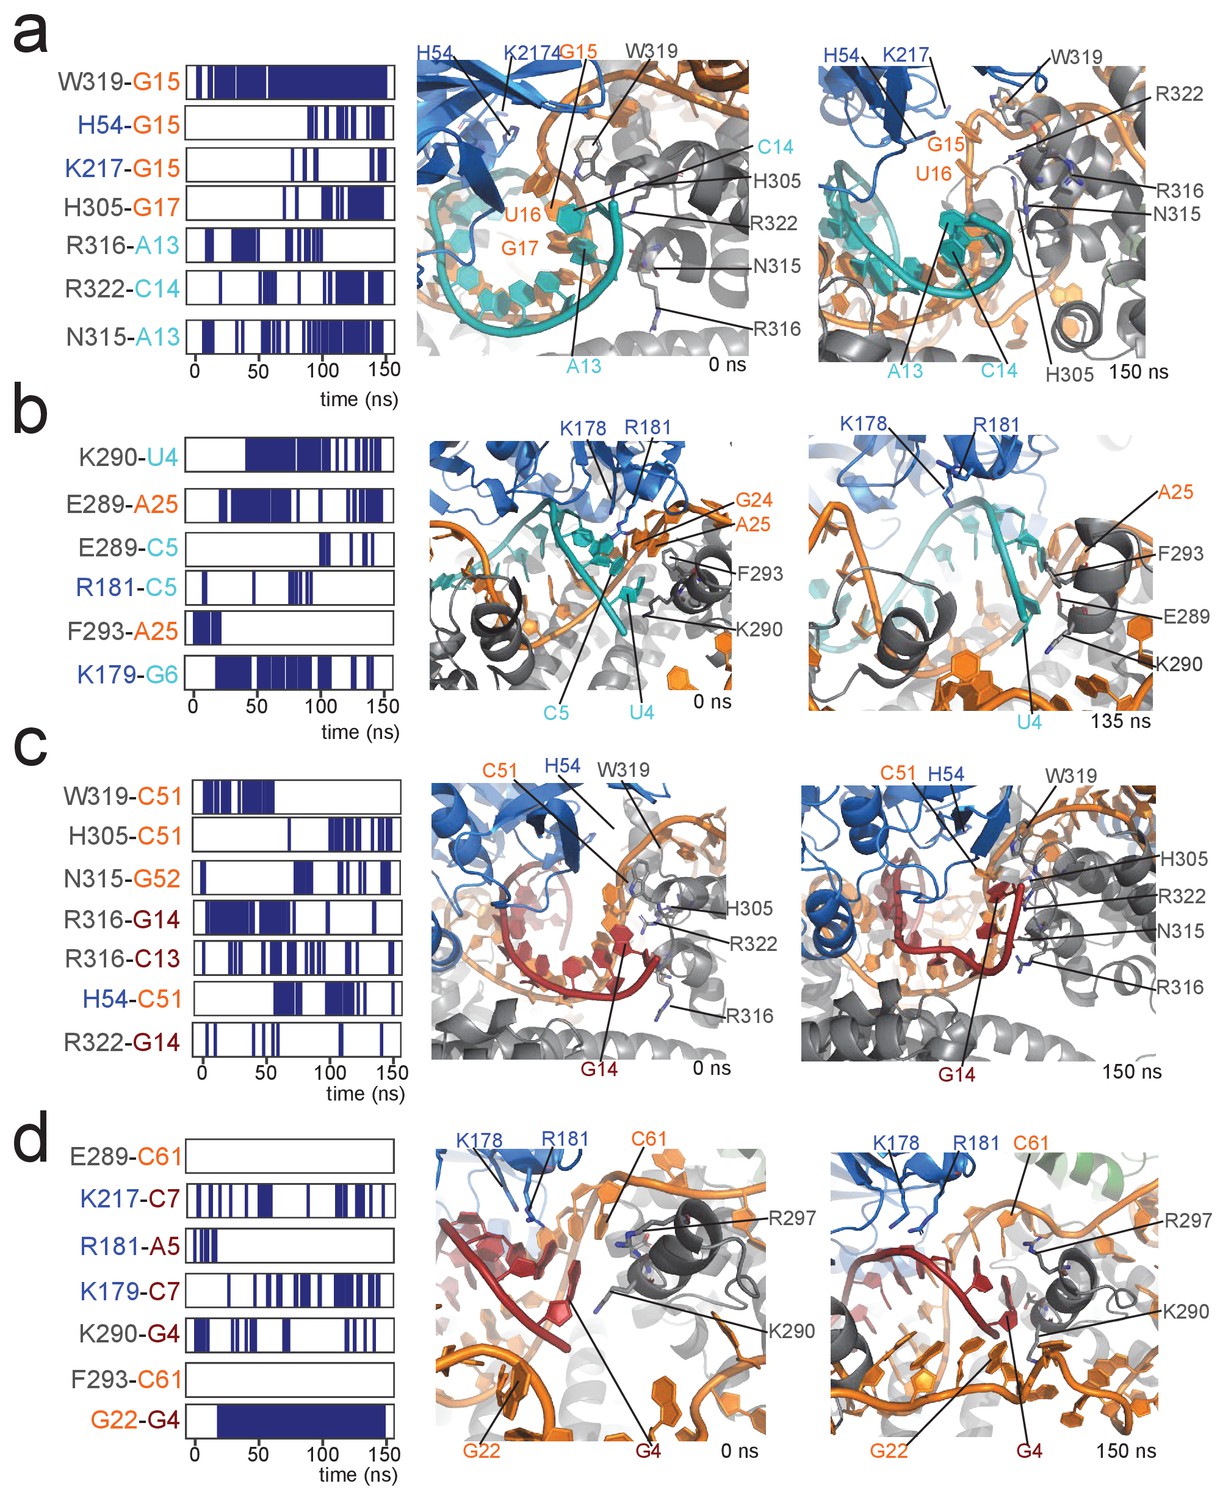
Contacts between proteins and the 5' and 3' ends of the substrate–guide duplex in a 150-ns molecular dynamics run.
(a) Protein–RNA contacts at the 3' end of the substrate–guide duplex in the [on,off]-state of the substrate D'-bound RNP. Each line marks the presence of a contact between the two residues under consideration. Black and blue indicate amino acids of Nop5 and fibrillarin, respectively; orange and cyan indicate nucleotides of the sRNA and substrate D’, respectively. The numbering of the RNA is as in Figure 1. Contacts are H-bonds between polar amino-acid side-chains and polar atoms of the nucleotide (as defined in CPPTRAJ within Amber); hydrophobic interactions involving aromatic amino acid side chains and base rings (with a distance cut-off of 4.0 Å between the centres of the rings); electrostatic contacts between polar amino acid side chains and the RNA phosphorus atoms (with a distance cut-off of 4.0 Å between the polar group and the P atom). The interacting amino acids and nucleotides are displayed in the structural panel in the middle (starting structure) and on the right (structure towards the end of the simulation). (b) Protein–RNA contacts at the 5' end of the substrate–guide duplex in the [on,off]-state of the substrate D'-bound RNP. (c) Protein–RNA contacts at the 3' end of the substrate–guide duplex in the [on,off]-state of the substrate D-bound RNP. Only the second last base-pair melts, leading to a lower number of protein–RNA contacts as compared to the substrate D’-bound RNP. (d) Protein–RNA contacts at the 5' end of the substrate–guide duplex in the [on,off]-state substrate D-bound RNP. Both the RNA secondary structure and the position of the RNA relative to the proteins remain constant throughout the simulation, without formation of new protein–RNA contacts.
Author response image 1

Titration of substrate RNA onto the apo Box C/D sRNP.
Author response image 2

Examples of experimental PRE intensity-ratios in the literature.
Tables
Key resources table
| Reagent type (species) or resource | Designation | Source or reference | Identifiers | Additional information |
|---|---|---|---|---|
| Strain, strain background (Escherichia coli) | BL21 (DE3) | EMBL protein expression facility | NA | |
| Strain, strain background (Escherichia coli) | BL21 Rosetta 2 | Merck Millipore | Cat #71400–3 | |
| Recombinant DNA reagent | pETM-11 Fibrillarin (plasmid) | Lapinaite et al. (2013) | Nterminal His6 + TEV site | |
| Recombinant DNA reagent | pETM-11 Nop5 (plasmid) | Lapinaite et al. (2013) | Nterminal His6 + TEV site; L113K V223E mutant. Codon-optimised synthetic gene (GeneArt) | |
| Recombinant DNA reagent | pETM-11 Nop5 E65C (plasmid) | Lapinaite et al. (2013) | Mutation of pETM-11 Nop5 | |
| Recombinant DNA reagent | pETM-11 Nop5 E196C (plasmid) | Lapinaite et al. (2013) | Mutation of pETM-11 Nop5 | |
| Recombinant DNA reagent | pETM-11 Nop5 D247C (plasmid) | Lapinaite et al. (2013) | Mutation of pETM-11 Nop5 | |
| Recombinant DNA reagent | pETM-11 Nop5 S343C (plasmid) | Lapinaite et al. (2013) | Mutation of pETM-11 Nop5 | |
| Recombinant DNA reagent | pETM-11 L7Ae (plasmid) | Lapinaite et al. (2013) | Nterminal His6 + TEV site | |
| Recombinant DNA reagent | pETM-11 L7Ae Q45C (plasmid) | Lapinaite et al. (2013) | Mutation of pETM-11 L7Ae also carrying C68S mutation | |
| Recombinant DNA reagent | pETM-11 L7Ae E58C (plasmid) | Lapinaite et al. (2013) | Mutation of pETM-11 L7Ae also carrying C68S mutation | |
| Sequence-based reagent | st-sR26 | Graziadei et al. (2016) | In vitro transcribed RNA | |
| Sequence-based reagent | st-sR26-1 | This paper | In vitro transcribed RNA | Method section: RNA synthesis |
| Sequence-based reagent | st-sR26-1 substrate | This paper | In vitro transcribed RNA | Method section: RNA synthesis |
| Sequence-based reagent | st-sR26-1 A61C | This paper | In vitro transcribed RNA | Method section: RNA synthesis |
| Sequence-based reagent | st-sR26-1 A61U | This paper | In vitro transcribed RNA | Method section: RNA synthesis |
| Sequence-based reagent | st-sR26-2 | This paper | In vitro transcribed RNA | Method section: RNA synthesis |
| Sequence-based reagent | st-sR26-2 substrate | This paper | In vitro transcribed RNA | Method section: RNA synthesis |
| Sequence-based reagent | sR26 | Graziadei et al. (2016) | In vitro transcribed RNA | |
| Sequence-based reagent | ssR26 | Lapinaite et al. (2013) | In vitro transcribed RNA | |
| Commercial assay or kit | TLAM-ILVproS labelling | NMR-Bio | NA | |
| Chemical compound, drug | Iodoacetoamido-PROXYL | Sigma-Aldrich | Cat # 253421–25 MG | |
| Chemical compound, drug | (methyl-13C, 99%; 3,3-D2, 98%) α-ketobutyric acid | Cambridge Isotope Labs | CDLM-7318-PK | |
| Chemical compound, drug | (3-methyl-13C, 99%; 3,4,4,4-D4, 98%) α-ketoisovaleric acid | Cambridge Isotope Labs | CDLM-7317-PK | |
| Chemical compound, drug | [3–2 H2,4–2H, 5–13C, 5’−2 H3]-a-ketoiso-caproate | Lichtenecker et al. (2013) | ||
| Software, algorithm | CNS | This paper | Method section: Structure calculation and selection. Adaptation of protocol from Lapinaite et al. (2013) | |
| Software, algorithm | Python-based SAS-PRE scoring algorithm | This paper | ||
| Software, algorithm | ATSAS 2.7.5 | Petoukhov et al., 2012 | ||
| Software, algorithm | Python-based SAS-PRE scoring algorithm | This paper | Method section: Ensemble Scoring |
Additional files
Download links
A two-part list of links to download the article, or parts of the article, in various formats.
Downloads (link to download the article as PDF)
Open citations (links to open the citations from this article in various online reference manager services)
Cite this article (links to download the citations from this article in formats compatible with various reference manager tools)
The guide sRNA sequence determines the activity level of box C/D RNPs
eLife 9:e50027.
https://doi.org/10.7554/eLife.50027


