Dynamic regulation of chromatin accessibility by pluripotency transcription factors across the cell cycle
- Ecole Polytechnique Fédérale de Lausanne (EPFL), Switzerland
Figures
Figure 1 with 3 supplements
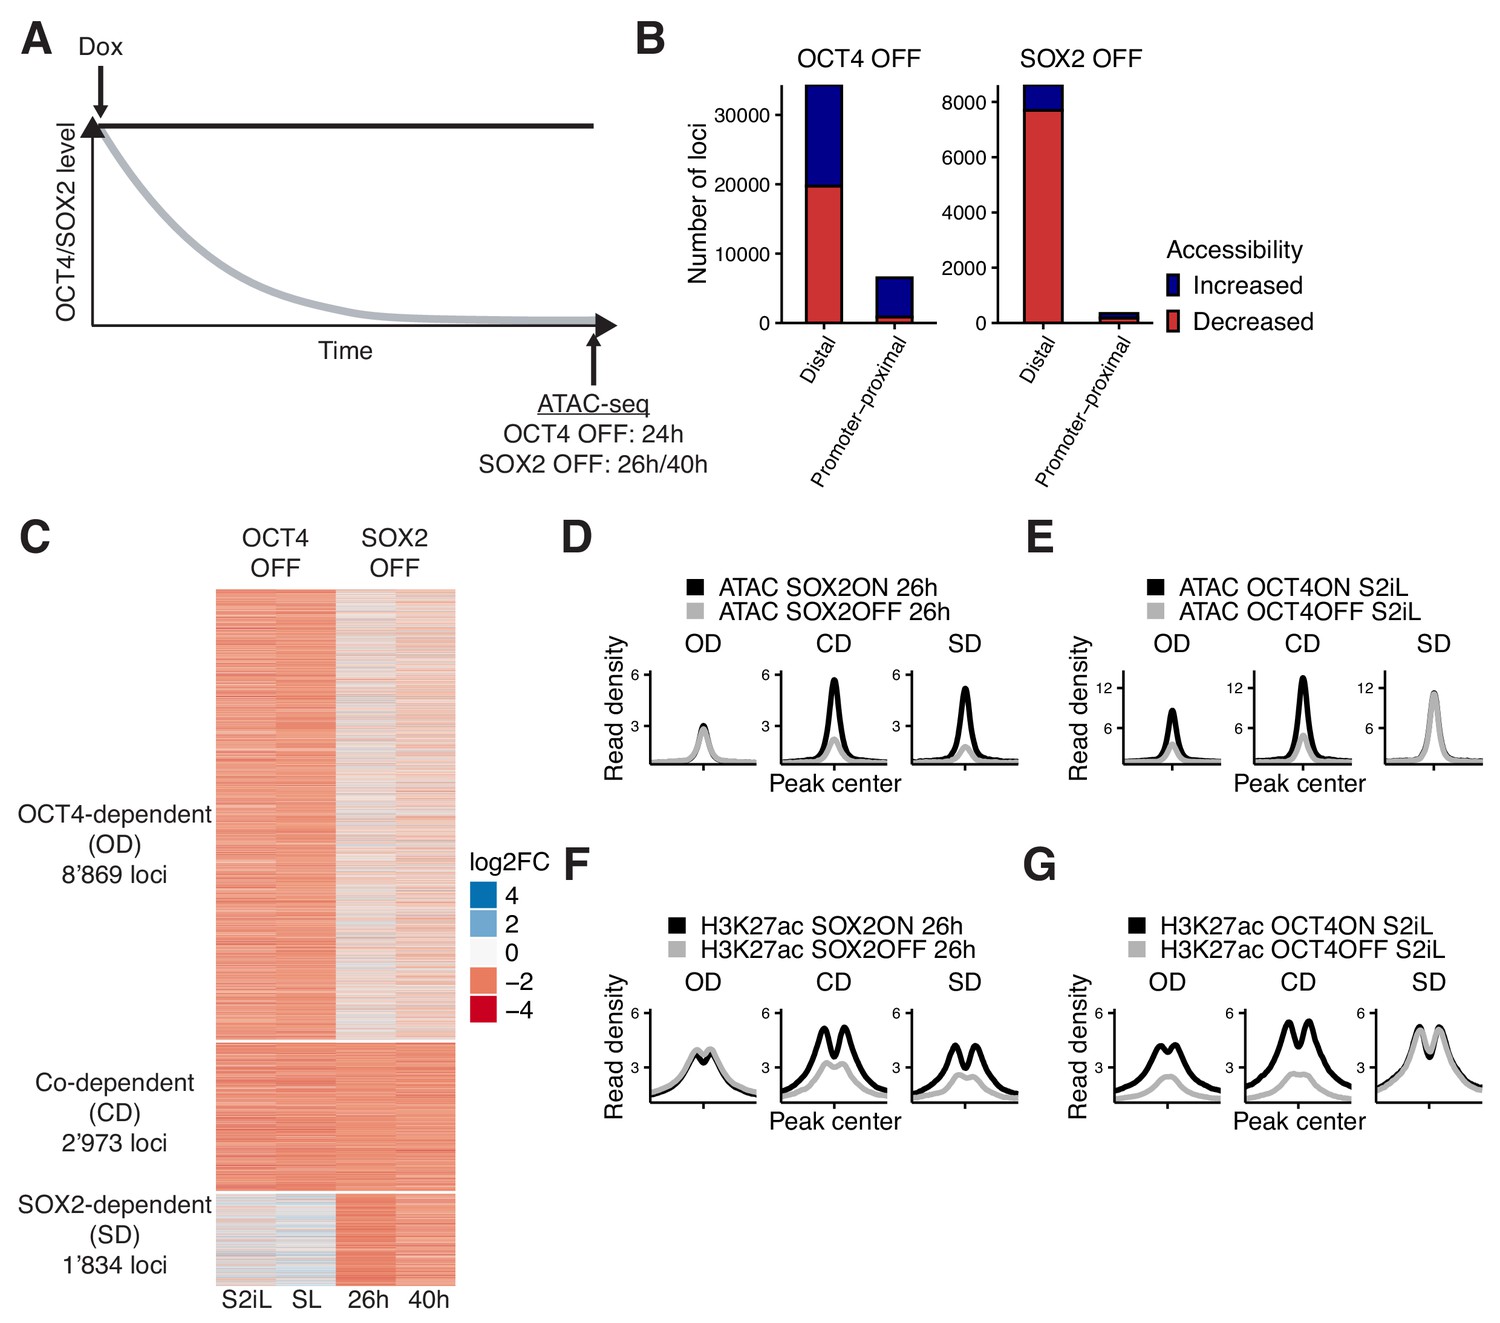
Interplay between OCT4 and SOX2 in regulating ES cell chromatin accessibility.
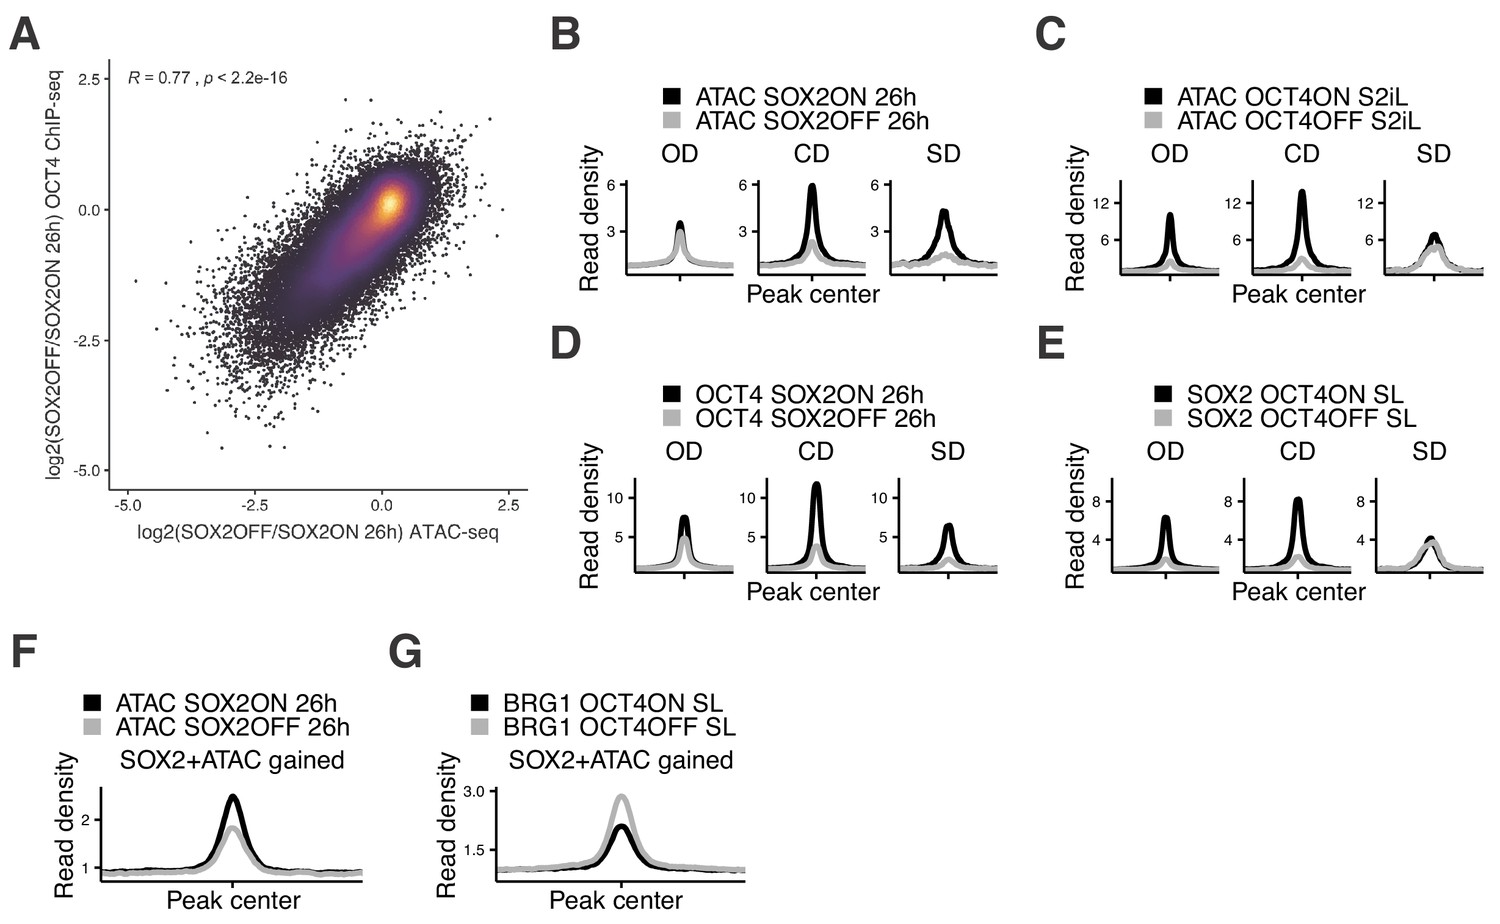
(A) Experimental strategy to compare the effect of OCT4 and SOX2 depletion on chromatin accessibility. (B) Number of regions significantly changed in accessibility upon OCT4 (left) and SOX2 (right) depletion in distal (>1 kb from TSS) and promoter-proximal (≤1 kb from TSS) elements. (C) log2 fold-change values of accessibility between dox-treated and untreated cells upon OCT4/SOX2 depletion at OCT4/SOX2 binding sites with decreased accessibility. Loci are grouped into those significantly affected upon OCT4 depletion (OD), SOX2 depletion (SD), or depletion of either factor (CD). Each row corresponds to one individual locus, and each column to a different experimental condition. (D–E) Average RPKM-normalized ATAC-seq signal 2 kb around OD, CD, and SD loci upon SOX2 depletion (D) and OCT4 depletion (E). (F–G) Average RPKM-normalized H3K27ac ChIP-seq signal 2 kb around OD, CD, and SD loci upon SOX2 depletion (F) and OCT4 depletion (G). Statistics for (D–G) are available in Supplementary file 1.
Figure 1—figure supplement 1
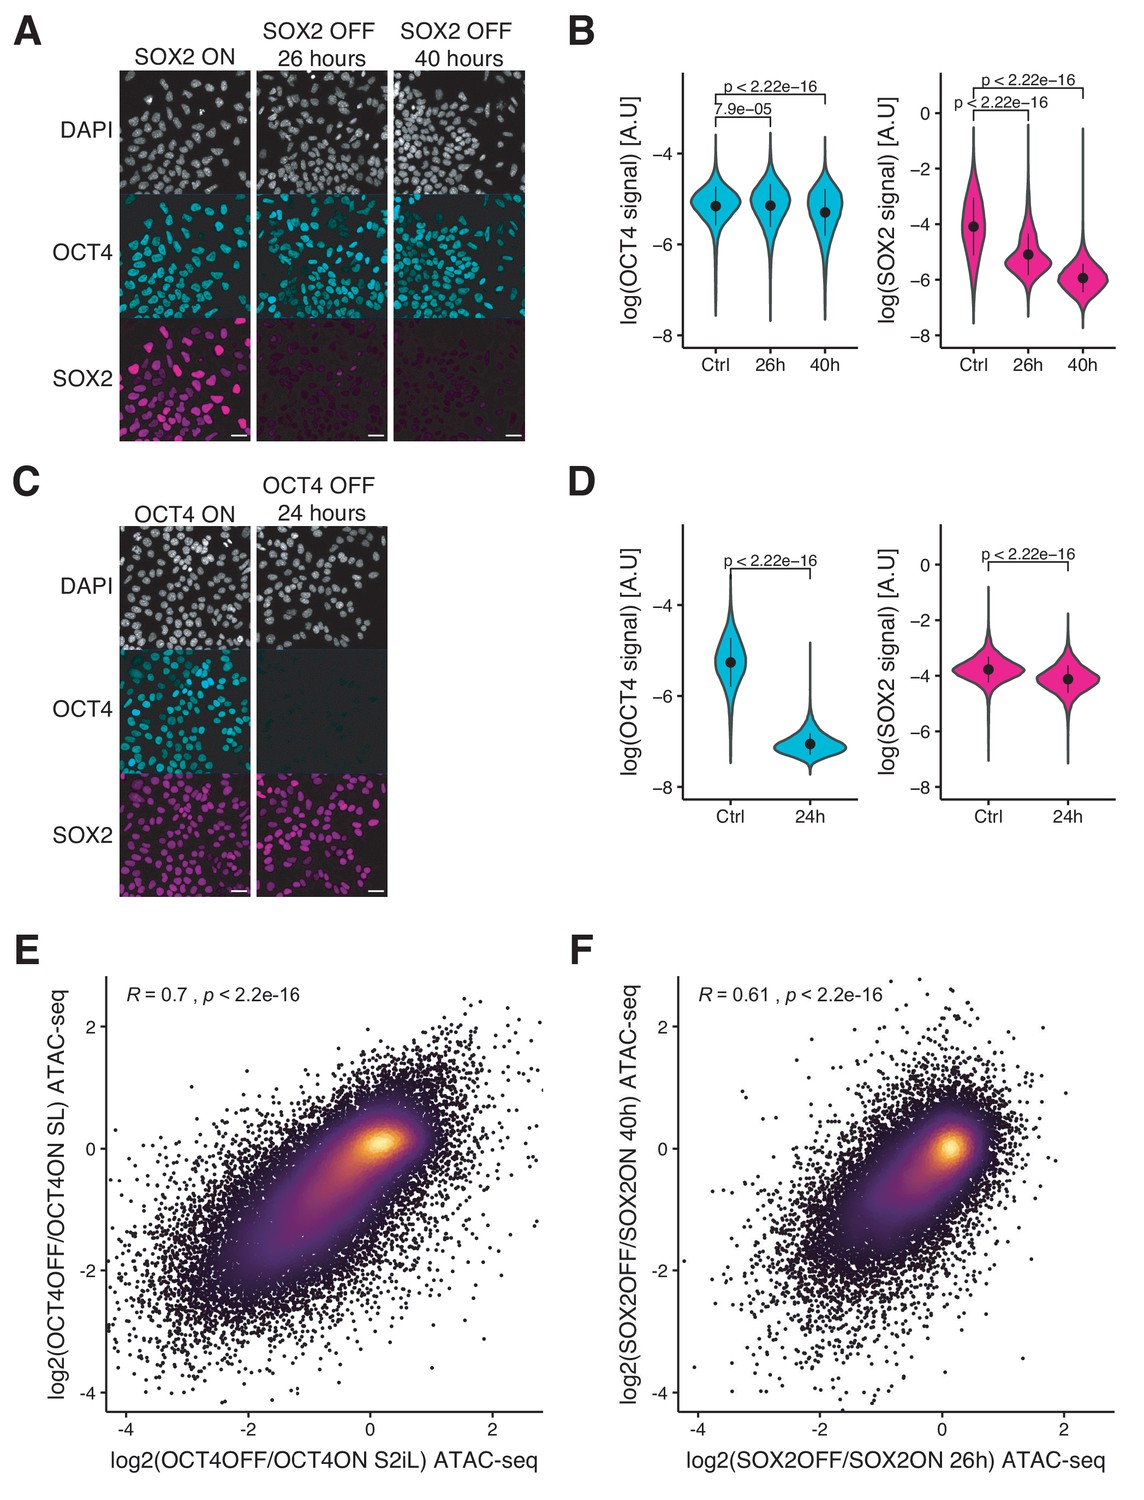
Immunofluorescence analysis of OCT4 OFF and SOX2 OFF cell lines and comparison of ATAC-seq changes between culture conditions and treatment times.
(A) Immunofluorescence of 2TS22C cells stained for DNA (DAPI), OCT4, and SOX2 without dox treatment (left), and after 26 hr (middle), and 40 hr (right) of dox treatment. (B) Violin plot of background-subtracted log values of immunofluorescence signal in OCT4 (left) and SOX2 (right) channels upon SOX2 depletion. Control: n = 45’601 cells from four biological replicates including two technical replicates; 26 hr: n = 42’298 cells from three biological replicates including two technical replicates; 40 hr: n = 32’342 cells from two technical replicates. Dots: mean; Vertical lines: standard deviation; p-values: Mann-Whitney U. (C) Immunofluorescence of ZHBTc4 cells stained for DNA (DAPI), OCT4, and SOX2 without dox treatment (left), and after 24 hr of dox treatment (right). (D) Violin plot of background-subtracted log values of immunofluorescence signal in OCT4 (left) and SOX2 (right) channels upon OCT4 depletion. Control: n = 26’119 cells from three biological replicates. 24 hr: n = 23’157 cells from three biological replicates. Dots: mean; Vertical lines: standard deviation; p-values: Mann-Whitney U. (E) Correlation between the log2 fold-change values of accessibility upon OCT4 depletion in S2iL (x-axis) and SL (y-axis) at OCT4-bound sites. (F) Correlation between the log2 fold-change values of accessibility upon SOX2 depletion after 26 hr (x-axis) and 40 hr (y-axis) of dox treatment at SOX2 binding sites. Coefficient (R) and p-values are based on the Pearson correlation coefficient. Scale bars: 30 mm.
Figure 1—figure supplement 2
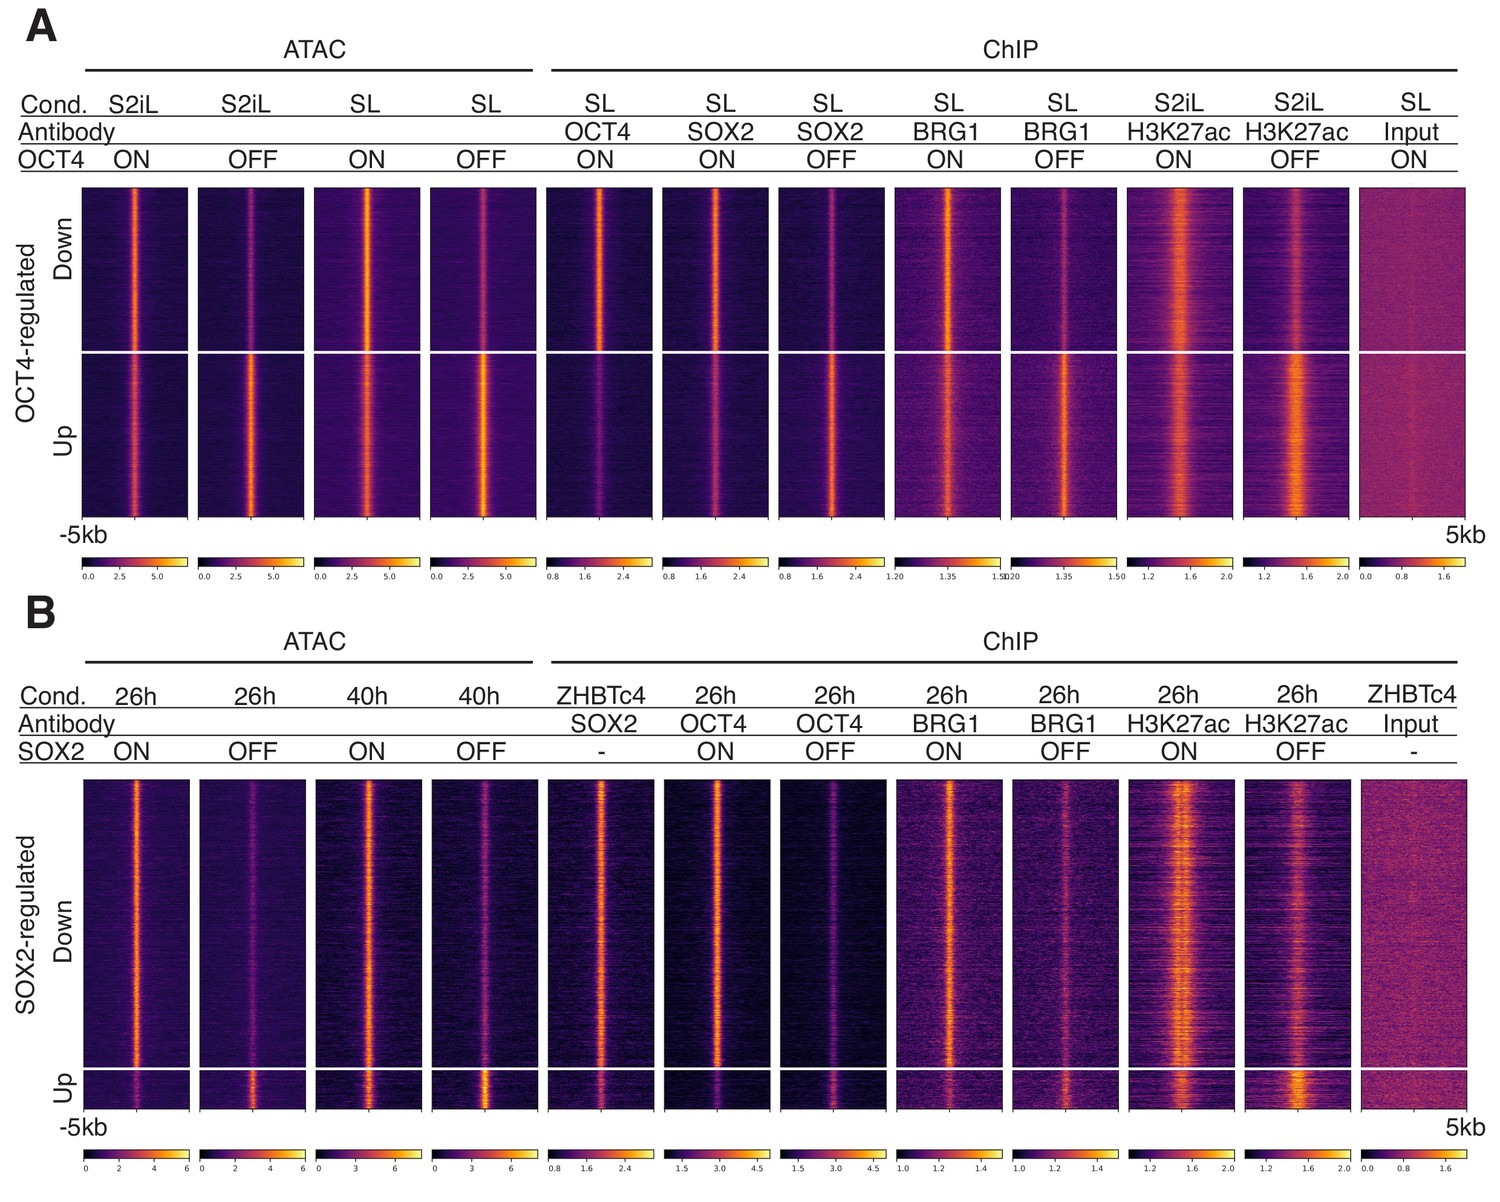
Heatmaps of ATAC-seq and ChIP-seq profiles in OCT4 OFF and SOX2 OFF cell lines at affected loci.
Heatmaps of RPKM-normalized ATAC-seq and ChIP-seq binding profiles upon OCT4 (A) and SOX2 (B) depletion 5 kb around OCT4-regulated (A) and SOX2-regulated (B) loci. Each row represents one individual locus and each column represents one experimental condition.
Figure 1—figure supplement 3

Classification of OCT4/SOX2 binding sites.
(A) Classification of all OCT4 and SOX2 binding sites into OD, CD, and SD loci as well as loci that were discarded due to differences in untreated cells between conditions or cell lines (Discarded), due to incongruent effect on accessibility after depletion in different conditions (Incongruent), and those that were increased in accessibility or unaffected by depletion. (B) ChromHMM signal enrichment at OD, CD, and SD loci as well as bound loci that were unaffected by depletion and loci not bound by OCT4 or SOX2.
Figure 2 with 2 supplements
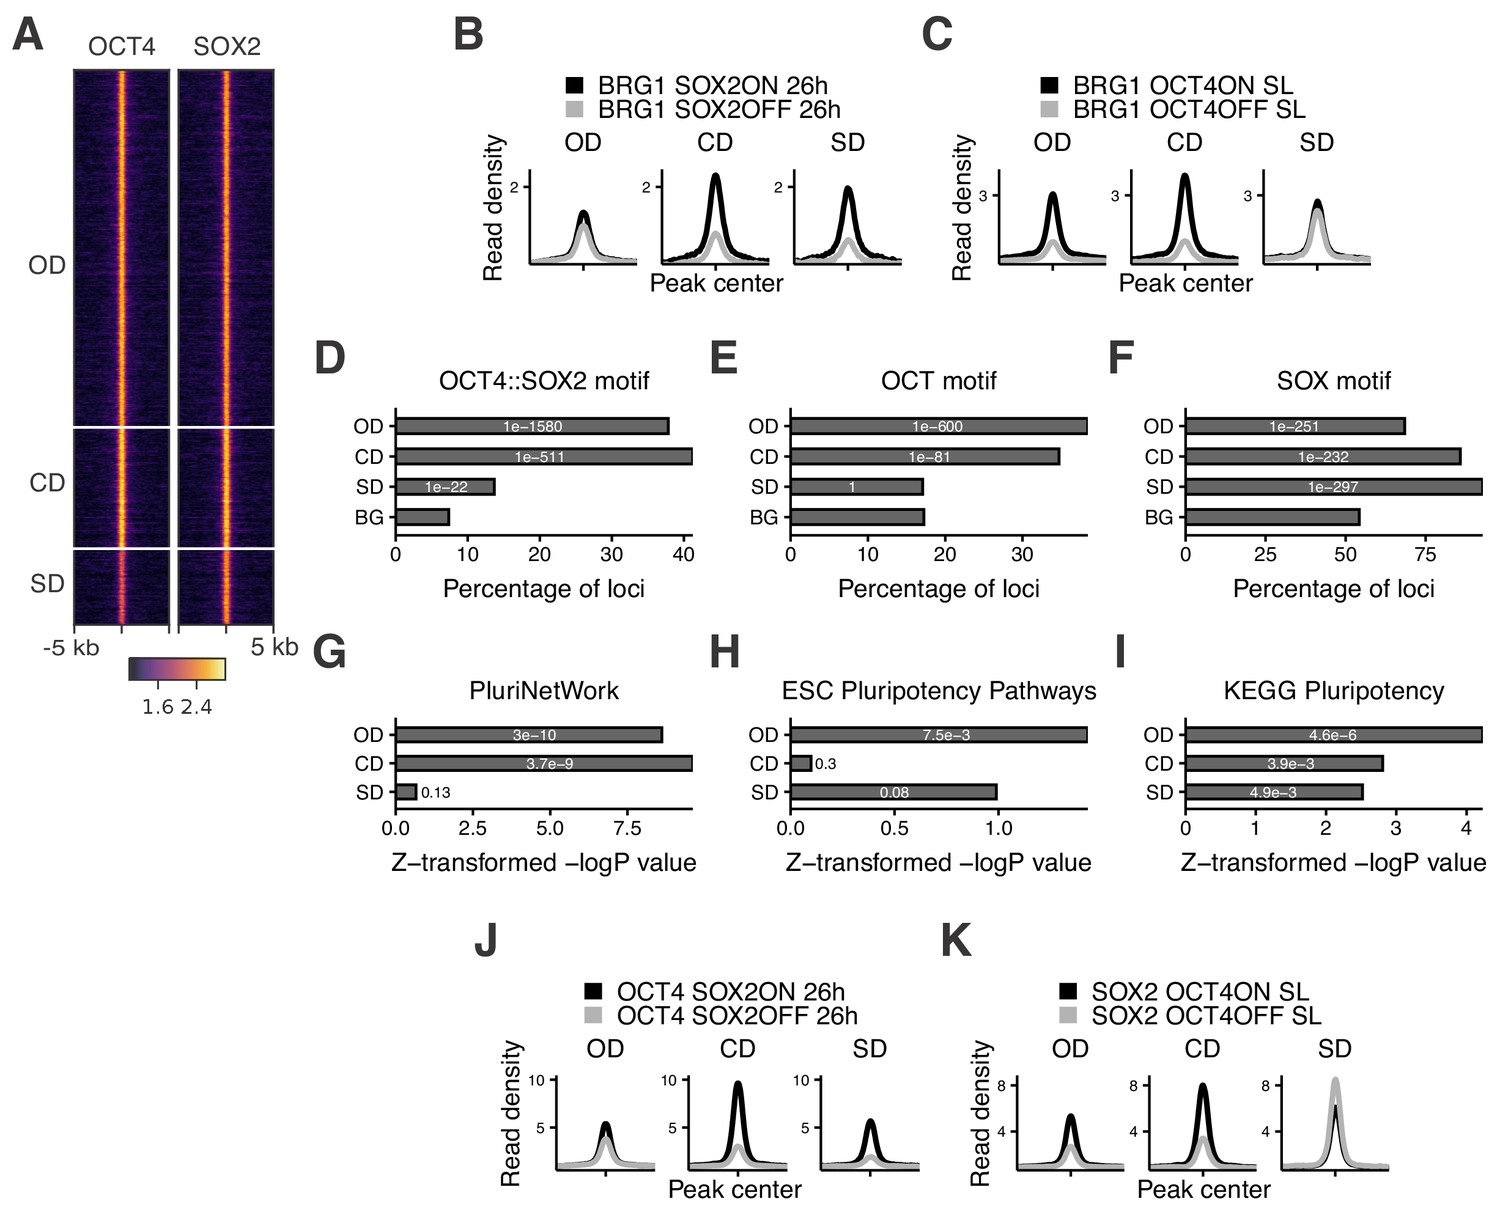
Characterization of OCT4/SOX2-dependent loci.
(A) Heatmap of RPKM-normalized OCT4 and SOX2 ChIP-seq binding profiles in untreated ZHBTc4 cells 5 kb around OD, CD, and SD loci. Each row represents one individual locus. (B–C) Average RPKM-normalized BRG1 ChIP-seq signal 2 kb around OD, CD, and SD loci upon SOX2 depletion (B) and OCT4 depletion (C). (D–F) Frequency of overlap (bar) and enrichment p-values (white digits) of motifs at OD, CD, and SD loci as well as in background regions (BG) for the canonical OCT4::SOX2 motif (D), the OCT motif (E), and the SOX motif (F). (G–I) Relative enrichment values (bar) and p-values (white digits) for the closest genes in the OD, CD, and SD groups in the gene ontology sets PluriNetWork (G), ESC Pluripotency Pathways (H), and the KEGG gene set ‘Signaling pathways regulating pluripotency’ (I). (J–K) Average RPKM-normalized OCT4 (J) and SOX2 (K) ChIP-seq signal 2 kb around OD, CD, and SD loci upon SOX2 depletion (J) and OCT4 depletion (K). Statistics for (B–C), (J–K) are available in Supplementary file 1.
Figure 2—figure supplement 1
Additional characterization of OD, CD, and SD loci.
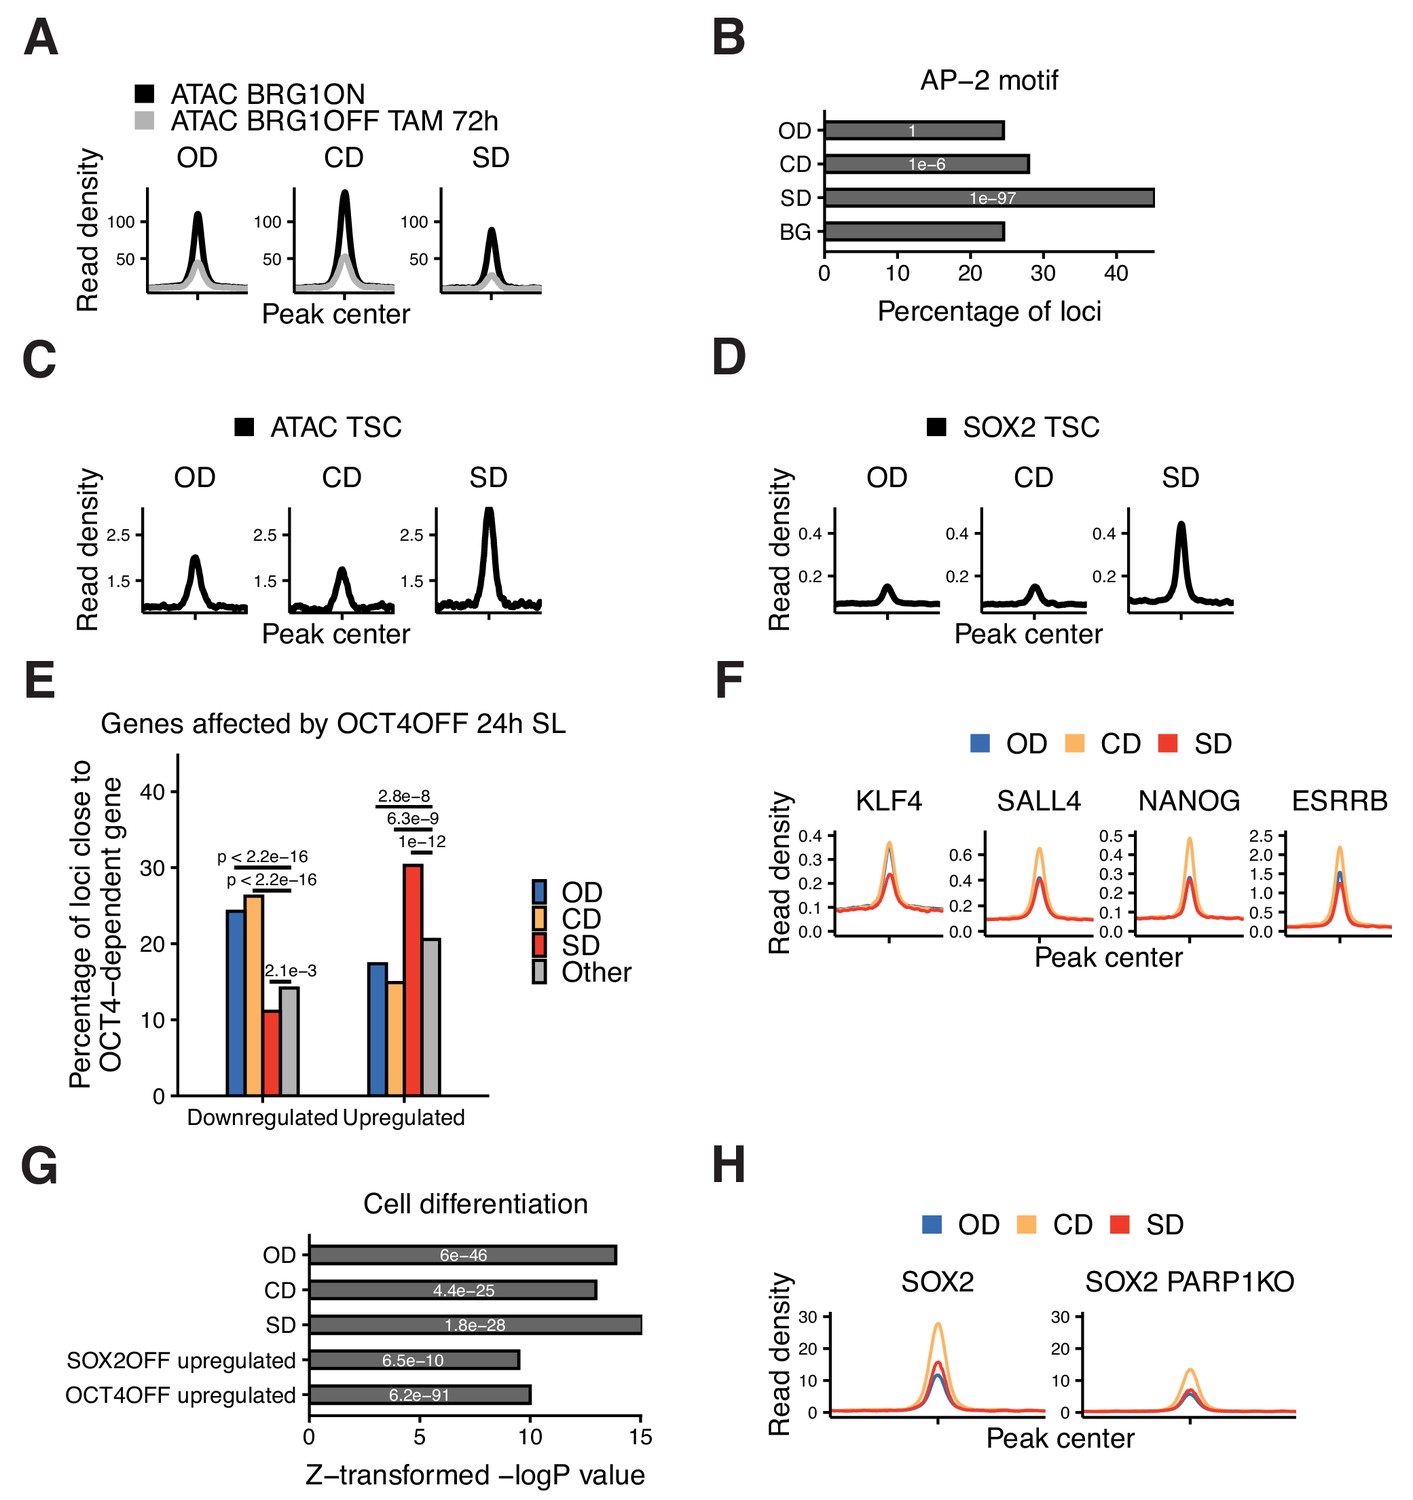
(A) Average ATAC-seq signal 2 kb around OD, CD, and SD loci in BRG1fl cells that were treated with tamoxifen (TAM) or left untreated. (B) Frequency of overlap (bar) and enrichment p-values (white digits) of the AP-2 motif 2 kb around OD, CD, and SD loci, and in background regions (BG). (C) Average ATAC-seq signal in TS cells 2 kb around OD, CD, and SD loci. (D) Average SOX2 ChIP-seq signal in TS cells 2 kb around OD, CD, and SD loci. (E) Percentage of the closest gene in the OD, CD, and SD groups as well as all other accessible regions (Other) whose nascent RNA levels are downregulated or upregulated upon 24 hr of OCT4 depletion. p-values: Fisher’s exact test. (F) Average ChIP-seq signal of ESRRB, NANOG, KLF4, and SALL4 in ES cells 2 kb around OD, CD, and SD loci. (G) Relative enrichment values (bar) and p-values (white digits) for the closest genes in the OD, CD, and SD groups, as well as loci upregulated upon SOX2 and OCT4 depletion, in the ‘Cell differentiation’ gene ontology set. (H) Average ChIP-seq signal of SOX2 2 kb around OD, CD, and SD loci in wt and PARP1 KO ES cells. Statistics for (A), (C–D), (F), (H) are available in Supplementary file 1.
Figure 2—figure supplement 2
Additional analyses of accessibility and binding changes upon SOX2 and OCT4 depletion.
(A) Correlation between log2 fold-change values of accessibility (x-axis) and OCT4 binding (y-axis) upon SOX2 depletion in 2TS22C cells with dox treatment for 26 hr. Coefficient (R) and p-value are based on the Pearson correlation coefficient. (B–C) Average RPKM-normalized ATAC-seq signal 2 kb around OD (n = 3’730), CD (n = 1’463), and SD (n = 273) loci that overlap with a canonical OCT4::SOX2 motif upon SOX2 (B) and OCT4 (C) depletion. (D–E) Average RPKM-normalized OCT4 (D) and SOX2 (E) ChIP-seq signal 2 kb around OD, CD, and SD loci that overlap with a canonical OCT4::SOX2 motif upon SOX2 (D) and OCT4 (E) depletion. (F) Average RPKM-normalized ATAC-seq signal upon SOX2 depletion 2 kb around loci that display a significant increase in accessibility and SOX2 binding upon OCT4 depletion (n = 3’270). (G) Average RPKM-normalized BRG1 ChIP-seq signal upon OCT4 depletion 2 kb around loci that display a significant increase in accessibility and SOX2 binding upon OCT4 depletion. Statistics for (B–G) are available in Supplementary file 1.
Figure 3 with 4 supplements

Mitotic degradation of OCT4 results in different patterns of accessibility loss.
(A) Experimental strategy used to assess the impact of OCT4 depletion at the M-G1 transition. (B–C) Genome browser tracks of RPKM-normalized accessibility profiles across the cell cycle for one locus that decreases (B) at chr11:6894809–6895533 and one that increases (C) at chr9:41247953–4124841 in accessibility upon transient OCT4 depletion in M-G1. (D) log2 fold-change values of accessibility between MD-OCT4 and MD*-OCT4 (control) cells in different cell cycle phases at all accessible OCT4-bound sites, grouped into four clusters by k-means clustering (see Materials and methods). Each line represents one locus. Red line: mean. (E) Frequency of overlap (bar) and enrichment p-values (white digits) of the canonical OCT4::SOX2 motif in the four clusters as well as in unbound regions. The color shows the number of identified OCT4::SOX2 motifs per region. (F) Average RPKM-normalized OCT4 ChIP-seq signal in untreated ZHBTc4 cells 2 kb around loci in the four clusters. Statistics are available in Supplementary file 1. EG1: Early G1 phase; LG1: Late G1 phase; S: S phase; SG2: Late S and G2 phase.
Figure 3—figure supplement 1
Characterization of MD-OCT4 and MD*-OCT4 cell lines.
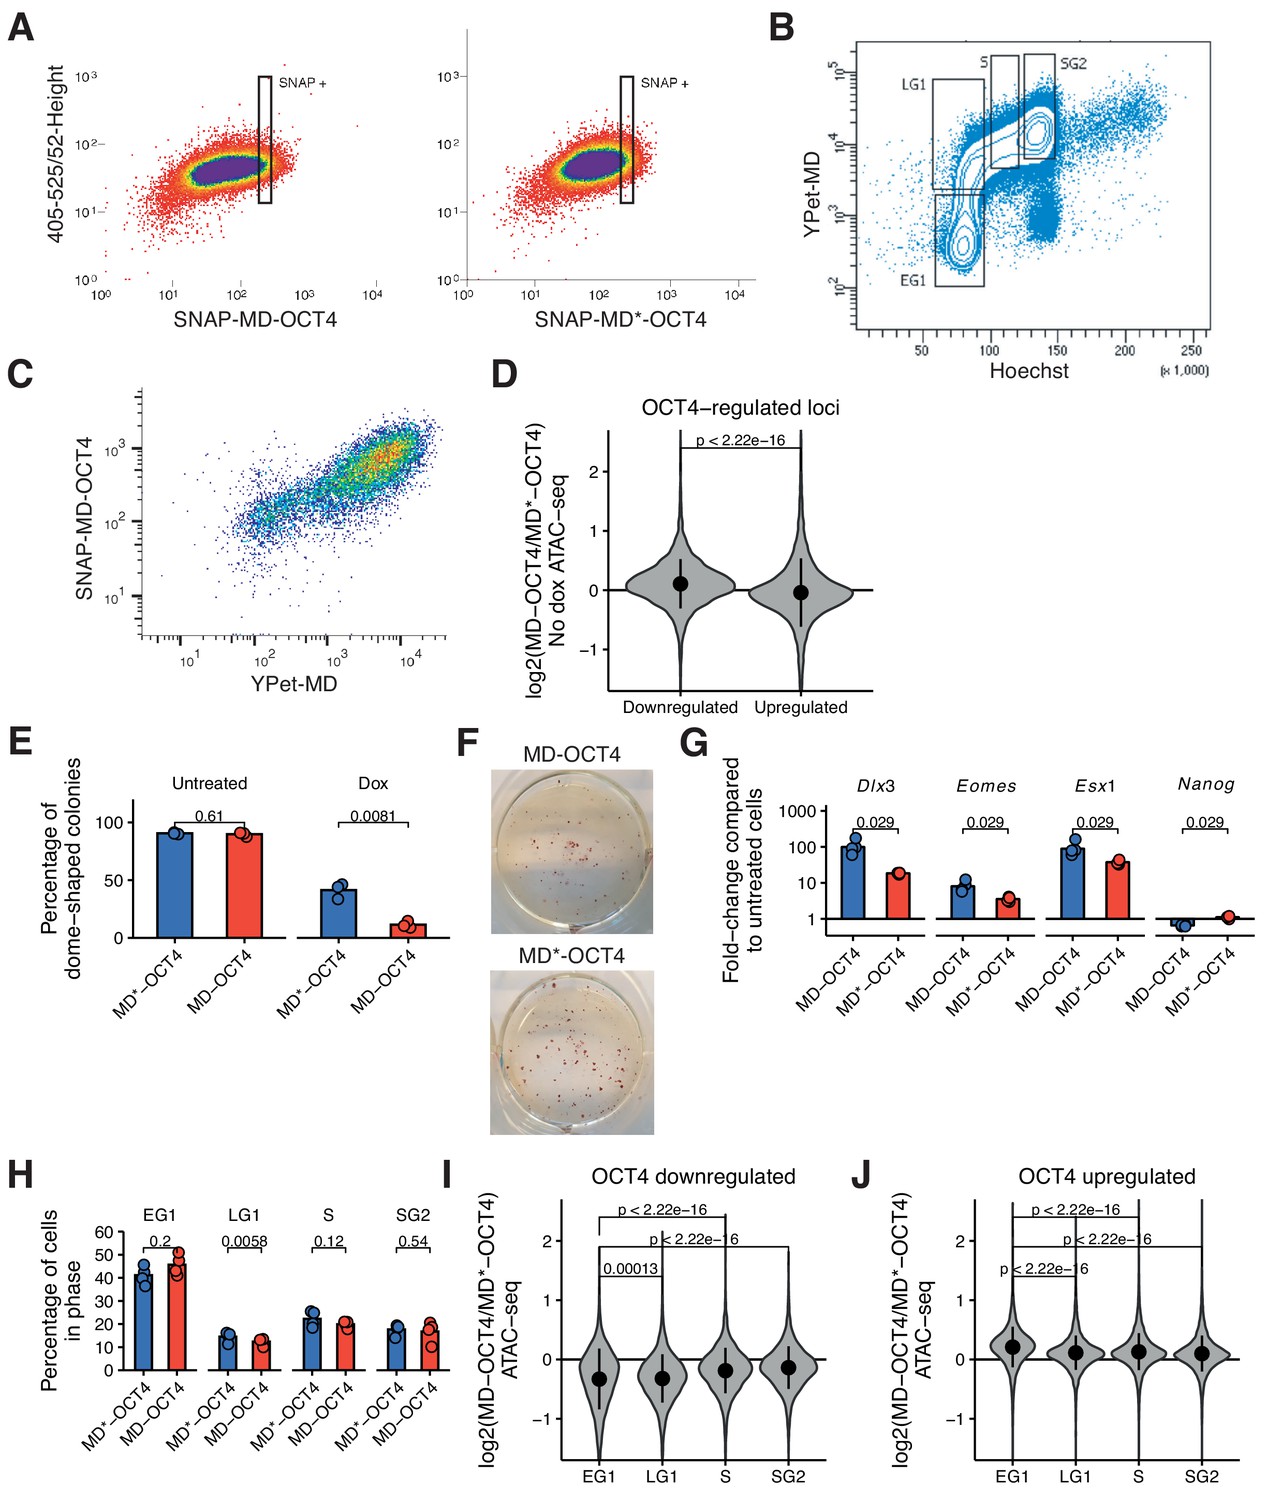
(A) Gate used to sort SNAP-MD-OCT4 (left) and SNAP-MD*-OCT4 (right) cells for the same average SNAP-Cell 647-SiR signal. Y-axis: Signal amplitude at 405 nm excitation and 526/52 nm emission (negative control). X-axis: Signal amplitude at 640 nm excitation and 671/30 nm emission (SNAP signal). (B) Example of a sorting experiment for different phases of the cell cycle in cells expressing YPet-MD and stained for Hoechst33258. Y-axis: Integrated signal at 488 nm excitation and 525/50 nm emission (YPet). X-axis: Signal amplitude at 355 nm excitation and 450/50 nm emission (Hoechst) (C) Correlation between YPet-MD and SNAP-MD-OCT4 expression in MD-OCT4 cells as measured by flow cytometry. Y-axis: Integrated signal at 640 nm excitation and 670/14 nm emission (SNAP). X-axis: Integrated signal at 488 nm excitation and 525/50 nm emission (YPet). (D) Violin plot of log2 fold-change values of accessibility between MD-OCT4 and MD*-OCT4 cells in significantly downregulated and upregulated loci (see Figure 1B) in unsorted cells in the absence of dox. Dots: mean; Vertical lines: standard deviation; p-values: Mann-Whitney U. (E) Percentage of dome-shaped colonies as assessed by microscopy in the ZHBTc4 cell line upon dox treatment and with overexpression of SNAP-MD*-OCT4 or SNAP-MD-OCT4. n = 3 biological replicates; p-values: paired t-test. (F) Representative alkaline phosphatase staining from cells in (E). (G) Fold-change of expression levels of differentiation markers (Dlx3, Eomes and Esx1) and Nanog, measured by RT-qPCR in dox-treated versus untreated cells, in MD-OCT4 and MD*-OCT4 cells. Each sample is normalized to the expression of Rps9. n = 4 biological replicates; p-values: Mann-Whitney U. (H) Percentage of cells in EG1/LG1/S/SG2 phases as determined by flow cytometry in MD-OCT4 and MD*-OCT4 cells. n = 4 biological replicates; p-values: paired t-test. (I–J) Violin plot of log2 fold-change values of accessibility between MD-OCT4 and MD*-OCT4 cells in different cell cycle phases at significantly downregulated (I) and upregulated (J) loci (see Figure 1B). Dots: mean; Vertical lines: standard deviation; p-values: Mann-Whitney U. EG1: Early G1 phase; LG1: Late G1 phase; S: S phase; SG2: Late S and G2 phase.
Figure 3—figure supplement 2
Analyses of distance to closest gene and histone modifications in clusters.
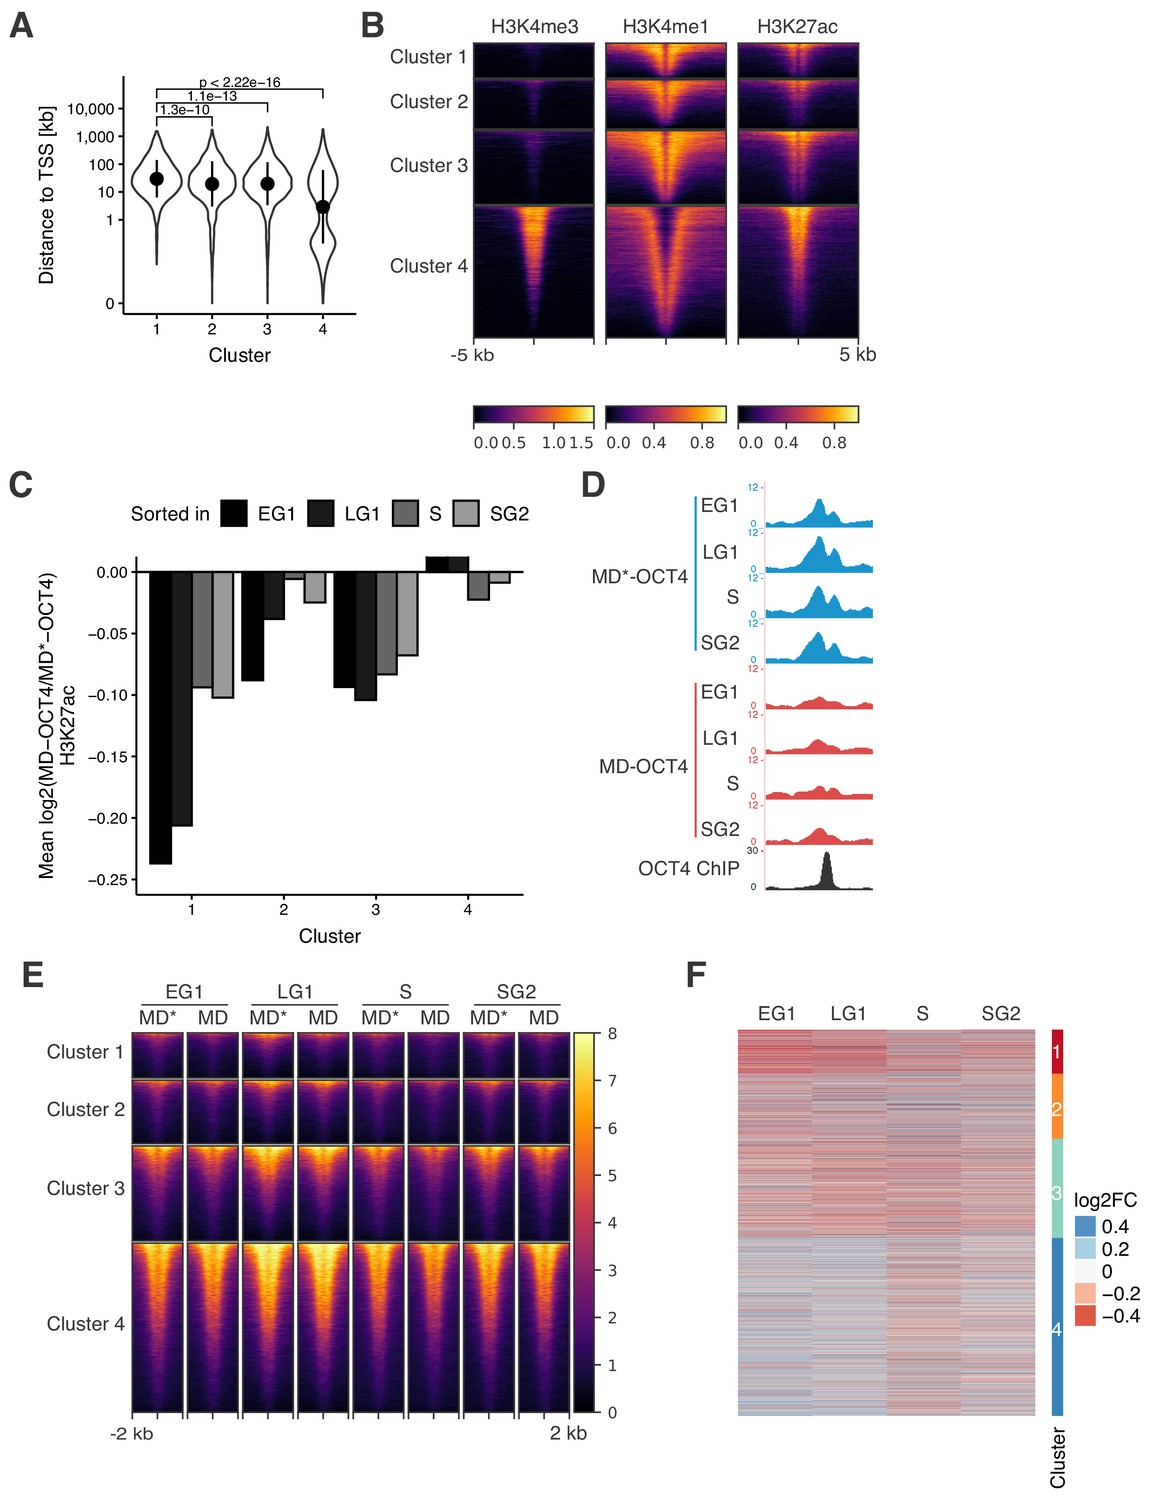
(A) Violin plot of distance to closest TSS in the clusters from Figure 3D. Dots: mean; Vertical lines: standard deviation; p-values: Mann-Whitney U. (B) Heatmap of ChIP-seq signal of H3K4me3, H3K4me1, and H3K27ac in wt ES cells 5 kb around regions in the clusters from Figure 3D. Each row corresponds to one individual locus. (C) Average log2 fold-change values of H3K27ac ChIP-seq signal between MD-OCT4 and MD*-OCT4 cells in the clusters from Figure 3D (including 500 bp flanking regions at each side) at different cell cycle phases. Statistics are available in Supplementary file 1. (D) Genome browser tracks of RPKM-normalized H3K27ac profiles across the cell cycle for a cluster one locus (chr11:6894809–6895533) that decreases in accessibility and H3K27ac upon transient OCT4 depletion in M-G1. (E) Heatmap of RPKM-normalized H3K27ac ChIP-seq signal 2 kb around regions in the clusters from Figure 3D in MD*-OCT4 (MD*) and MD-OCT4 (MD) cells at different cell cycle phases. Each row corresponds to one individual locus. (F) log2 fold-change values of H3K27ac ChIP-seq signal between MD-OCT4 and MD*-OCT4 cells in the clusters from Figure 3D (including 500 bp flanking regions at each side) at different cell cycle phases. Each row corresponds to one individual locus. EG1: Early G1 phase; LG1: Late G1 phase; S: S phase; SG2: Late S and G2 phase.
Figure 3—figure supplement 3
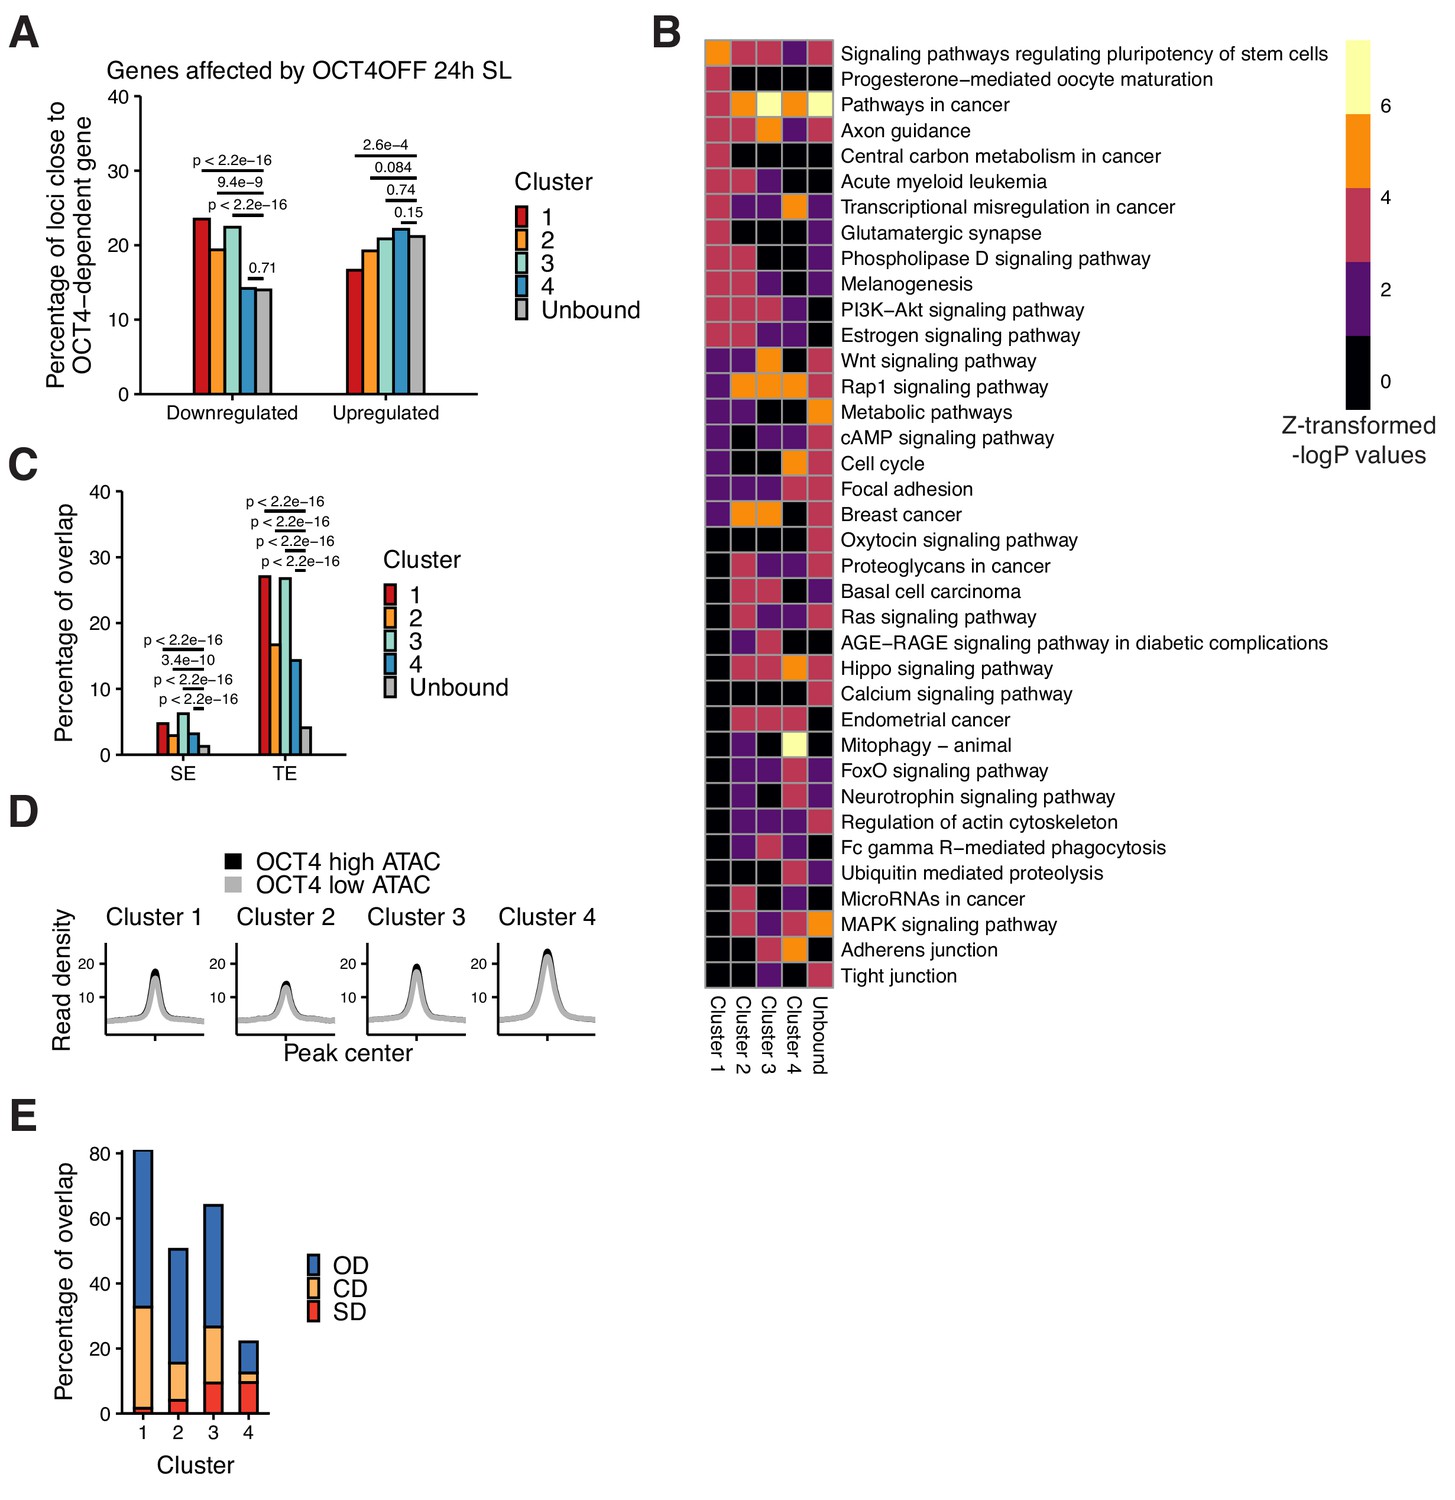
Additional analyses of clusters.
(A) Percentage of the closest gene in the clusters from Figure 3D and at non-OCT4 bound accessible regions whose nascent RNA levels are downregulated or upregulated upon 24 hr of OCT4 depletion. p-values: Fisher’s exact test. (B) Relative enrichment values (Z-transformed –logP) for the closest genes in the clusters from Figure 3D and at non-OCT4 bound accessible regions, in all KEGG gene ontology sets with Z > 3, sorted by enrichment in cluster 1. (C) Percentage of loci in the clusters from Figure 3D and at non-OCT4 bound accessible regions overlapping typical enhancers (TE) and super-enhancers (SE) in mouse ES cells. (D) RPKM-normalized ATAC-seq signal in cells sorted for high and low endogenous OCT4 levels 2 kb around loci in the clusters from Figure 3D. Statistics are available in Supplementary file 1. (G) Percentage of loci in the clusters from Figure 3D overlapping OD, CD, and SD loci from Figure 1C.
Figure 3—figure supplement 4
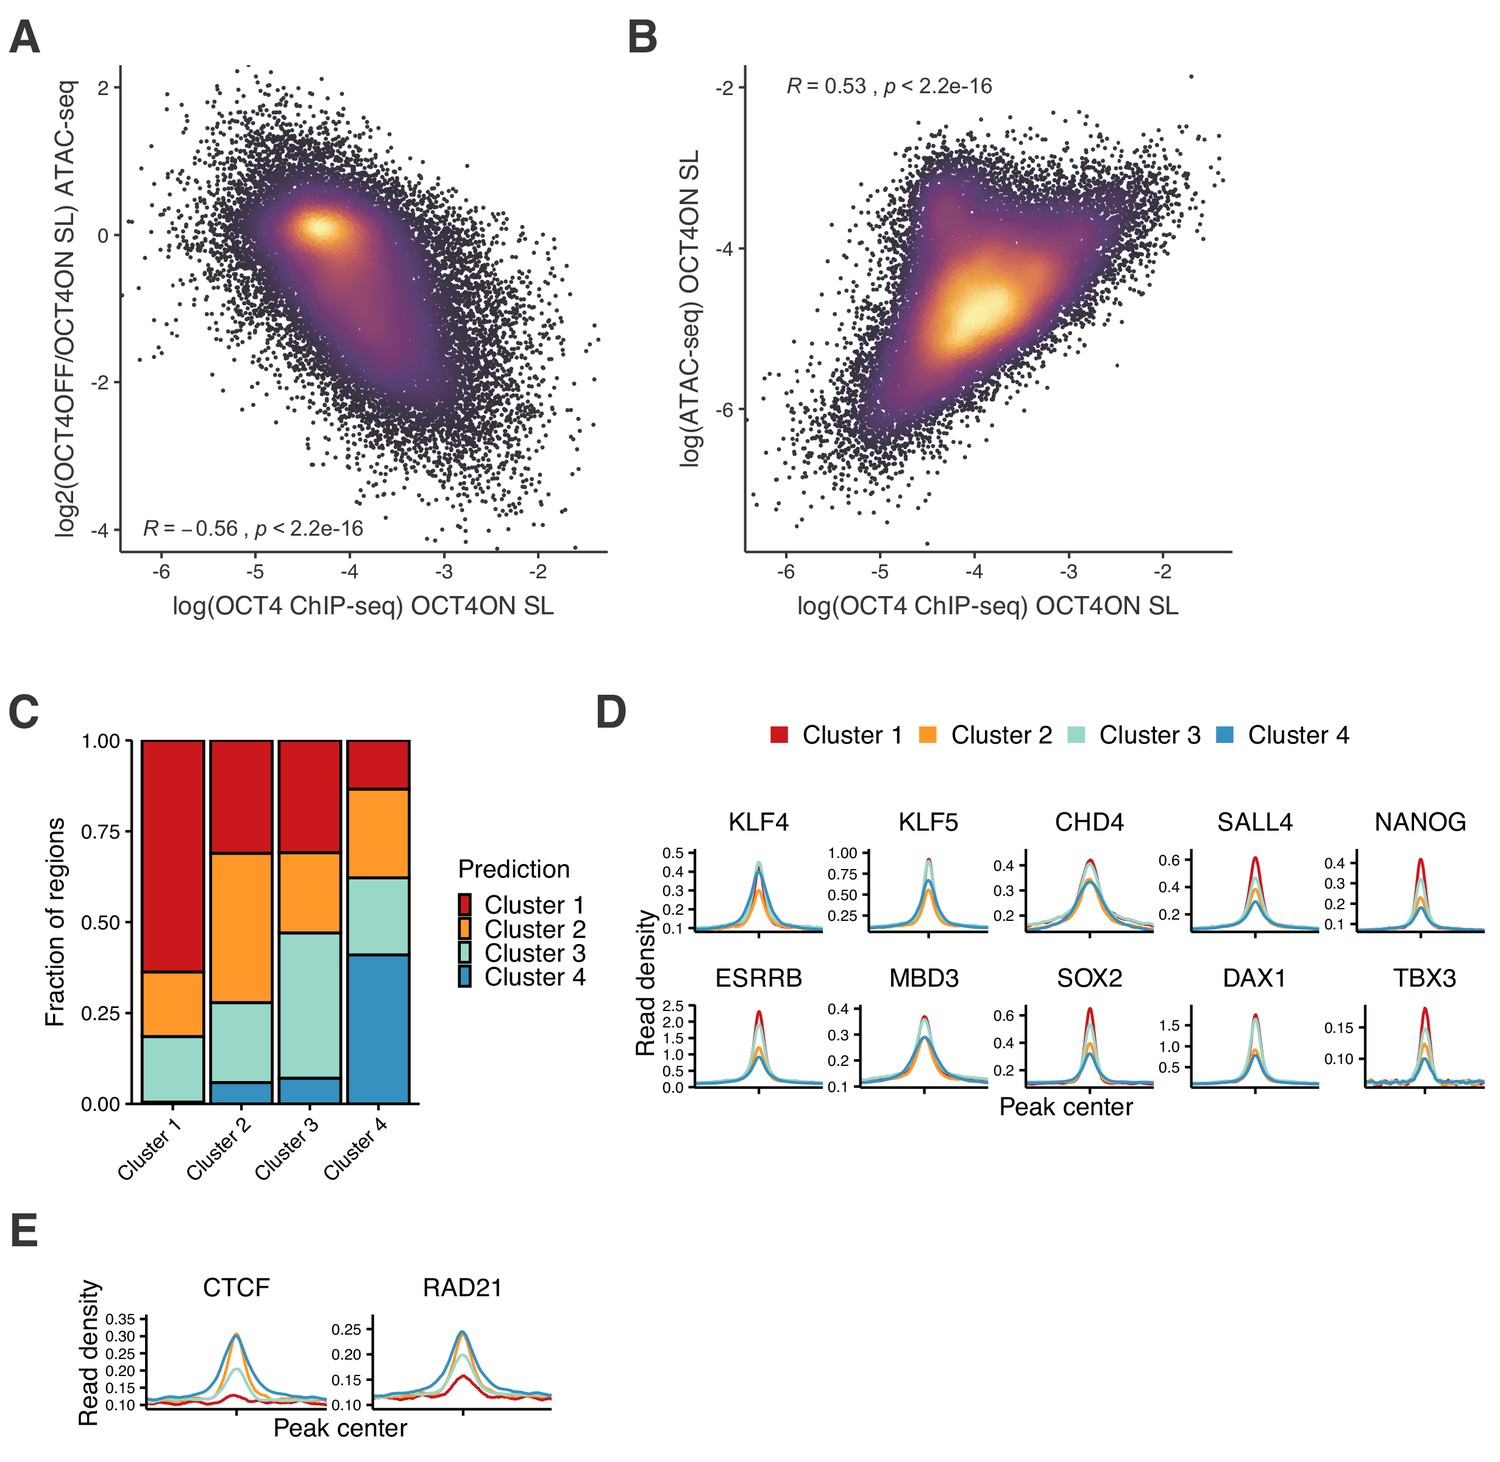
Correlation between OCT4 binding and chromatin accessiblity, and analysis of results from random forest model.
(A) Correlation between the log of normalized OCT4 ChIP-seq reads per bp (x-axis) and the log2 fold-change values of accessibility loss upon OCT4 depletion (y-axis) at all OCT4 binding sites in ZHBTc4 cells. (B) Correlation between the log of normalized OCT4 ChIP-seq reads per bp (x-axis) and the log of normalized ATAC-seq reads per bp (y-axis) at all OCT4 binding sites in ZHBTc4 cells. Coefficient (R) and p-values are based on the Pearson correlation coefficient. (C) Cluster predictions of regions in the test data based on a random forest model using mouse ES cell ChIP-seq data (see Materials and methods). The x‐axis shows the true cluster, and the y‐axis shows the fraction of regions predicted to belong to the clusters from Figure 3D (colors). (D) Average ChIP-seq signal of KLF4, KLF5, CHD4, SALL4, NANOG, ESRRB, MBD3, SOX2, DAX1, and TBX3 in ES cells 2 kb around regions in the clusters from Figure 3D. (E) Average ChIP-seq signal of CTCF and RAD21 in ES cells 2 kb around regions in the clusters from Figure 3D. Statistics for (D–E) are available in Supplementary file 1.
Figure 4 with 2 supplements
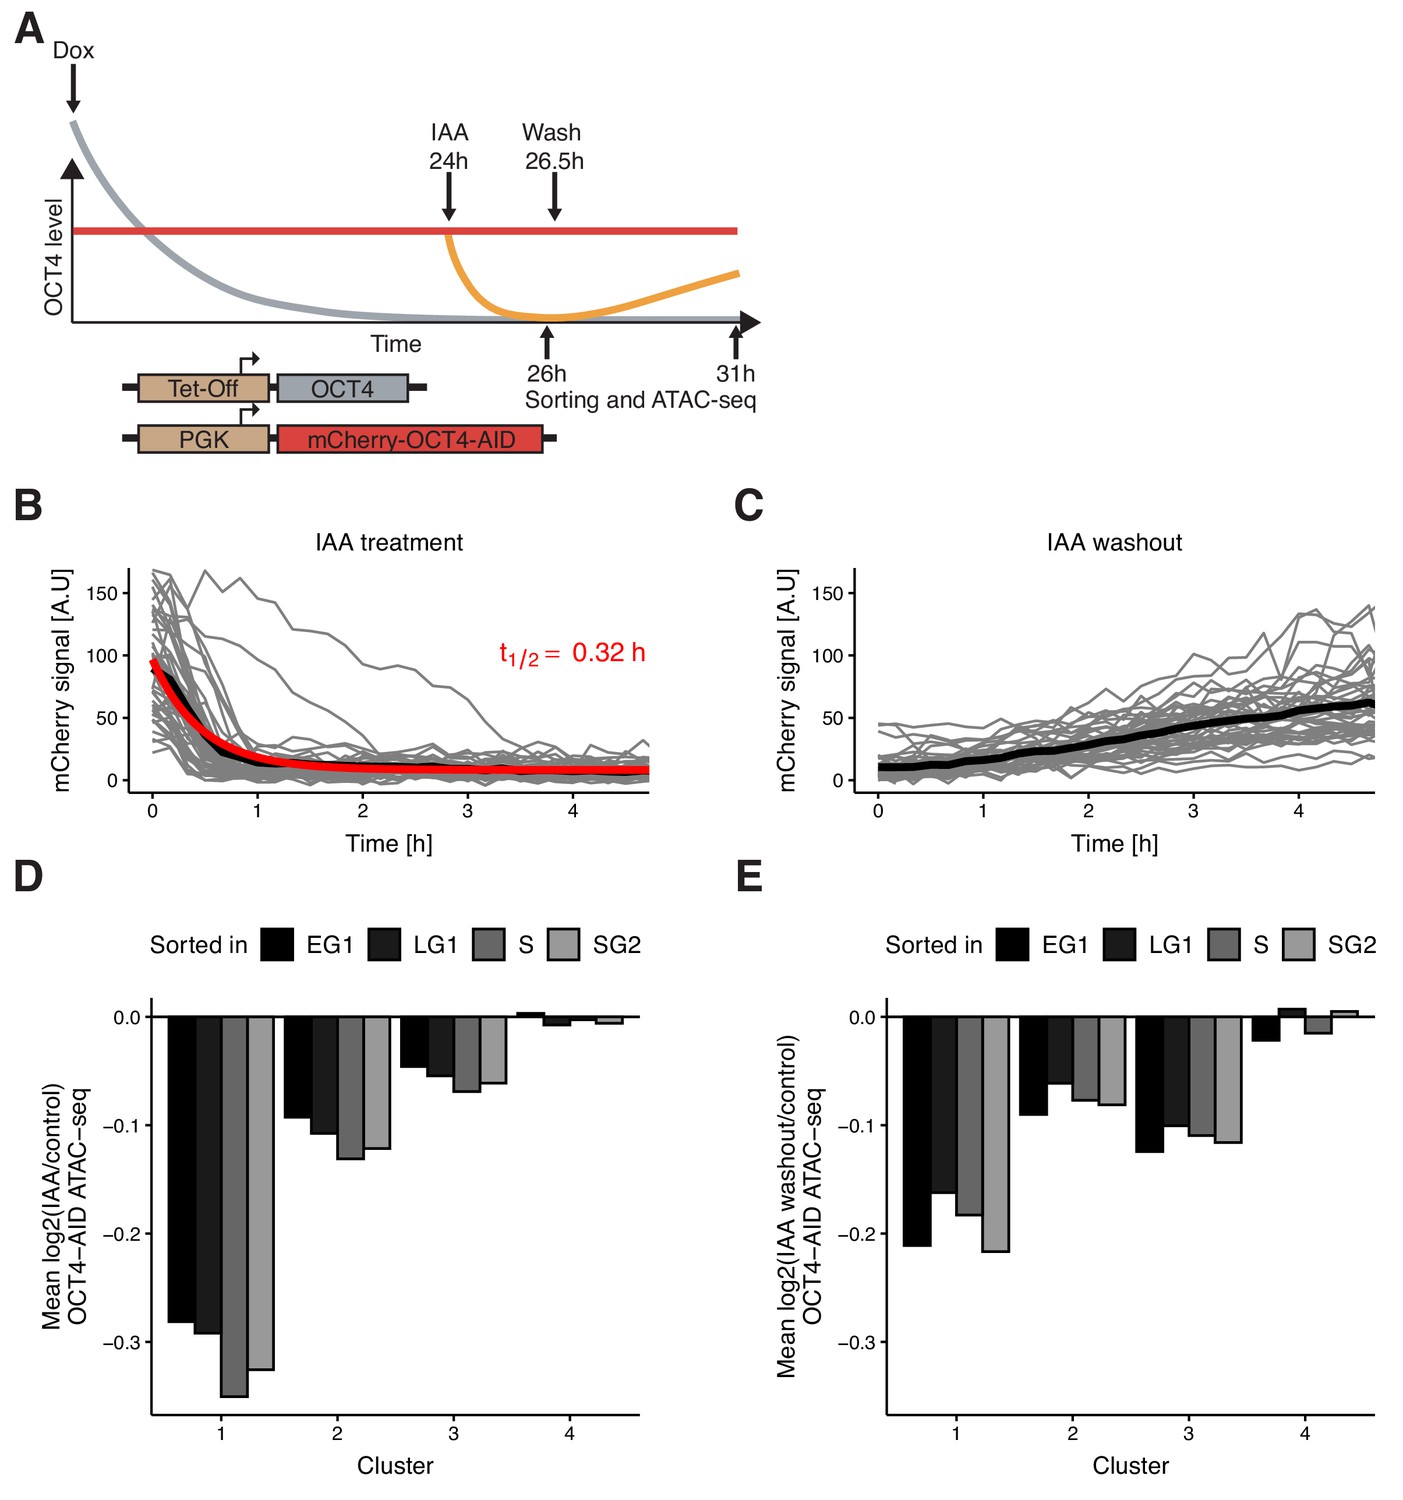
Auxin-inducible degradation reveals pioneer activity of OCT4 at different cell cycle phases.
(A) Experimental strategy used to assess the impact of OCT4 depletion and recovery at different cell cycle phases. (B) Red fluorescence (mCherry) signal in mCherry-OCT4-AID cells treated with IAA at t = 0 as measured by fluorescence microscopy. Gray lines: single cell traces; Black line: population average; Red line: exponential fit. Red text: half-life value derived from the exponential fit. n = 45 cells from one replicate (C) Red fluorescence (mCherry) signal in mCherry-OCT4-AID treated with IAA for 2.5 hr and then washed out at t = 0 as measured by fluorescence microscopy. Gray lines: single cell traces; Black line: population average. n = 45 cells from one replicate (D) Average log2 fold-change values of accessibility between IAA-treated and untreated OCT4-AID cells in the four clusters from Figure 3D at each cell cycle phase. (E) Average log2 fold-change values of accessibility between cells first treated with IAA and then washed out, compared to untreated OCT4-AID cells for the four clusters from Figure 3D at each cell cycle phase. EG1: Early G1 phase; LG1: Late G1 phase; S: S phase; SG2: Late S and G2 phase. Statistics for (D–E) are available in Supplementary file 1.
-
Figure 4—source data 1
Time-lapse microscopy source data of mCherry-OCT4-AID signal after IAA treatment (Figure 4B) and washout (Figure 4C).
Time is in hours; Signal is the background-subtracted mean intensity; Cell is the cell unique identifier of each tracked cell; Treatment indicates IAA or Washout just prior to imaging.
- https://cdn.elifesciences.org/articles/50087/elife-50087-fig4-data1-v1.xlsx
Figure 4—figure supplement 1
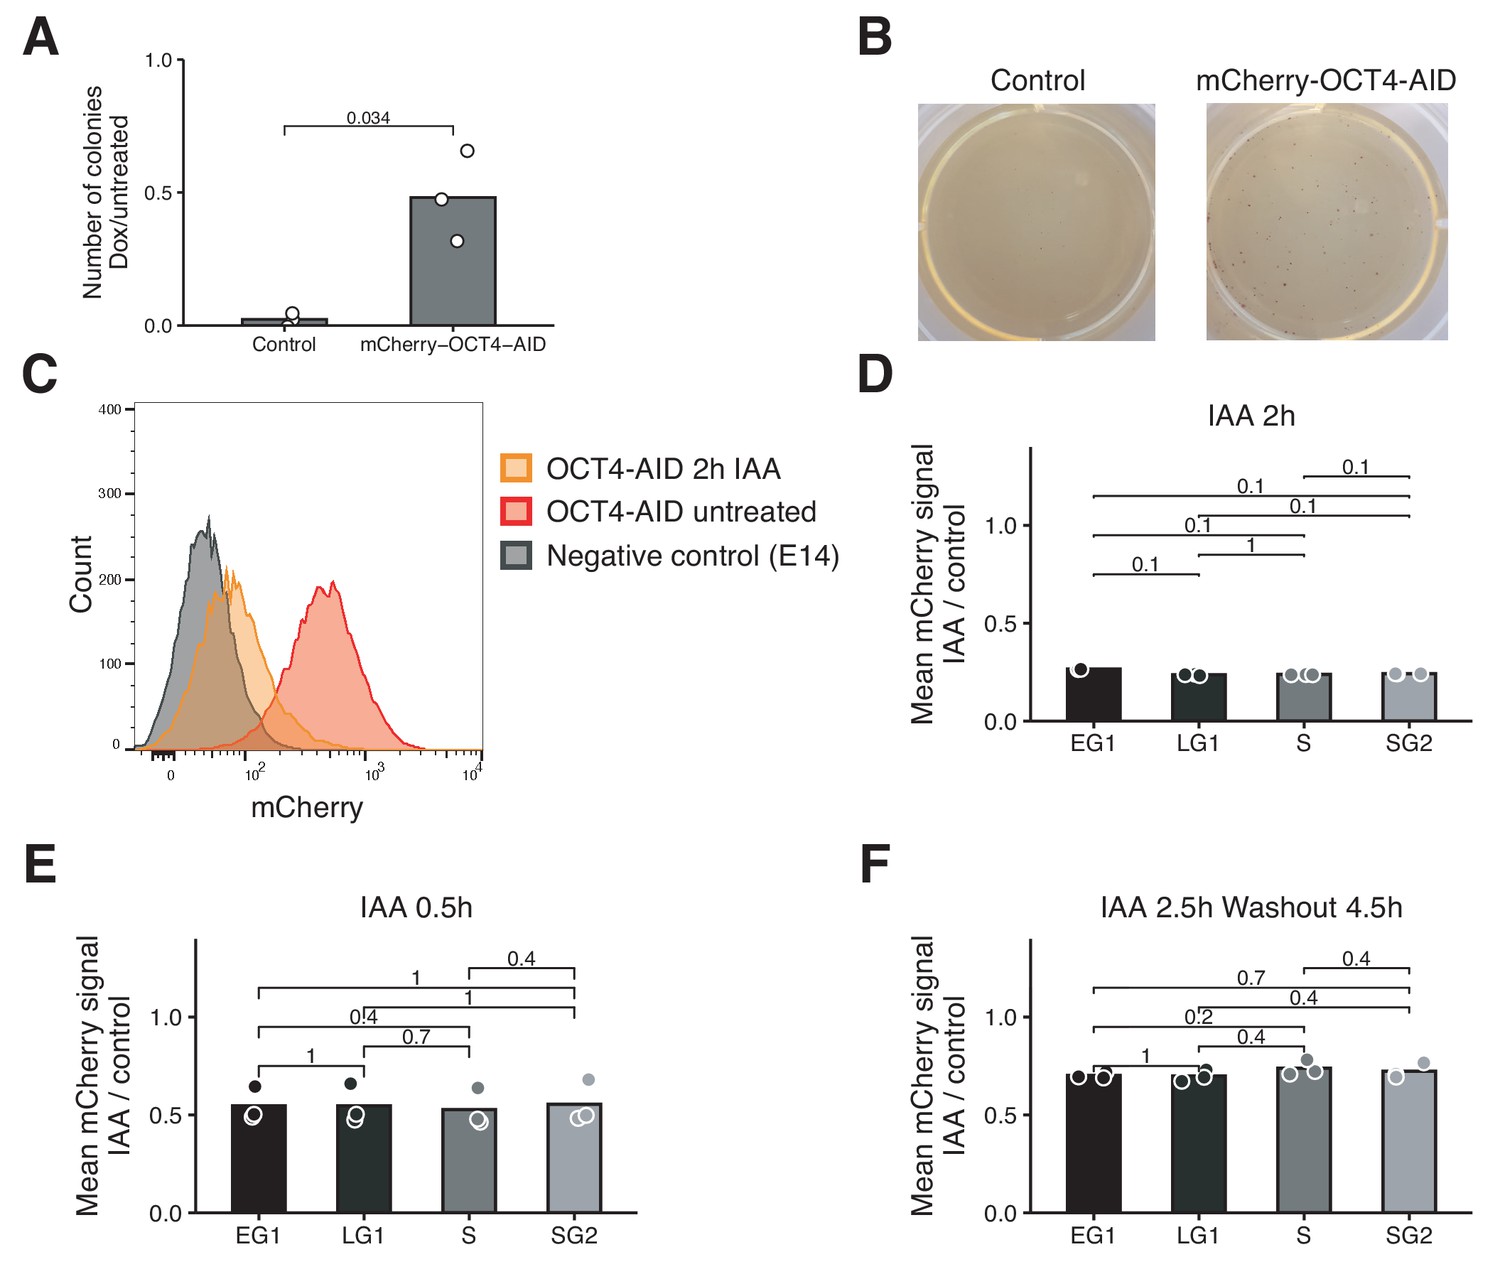
Characterization of mCherry-OCT4-AID cell line.
(A) Ratio of the number of colonies with and without dox treatment, for wt ZHBTc4 cells (Control) and ZHBTc4 cells expressing mCherry-OCT4-AID after one week in culture. n = 3 biological replicates; p‐values: paired t-test. (B) Representative alkaline phosphatase staining from cells in (A). (C) Histogram of mCherry signal in untreated mCherry OCT4-AID cells and treated with IAA for 2 hr as well as mCherry-negative E14 ES cells as measured by flow cytometry. X-axis: Integrated signal at 561 nm excitation and 610/20 nm emission. Y-axis: Counts. (D–F) Fold-change of red fluorescence (mCherry) signal between treated and untreated mCherry-OCT4-AID cells as determined by flow cytometry in different cell cycle phases upon 2 hr IAA treatment (D), 0.5 hr IAA treatment (E), and after 2.5 hr IAA treatment followed by 4.5 hr of washout (F). n = 3 biological replicates; p-values: Mann-Whitney U. EG1: Early G1 phase; LG1: Late G1 phase; S: S phase; SG2: Late S and G2 phase.
Figure 4—figure supplement 2
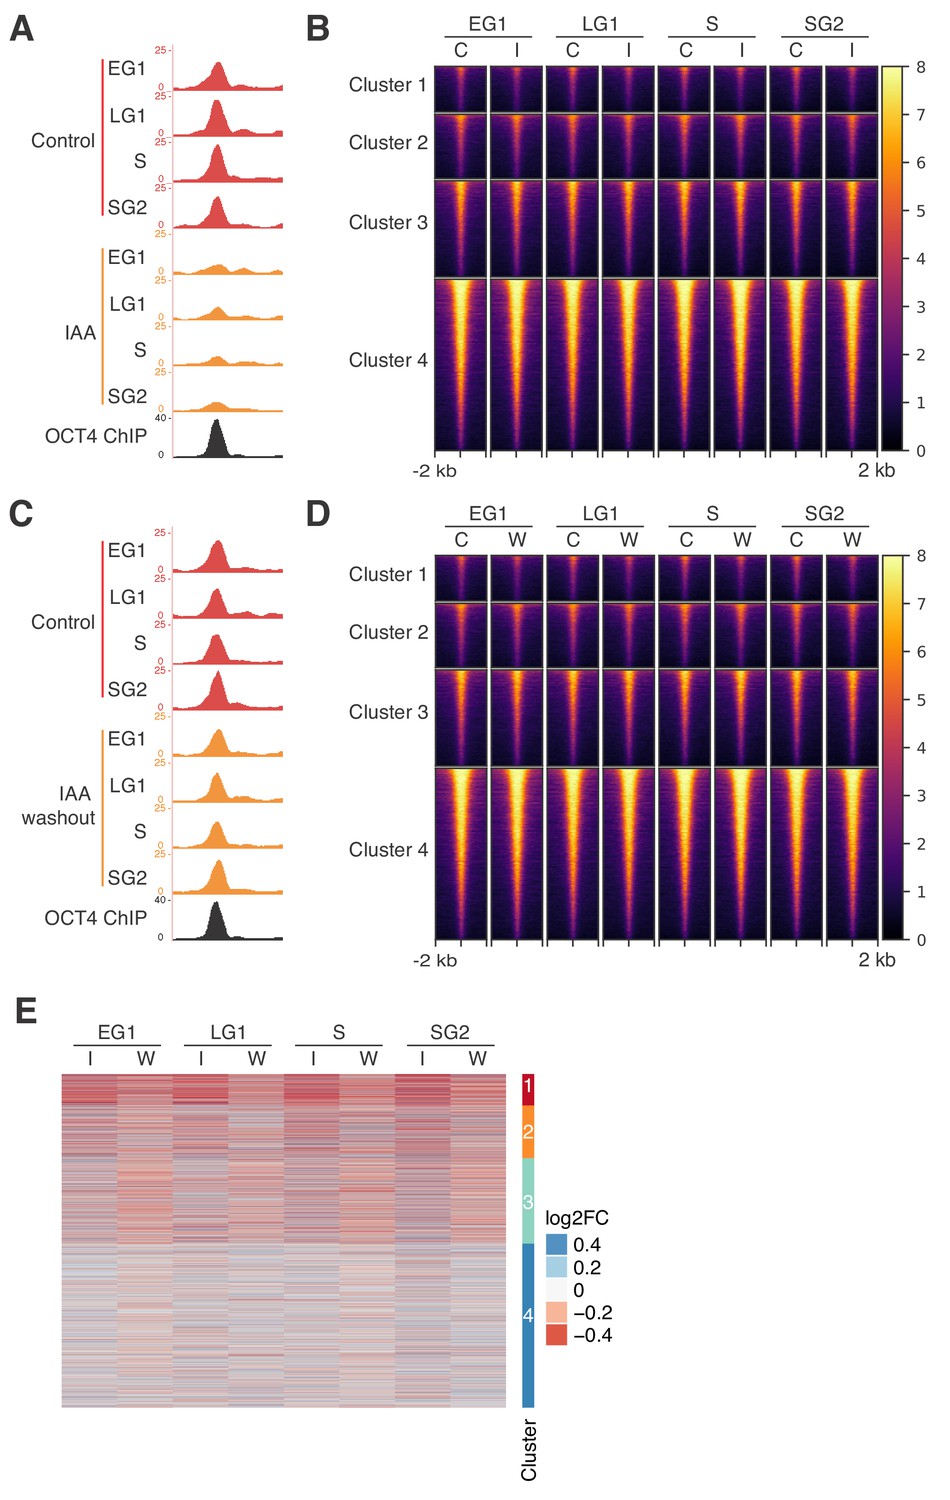
Additional data on accessibility changes upon rapid IAA-mediated OCT4 depletion.
(A) Genome browser tracks of accessibility profiles of a cluster 1 locus at chr10:95455826–95456819 after IAA treatment. (B) Heatmap of RPKM-normalized ATAC-seq signal 2 kb around regions in the clusters from Figure 3D in untreated control cells (labeled ‘C’) and IAA-treated cells (labeled ‘I’) at different cell cycle phases in the clusters from Figure 3D. Each row corresponds to one individual locus. (C) Genome browser tracks of accessibility profiles of a cluster 1 locus at chr10:95455826–95456819 after IAA treatment followed by washout. (D) Heatmap of RPKM-normalized ATAC-seq signal 2 kb around regions in the clusters from Figure 3D in untreated control washed out cells (labeled ‘C’) and IAA-treated and washed out cells (labeled ‘W’) at different cell cycle phases in the clusters from Figure 3D. Each row corresponds to one individual locus. (E) log2 fold-change values of ATAC-seq signal between IAA-treated and untreated cells in the clusters from Figure 3D at different cell cycle phases upon 2 hr IAA treatment (labeled ‘I’) and 2.5 hr IAA treatment followed by 4.5 hr washout (labeled ‘W’). Each row corresponds to one individual locus. EG1: Early G1 phase; LG1: Late G1 phase; S: S phase; SG2: Late S and G2 phase.
Figure 5 with 1 supplement
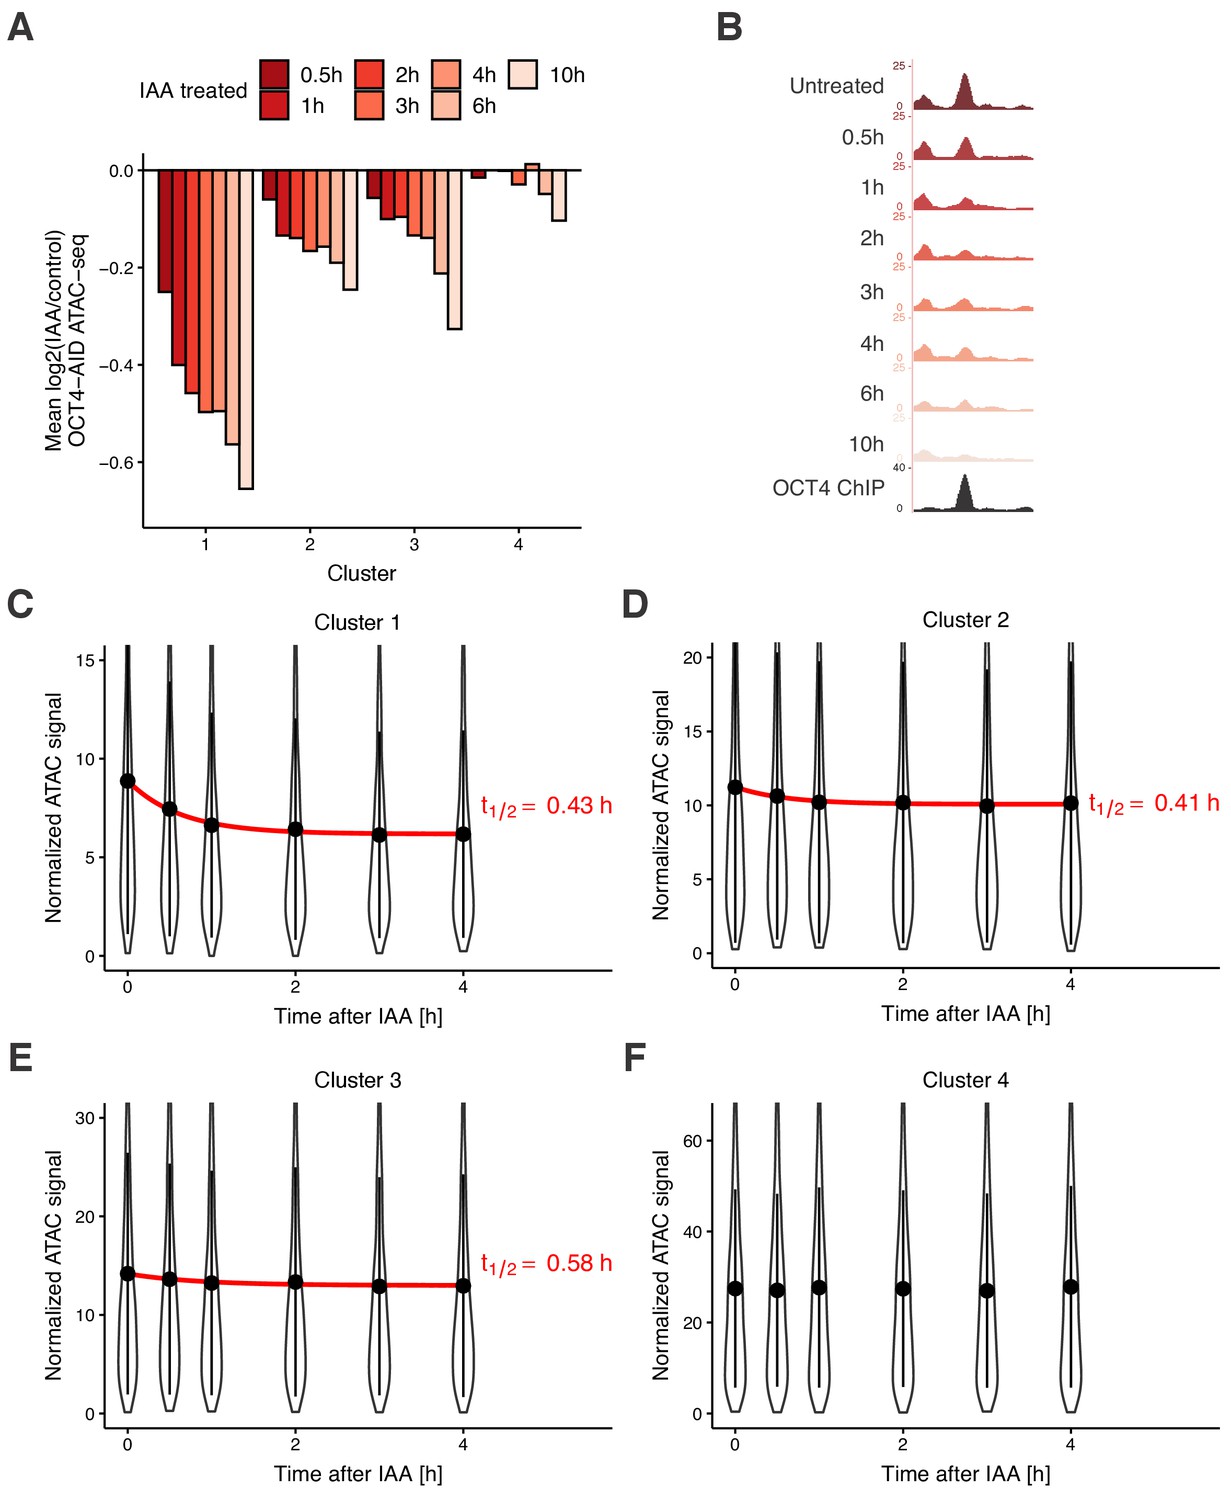
Time course analysis of chromatin accessibility changes during OCT4 degradation reveals its highly dynamic pioneer activity.
(A) log2 fold-change values of accessibility compared to untreated cells in the four clusters from Figure 3D at different time points of IAA treatment. (B) Genome browser tracks of accessibility profiles upon treatment with IAA for different durations at a cluster 1 locus at chr3:137779908–137780687. (C–F) Violin plot of normalized ATAC-seq signal across different time points in cluster 1 (C), cluster 2 (D), cluster 3 (E), and cluster 4 (F). Dots: mean; Vertical lines: standard deviation; Red lines in C-E: exponential fit; Red text in C-E: half-life value derived from the exponential fit.
Figure 5—figure supplement 1

ATAC-seq data from different read sizes and RT-qPCR analysis upon rapid OCT4 depletion.
(A) Violin plot of normalized ATAC-seq signal of sequencing reads 0–100 bp and 180–250 bp in length in untreated cells and 2 hr IAA-treated cells in cluster 1 (A), cluster 2 (B), cluster 3 (C), and cluster 4 (D). Dots: mean; Vertical lines: standard deviation; p-values: Mann-Whitney U. (E) Heatmap of RPKM-normalized ATAC-seq signal 2 kb around regions in the clusters from Figure 3D in untreated control cells (labeled ‘C’) and IAA-treated cells (labeled ‘I’) at different cell cycle phases in the clusters from Figure 3D using all sequencing reads, reads 0–100 bp in length, or reads 180–250 bp in length. Each row corresponds to one individual locus. (F–G) Relative pre-mRNA (F) and mRNA (G) levels in 2 hr IAA-treated cells compared to control cells of genes near regions in the clusters from Figure 3D. Each sample is normalized to the expression of Rps9. n = 5 biological replicates. Statistics for (F–G) are available in Supplementary file 1.
Author response image 1
Tables
Key resources table
| Reagent type (species) or resource | Designation | Source or reference | Identifiers | Additional information |
|---|---|---|---|---|
| Cell line (Mus musculus) | ZHBTc4 ES cells | (Niwa et al., 2000) | RRID: CVCL_C715 | OCT4 OFF cell line |
| Cell line (Mus musculus) | 2TS22C ES cells | (Masui et al., 2007) | RRID: CVCL_E266 | SOX2 OFF cell line |
| Antibody | Rabbit anti-BRG1 | Abcam #ab110641 | RRID: AB_10861578 | ChIP (5 μg per 10 million cells) |
| Antibody | Rabbit anti-OCT4 monoclonal | Cell Signaling Technology | RRID: AB_10547892 | ChIP (20 μl per 10 million cells) |
| Antibody | Rabbit anti-H3K27ac polyclonal | Abcam #ab4729 | RRID: AB_2118291 | ChIP 2 μg/25 μg chromatin) |
| Antibody | Mouse anti-OCT4 monoclonal | Santa Cruz #sc-5279 | RRID: AB_628051 | IF (1:500) |
| Antibody | Rabbit anti-SOX2 polyclonal | Thermo Fisher #48–1400 | RRID: AB_2533841 | IF (1:200) |
| Recombinant DNA reagent | psPAX2 | Addgene | RRID: Addgene_12260 | For lentiviral production |
| Recombinant DNA reagent | pMD2.G | Addgene | RRID: Addgene_12259 | For lentiviral production |
| Recombinant DNA reagent | pLV-PGK-YPet-MD | (Deluz et al., 2016) | ||
| Recombinant DNA reagent | pLV-PGK-SNAP-MD-OCT4 | This paper | Used to generate lentiviral particles for the MD-OCT4 cell line (see Figure 3A). Available upon request | |
| Recombinant DNA reagent | pLV-PGK-SNAP-MD*-OCT4 | This paper | Used to generate lentiviral particles for the MD*-OCT4 cell line (see Figure 3A). Available upon request | |
| Recombinant DNA reagent | pLEX-mCherry-OCT4-AID | This paper | Used to generate lentiviral particles for the OCT4-AID cell line (see Figure 4A). Available upon request | |
| Software, algorithm | FiJi | (Schindelin et al., 2012) | RRID:SCR_002285 | Version 2.0.0-rc-69/1.52 p |
| Software, algorithm | CellProfiler | (Carpenter et al., 2006) | RRID:SCR_007358 | Version 3.1.8 |
| Software, algorithm | STAR | (Dobin et al., 2013) | RRID:SCR_015899 | Version 2.6.1 c |
| Software, algorithm | Picard | Broad Institute | RRID:SCR_006525 | Version 2.8.3 |
| Software, algorithm | MACS | (Zhang et al., 2008) | RRID:SCR_013291 | Version 2.1.1.20160309 |
| Software, algorithm | BEDTools | (Quinlan and Hall, 2010) | RRID:SCR_006646 | Version 2.26.0 |
| Software, algorithm | edgeR | (Robinson et al., 2010) | RRID:SCR_012802 | Version 3.18.1 |
| Software, algorithm | limma | (Ritchie et al., 2015) | RRID:SCR_010943 | Version 3.32.10 |
| Software, algorithm | HOMER | (Heinz et al., 2010) | RRID:SCR_010881 | Version 4.10.4 |
| Software, algorithm | biomaRt | (Durinck et al., 2005) | RRID:SCR_002987 | Version 2.32.1 |
| Software, algorithm | deepTools | (Ramírez et al., 2016) | RRID:SCR_016366 | Version 3.2.0 |
| Software, algorithm | SAMTools | (Li et al., 2009) | RRID:SCR_002105 | Version 1.8 |
| Software, algorithm | GenomicRanges | (Lawrence et al., 2013) | RRID:SCR_000025 | Version 1.28.6 |
| Software, algorithm | RStudio | RRID:SCR_000432 | Version 1.0.153 | |
| Software, algorithm | ggplot2 | (Wickham, 2009) | RRID:SCR_014601 | Version 3.2.0 |
Additional files
-
Supplementary file 1
Additional statistics.
This file contains p-values and fold change values for all relevant comparisons in Figure 1D–G, Figure 2B,C,J,K, Figure 2—figure supplement 1A,C,D,F,H, Figure 2—figure supplement 2B–G, Figure 3F, Figure 3—figure supplement 2C, Figure 3—figure supplement 3D, Figure 3—figure supplement 4D–E, Figure 4D–E, and Figure 5—figure supplement 1F-G.
- https://cdn.elifesciences.org/articles/50087/elife-50087-supp1-v1.xlsx
-
Supplementary file 2
Motif analysis.
This file contains enrichment values (logP) and frequencies of known motifs from HOMER in the following groups of loci: OD, CD, SD, OCT4 OFF upregulated (OCT4up), SOX2 OFF upregulated (SOX2up), and clusters 1–4. Only motifs with -logP < 50 in at least one group are shown.
- https://cdn.elifesciences.org/articles/50087/elife-50087-supp2-v1.xlsx
-
Supplementary file 3
Random forest model results.
This file contains the top 500 features of the random forest model used to predict the cluster of regions based on overlap with ChIP-seq peaks from cistromeDB annotated as belonging to mouse ES cells.
Importance values are derived from the model. Sample name, Factor, Cell line, and GSMID refer to sample data in GEO and ID refers to the sample ID in cistromeDB. Cluster 1–4 columns indicate fraction of regions overlapping the sample peaks.
- https://cdn.elifesciences.org/articles/50087/elife-50087-supp3-v1.xlsx
-
Supplementary file 4
Primers used for RT-qPCR.
This file contains the oligonucleotide sequences used to perform RT-qPCR experiments.
- https://cdn.elifesciences.org/articles/50087/elife-50087-supp4-v1.xlsx
-
Supplementary file 5
Published datasets used.
This file contains descriptions of publicly available raw data that were aligned and processed according to the Materials and methods section as well as publicly available pre-processed data used in the study.
- https://cdn.elifesciences.org/articles/50087/elife-50087-supp5-v1.xlsx
-
Transparent reporting form
- https://cdn.elifesciences.org/articles/50087/elife-50087-transrepform-v1.docx
Download links
A two-part list of links to download the article, or parts of the article, in various formats.
Downloads (link to download the article as PDF)
Open citations (links to open the citations from this article in various online reference manager services)
Cite this article (links to download the citations from this article in formats compatible with various reference manager tools)
Dynamic regulation of chromatin accessibility by pluripotency transcription factors across the cell cycle
eLife 8:e50087.
https://doi.org/10.7554/eLife.50087


