Vasohibin1, a new mouse cardiomyocyte IRES trans-acting factor that regulates translation in early hypoxia
- UMR 1048-I2MC, Inserm, Université de Toulouse, UPS, France
- UMR 1031-STROMALAB, Inserm, CNRS ERL5311, Etablissement Français du Sang-Occitanie (EFS), National Veterinary School of Toulouse (ENVT), Université de Toulouse, UPS, France
- UMR 1037-CRCT, Inserm, CNRS, Université de Toulouse, UPS, Pôle Technologique-Plateau Protéomique, France
- UMR 5099-LBME, CBI, CNRS, Université de Toulouse, UPS, France
- Tohoku University, Japan
Figures
Figure 1 with 1 supplement

(Lymph)angiogenic genes are not drastically induced at the transcriptome level in hypoxic cardiomyocytes.
Total RNA was purified from HL-1 cardiomyocytes submitted to increasing durations (from 5 min to 24 hr) of hypoxia at 1% O2, as well as from normoxic cardiomyocytes as a control. cDNAs were synthesized and used for a Fluidigm deltagene PCR array dedicated to genes related to (lymph)angiogenesis or stress (Supplementary file 6). Analysis was performed in three biological replicates (cell culture well and cDNA), each of them measured in three technical replicates (PCR reactions). Relative quantification (RQ) of gene expression during hypoxia was calculated using the 2–ΔΔCT method with normalization to 18S rRNA and to normoxia. mRNA levels are presented as histograms for the times of 4 hr, 8 hr and 24 hr, as the fold change of repression (red) or induction (green) normalized to normoxia. Non-regulated mRNAs are represented in blue. The threshold for induction was set at 1.5. When the RQ value is inferior to 1, the fold change is expressed as −1/RQ. The percentage of repressed, induced, and non-regulated mRNAs is indicated for each duration of hypoxia. For shorter durations of 5 min to 2 hr, the percentages are shown in Figure 1—figure supplement 1. The detailed values for all of the durations of hypoxia are presented in Supplementary file 1.
Figure 1—figure supplement 1
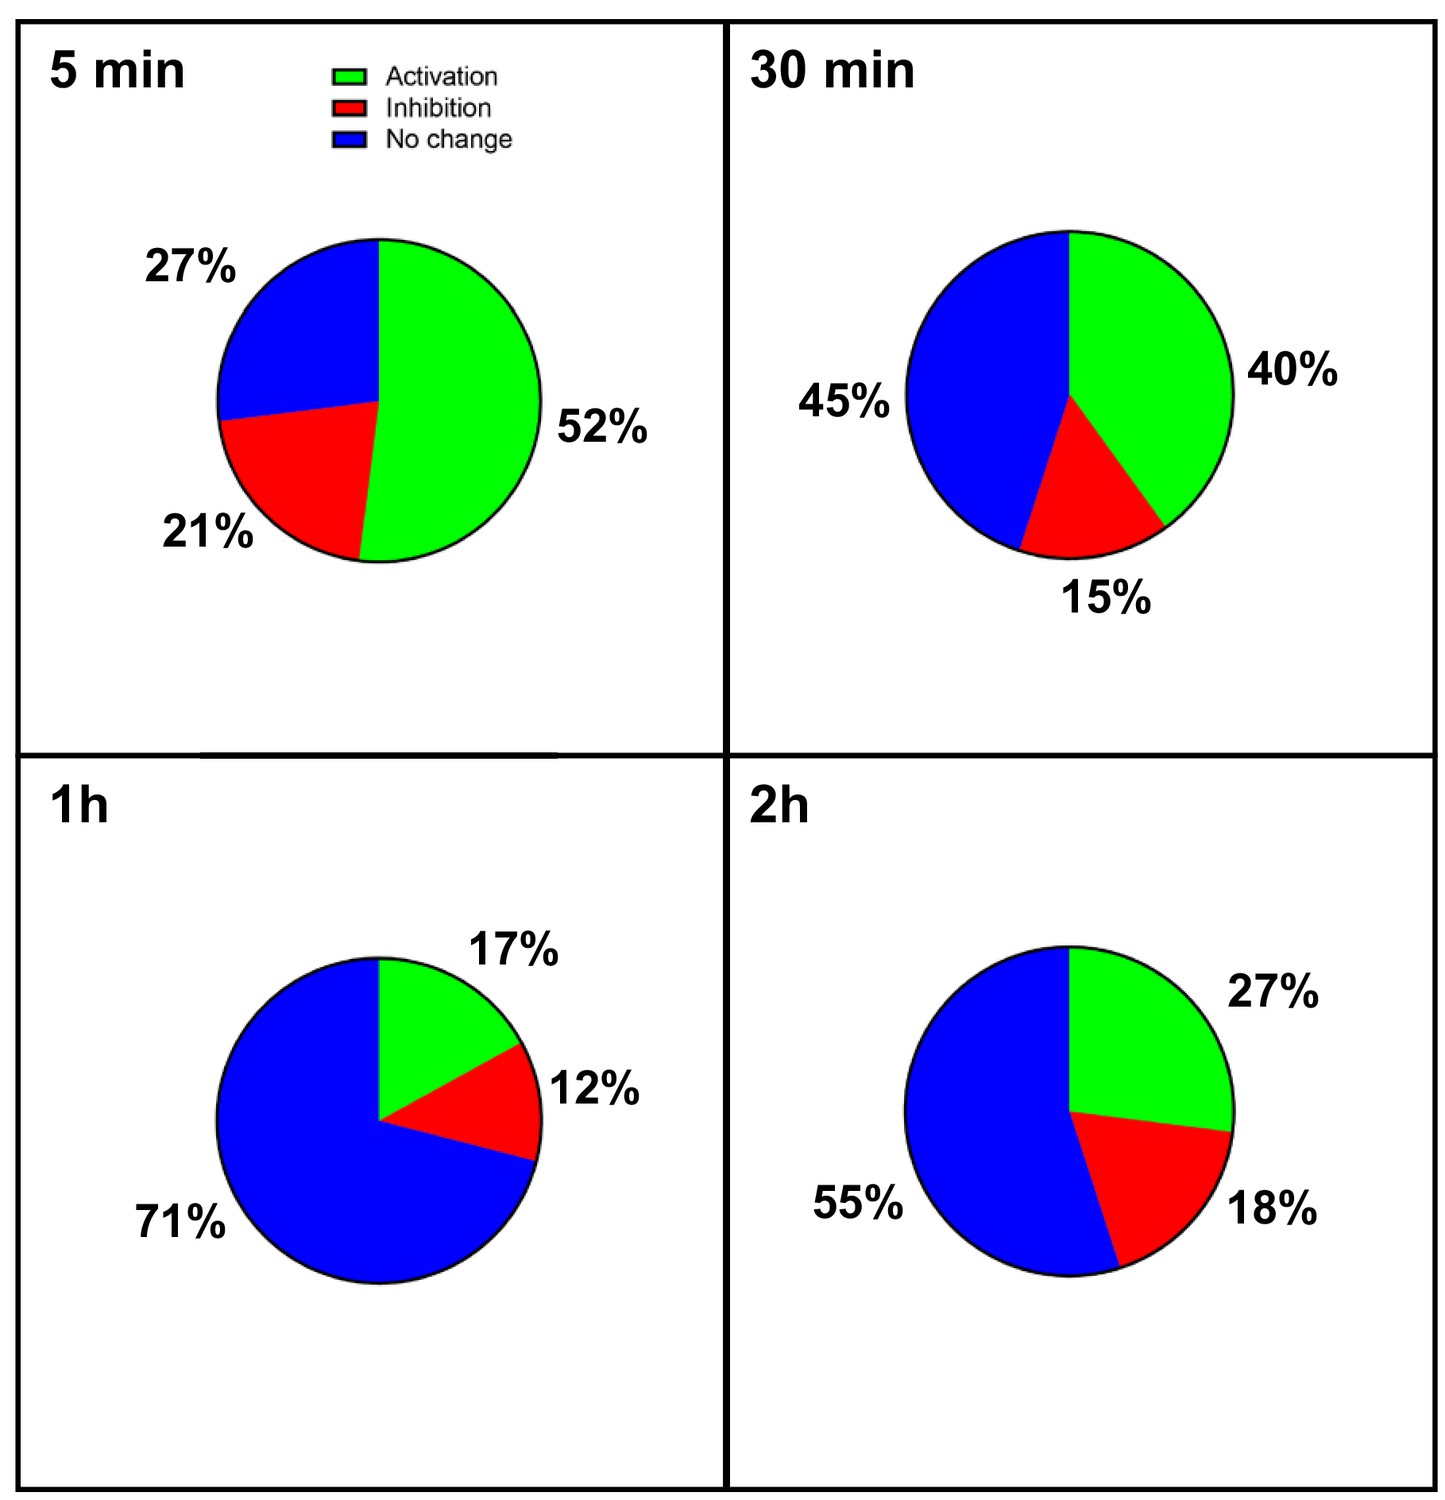
Transcriptome of regulation in hypoxic cardiomyocytes.
Total RNA was purified from HL-1 cardiomyocytes submitted to increasing durations (from 5 min to 24 hr of hypoxia) at 1% O2, as well as from normoxic cardiomyocytes as a control. cDNA was synthesized and used for a Fluidigm deltagene PCR array dedicated to genes related to (lymph)angiogenesis or stress (Supplementary file 6). Relative quantification (RQ) of gene expression during hypoxia was calculated using the 2–ΔΔCT method with normalization to 18S and to normoxia. The percentages of repressed (red), induced (green) and non-regulated (blue) mRNAs are shown for the shorter durations of hypoxia. The data for the longer durations are shown in Figure 1. The threshold was set at 1.5 as in Figure 1. The detailed values for all of the durations of hypoxia are presented in Supplementary file 1.
Figure 2 with 1 supplement

mRNAs of most (lymph)angiogenic genes are mobilized into polysomes in hypoxic cardiomyocytes.
(A-C) In order to isolate translated mRNAs, polysomes from HL-1 cardiomyocytes in normoxia or after 4 hr of hypoxia at 1% O2 were purified on a sucrose gradient, as described in 'Materials and methods'. Analysis was performed using a fluidigm PCR array from three biological replicates (cell culture well and cDNA), each of them measured in three technical replicates (PCR reactions). P/M ratio (polysome/monosome) was determined by delimiting the 80S and polysome peaks by taking the lowest plateau values between each peak and by calculating the area under the curve (AUC). Then the sum of area values of the four polysome peaks was divided by the area of the 80S peak (A). Translation blockade was measured by eIF2α phosphorylation quantification by Jess capillary Simple Western, normalized to the Jess quantification of total proteins (as described in 'Materials and methods'). Three independent experiments were done; a representative experiment is shown (B). RNA was purified from polysome fractions and from cell lysate before loading. cDNA and PCR arrays were performed as in Figure 1. Polysomes profiles are presented for normoxic and hypoxic cardiomyocytes. Relative quantification (RQ) of gene expression during hypoxia was calculated using the 2–ΔΔCT method with normalization to 18S rRNA and to normoxia. mRNA levels (polysomal RNA/total RNA) are shown as fold change of repression (red) or induction (green) in hypoxia normalized to normoxia as in Figure 1C. The threshold for induction was set at 1.5. When the RQ value is inferior to 1, the fold change is expressed as −1/RQ. The detailed values are available in Supplementary file 2.
Figure 2—figure supplement 1
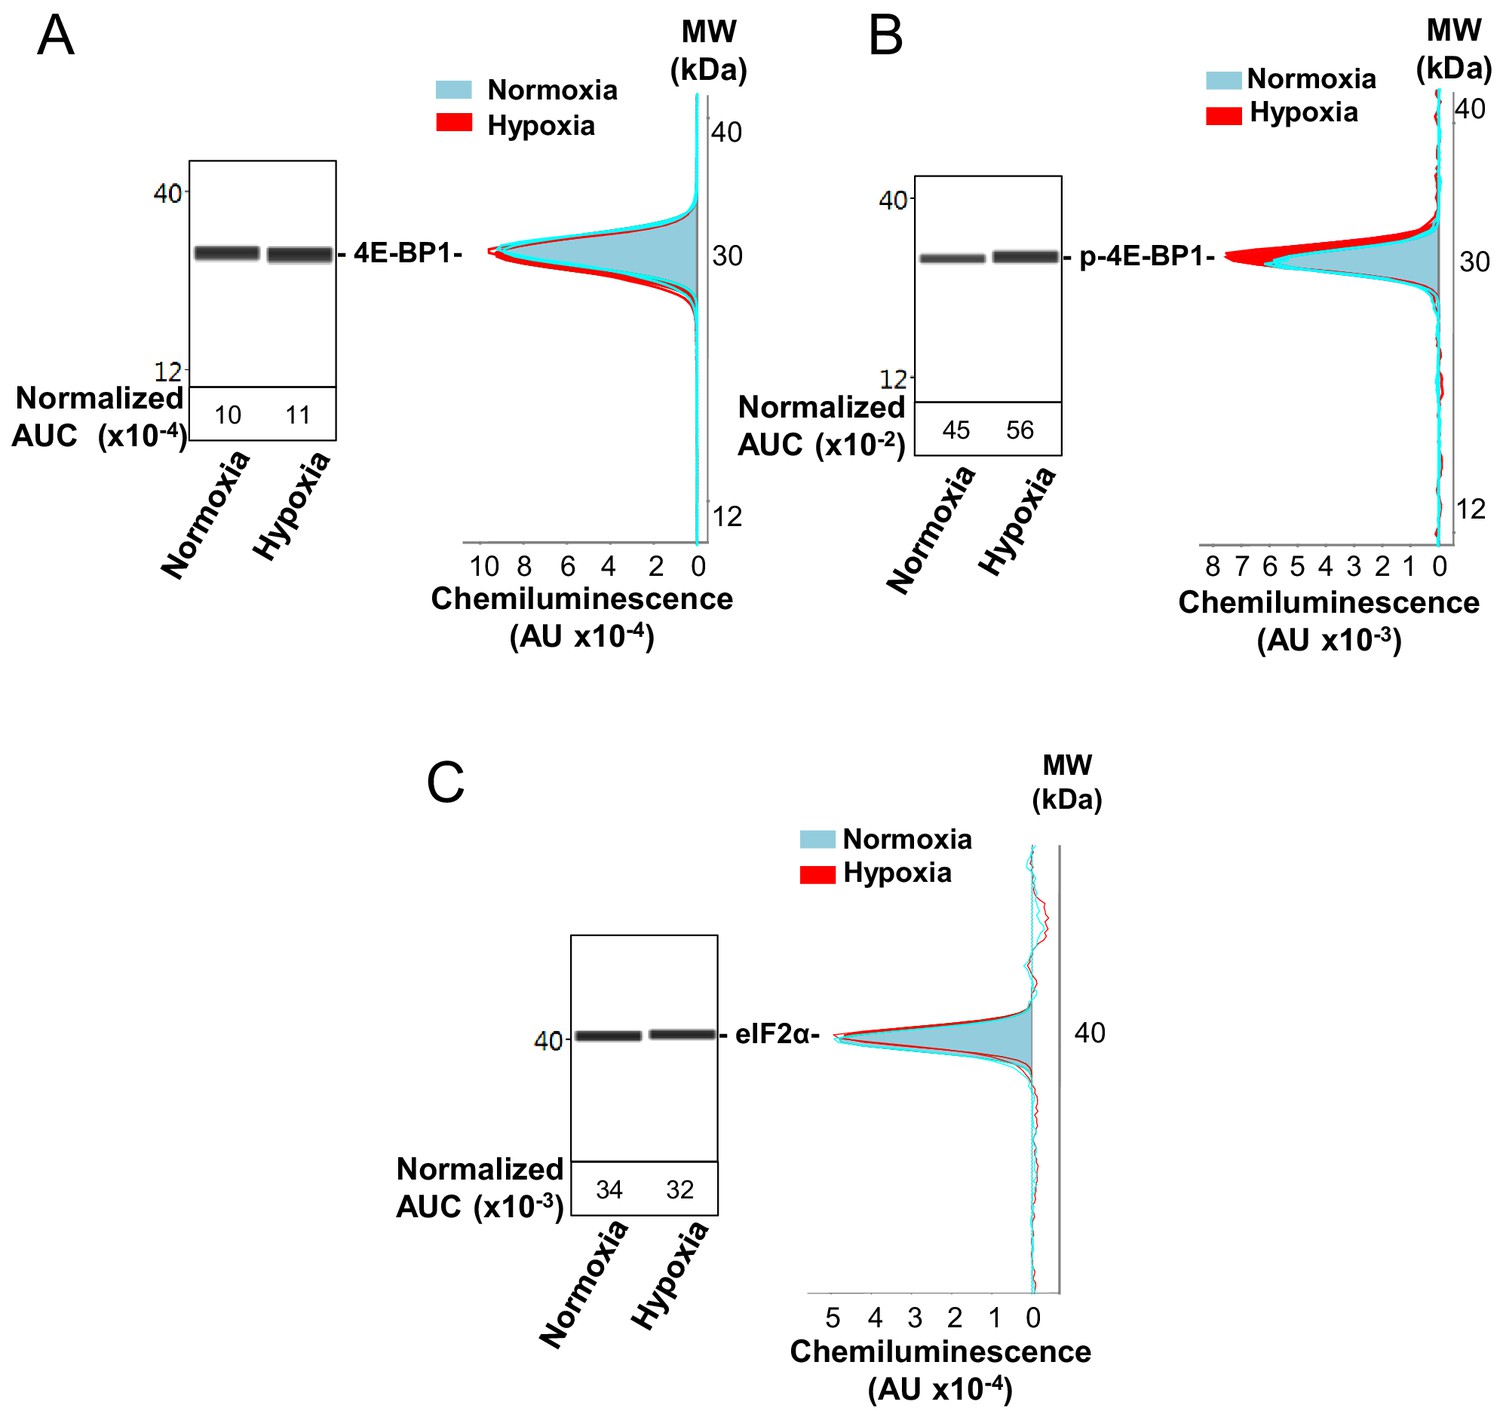
Capillary electrophoresis immunodetection of 4E-BP1 and eIF2α.
(A–C) 4E-BP1 expression (A) and phosphorylation (B), as well as eIF2α expression (C), in normoxia and hypoxia (8 hr) were analyzed and quantified by capillary Simple Western, as described in 'Materials and methods'. The quantified values, expressed in arbitrary units of luminescence (AUC), are normalized to total proteins. Analysis of eIF2α phosphorylation is shown in Figure 2. Three independent experiments were performed; a representative experiment is shown.
Figure 3 with 1 supplement
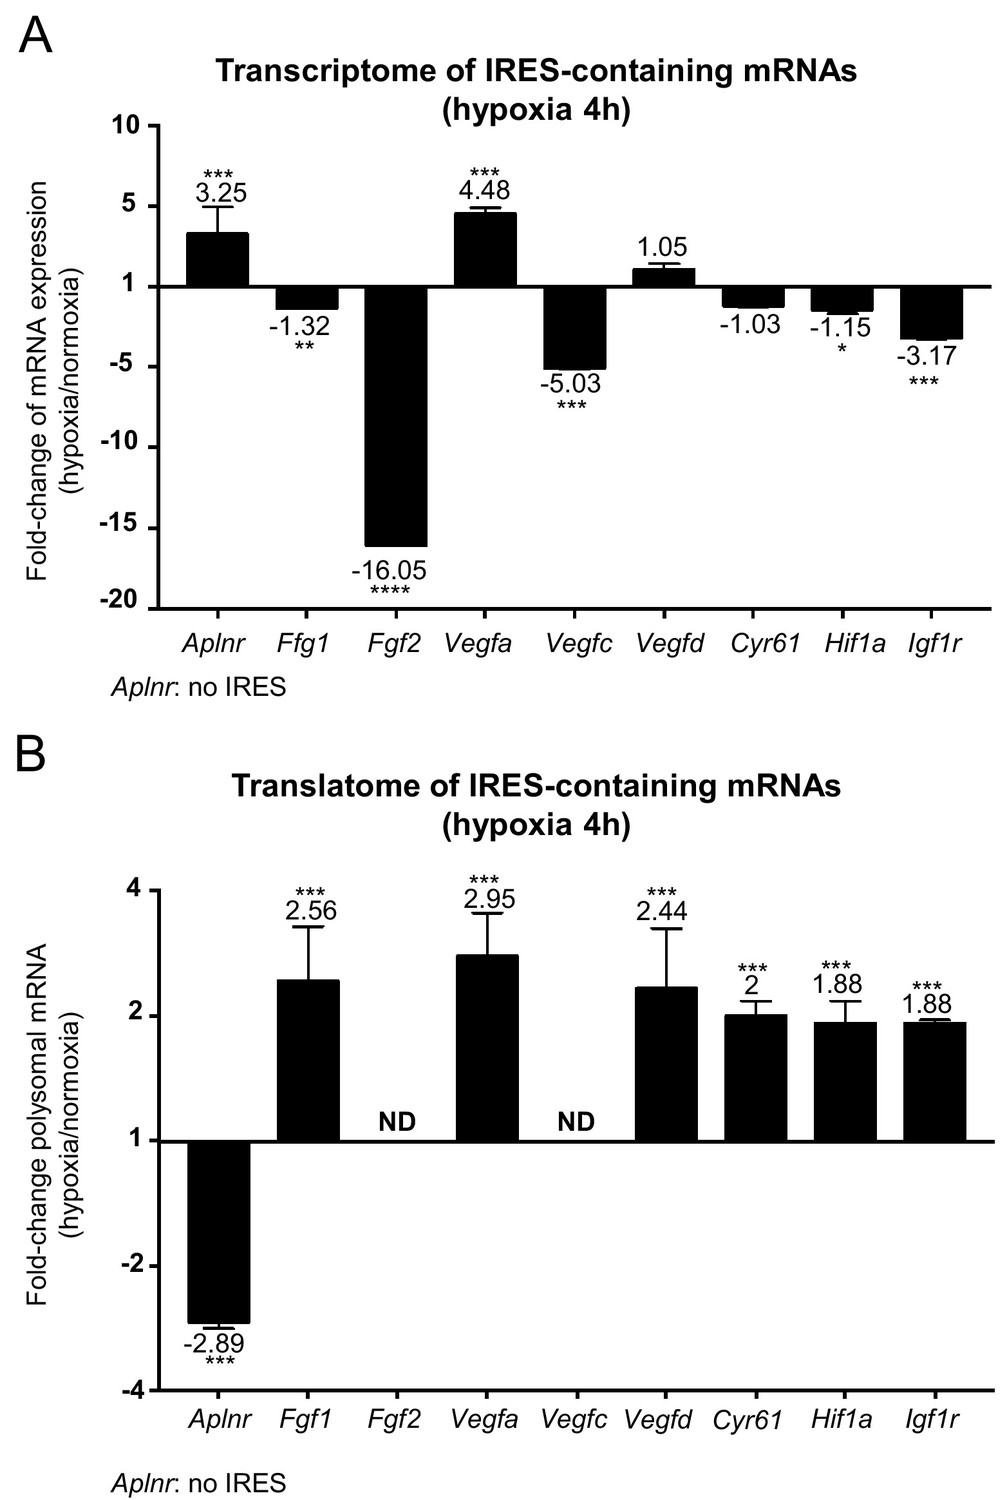
IRES-containing mRNAs are more efficiently associated with polysomes in hypoxic conditions.
(A, B) RQ values for the IRES-containing mRNA transcriptome (A) and translatome (B) extracted from the PCR arrays shown in Figures 1 and 2. The gene Aplnr (apelin receptor) was chosen as a control without an IRES. Vegfc and Fgf2 mRNAs, which are repressed in the transcriptome, were below the detection threshold in polysomes (ND). Histograms correspond to means ± standard deviation, with values for hypoxia compared to those for normoxia by a bilateral Student's test *p<0.05, **p<0.01, ***p<0.001, ****p<0.0001.
Figure 3—figure supplement 1
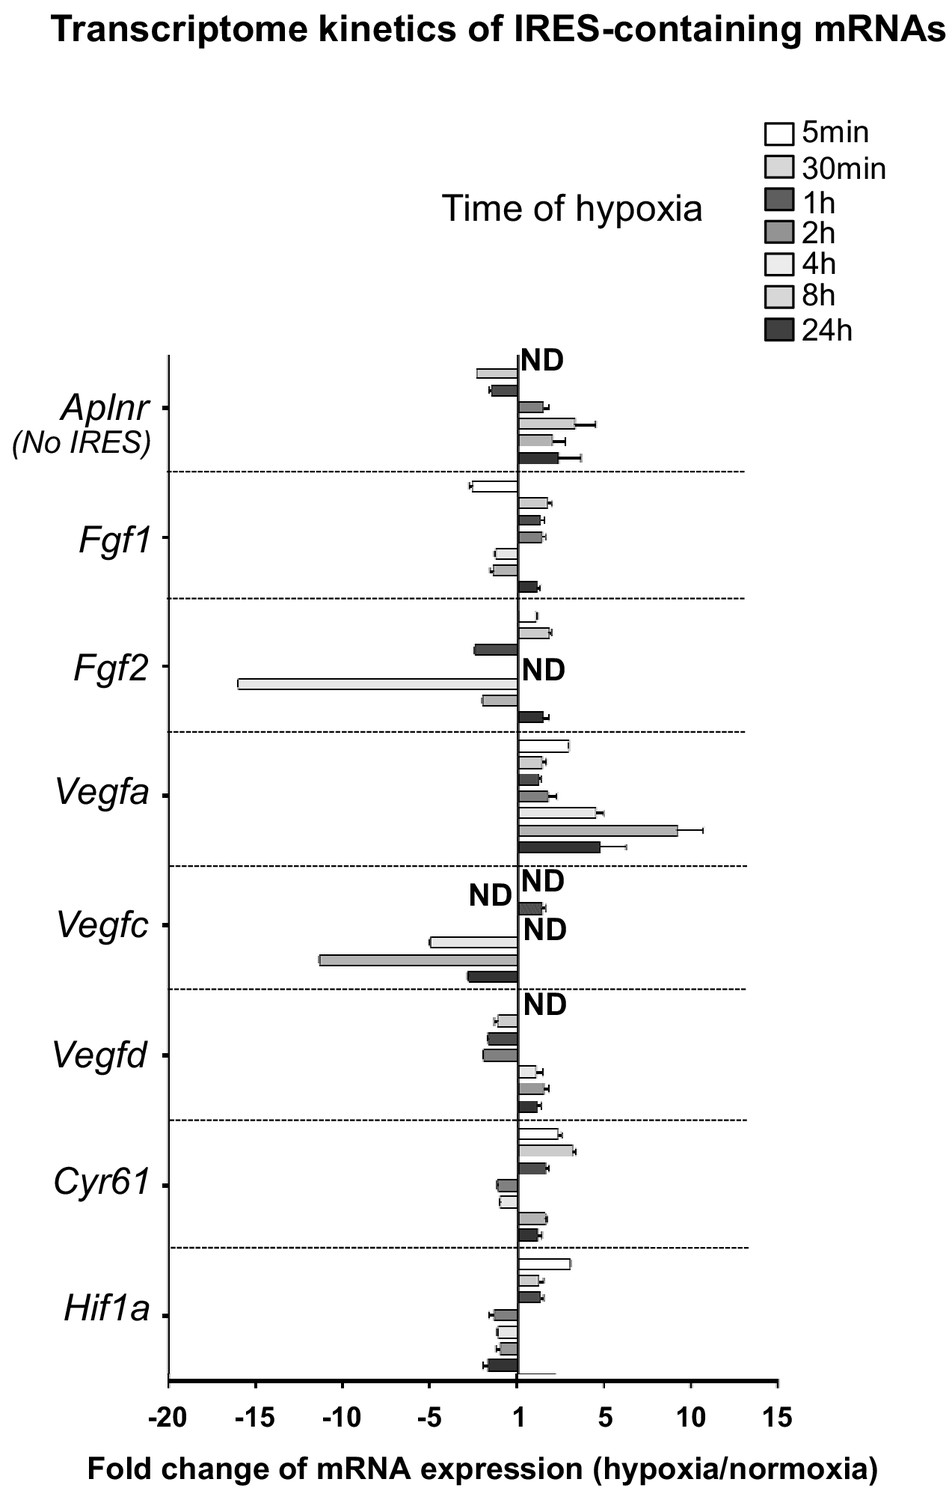
Transcriptome of IRES-containing mRNAs in hypoxic cardiomyocytes.
RQ values for IRES-containing mRNA transcriptome kinetics extracted from the PCR arrays shown in Supplementary file 1. The gene Aplnr (apelin receptor) was chosen as a control without an IRES. Relative quantification (RQ) of gene expression in hypoxia was calculated using the 2–ΔΔCT method with normalization to 18S and to normoxia. Standard deviation is indicated. When the RQ value is inferior to 1, the fold change is expressed as −1/RQ. ND means ‘non detected’.
Figure 4
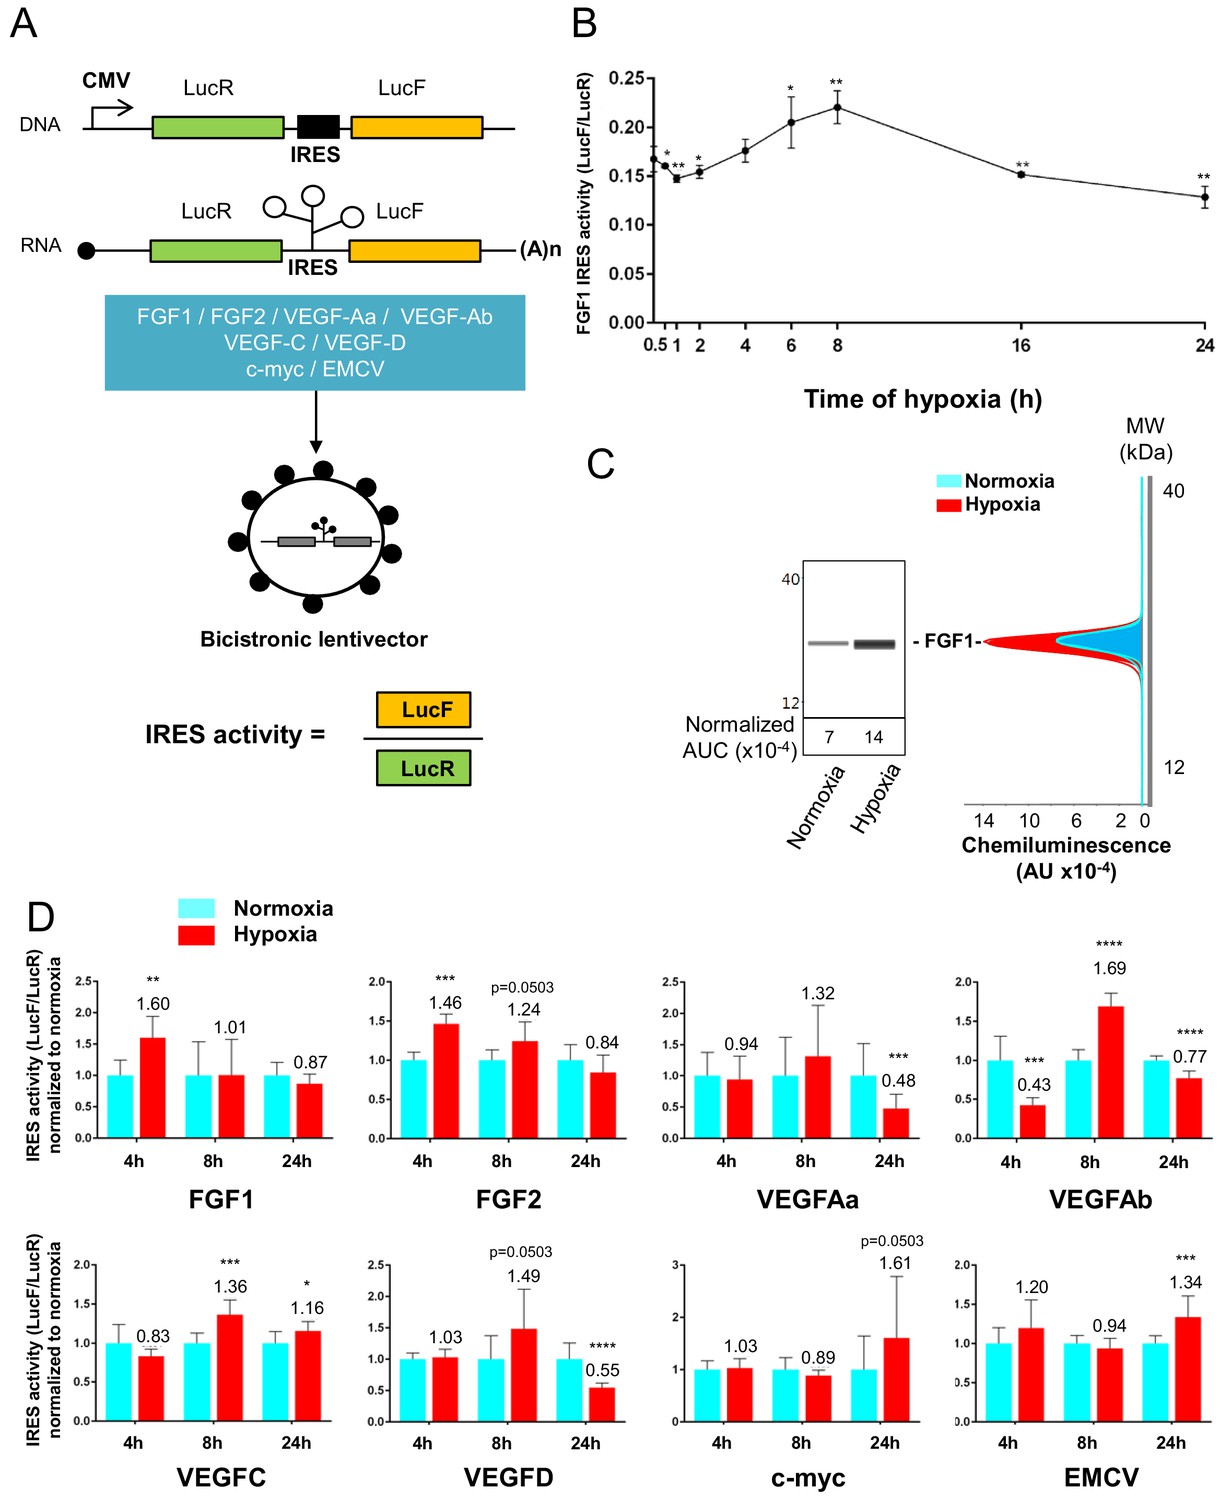
IRESs from (lymph)angiogenic factor mRNAs are activated in early hypoxia.
(A–D) To measure IRES-dependent translation during hypoxia, HL-1 cardiomyocytes were transduced with bicistronic dual luciferase lentivectors (termed ‘Lucky-Luke’) containing different IRESs cloned between the genes of renilla (LucR) and firefly (LucF) luciferase (A). In bicistronic vectors, the translation of the first cistron LucR is cap-dependent, whereas translation of the second cistron LucF is IRES-dependent (Créancier et al., 2000). Cardiomyocytes transduced by the CRF1AL+ lentivector Lucky-Luke reporter containing FGF1 IRES were submitted to a hypoxia time-course (0 hr, 1 hr, 2 hr, 4 hr, 6 hr, 8 hr, 16 hr and 24 hr) and data from each time point were compared to those from normoxia with a non-parametric Mann-Whitney test (B). Endogenous FGF1 protein expression was measured by Jess capillary Simple Western of extracts of cardiomyocytes in normoxia or those submitted to 8 hr of hypoxia (normalized to Jess quantification of total proteins as described in 'Materials and methods'). Three independent experiments were performed; a representative experiment is shown (C). HL-1 cardiomyocytes transduced by different Lucky-Luke constructs were submitted to 4 hr, 8 hr or 24 hr of hypoxia and their luciferase activities were measured. IRES activities during hypoxia, expressed as LucF/LucR ratio, are normalized to those during normoxia. Histograms correspond to means ± standard deviation of the mean, data from hypoxic cardiomyocytes compared to those from normoxic cardiomyocytes with a non-parametric Mann-Whitney (M-W) test: *p<0.05, **p<0.01, ***<0.001, ****p<0.0001. For each IRES, the mean was calculated from nine cell culture biological replicates, each of them being the mean of three technical replicates (27 technical replicates in total but the M-W test was performed with n = 9). Detailed values of biological replicates are presented in Supplementary file 3. A no-IRES control was also used and values are presented in Supplementary file 3J.
Figure 5 with 1 supplement

Identification of IRES-bound proteins in hypoxic cardiomyocytes reveals vasohibin1 as a new RNA-binding protein.
(A–F) Biotinylated IRES RNAs were transcribed in vitro and immobilized on the sensorchip of the BIAcore T200 optical biosensor device (A). Total cell extracts from normoxic or hypoxic HL-1 cardiomyocytes were injected into the device. Complex formation and dissociation were measured (see 'Materials and methods') (B). Bound proteins were recovered as described in 'Materials and methods'. and identified by mass spectrometry (LC-MS/MS) after tryptic digestion. The list of proteins bound in normoxia and hypoxia to FGF1, VEGFAa and EMCV IRESs is shown in Supplementary file 4. VASH1 protein was identified as being bound to FGF1 (hypoxia) and EMCV IRESs (hypoxia and normoxia), but not to VEGFA IRES. A diagram of VASH1 RNA-binding properties is shown, with VASH1 isoforms described by Sonoda et al. (2006) (C). The predicted RNA-binding domains (RBD1 and RBD2) shown in Figure 5‐figure supplement 1 that are conserved in mouse and human (C). Recombinant full-length 44-kDa VASH1 was injected into the Biacore T200 device containing immobilized FGF1 (D), VEGFAa (E) or EMCV (F) IRES as above. The affinity constants (KD) were calculated (D–F) with a single cycle kinetics (SCK) strategy.
Figure 5—figure supplement 1
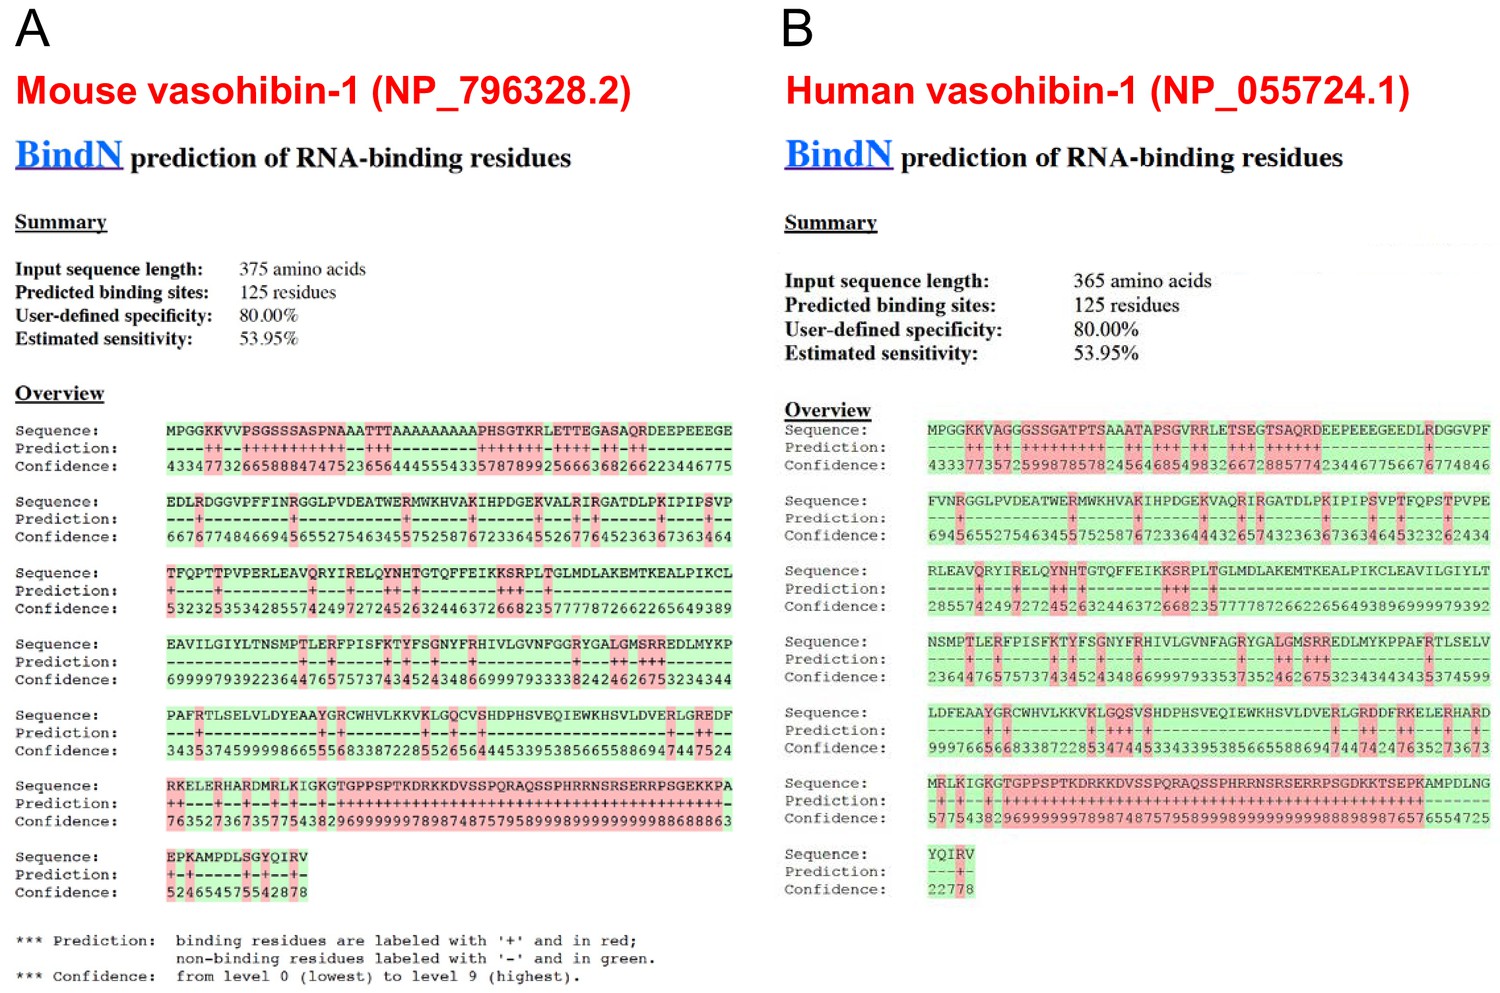
Conservation of predicted RNA-binding domains in mouse and human vasohibin-1.
(A, B) RNA-binding domains in mouse (A) and human (B) VASH1 proteins were predicted using BindN software (https://omictools.com/bindn-2-tool).
Figure 6
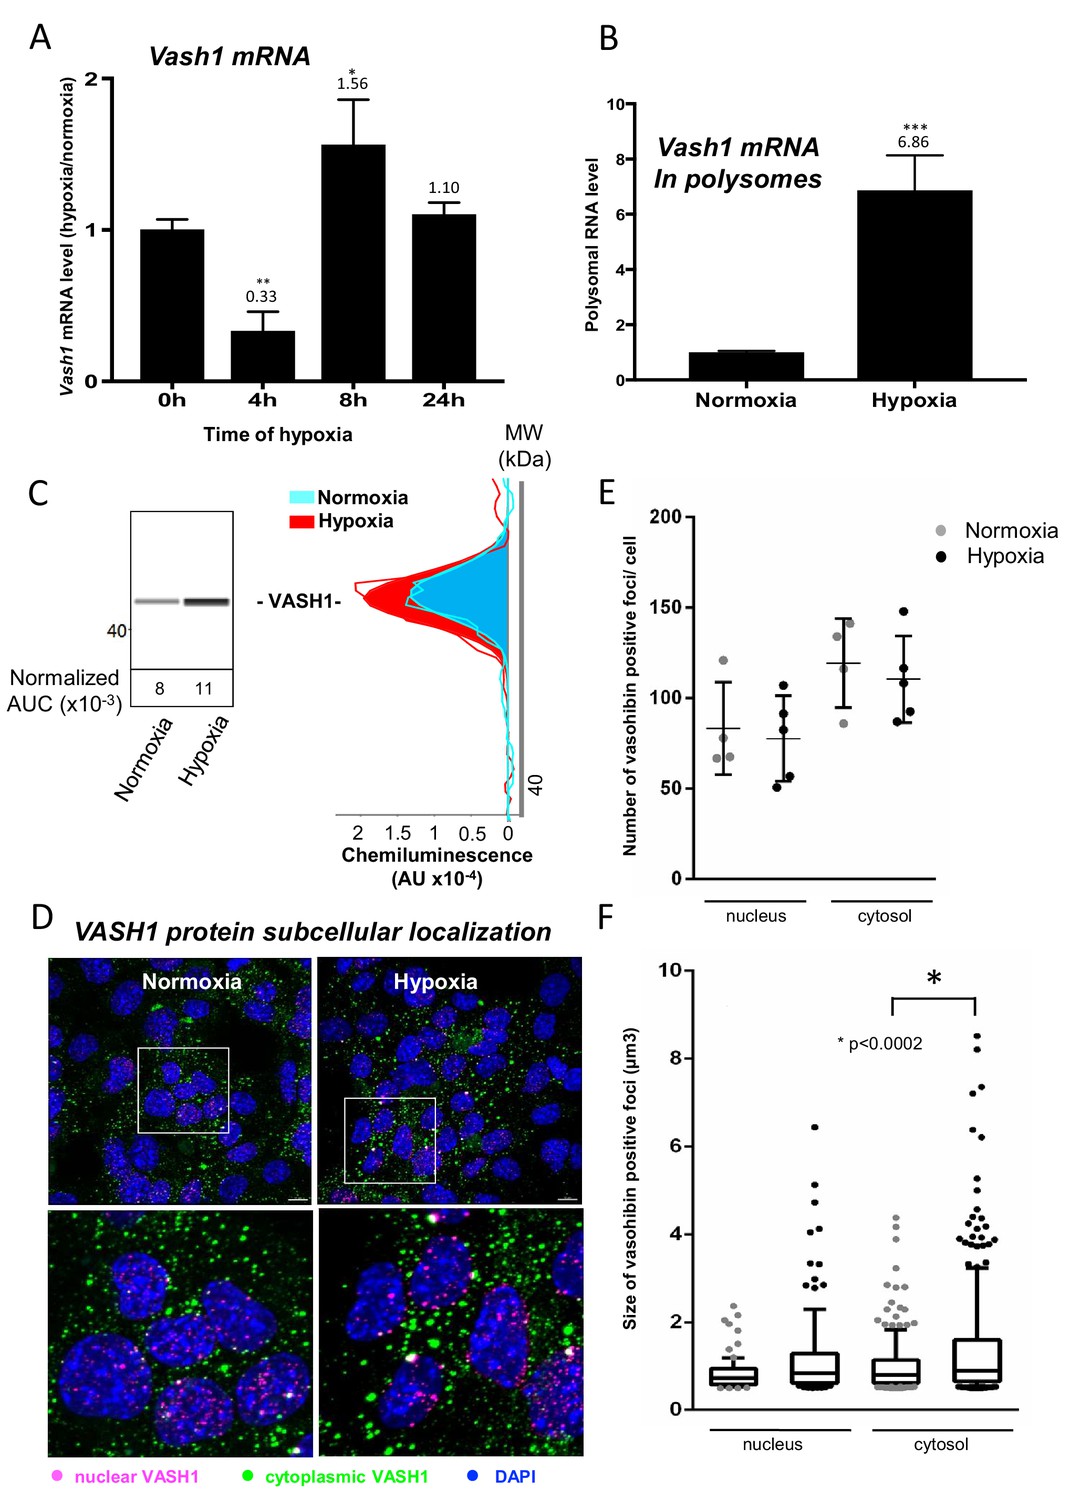
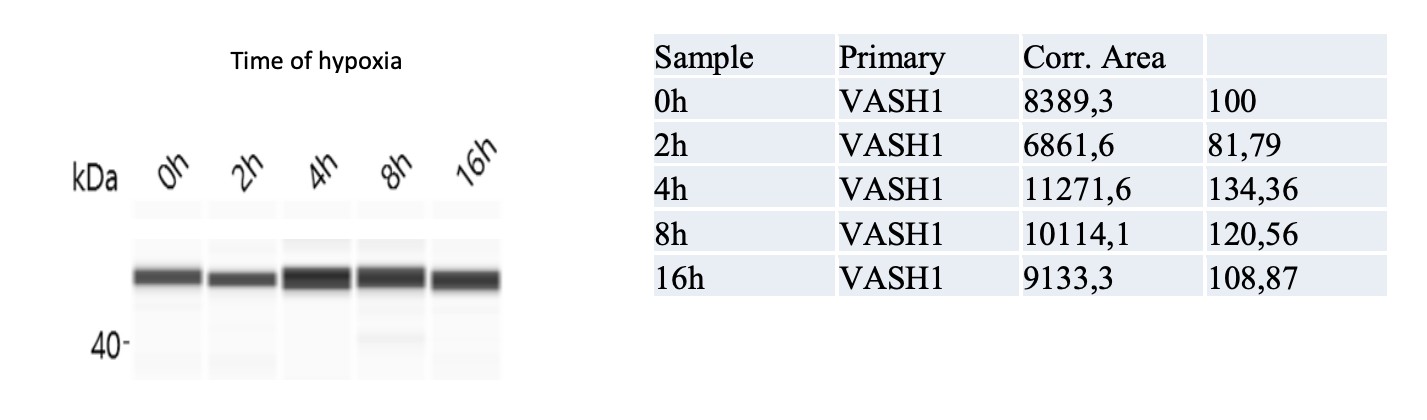
Vasohibin1 is translationally induced in early hypoxia and is localized in nuclear and cytoplasmic foci.
(A–D) VASH1 expression was analyzed in HL-1 cardiomyocytes subjected to hypoxia at the transcriptome and translatome levels. A fluidigm RT qPCR array (Supplementary file 2) was performed with two biological replicates (cell culture and cDNA), each of them measured in two technical replicates (PCR reactions). Detailed values at 4 hr and 24 hr are presented in Supplementary file 2. As for Figure 2, total RNA was purified from the cell lysate of cardiomyocytes in normoxia or submitted to 4 hr, 8 hr or 24 hr of hypoxia (A). Polysomal RNA was purified from cardiomyocytes in normoxia or after 4 hr of hypoxia, from pooled heavy fractions containing polysomes (fractions 19–27) (B). Histograms correspond to mean ± standard deviation of the mean, with two-tailed t-test, *p<0.05, **p<0.01, ***<0.001 used to compare data from hypoxic and normoxic cardiomyocytes. VASH1 protein expression was measured by capillary Simple Western of extracts from cardiomyocytes in normoxia or submitted to 4 hr of hypoxia (C). VASH1 was immunodetected in HL-1 cardiomyocytes in normoxia or after 4 hr of hypoxia (D). DAPI staining allows to detect VASH1 nuclear localization (MERGE). VASH1 foci in the nucleus are shown in purple and those in the cytoplasm in green using Imaris software. The number of VASH1 foci was quantified in the nucleus and in the cytoplasm in normoxia and after 4 hr of hypoxia (n = 4–5 images with a total cell number of 149 in normoxia and 178 in hypoxia) (E). Boxplots of volume of vasohibin foci in normoxia and hypoxia (F). All foci above 0.5 μm3 were counted. Whiskers mark the 10% and the 90% percentiles with the mean in the center. One-way Anova with Tukey’s comparisons test was applied.
Figure 7 with 1 supplement
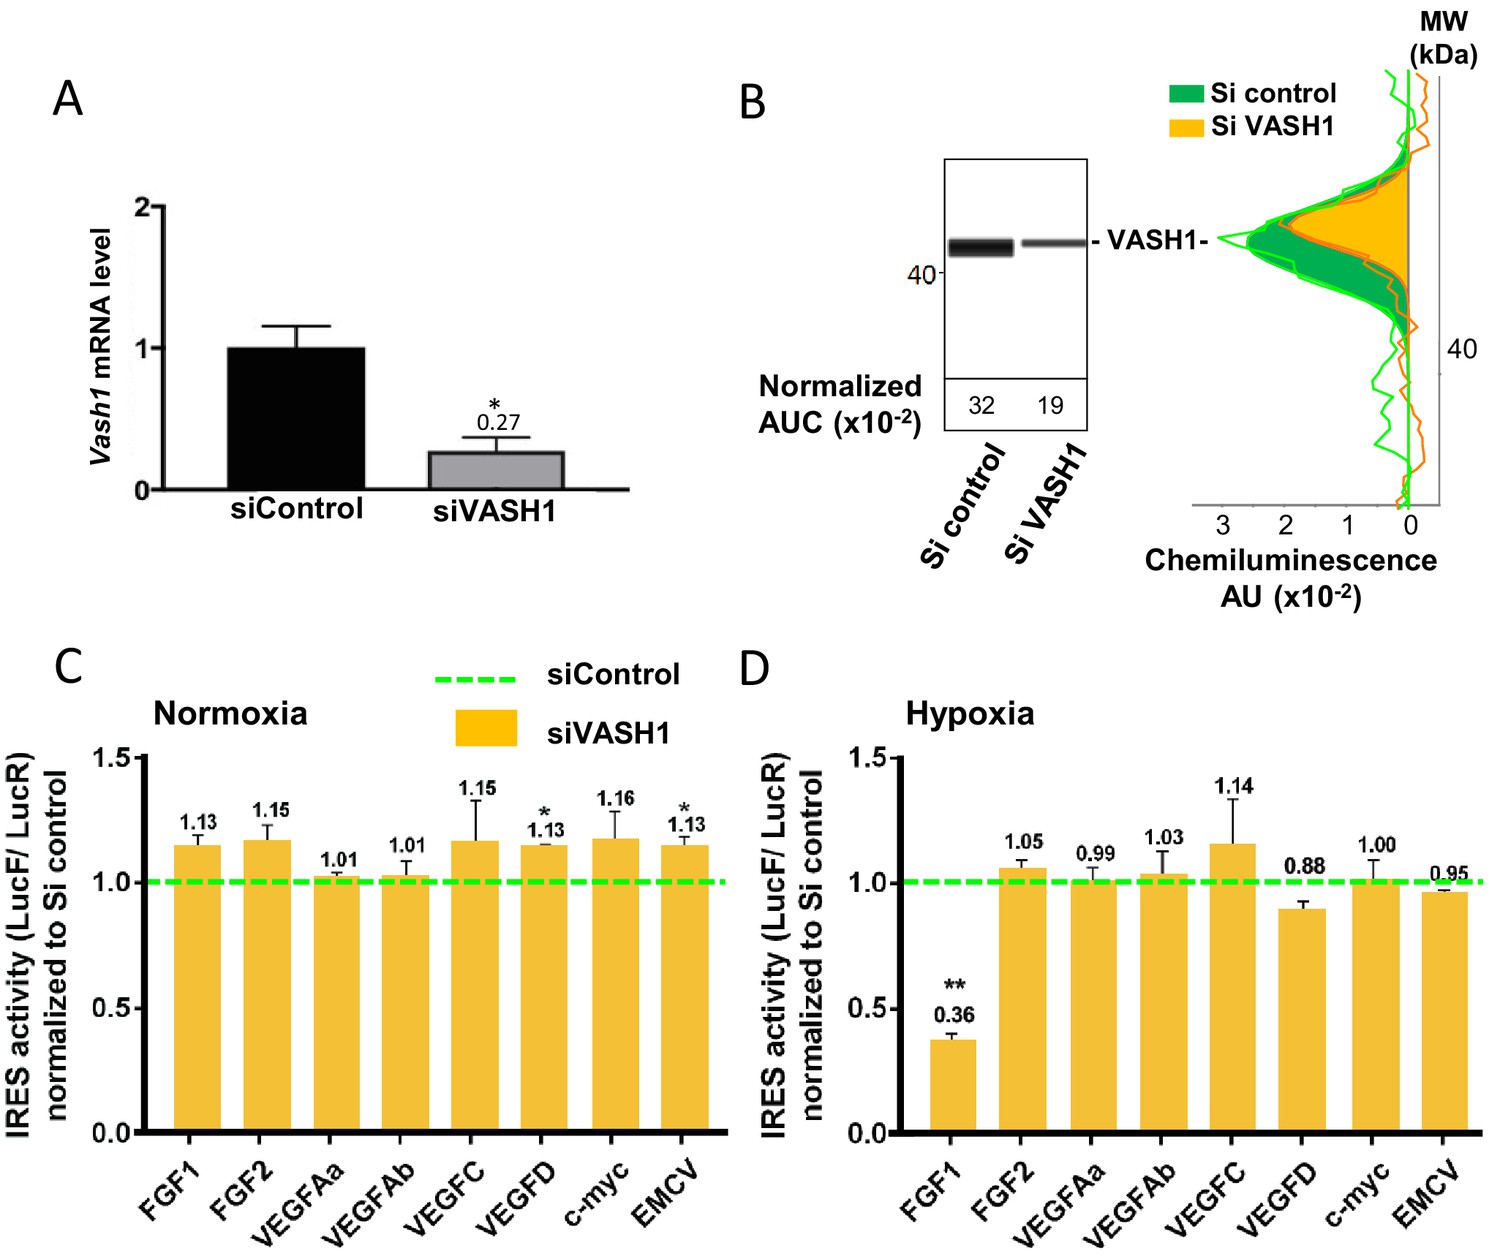
Vasohibin1 is a new ITAF that is active in early hypoxia.
(A, B) VASH1 knock-down was performed in HL-1 cardiomyocytes using short-interfering (siRNA) smartpools targeting VASH1 (siVASH1) or control (siControl). VASH1 mRNA level was measured by RT-qPCR (A), and VASH1 protein expression was analyzed by the capillary Simple Western method using an anti-VASH1 antibody and quantified by normalization to total proteins. The experiments were reproduced twice, giving identical results. One of the two experiments is shown (B). Knock-down of VASH-1 was performed on cardiomyocytes transduced by a set of IRES-containing lentivectors used in Figure 4. (C, D) After 8 hr of hypoxia, IRES activities (LucF/LucR ratio) were measured in cell extracts from normoxic (C) and hypoxic cardiomyocytes (D). The IRES activity values have been normalized to the control siRNA. Histograms correspond to means ± standard deviation of the mean, and a non-parametric Mann-Whitney test was used to identify significant change from control levels: *p<0.05, **p<0.01. For each IRES the mean was calculated for nine cell culture biological replicates, each of these being the mean of three technical replicates (27 technical replicates in total but the M-W test was performed with n = 9). Detailed values of biological replicates are presented in Supplementary file 5.
Figure 7—figure supplement 1
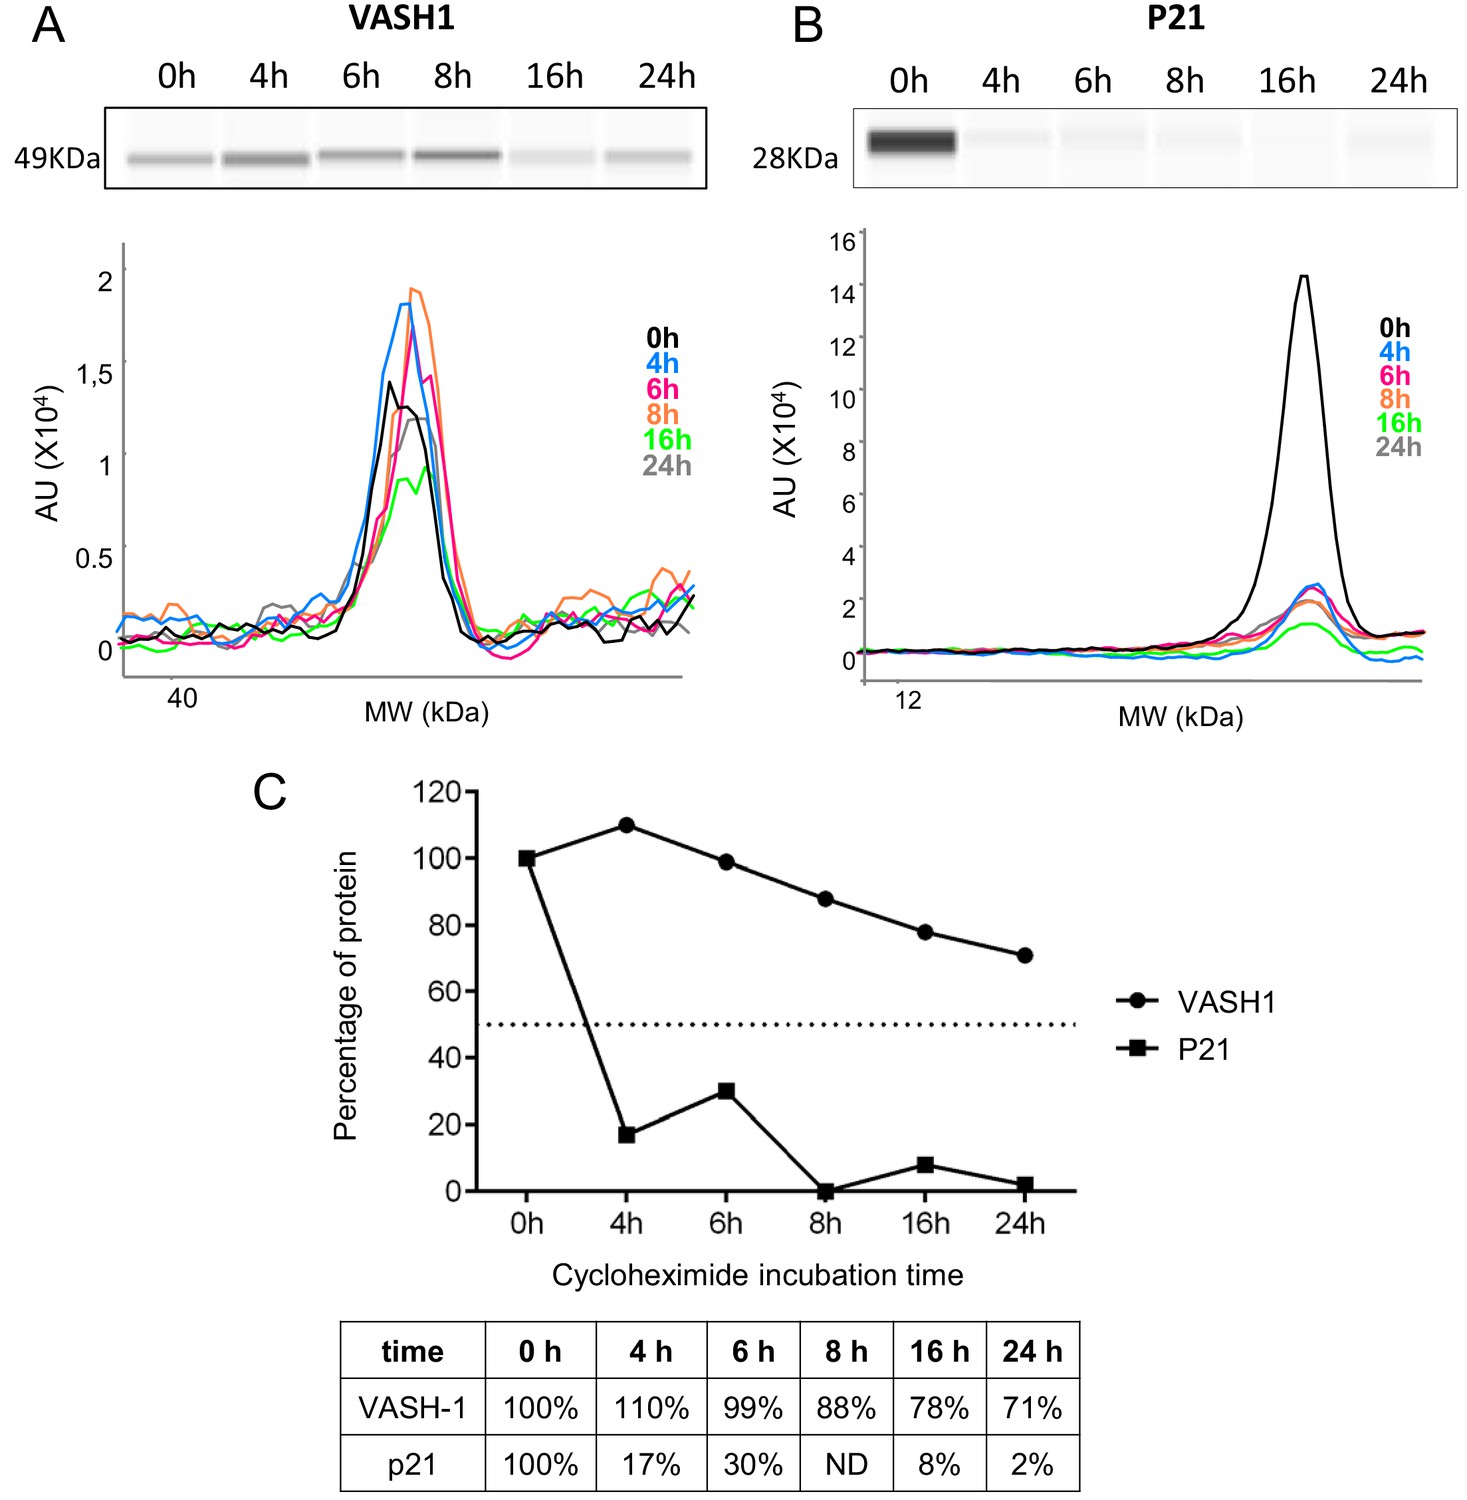
VASH1 half-life is superior to 24 hr.
(A–C) VASH1 half-life determination was performed by blocking protein synthesis with cycloheximide at 10 µg/mL, with time-course points at 0 hr, 4 hr, 6 hr, 8 hr, 16 hr and 24 hr. VASH1 (A) and P21 (B) protein stability was measured by capillary Simple Western, with normalization to the 0 hr time-course point. P21 was used as a control for its short half-life (C). Three independent experiments were performed. A representative experiment is shown.
Figure 8
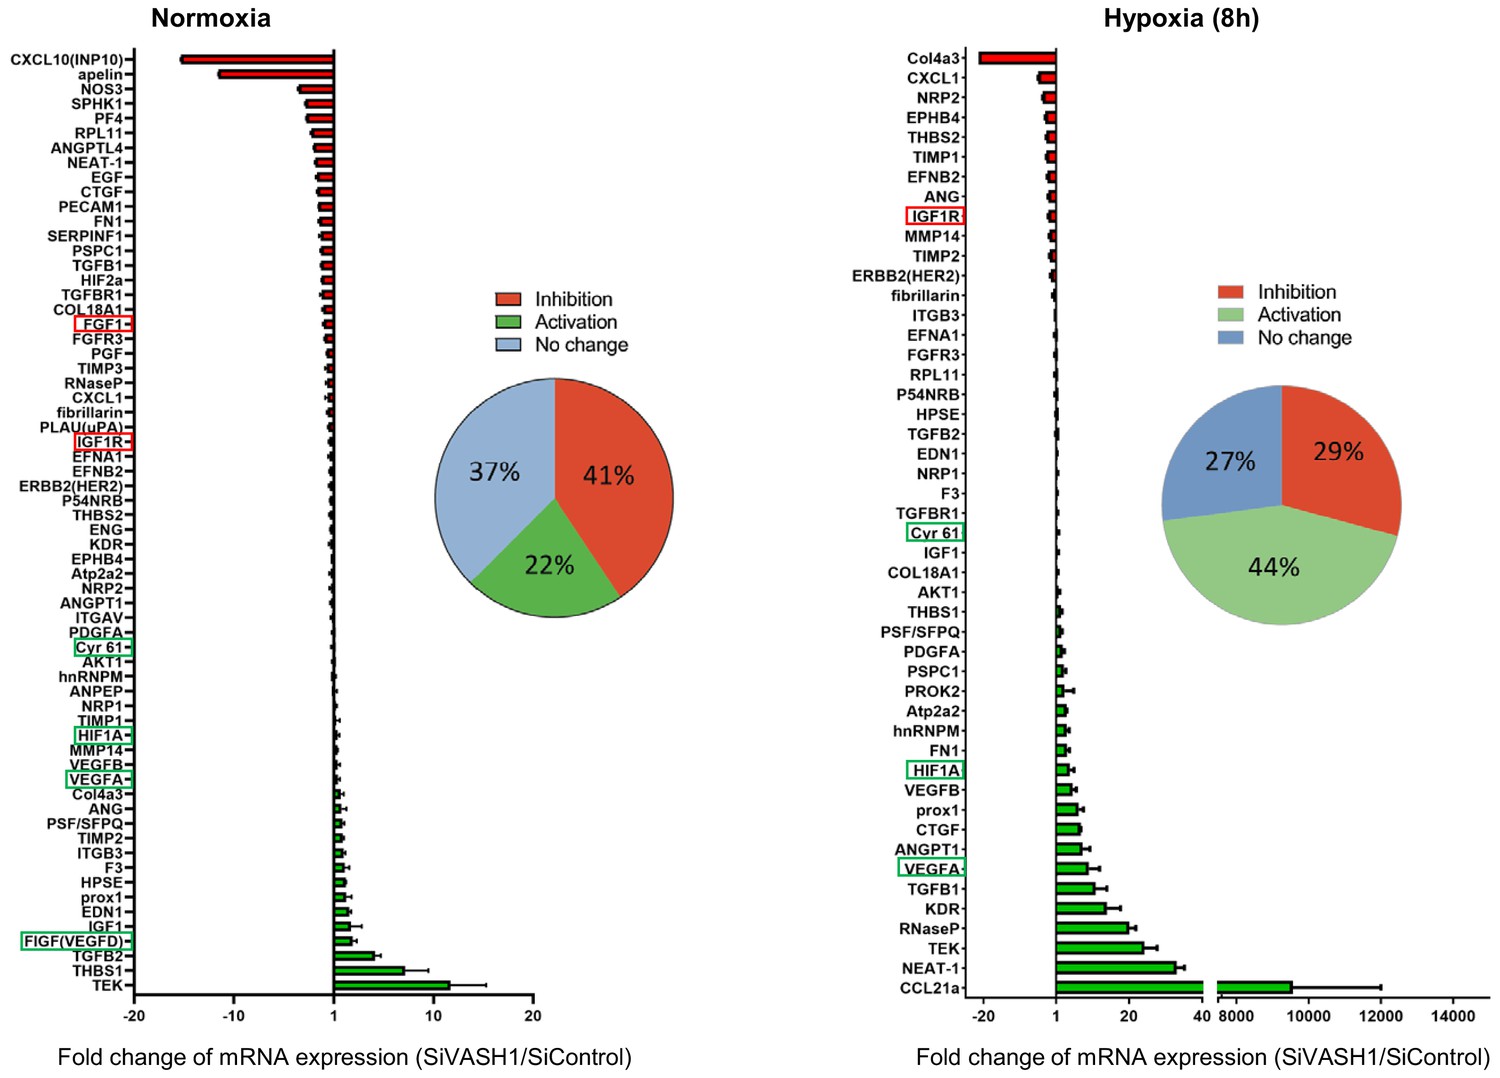
VASH1 depletion has both activating and inhibiting effects on mRNA recruitment into polysomes.
HL-1 cardiomyocytes were treated with siVASH1 or siControl and submitted to 8 hr of hypoxia, or maintained in normoxia. RNA was purified from polysome fractions and from cell lysate before loading. cDNA and PCR arrays were performed as in Figure 1. Relative quantification (RQ) of gene expression during hypoxia was calculated using the 2–ΔΔCT method with normalization to 18S rRNA and to SiControl. mRNA levels (polysomal RNA/total RNA) are shown as fold change of repression (red) or induction (green) in siVASH1 cells normalized to SiControl-treated cells. Non-regulated mRNAs are represented in blue. The threshold for induction was set at 1.5. When the RQ value is inferior to 1, the fold change is expressed as −1/RQ. The detailed values are available in Supplementary file 7.
Author response image 1

Author response image 2
Tables
Key resources table
| Reagent type (species) or resource | Designation | Source or reference | Identifiers | Additional information |
|---|---|---|---|---|
| Gene (firefly, Photinus) | Luc+ | Promega | Modified firefly luciferase | |
| Gene (Renilla reniformis) | LucR | Promega | Renilla luciferase | |
| Strain, strain background (Escherichia coli) | TOP 10 | Thermofisher Scientific | Transformation-competent cells (genotype : F– mcr A Δ (mrr –hsd RMS–mcr BC) φ 80lac ZΔ M15 ΔlacX 74 rec A1 ara D139 Δ (araleu) 7697 gal U gal K rps L (StrR) end A1 nup G) | |
| Cell line (Homo sapiens) | 293FT | Invitrogen | R700-07 | High-transfection performance for lentivector production |
| Cell line (Homo sapiens) | HT1080 | ATCC | CCL-121 | |
| Cell line (Mus musculus) | HL-1 | William C. Claycomb (Claycomb et al., 1998) | Cardiomyocyte cell line with beating phenotype | |
| Recombinant DNA reagent | pTRIP-CRHL+ | Dryad, Supplementary file 8A (Morfoisse et al., 2014) | Bicistronic SIN lentivector construct with the CMV promoter controlling expression of LucR and Luc+ separated by an intergenic palindromic sequence | |
| Recombinant DNA reagent | pTRIP-CRF1AL+ | Sequence available on Dryad, (Martineau et al., 2004; Ainaoui et al., 2015) | Bicistronic SIN lentivector construct with the CMV promoter controlling expression of LucR and Luc+ separated by the human FGF1 IRES A | |
| Recombinant DNA reagent | pTRIP-CRFL+ | Sequence available on Dryad, (Créancier et al., 2000) | Bicistronic SIN lentivector construct with the CMV promoter controlling expression of LucR and Luc+ separated by the human FGF2 IRES | |
| Recombinant DNA reagent | pTRIP-CRVAL+ | Sequence available on Dryad, (Huez et al., 1998) | Bicistronic SIN lentivector construct with the CMV promoter controlling expression of LucR and Luc+ separated by the human VEGFA IRESa | |
| Recombinant DNA reagent | pTRIP-CRVBL+ | Sequence available on Dryad, (Huez et al., 1998) | Bicistronic SIN lentivector construct with the CMV promoter controlling expression of LucR and Luc+ separated by the human VEGFA IRESb | |
| Recombinant DNA reagent | pTRIP-CRhVCL+ | Sequence available on Dryad, (Morfoisse et al., 2014) | Bicistronic SIN lentivector construct with the CMV promoter controlling expression of LucR and Luc+ separated by the human VEGFC IRES | |
| Recombinant DNA reagent | pTRIP-CRhVDL+ | Sequence available on Dryad, (Morfoisse et al., 2016) | Bicistronic SIN lentivector construct with the CMV promoter controlling expression of LucR and Luc+ separated by the human VEGFD IRES | |
| Recombinant DNA reagent | pTRIP-CRMP2L+ | Sequence available on Dryad, (Nanbru et al., 1997) | Bicistronic SIN lentivector construct with the CMV promoter controlling expression of LucR and Luc+ separated by the human c-myc IRES | |
| Recombinant DNA reagent | pTRIP-CREL+ | Sequence available on Dryad, (Créancier et al., 2000) | Bicistronic SIN lentivector construct with the CMV promoter controlling expression of LucR and Luc+ separated by the EMCV IRES | |
| Recombinant DNA reagent | pCMV-dR8.91 | Addgene | Trans-complementing plasmid containing the lentiviral protein genes (gag, pol, rev…) | |
| Recombinant DNA reagent | pCMV-VSV-G | Addgene | #8454 | Trans-complementing plasmid containing VSV G envelope protein gene |
| Transfected construct (mouse) | Acell SMARTpool targeting VASH1 (siVASH1) | Dharmacon | siRNA targeting VASH1 (Supplementary file 8B) | |
| Transfected construct (mouse) | Control SMARTpool | Dharmacon | Scramble siRNA (Supplementary file 8B) | |
| Sequence-based reagent | Deltagene assay | Fluidigm Corporation, oligonucleotide sequences available in Supplementary file 6 | PCR array with 96 oligonucleotides primer couples | |
| Antibody | Mouse monoclonal anti-VASH-1 | Abcam | EPR17420 | Jess Western 1:100 |
| Antibody | Mouse monoclonal anti-VASH-1 | Abcam | ab176114 | IC 1:50 |
| Antibody | Mouse monoclonal anti-FGF1-1 | Abcam | EPR19989 | Jess Western 1:25 |
| Antibody | Mouse monoclonal anti-p21 | Santa Cruz | sc-6546 (F5) | Jess Western 1:10 |
| Antibody | Rabbit polyclonal anti eIF2α | Cell Signaling Technology | 9721 | Jess Western 1:50 |
| Antibody | Mouse monoclonal anti-phospho-eIF2α | Cell Signaling Technology | 2103 | Jess Western 1:50 |
| Antibody | Rabbit polyclonal anti-4EBP-1 | Cell Signaling Technology | 9452 | Jess Western 1:50 |
| Antibody | Rabbit polyclonal anti-phospho-4EBP-1 | Cell Signaling Technology | 9451 | Jess Western 1:50 |
| Antibody | Secondary-HRP (ready to use rabbit ‘detection module’) | Protein Simple | DM-001 | Jess Western |
| Antibody | Donkey anti-rabbit alexa488 | Jackson Immunoresearch | 711-545-152 | Secondary antibody for IC |
| Software, algorithm | PRISM | Graphpad | Statistical analysis |
Additional files
-
Supplementary file 1
Transcriptome of (lymph)angiogenic factor genes in hypoxic HL-1 cardiomyocytes.
Total RNA was purified from HL-1 cardiomyocytes submitted to increasing periods from 5 min to 24 hr of hypoxia at 1% O2, as well as from normoxic cardiomyocytes as a control. cDNA was synthesized and used for a Fluidigm deltagene PCR array dedicated to genes related to (lymph)angiogenesis or stress (Supplementary file 6). Analysis was performed in three biological replicates (cell culture well and cDNA), each of them measured in three technical replicates (PCR reactions). Relative quantification (RQ) of gene expression in hypoxia was calculated using the 2–ΔΔCT method with normalization to 18S and to normoxia. Standard deviation is indicated. When the RQ value is inferior to 1, the fold change is expressed as −1/RQ. ND means ‘non detected’. '–' means that the gene was not included in the array.
- https://cdn.elifesciences.org/articles/50094/elife-50094-supp1-v2.docx
-
Supplementary file 2
Translatome of (lymph)angiogenic factor genes in hypoxic HL-1 cardiomyocytes.
Polysomes were purified on a sucrose gradient from HL-1 cardiomyocytes, either in normoxia or after 4 hr or 24 hr of hypoxia at 1% O2, as described in 'Materials and Methods'. RNA was purified from polysome-bound fractions and from cell lysate (before gradient loading). cDNA and PCR arrays were performed as in Figure 1 and in Supplementary file 1. Relative quantification (RQ) of gene expression in hypoxia was calculated using the 2-ΔΔCT method (polysomal RNA/total RNA normalized to normoxia). The 4 hr of hypoxia array was repeated in two independent arrays (RQ1 and RQ2). The values presented in Figures 2 and 3 correspond to RQ1 values. In Figure 6A and B, values are from RQ2. For RQ1, gene expression analysis was performed in three biological replicates (cell culture well and cDNA), each of them measured in three technical replicates (PCR reactions). For RQ2 (4 hr and 24 hr), analysis was performed in two biological replicates, each of them measured in two technical replicates. Standard deviation is indicated. When the RQ value is inferior to 1, the fold change is expressed as −1/RQ. ND means ‘non detected’. '–' means that the gene was not included in the array.
- https://cdn.elifesciences.org/articles/50094/elife-50094-supp2-v2.docx
-
Supplementary file 3
IRES activities after different periods of hypoxia in HL-1 cells.
Luciferase activity values and IRES activities corresponding to the experiments presented in Figure 4. (A) Kinetics of FGF1 IRES activity from 30 min to 24 hr. (B–I) Activities of the different IRES after 4 hr, 8 hr and 24 hr of hypoxia. (J) Negative control with a lentivector containing a hairpin (no IRES) between the two luciferase cistrons. For each IRES and for each time, nine biological replicates were performed (n = 9). Each biological replicate corresponds to the mean of three technical replicates. Means, standard deviations (SD) and Mann-Whitney P values comparing IRES activities in hypoxia and in normoxia were calculated. The means are reported in the histograms shown in Figure 4. P-value significance is indicated: *p<0.05, **p<0.01, ***<0.001, ****p<0.0001.
- https://cdn.elifesciences.org/articles/50094/elife-50094-supp3-v2.docx
-
Supplementary file 4
BIA-MS analysis of IRES-bound proteins in hypoxic cardiomyocytes.
(A–C) Total cell extracts from normoxic or hypoxic HL-1 cardiomyocytes were injected into the BIAcore T200 optical biosensor device where biotinylated IRES RNAs had been immobilized. The list of bound proteins identified by mass spectrometry (LC-MS/MS) after tryptic digestion is shown for FGF1 (A), VEGF-Aa (B) or EMCV (C) IRESs, respectively. The score and the number of spectra and peptides identified are indicated. For each duration of hypoxia, cells were cultivated for the same period in normoxia as a control (normoxia 4 hr and 8 hr).
- https://cdn.elifesciences.org/articles/50094/elife-50094-supp4-v2.docx
-
Supplementary file 5
Knock-down of VASH1 in HL-1 cells.
HL-1 cells transduced by the different IRES-containing lentivectors were transfected with siRNA SiVASH of SiControl and submitted to 8 hr of hypoxia. Luciferase activity and IRES activities (ratio LucF/LucR x 100) were measured. For each IRES, nine biological replicates were performed with SiVASH1 or SiControl (n = 9). Each biological replicate corresponds to the mean of three technical replicates. Means, standard deviations (SD) and Mann-Whitney P values comparing IRES activities with SiVASH1 or SiControl were calculated. IRES activities corresponding to the means of all biological replicates are reported in the histograms shown in Figure 7. P-value significance is indicated: *p<0.05, **p<0.01, ns = non-significant.
- https://cdn.elifesciences.org/articles/50094/elife-50094-supp5-v2.docx
-
Supplementary file 6
List of genes and primer couples used in the Fluidigm Deltagene PCR array.
- https://cdn.elifesciences.org/articles/50094/elife-50094-supp6-v2.docx
-
Supplementary file 7
VASH1 depletion has both activating and inhibiting effects on mRNA recruitment into polysomes.
HL-1 cardiomyocytes were treated with siVASH1 of siControl and submitted to 8 hr of hypoxia or maintained in normoxia (see also Figure 8). RNA was purified from polysome fractions and from cell lysate before loading. cDNA and PCR array were performed as in Figure 1. Relative quantification (RQ) of gene expression during hypoxia was calculated using the 2–ΔΔCT method with normalization to 18S rRNA and to SiControl. mRNA levels (polysomal RNA/total RNA) are shown. When the RQ value is inferior to 1, the fold change is expressed as −1/RQ. ‘ND’ means that RNA was not detected.
- https://cdn.elifesciences.org/articles/50094/elife-50094-supp7-v2.docx
-
Supplementary file 8
Hairpin and siRNA sequences.
(A) Sequence of the hairpin inserted in the bicistronic lentivector between the LucR and Luc+ genes. The LucR stop codon and the Luc+ start codon are indicated. The complementary sequences are indicated in red and in blue, respectively. (B) Sequences of the four siRNAs present in the siControl and siVASH1 smartpools.
- https://cdn.elifesciences.org/articles/50094/elife-50094-supp8-v2.docx
-
Transparent reporting form
- https://cdn.elifesciences.org/articles/50094/elife-50094-transrepform-v2.docx
Download links
A two-part list of links to download the article, or parts of the article, in various formats.
Downloads (link to download the article as PDF)
Open citations (links to open the citations from this article in various online reference manager services)
Cite this article (links to download the citations from this article in formats compatible with various reference manager tools)
Vasohibin1, a new mouse cardiomyocyte IRES trans-acting factor that regulates translation in early hypoxia
eLife 8:e50094.
https://doi.org/10.7554/eLife.50094


