Axon-dependent expression of YAP/TAZ mediates Schwann cell remyelination but not proliferation after nerve injury
- Shriners Hospitals Pediatric Research Center and Center for Neural Repair and Rehabilitation, Temple University, United States
- Department of Anatomy and Cell Biology, Temple University, United States
- Department of Clinical Sciences, Lewis Katz School of Medicine, Temple University, United States
Figures
Figure 1 with 1 supplement
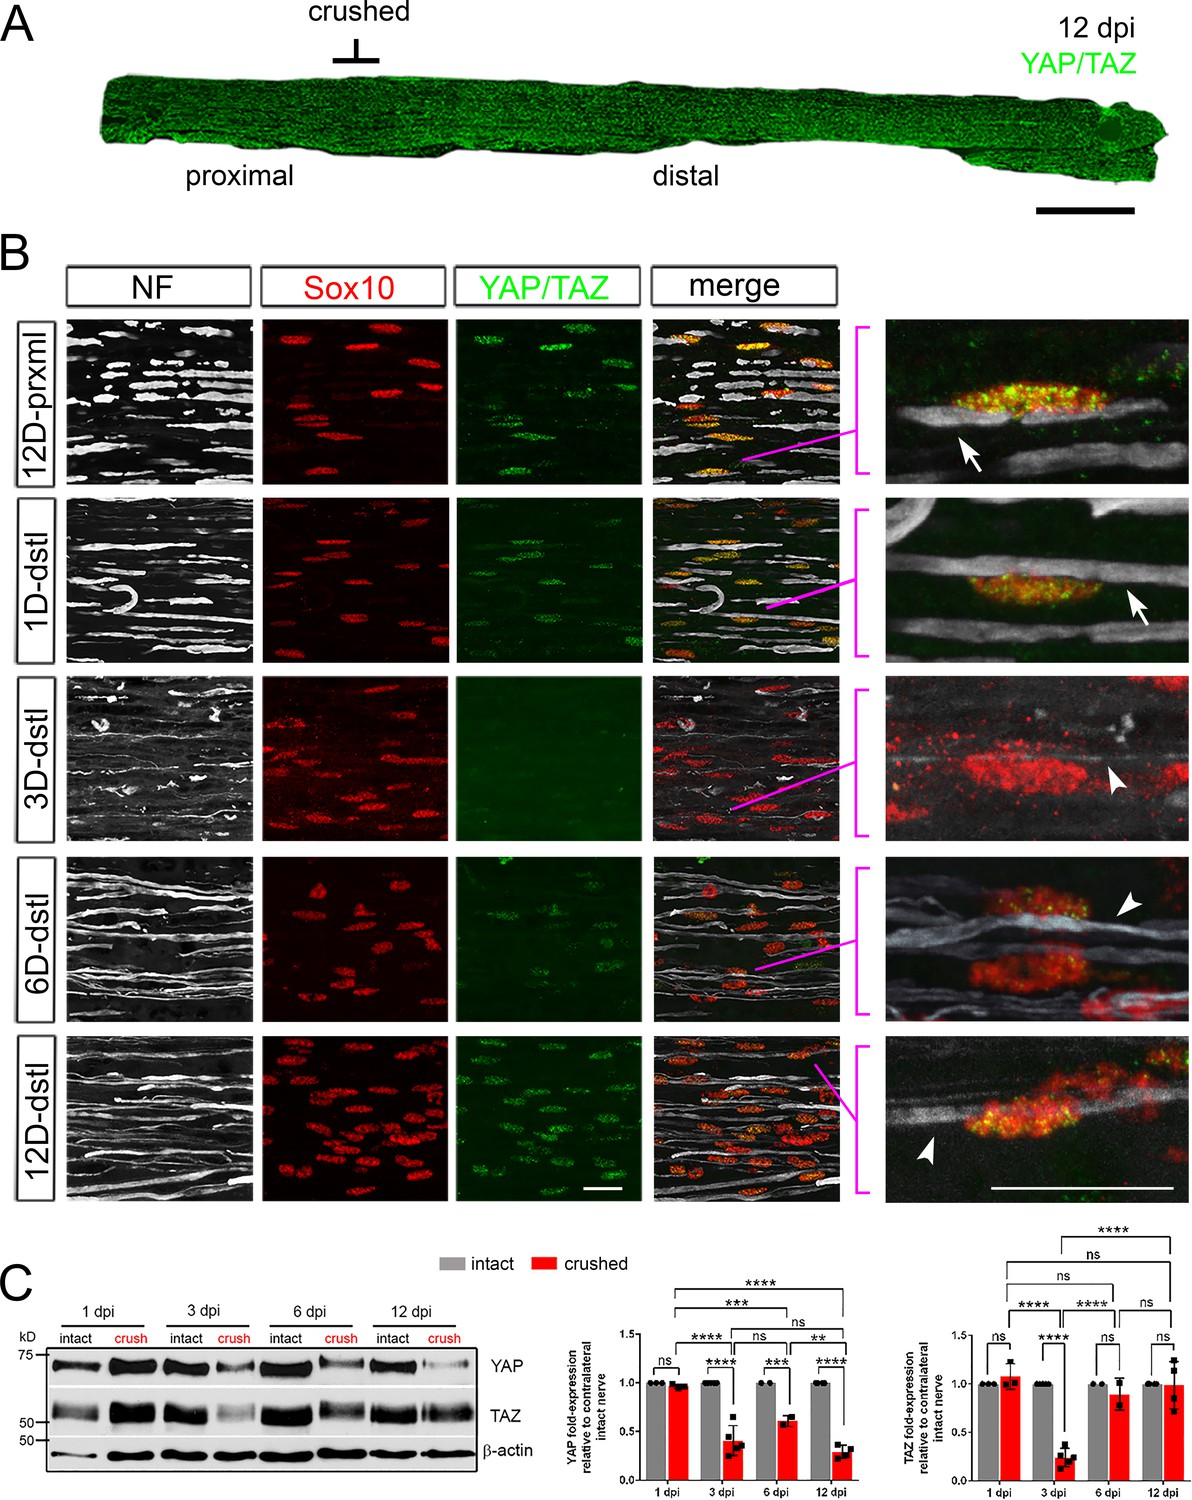
Loss and recovery of YAP/TAZ in Schwann cells after sciatic nerve crush.
YAP/TAZ expression in crushed sciatic nerves of adult mice, shown by IHC (A, B) and Western blotting (C). Axons and Schwann cell (SC) nuclei are marked by neurofilament (NF) or Sox10, respectively. (A) A surgery schematic for nerve crush, which permits regeneration of axons into the distal nerve stump, illustrated by a low-magnification, longitudinal section of a sciatic nerve at 12 dpi, immunostained for YAP and TAZ. (B) Dramatic loss of YAP/TAZ in SC nuclei by three dpi, concomitant with axon degeneration, followed by upregulation of YAP/TAZ after six dpi, concomitant with axon regeneration. Right-most panels: zoomed area of merged images, as indicated, showing nuclear expression of YAP/TAZ in SCs associated with large diameter axons, before and after injury. Arrows point to large diameter axons in distal nerves before injury or 1 dpi, associated with YAP/TAZ+ SC nuclei. Arrowheads point to regenerating axons. Note that SC nuclei associated with a thin regenerating axon at 3 dpi do not express nuclear YAP/TAZ, but those in contact with a large diameter axon after 6 dpi do. Scale bars; 500 μm (A), 20 μm (B). (C) Western blotting of intact and crushed nerve lysates, showing loss of YAP and TAZ by 3 dpi, followed by full recovery of TAZ but not YAP by 12 dpi. Quantification of Western blots: n = 3–5 mice per experiment. ns = not significant, 2-way ANOVA. YAP: 1 dpi intact vs 1dpi crushed, p=0.9991; 1 dpi crushed vs 3 dpi crushed, ****p<0.0001; 1 dpi crushed vs 6 dpi crushed, ***p=0.0009; 1 dpi crushed vs 12 dpi crushed, ****p<0.0001; 3 dpi intact vs 3 dpi crushed, ****p<0.0001; 3 dpi crushed vs 6 dpi crushed, p=0.0652; 3 dpi crushed vs 12 dpi crushed, p=0.3479; 6 dpi intact vs 6 dpi crushed, ***p=0.0009; 6 dpi crushed vs 12 dpi crushed, **p=0.0018; 12 dpi intact vs 12 dpi crushed, ****p<0.0001. TAZ: 1 dpi intact vs 1 dpi crushed, p=0.9909; 1 dpi crushed vs 3 dpi crushed, ****P<0.0001; 1 dpi crushed vs 6 dpi crushed, p=0.6855; 1 dpi crushed vs 12 dpi crushed, p=0.9692; 3 dpi intact vs 3 dpi crushed, ****p<0.0001; 3 dpi crushed vs 6 dpi crushed, ****p<0.0001; 3 dpi crushed vs 12 dpi crushed, ****p<0.0001; 6 dpi intact vs 6 dpi crushed, p=0.9828; 6 dpi crushed vs 12 dpi crushed, p=0.9810; 12 dpi intact vs 12 dpi crushed, p>0.9999.
-
Figure 1—source data 1
Source files for Yap and Taz Western graphs.
This zip archive contains the raw data for WT and iDKO used for the quantitative analysis shown in Figure 1C. Data are in GraphPad Prism files, as indicated.
- https://cdn.elifesciences.org/articles/50138/elife-50138-fig1-data1-v2.zip
-
Figure 1—source data 2
Time course of YAP and TAZ protein expression in WT nerves after sciatic nerve crush.
Uncropped Western blots of images used to make Figure 1C. Individually processed samples from 6 mice at three dpi, 5 mice at 12 dpi, and three mice at both 1 dpi and six dpi are shown and used for quantification. X…….X denotes the line along which membranes were cut prior to probing with anti-beta actin antibody. Two exposures of anti-YAP/TAZ blot are shown.
- https://cdn.elifesciences.org/articles/50138/elife-50138-fig1-data2-v2.jpg
Figure 1—figure supplement 1
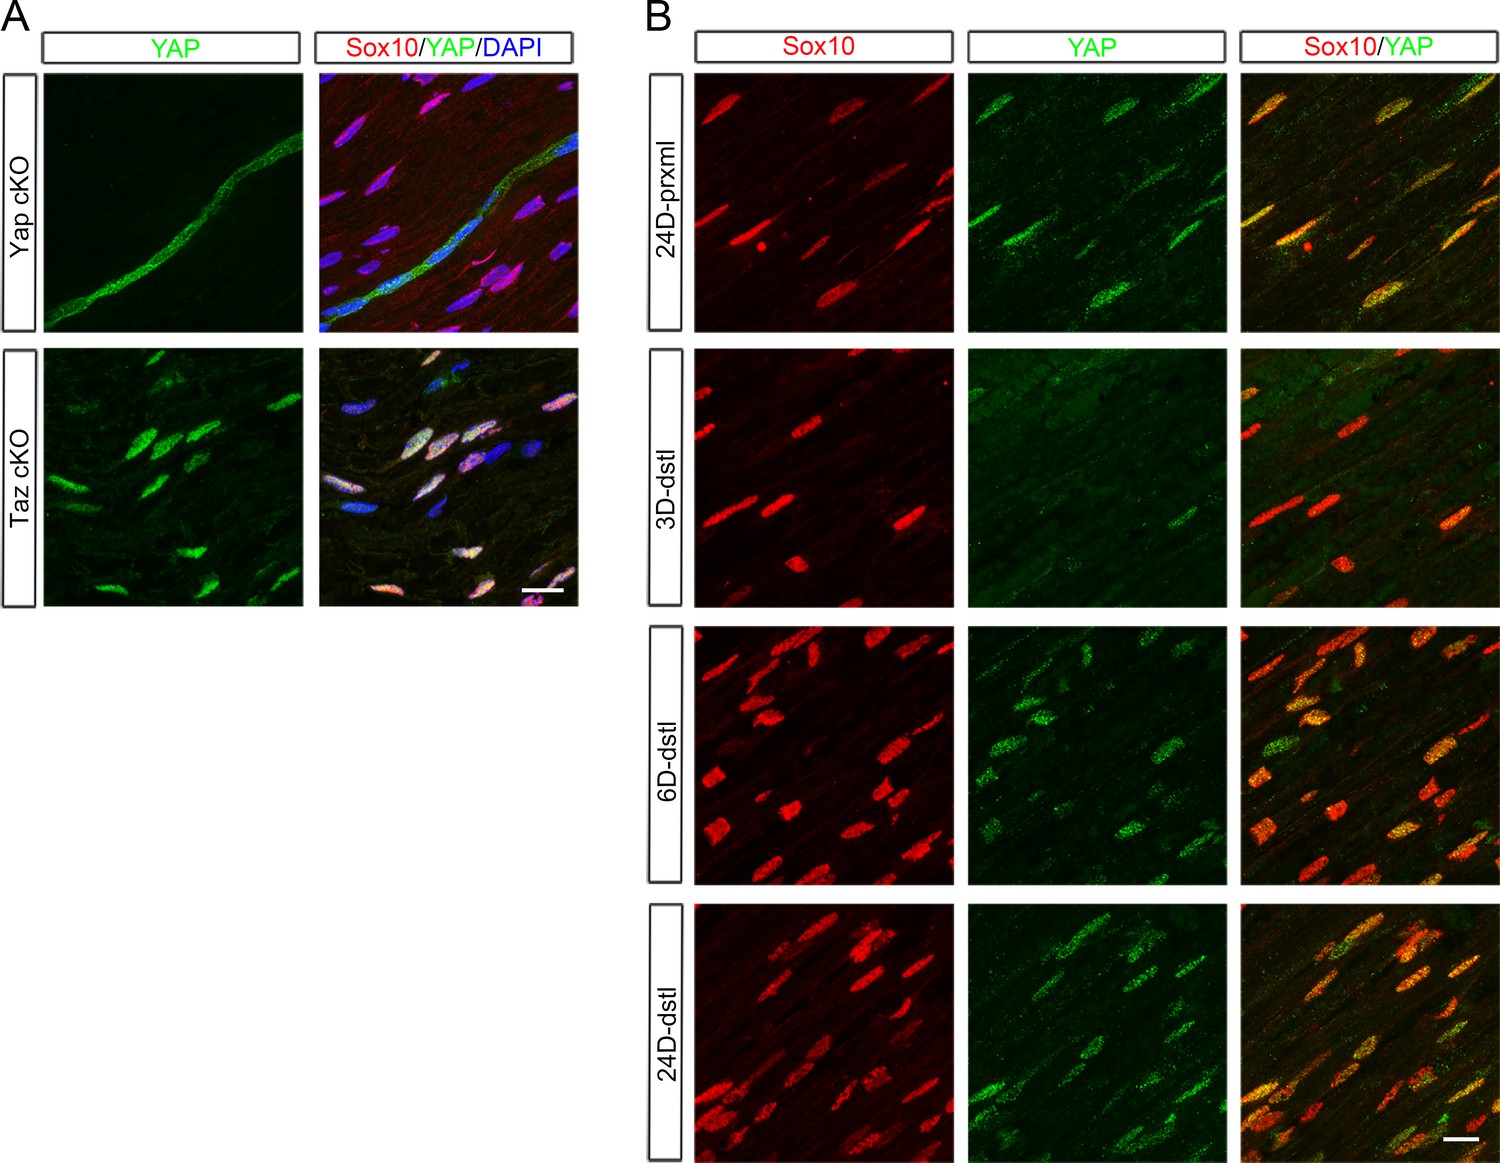
Additional assessment of YAP expression in Schwann cells after nerve injury.
(A) Validation of a YAP-specific antibody. The antibody labels perineurial cells but not SC nuclei in intact sciatic nerves of Yap cKO (Mpz-Cre; Yapfl/fl; Taz+/+, Upper panel), whereas it labels SC nuclei in Taz cKO mice (Mpz-Cre; Yap+/+; Tazfl/fl, Bottom panel). (B) Longitudinal sections of crushed nerves, showing loss of YAP from SC nuclei in distal nerves by three dpi, followed by re-upregulation at or after six dpi. Scale bars = 15 μm (A, B).
Figure 2
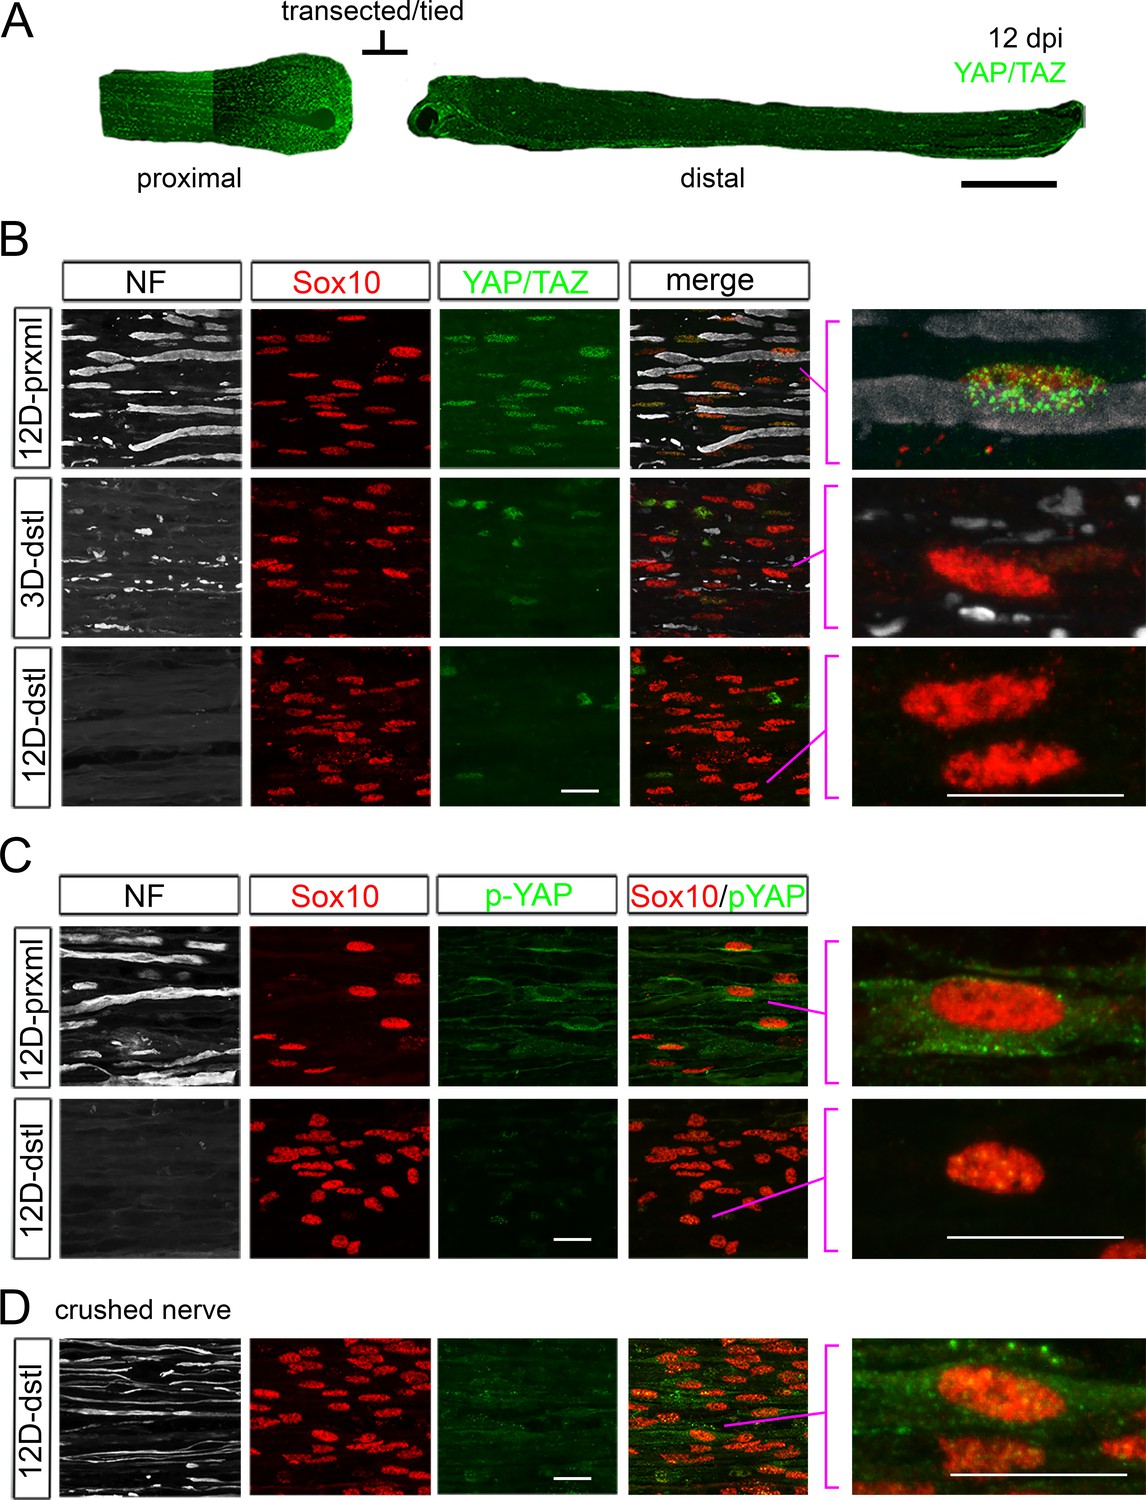
YAP/TAZ expression in Schwann cells after sciatic nerve transection.
(A, B, C) YAP/TAZ expression in transected sciatic nerves of adult mice. Axons and Schwann cell (SC) nuclei are marked by neurofilament (NF) or Sox10, respectively. (A) A surgery schematic for nerve transection illustrated by a low-magnification, longitudinal section of a sciatic nerve at 12 dpi, immunostained for YAP and TAZ. Axon regeneration into the distal nerve stump was prevented by ligating the transected nerve stumps. (B) Complete loss of YAP/TAZ in SC nuclei at and after 3 dpi, concomitant with axon degeneration. Right-most panels: zoomed area of merged images, as indicated, showing that SCs do not upregulate YAP/TAZ in the absence of regenerating axons. (C) Cytoplasmic loss of phosphorylated YAP (p-YAP) in SCs of transected nerve. p-YAP was undetectable in axotomized SCs at 12 dpi. (D) Upregulation of p-YAP in SCs of crushed nerve. p-YAP was detectable in innervated SCs at 12 dpi. Right-most panel: zoomed area of merged image, showing a SC nucleus exhibiting perinuclear cytoplasmic p-YAP. Scale bars; 500 μm (A), 20 μm (B–D).
Figure 3 with 1 supplement
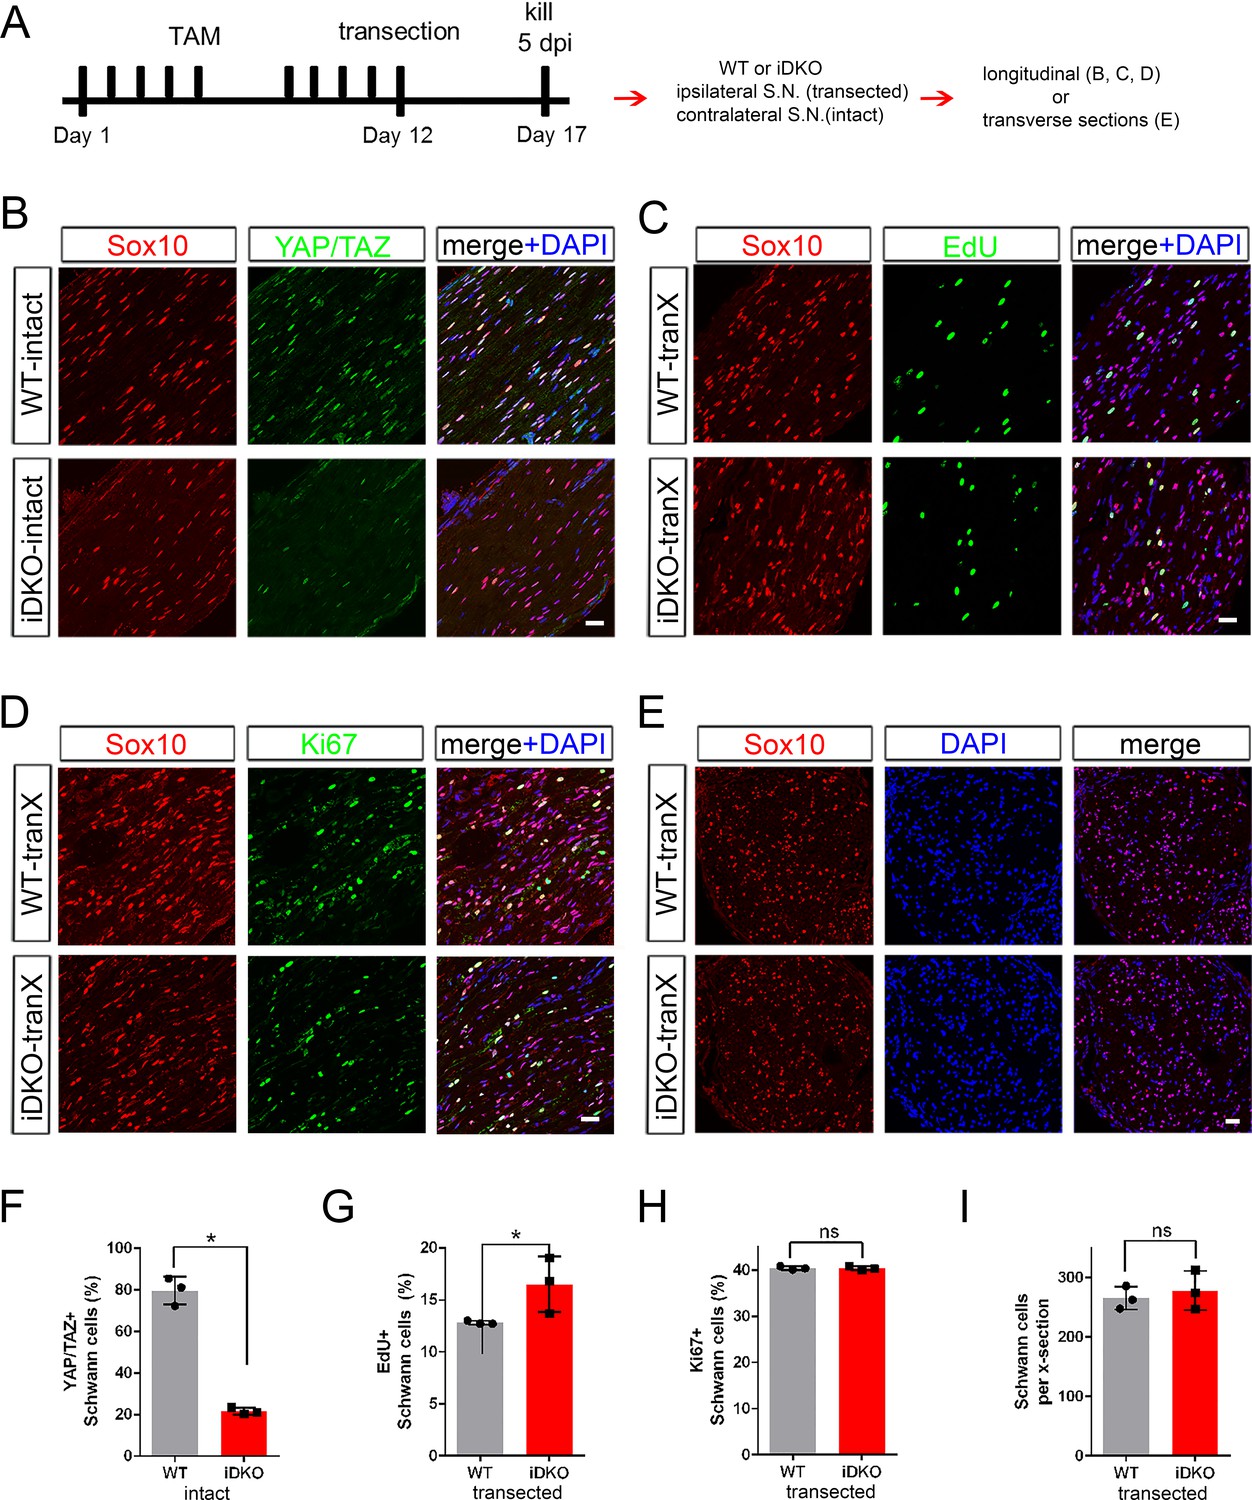
YAP/TAZ are dispensable for Schwann cell proliferation after axotomy.
(A) Schematic showing timeline of tamoxifen injection, sciatic nerve transection and sacrifice of adult WT or Yap/Taz iDKO. (B) Longitudinal sections of intact sciatic nerves showing efficient deletion of YAP/TAZ in iDKO. SC nuclei are marked by Sox10 (red). All cell nuclei are marked by DAPI (blue). (C) Longitudinal sections of transected nerves of WT or iDKO showing SCs in S-phase of the cell cycle marked by EdU (green). (D) Longitudinal sections of transected nerves of WT or iDKO showing proliferating SCs marked by Ki67 (green). (E) Transverse sections of transected nerves of WT or iDKO showing SCs marked by Sox10 (red). (F) Quantification of SCs expressing nuclear YAP/TAZ in intact sciatic nerves of WT or iDKO. n = 3 mice per genotype, *p=0.0495, Mann-Whitney. (G) Quantification of EdU+ SCs in transected nerves of WT or iDKO. n = 3 mice per genotype, *p=0.0463, Mann-Whitney. (H) Quantification of Ki67+ proliferating SCs in transected nerves of WT or iDKO. n = 3 mice per genotype, ns, not significant, p=0.5127, Mann-Whitney. (I) Quantification of Sox10+ SCs in transected nerves of WT or iDKO. n = 3 mice per genotype. ns, not significant, p=0.8273, Mann-Whitney. Scale bars = 30 μm (B–E).
-
Figure 3—source data 1
Source files for EdU+ SC data.
This zip archive contains the IHC images for one WT and one iDKO used for the quantitative analysis shown in Figure 3G. Leica SP8 confocal lif images were processed using Imaris software and saved as tiffs.
- https://cdn.elifesciences.org/articles/50138/elife-50138-fig3-data1-v2.zip
-
Figure 3—source data 2
Source files for Ki67+ SC data.
This zip archive contains the IHC for one WT and one iDKO used for quantitative analysis shown in Figure 3H. Results and quantitation shown in the Figure used BD #550609 anti-Ki67. These results were confirmed using a second antibody, Abcam #ab15580 anti-Ki67. Images using both antibodies are included in the zip archive, in the indicated folders. Leica SP8 confocal lif images were processed using Imaris software and saved as tiffs.
- https://cdn.elifesciences.org/articles/50138/elife-50138-fig3-data2-v2.zip
-
Figure 3—source data 3
Source files for graphs quantifying Yap/Taz+ SCs, EdU+ SCs, Ki67+ SCs, and total SCs.
This zip archive contains the raw data for WT and iDKO used for the quantitative analysis shown in Figure 3F, G, H and I. The data are contained in both a text document and an Excel file, both labeled as Mann Whitney data. These files also contain data for Figure 3—figure supplement 1, Figures 4, 5, 6, 7, 8A and Figure 8—figure supplement 1E.
- https://cdn.elifesciences.org/articles/50138/elife-50138-fig3-data3-v2.zip
Figure 3—figure supplement 1
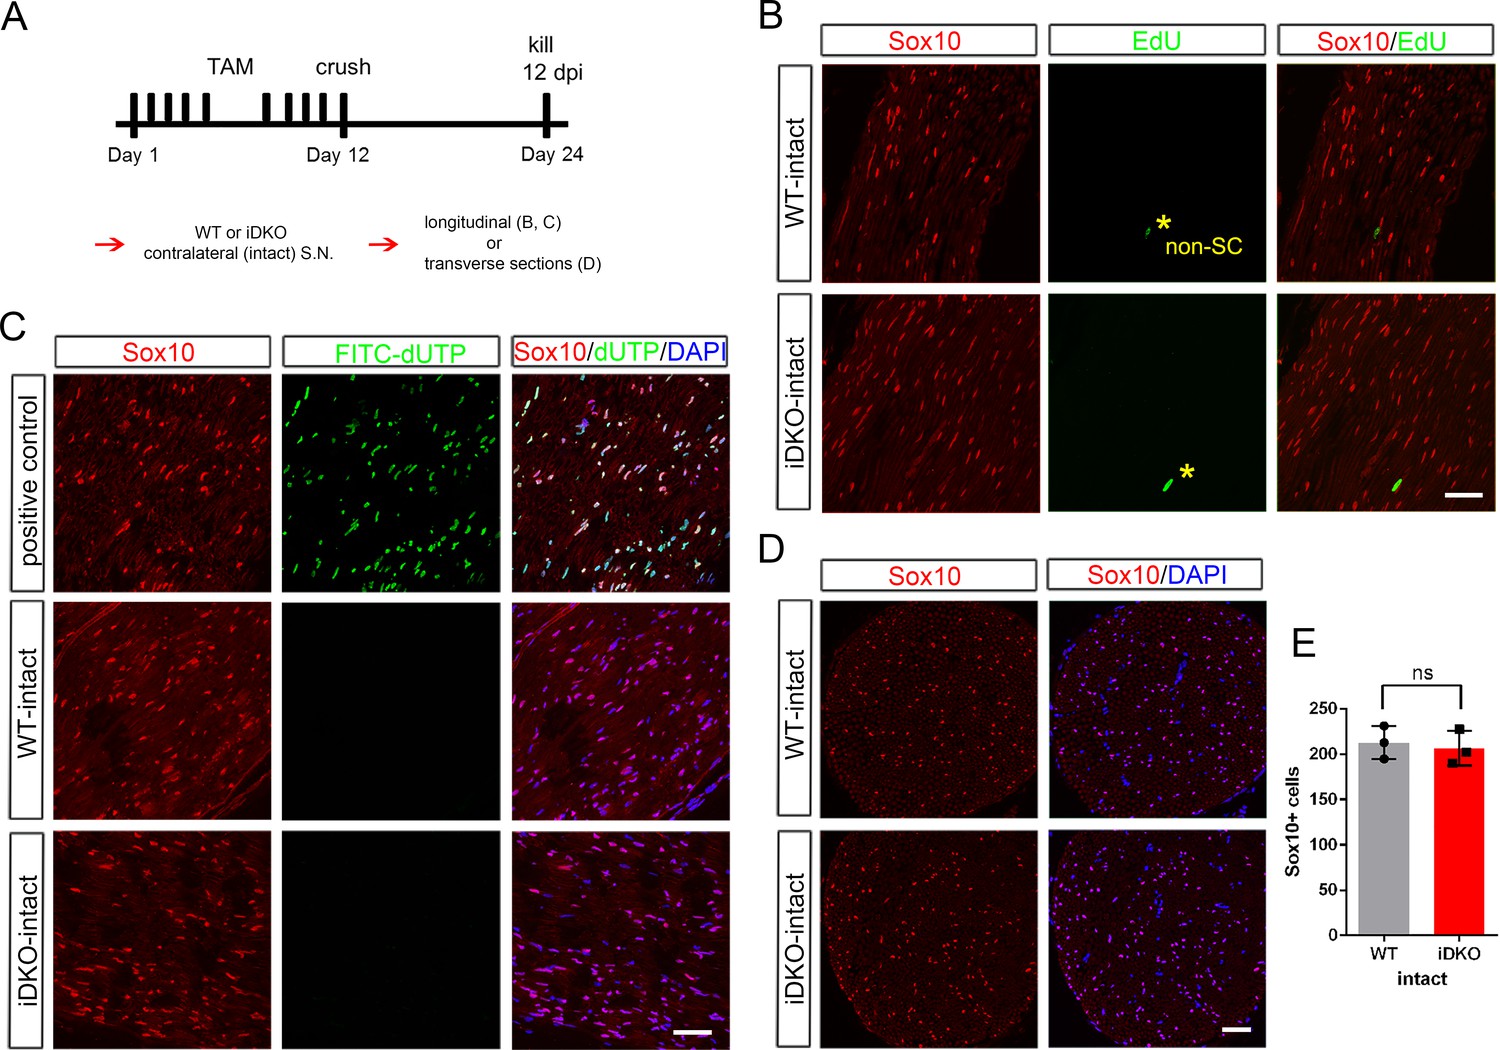
No Schwann cell proliferation or death in intact nerves of Yap/Taz iDKO at 12 dpi.
(A) Schematic showing experimental procedures analyzing contralateral intact nerves of WT or iDKO at 12 dpi. (B) Longitudinal sections showing absence of EdU+ SCs in S-phase in intact nerves of iDKO, as in WT. Asterisks denote EdU+ cells that are not SCs, as indicated by their lack of Sox10. (C) Longitudinal sections of contralateral intact nerves, showing absence of apoptotic SCs identified by FITC-dUTP incorporation in iDKO, as in WT. (D) Transverse sections of intact nerves, showing similar numbers of SCs (marked by Sox10) in intact nerves of WT and iDKO at 12 dpi. All nuclei are marked by DAPI. (E) Quantification of SCs in intact nerves of WT or iDKO, showing no significant difference. n = 3 mice per genotype. ns, not significant, p=0.5127, Mann-Whitney. Scale bars = 50 μm (B–D).
-
Figure 3—figure supplement 1—source data 1
Source files for graph quantifying total SCs.
This zip archive contains the raw data for WT and iDKO used for the quantitative analysis shown in Figure 3—figure supplement 1E. The data are contained in both a text document and an Excel file, both labeled as Mann Whitney data. These files also contain data for Figure 3—figure supplement 1, Figures 4, 5, 6, 7, 8 and Figure 8—figure supplement 1E.
- https://cdn.elifesciences.org/articles/50138/elife-50138-fig3-figsupp1-data1-v2.zip
Figure 4 with 1 supplement
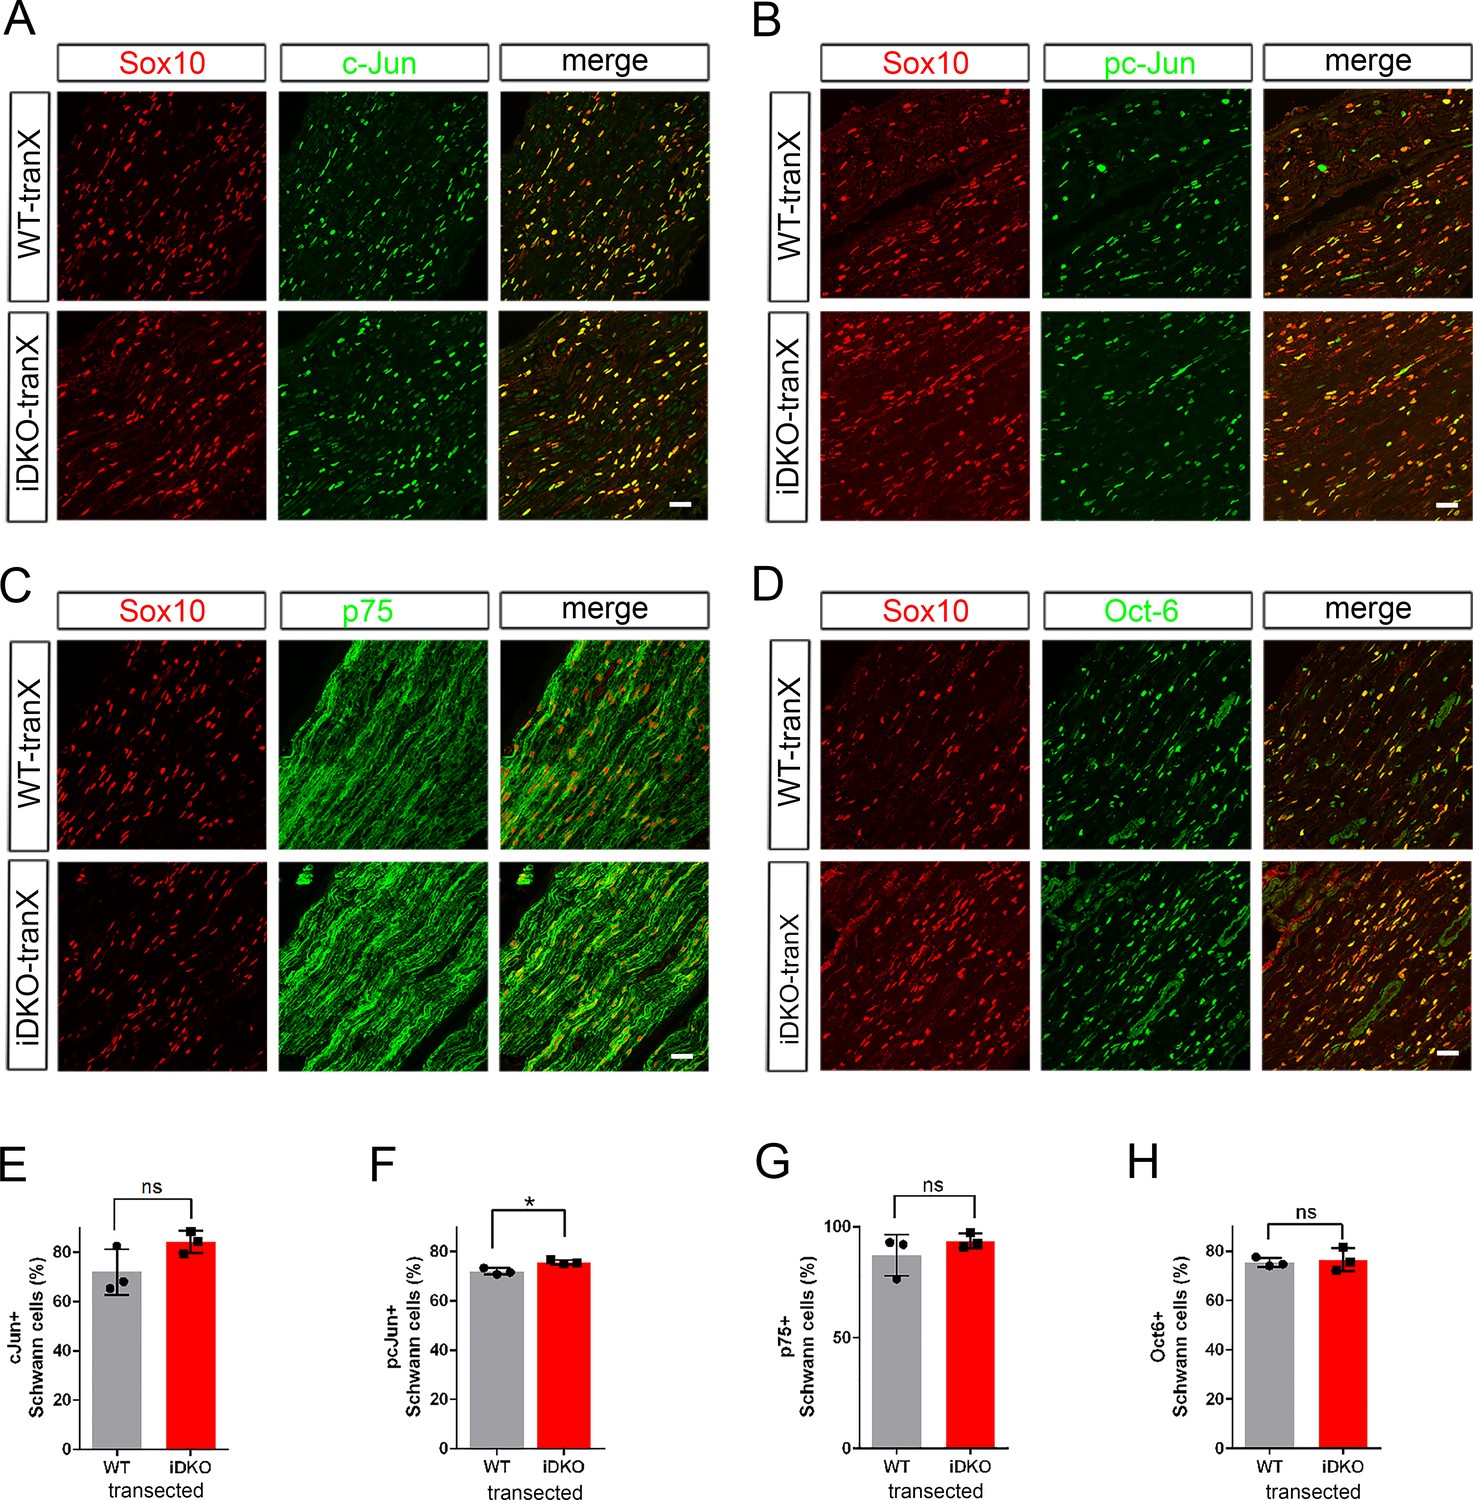
Schwann cells lacking YAP/TAZ transdifferentiate into repair Schwann cells.
Longitudinal sections of transected sciatic nerves of WT and Yap/Taz iDKO immunostained by various markers of growth-promoting repair SCs at five dpi. SCs are marked by Sox10 (red). (A) Representative sections showing upregulation of c-Jun in iDKO SCs, as in WT SCs. (B) Upregulation of active phospho-S63 c-Jun in iDKO SCs, as in WT. (C) Upregulation of p75 in iDKO SCs, as in WT SCs. (D) Upregulation of Oct-6 in iDKO SCs, as in WT SCs. (E) Quantification of c-Jun+ SCs in WT and iDKO. n = 3 mice per genotype. ns, not significant, p=0.1266, Mann-Whitney. (F) Quantification of pc-Jun+ SCs in WT and iDKO. n = 3 mice per genotype. *p=0.0495, Mann-Whitney. (G) Quantification of p75+ SCs in WT and iDKO. n = 3 mice per genotype. ns, not significant, p=0.5127, Mann-Whitney. (H) Quantification of Oct-6+ SCs in WT and iDKO. n = 3 mice per genotype. ns, not significant, p=0.8273, Mann-Whitney. Scale bars = 30 μm (A–D).
-
Figure 4—source data 1
Source files for c-Jun+ SC data.
This zip archive contains the IHC for one WT and one iDKO used for quantitative analysis shown in Figure 4E. Leica SP8 confocal lif images were processed using Imaris software and saved as tiffs.
- https://cdn.elifesciences.org/articles/50138/elife-50138-fig4-data1-v2.zip
-
Figure 4—source data 2
Source files for graphs quantifying c-Jun+ SCs, pc-Jun+ SCs, p75+ SCs, and Oct6+ SCs.
This zip archive contains the raw data for WT and iDKO used for the quantitative analysis shown in Figure 4E, F, G and H. The data are contained in both a text document and an Excel file, both labeled as Mann Whitney data. These files also contain data for Figure 3—figure supplement 1, Figures 5, 6, 7, 8 and Figure 8—figure supplement 1E.
- https://cdn.elifesciences.org/articles/50138/elife-50138-fig4-data2-v2.zip
-
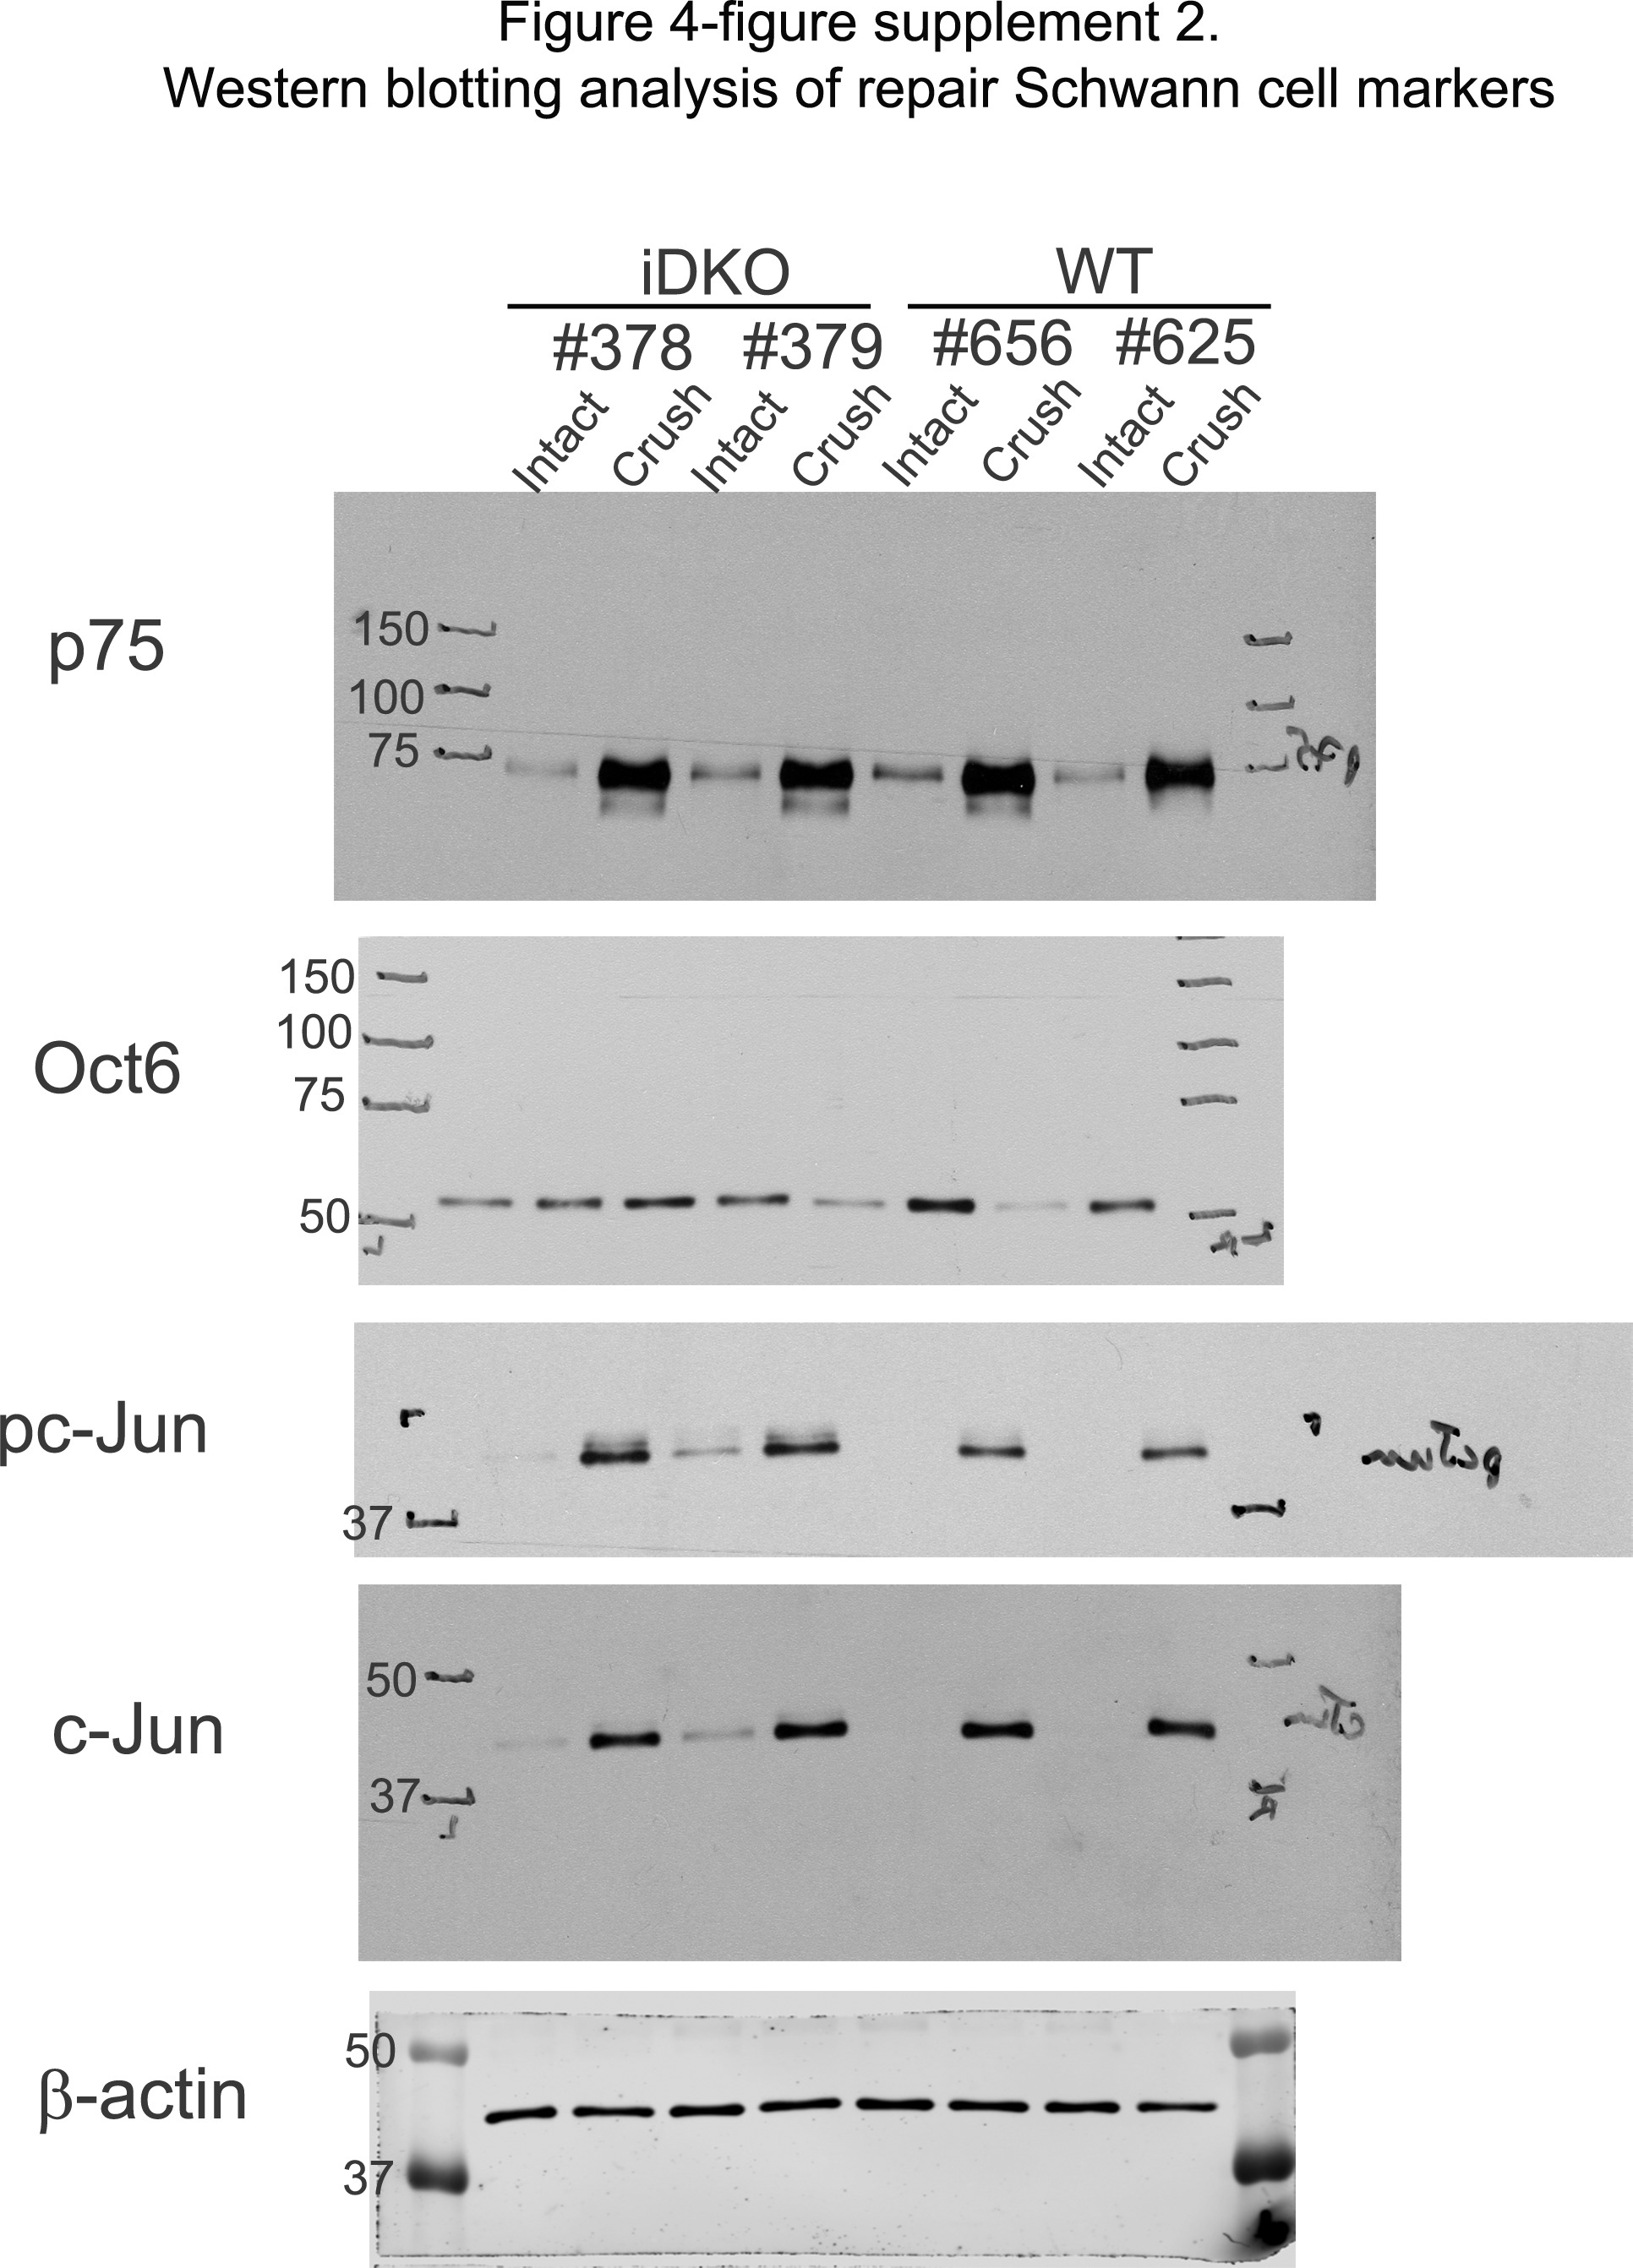
Figure 4—source data 3
Western blotting analysis of repair Schwann cell markers.
Uncropped Western blots of images used to make Figure 4—figure supplement 1. Individually processed samples from 2 WT (#656, #625) and 2 iDKO mice (#378, #379) are shown and used for quantification. The following figure supplements are available for Figure 4.
- https://cdn.elifesciences.org/articles/50138/elife-50138-fig4-data3-v2.jpg
Figure 4—figure supplement 1

Western blotting analysis of repair Schwann cell markers.
(A) Western blots of lysates prepared from contralateral (intact) or distal crushed sciatic nerves of WT and iDKO adult mice five dpi. c-Jun, active pS63-c-Jun and p75 are strongly upregulated in iDKO, as in WT. Oct6 is strongly upregulated in WT and remains elevated before and after crush in iDKO. (B) Quantification of Western blots. ns = not significant, 2-way ANOVA. c-Jun: WT intact vs WT crushed, **p=0.0035; WT intact vs iDKO intact, p=0.9388; WT crushed vs iDKO, p>0.9999; iDKO intact vs iDKO crushed, **p=0.0045. pc-Jun: WT intact vs WT crushed, ***p=0.0009; WT intact vs iDKO intact, p=0.6737; WT crushed vs iDKO crushed, p=0.9962; iDKO intact vs iDKO crushed, **p=0.0015. p75: WT intact vs WT crushed, *p=0.0112; WT intact vs iDKO intact, p=0.9993; WT crushed vs iDKO crushed, p=0.5521; iDKO intact vs iDKO crushed, **p=0.0056. Oct6: WT intact vs WT crushed, *p=0.0139; WT intact vs iDKO intact, *p=0.0157; WT crushed vs iDKO crushed, p=0.2109; iDKO intact vs iDKO crushed, p=0.2541.
-
Figure 4—figure supplement 1—source data 1
Source files for graphs quantifying c-Jun, pc-Jun, p75 and Oct6 Westerns.
This zip archive contains the raw data for WT and iDKO used for the quantitative analysis shown in Figure 4—figure supplement 1. Data are in GraphPad Prism files, as indicated.
- https://cdn.elifesciences.org/articles/50138/elife-50138-fig4-figsupp1-data1-v2.zip
Figure 5
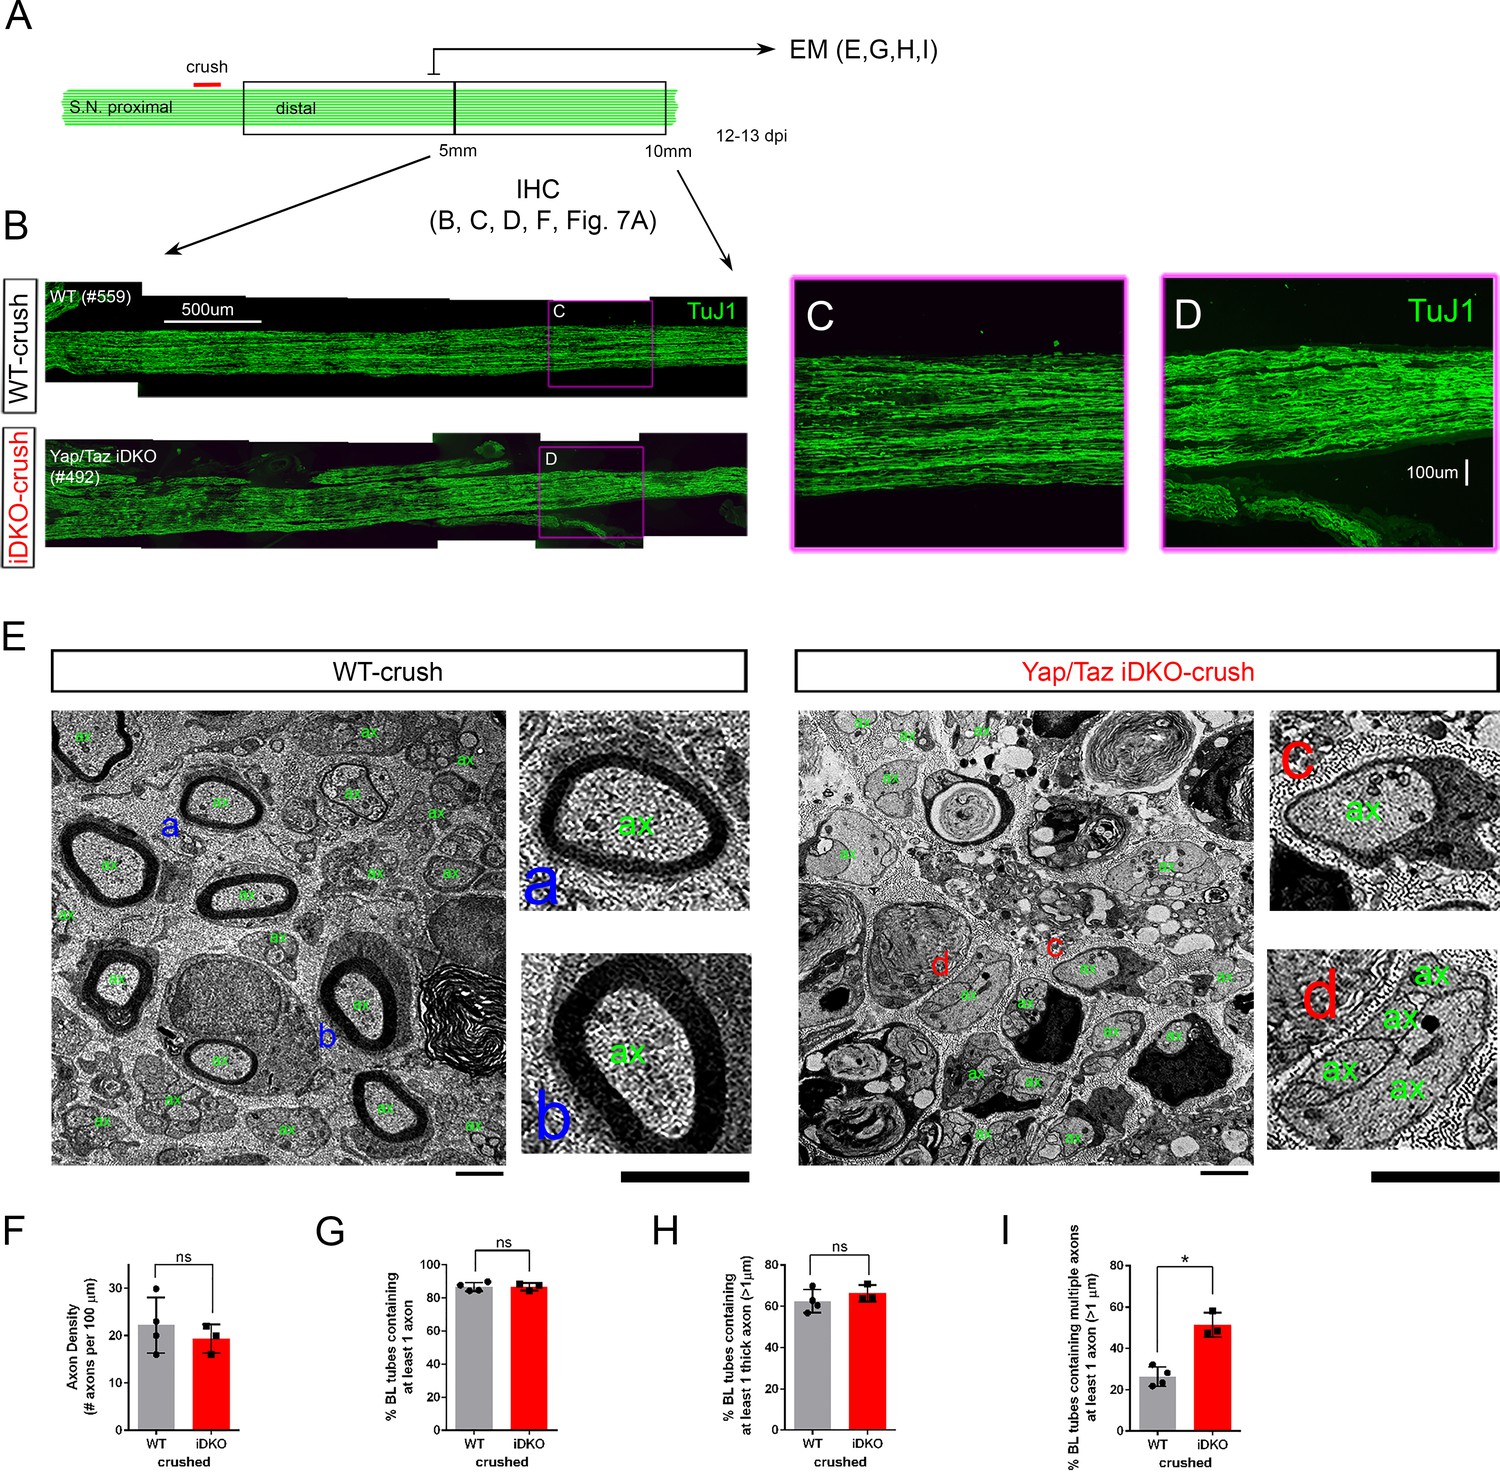
Schwann cells lacking YAP/TAZ support axon regeneration.
(A) Schematic showing relative locations and sizes of the distal nerve segments used for ultrastructural or light microscopic analysis of axon regeneration in WT or Yap/Taz iDKO, 12–13 days after nerve crush. (B) Low magnification views of longitudinal sections of ~5 mm long nerve segments distal to the crush site, showing regenerated axons in iDKO as abundant as in WT. Axons are marked by TuJ1. (C, D) High magnification views of boxed area in (B), ~8 mm distal to the crush site. (E) Low and high magnification views of TEM, taken at 5 mm distal to the crush site, showing numerous axons that regenerated within basal lamina tubes in iDKO, as in WT. ‘ax’ denotes an axon. Numerous axons are large (>1 μm) but unmyelinated in iDKO. Examples of single large myelinated axons in WT (E–a, E–b), single large unmyelinated axon in iDKO (E–c) and axon bundles containing a large unmyelinated axon in iDKO (E–d). (F) Quantification of the axon density in crushed nerves of WT and iDKO, n = 4 mice for WT and three mice for iDKO. ns, not significant, p=0.4715, Mann-Whitney. (G) Quantification of the percentage of BL tubes containing axons in crushed nerves of WT and iDKO, n = 4 mice for WT and three mice for iDKO. ns, not significant, p=0.7237, Mann-Whitney (H) Quantification of the percentage of BL tubes containing at least one axon >1 μm in diameter, in crushed nerves of WT and iDKO. n = 4 mice for WT and three mice for iDKO. ns, not significant, p=0.1573, Mann-Whitney. (I) Quantification of the percentage of BL tubes containing multiple axons, at least one of which is >1 μm in diameter, in crushed nerves of WT and iDKO. n = 4 mice for WT and three mice for iDKO. *p=0.0339, Mann-Whitney. Scale bars = 500 μm (B), 100 μm (C, D), 2 μm (E).
-
Figure 5—source data 1
Source files for TEM data.
This zip archive contains the TEM images for one WT and one iDKO used for quantitative analysis shown in Figure 5G–I. Images were taken using a JEOL 1010 electron microscope fitted with a Hamamatsu digital camera and AMT Advantage image capture software. Contrast of the images was adjusted using Photoshop software. The images in this archive were also used for the analysis in Figure 7.
- https://cdn.elifesciences.org/articles/50138/elife-50138-fig5-data1-v2.zip
-
Figure 5—source data 2
Source files for graphs quantifying TEM data.
This zip archive contains the raw data for WT and iDKO used for the quantitative analysis shown in Figure 5F, G, H and I. The data are contained in both a text document and an Excel file, both labeled as Mann Whitney data. These files also contain data for Figure 3—figure supplement 1, Figures 3, 4, 6, 7, 8A, Figure 8—figure supplement 1A.
- https://cdn.elifesciences.org/articles/50138/elife-50138-fig5-data2-v2.zip
Figure 6
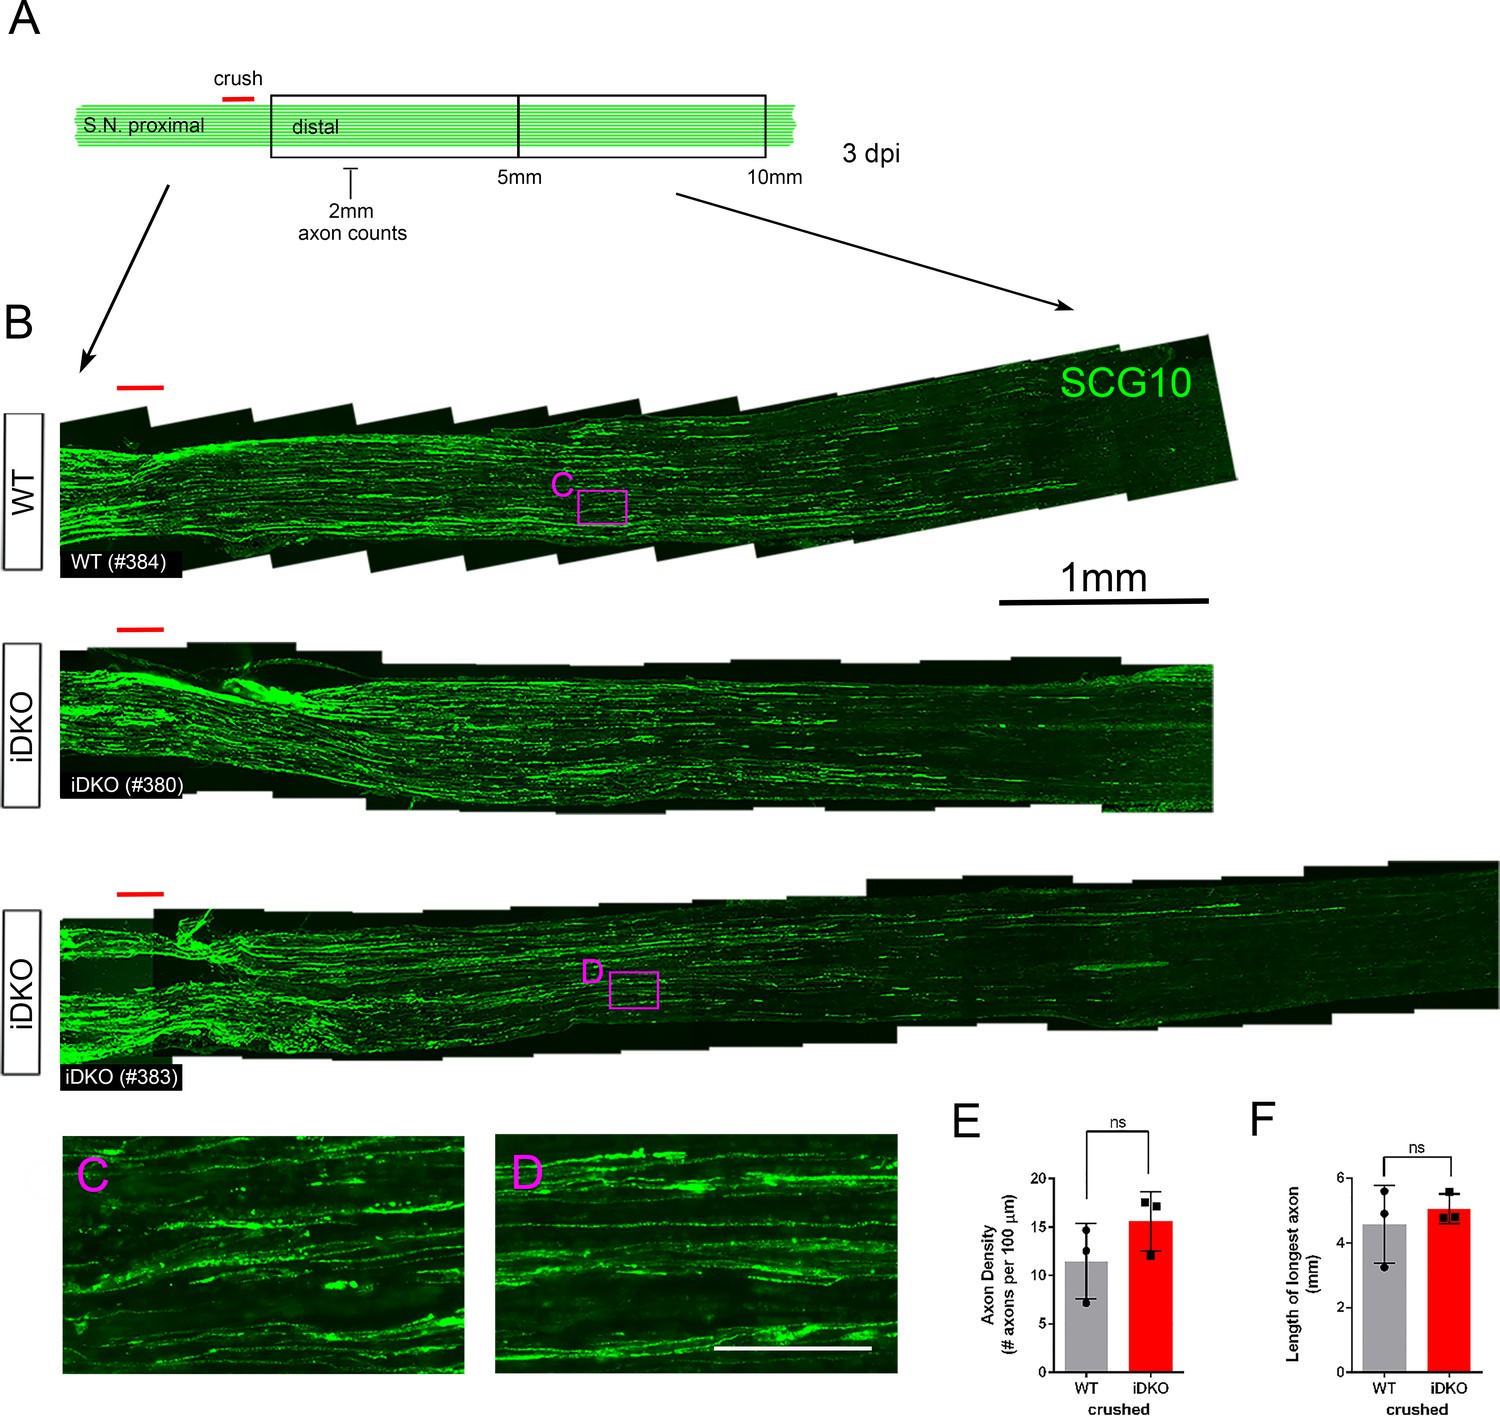
Schwann cells lacking YAP/TAZ support timely axon regeneration after acute injury.
(A) Schematic showing relative locations of crushed site, axon quantification and sizes of the distal nerve segments used for light microscopic analysis of axon regeneration in WT or Yap/Taz iDKO, 3 days after nerve crush. (B) Low magnification views of longitudinal sections, showing abundant axon regeneration in both WT and iDKO. Regenerating axons are marked by SCG10. (C, D) High magnification views of boxed areas in (B), showing numerous thin regenerating axons. (E) Quantification of the axon density measured at 2 mm distal to the crushed site. n = 3 mice per genotype. ns, not significant, p=0.2752, Mann-Whitney. (F) Quantification of the distance regenerated by the longest axon. n = 3 mice per genotype. ns, not significant, p=0.8273, Mann-Whitney. Scale bars = 1 mm (B), 100 μm (C, D).
-
Figure 6—source data 1
Source files for graphs quantifying axon density and length of longest axon.
This zip archive contains the raw data for WT and iDKO used for the quantitative analysis shown in Figure 6E and F. The data are contained in both a text document and an Excel file, both labeled as Mann Whitney data. These files also contain data for Figure 3—figure supplement 1, Figures 3, 4, 5, 7, 8A, Figure 8—figure supplement 1E.
- https://cdn.elifesciences.org/articles/50138/elife-50138-fig6-data1-v2.zip
Figure 7 with 1 supplement
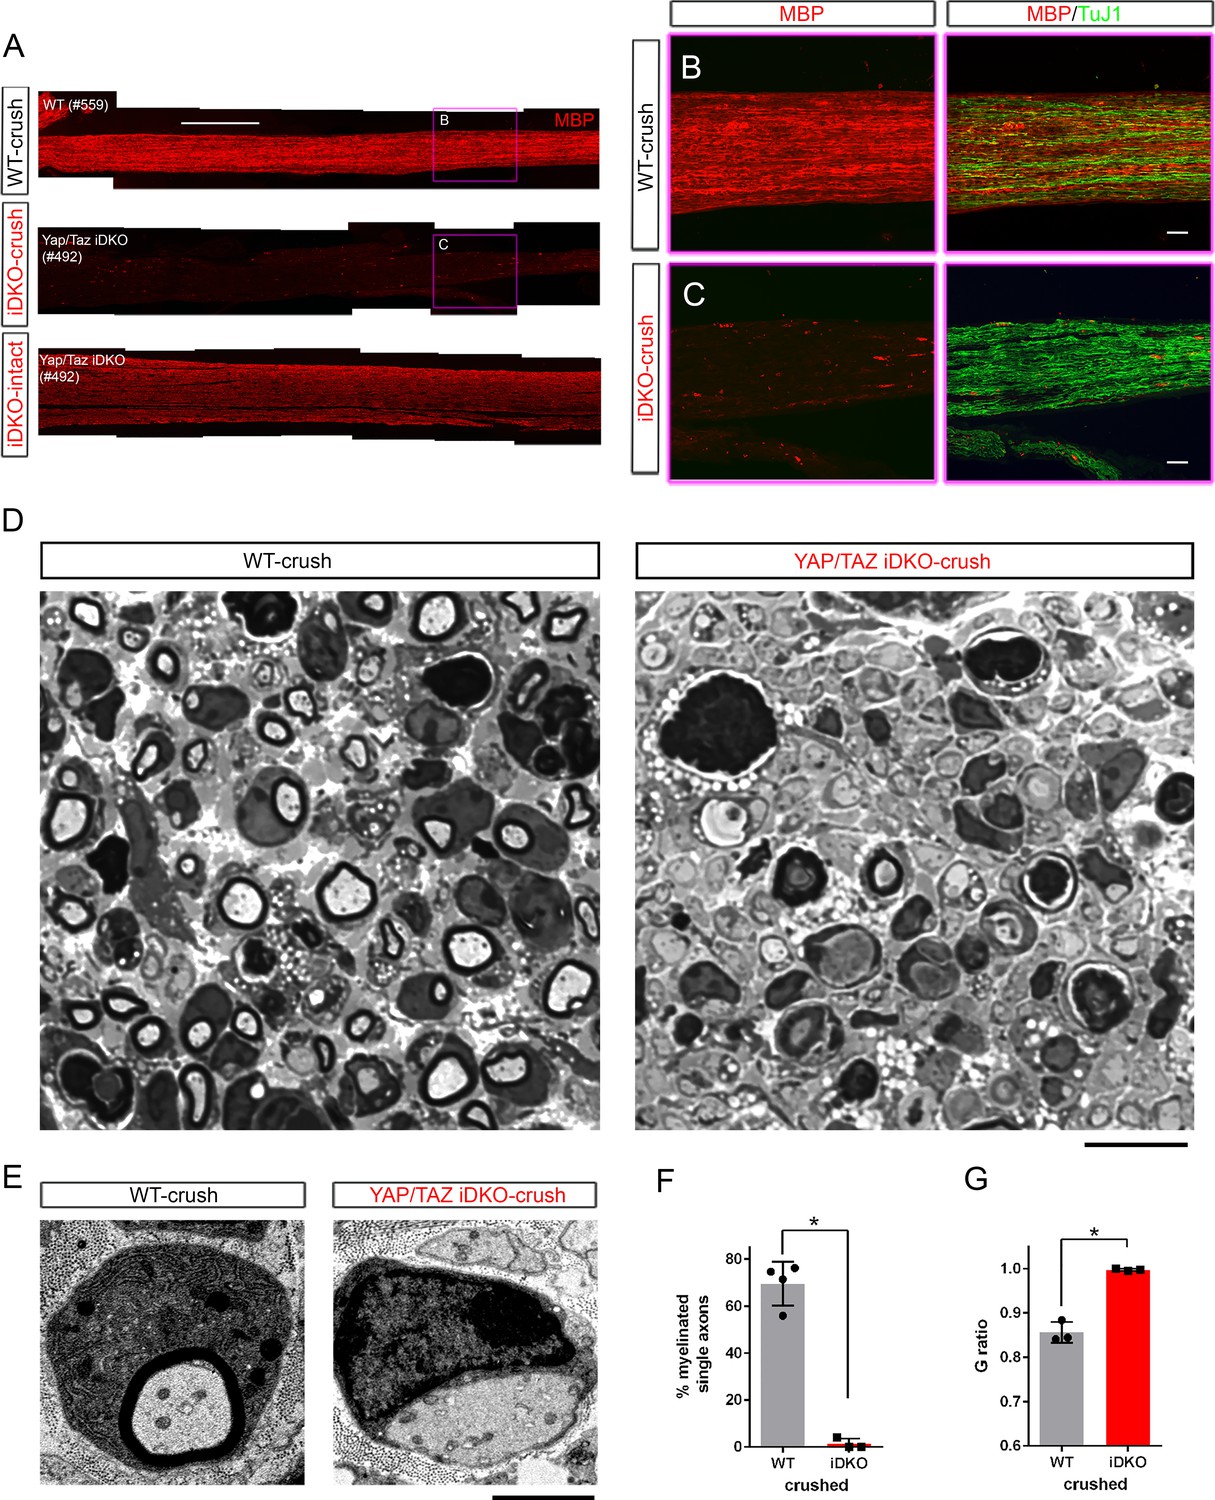
Schwann cells lacking YAP/TAZ fail to myelinate regenerated axons.
Ultrastructural and light microscopic analyses of remyelination in distal nerves of WT or Yap/Taz iDKO, 12–13 days after nerve crush. (A) Low magnification views of longitudinal sections of intact or crushed nerves of WT and iDKO, showing no myelination of regenerated axons in crushed nerves of iDKO as indicated by the lack of MBP immunostaining. Refer to Figure 5B for robustly regenerated axons in the same iDKO mouse. (B, C) High magnification views of boxed area in (A), showing abundant regenerated axons in crushed nerves of both WT (B) and iDKO (C). Note that regenerated axons in iDKO are not myelinated. Axons and myelin are marked by TuJ1 and MBP, respectively. (D) Semi-thin sections stained with toluidine blue showing numerous myelinated axons in crushed nerves of WT but not in iDKO. (E) TEM images of representative single large axons, myelinated in WT (left panel) but unmyelinated in iDKO (right panel). (F) Quantification of the percentage of single axons that are myelinated. n = 4 mice for WT and three mice for iDKO. *p=0.0323, Mann-Whitney. (G) G-ratio in WT and iDKO. Myelinated axons in WT are compared to unmyelinated single axons in iDKO. n = 3 mice per genotype. *p=0.0495 Mann-Whitney. Scale bars = 500 μm (A), 100 μm (B, C), 10 μm (D), 2 μm (E).
-
Figure 7—source data 1
Source files for TEM data.
This zip archive contains the TEM images for one WT and one iDKO used for quantitative analysis shown in Figure 7F and G. Images were taken using a JEOL 1010 electron microscope fitted with a Hamamatsu digital camera and AMT Advantage image capture software. Contrast of the images was adjusted using Photoshop software. The images in this archive were also used for the analysis in Figure 5.
- https://cdn.elifesciences.org/articles/50138/elife-50138-fig7-data1-v2.zip
-
Figure 7—source data 2
Source files for graphs quantifying TEM data.
This zip archive contains the raw data for WT and iDKO used for the quantitative analysis shown in Figure 7F and G. The data are contained in both a text document and an Excel file, both labeled as Mann Whitney data. These files also contain data for Figure 3—figure supplement 1, Figures 3, 4, 5, 6, 8A, Figure 8—figure supplement 1E.
- https://cdn.elifesciences.org/articles/50138/elife-50138-fig7-data2-v2.zip
Figure 7—figure supplement 1
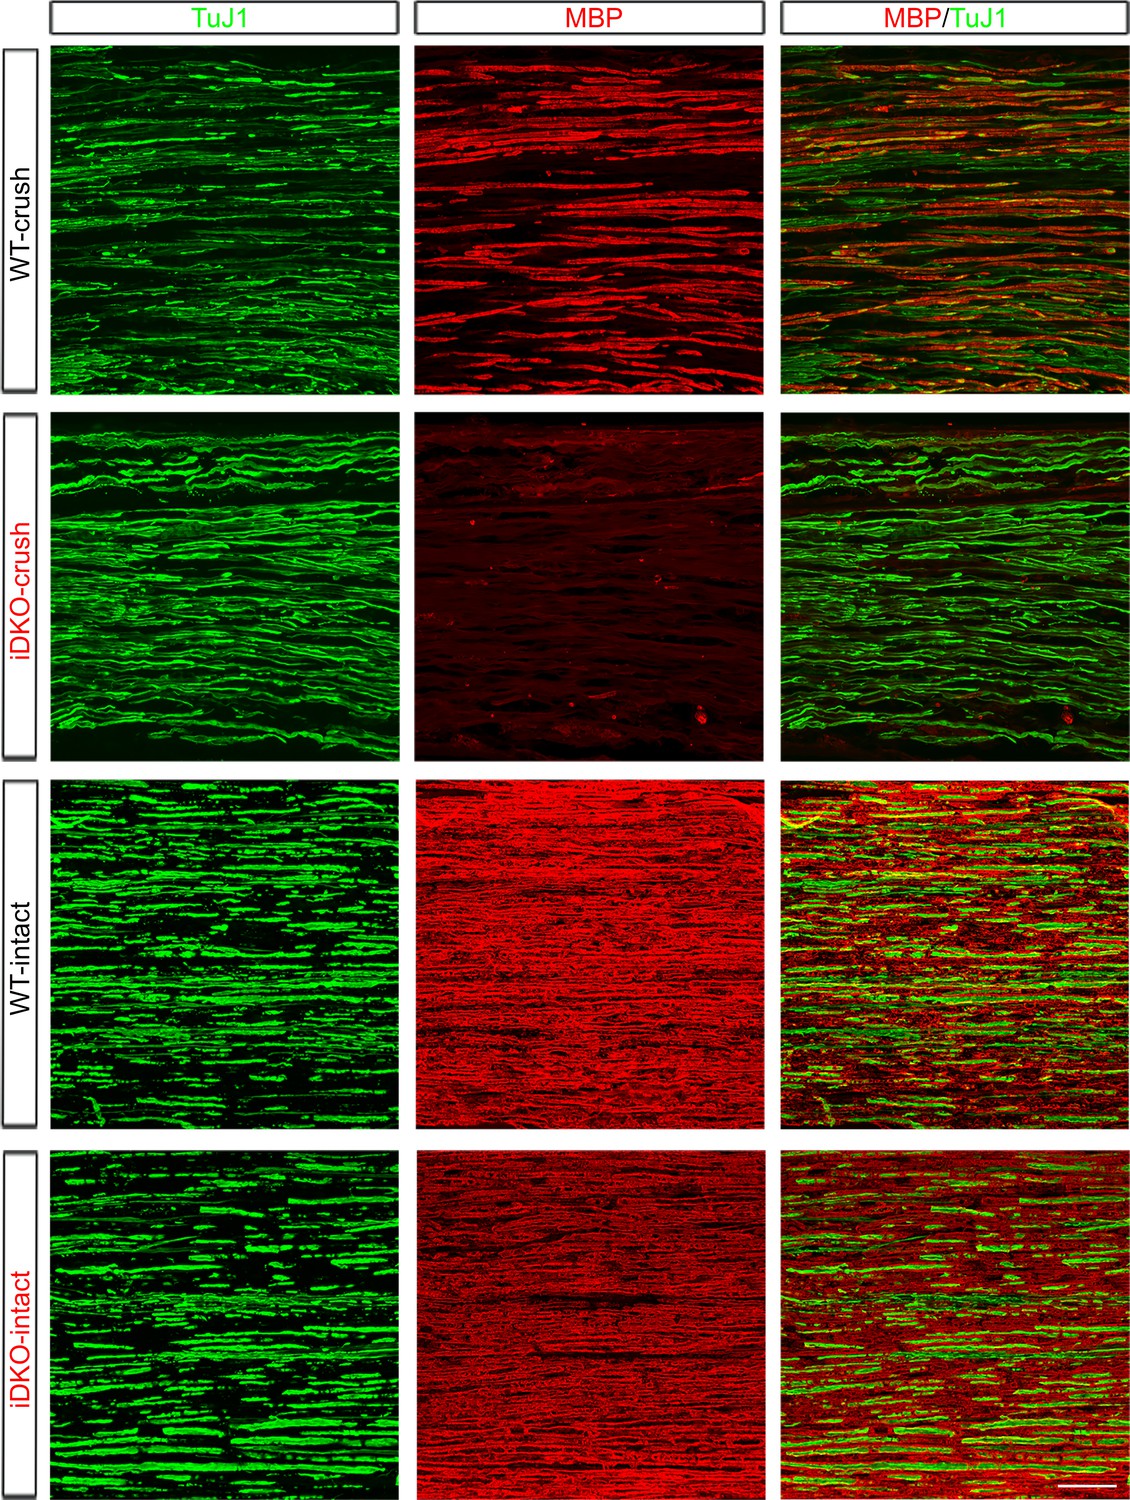
Additional images of axon regeneration and remyelination in WT and Yap/Taz iDKO.
High magnification views of longitudinal sections of intact or crushed nerves of WT and iDKO, 12–13 days after nerve crush. Axons and myelin are marked by TuJ1 (green) and MBP (red), respectively. Numerous axons regenerated in crushed nerves of iDKO, as in WT, but they are unmyelinated. Myelin remains ample, as indicated by abundant MBP, in contralateral intact nerves of iDKO at 12–13 dpi. Scale bar = 50 μm.
Figure 8 with 1 supplement
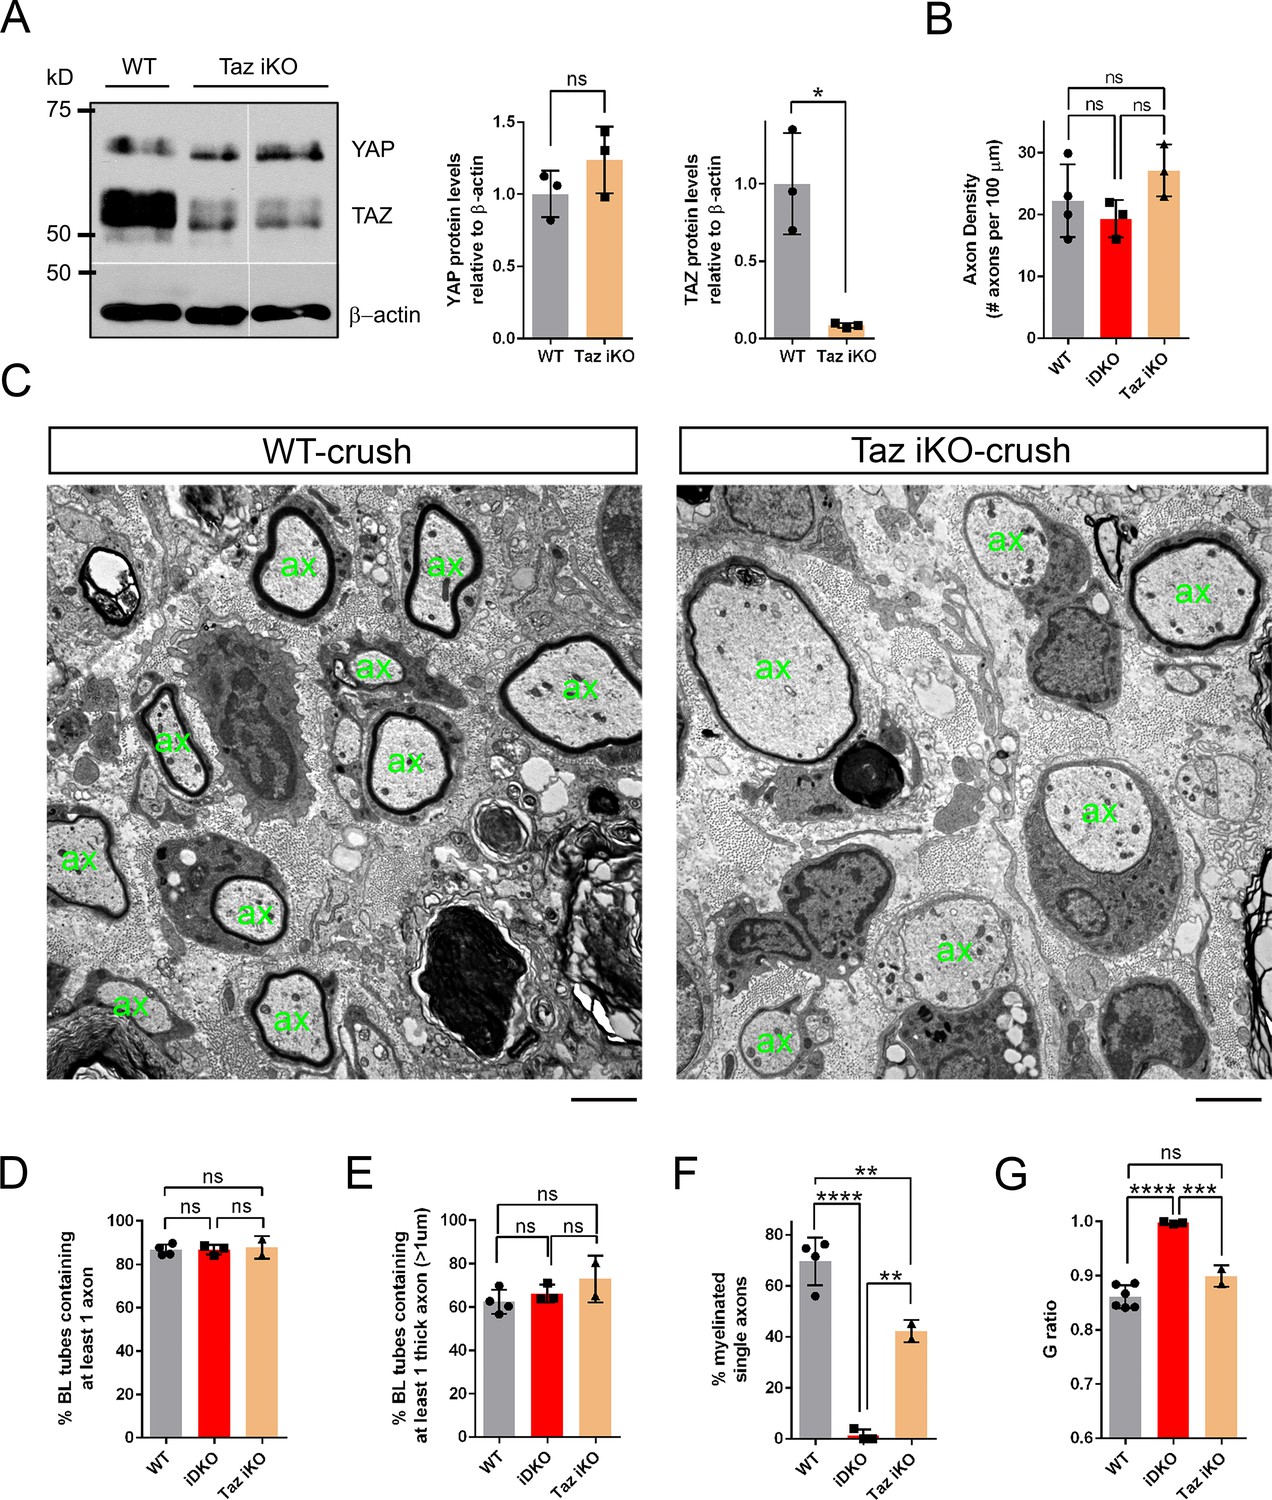
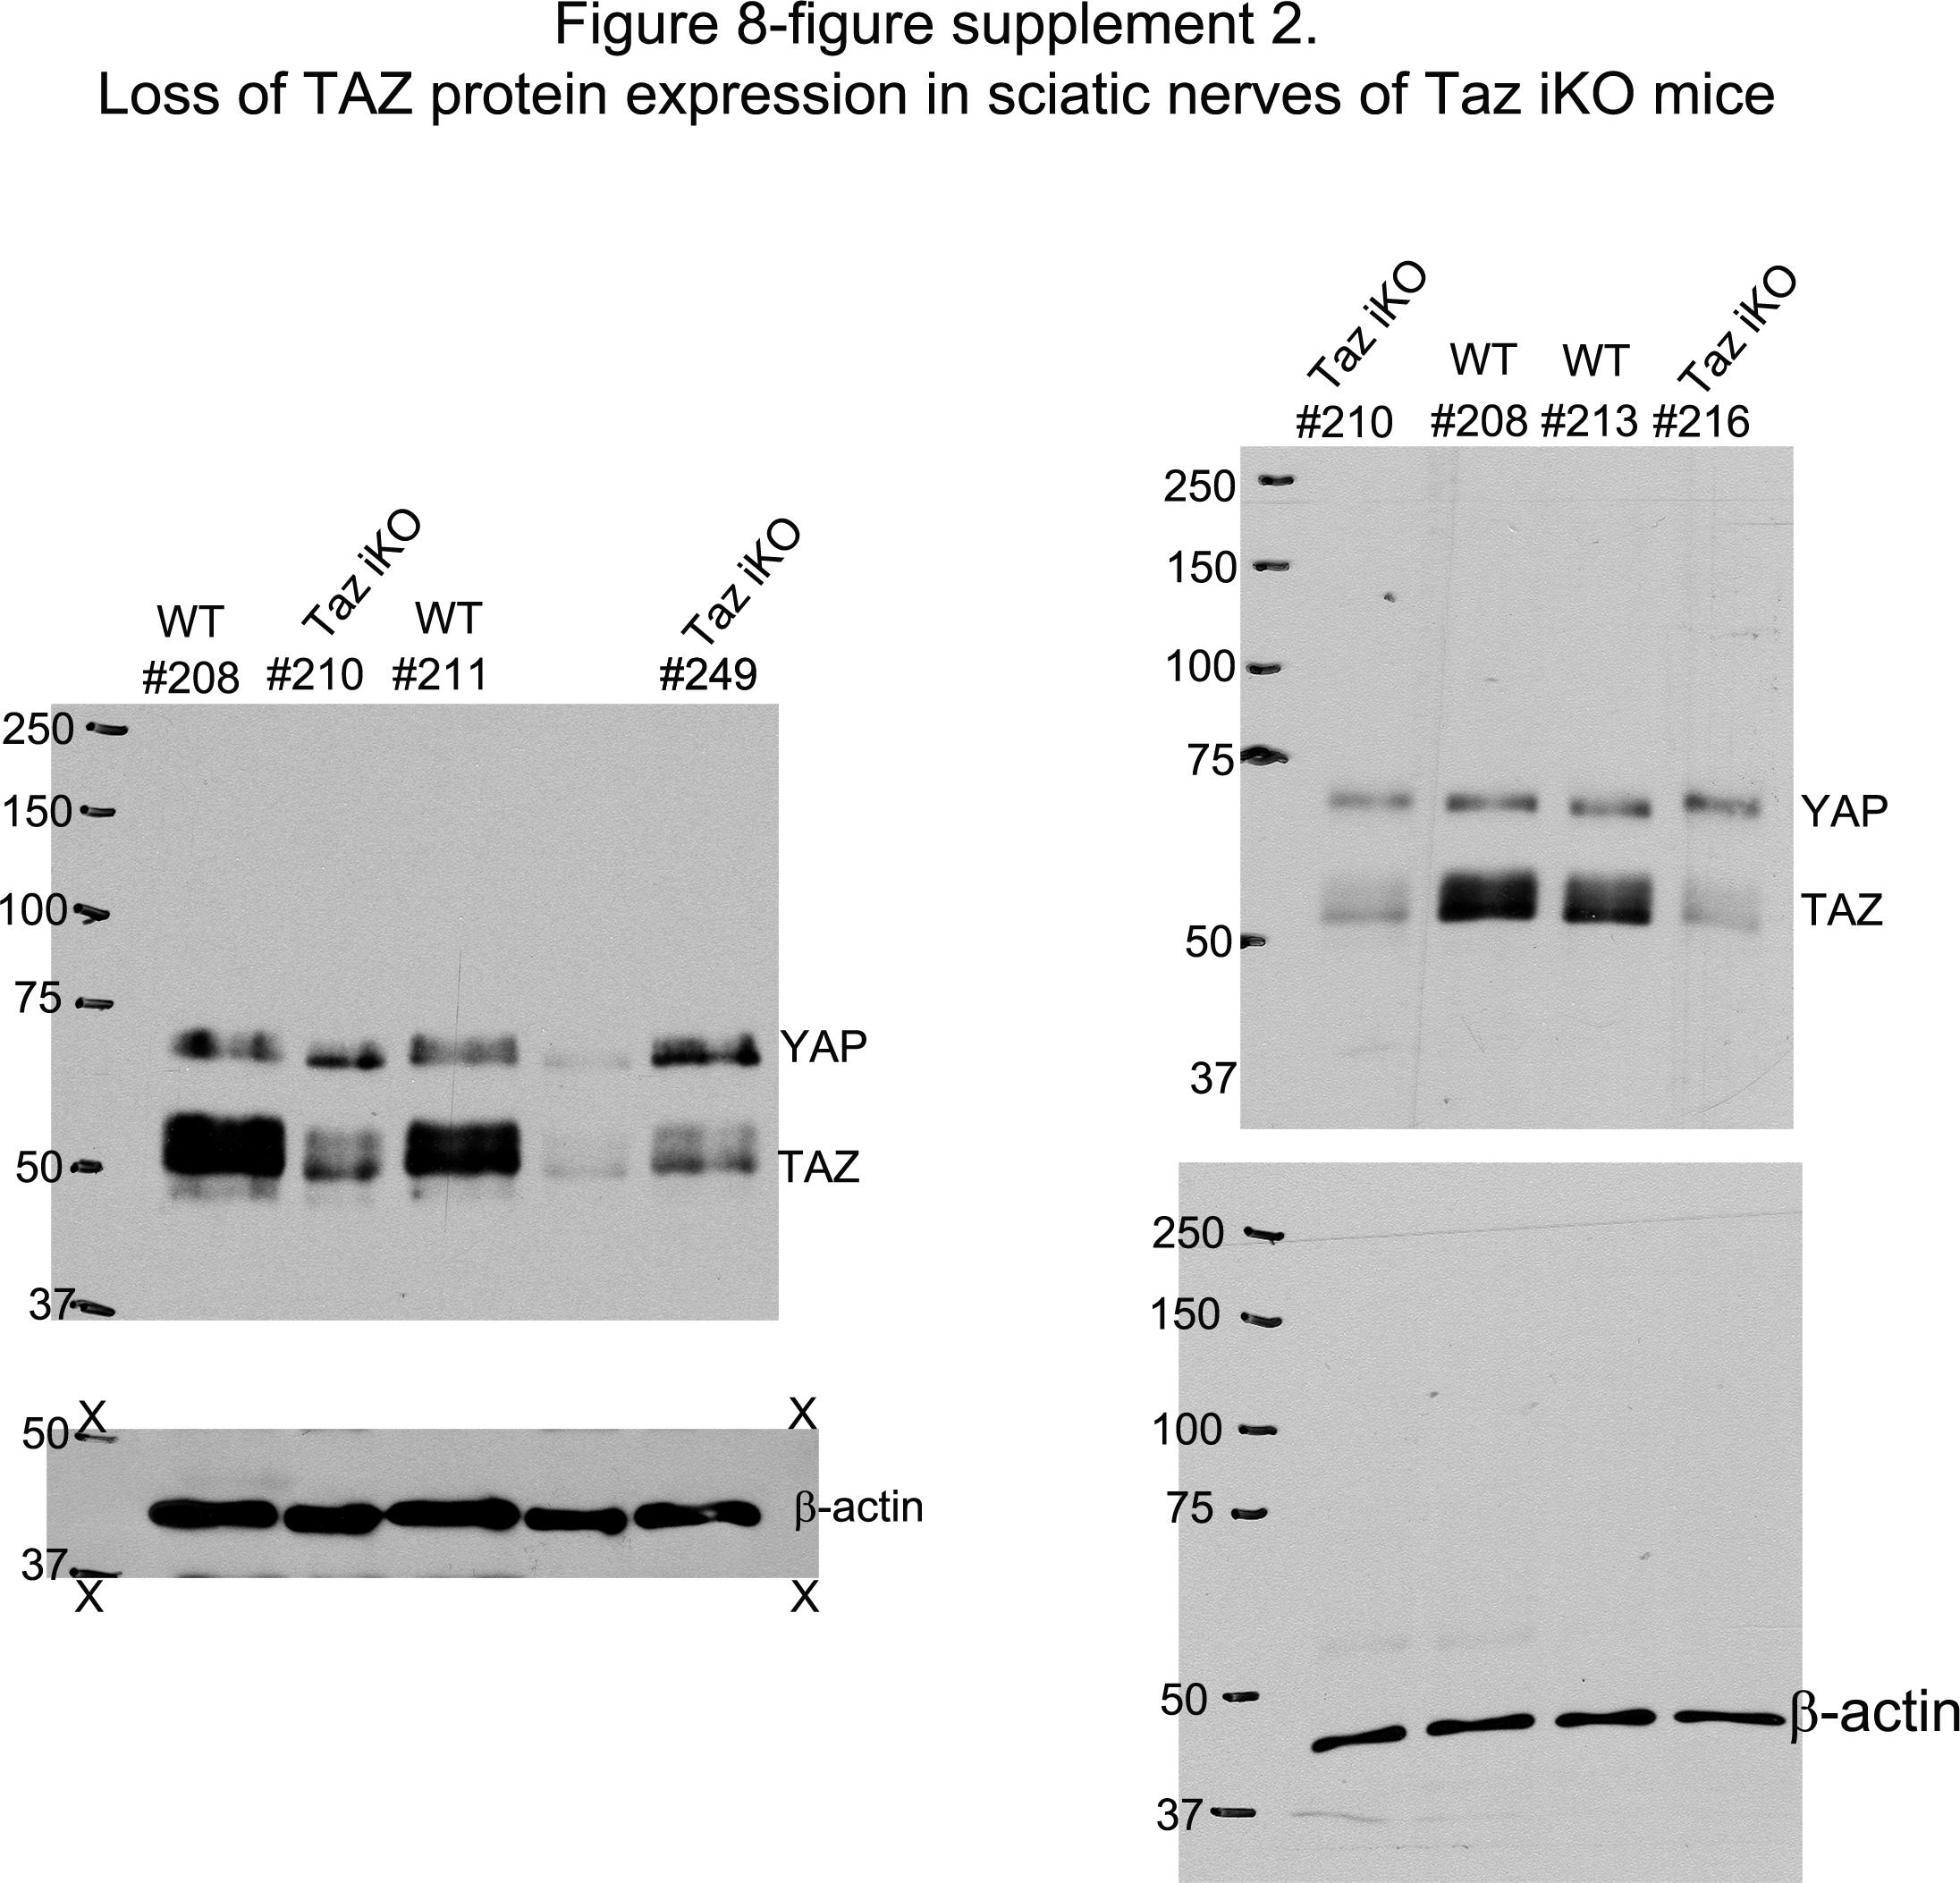
YAP and TAZ are redundantly required for optimal remyelination.
(A) Western blotting of intact sciatic nerve lysates, showing markedly reduced TAZ in Taz iKO, whereas YAP levels remain relatively unchanged. YAP band is tighter and faster migrating in Taz iKO, than in WT, indicative of reduced phosphorylation. Quantification of Yap and Taz in WT and Taz iKO, n = 3 mice per genotype. YAP: ns, not significant, p=0.2752, Mann-Whitney. TAZ: *p=0.0495, Mann-Whitney. (B) Quantification of axon density in WT, Yap/Taz iDKO and Taz iKO nerves at 12 dpi, 8–10 mm distal to crush site (also see Figure 5B,F and Figure 8—figure supplement 1B, (E). n = 4 mice for WT, three mice for iDKO and Taz iKO: WT vs iDKO, p=0.72; WT vs iKO, p=0.41; iDKO vs iKO, p=0.18, all not significant, one-way ANOVA with Tukey’s multiple comparison test. (C–G) Comparative analysis of axon regeneration and remyelination in WT and Taz iKO, 12–13 days after nerve crush. (C) Representative TEM images of WT and Taz iKO nerves, taken at 5 mm distal to the crush site, showing numerous axons that regenerated within basal lamina tubes in Taz iKO, as in WT. ‘ax’ denotes a single axon. Some large axons are myelinated in Taz iKO. (D) Quantification of the percentage of BL tubes containing axons of any diameter in WT, Taz iKO and Yap/Taz iDKO nerves. n = 4 mice for WT, three mice for iDKO and two mice for Taz iKO: WT vs. iDKO, p=0.99; WT vs. iKO, p=0.90; iDKO vs. Taz iKO, p=0.92, all not significant, one-way ANOVA with Tukey’s multiple comparison test. (E) Quantification of the percentage of BL tubes containing at least one axon larger than 1 μm in diameter in WT, Taz iKO and Yap/Taz iDKO nerves. n = 4 mice for WT, three mice for iDKO and two mice for Taz iKO: WT vs. iDKO, p=0.73; WT vs. iKO, p=0.22; iDKO vs. iKO, p=0.52, all not significant, one-way ANOVA with Tukey’s multiple comparison test. (F) Quantification of the percentage of single axons that are remyelinated in WT, Taz iKO and Yap/Taz iDKO nerves. n = 4 mice for WT, three mice for iDKO and two mice for Taz iKO: WT vs. iDKO, ****p<0.0001; WT vs. iKO, **p=0.0094; iDKO vs. Taz iKO, **p=0.0016, one-way ANOVA with Tukey’s multiple comparison test. (G) G-ratios of remyelinated axons in WT and Taz iKO nerves, compared to unmyelinated axons in Yap/Taz iDKO nerve. WT and Taz iKO remyelinated axons have equivalent G-ratios. n = 6 mice for WT, three mice for iDKO and two mice for iKO: WT vs. iDKO, ****p<0.0001; WT vs. iKO, not significant, p=0.074; iDKO vs. iKO, ***p=0.0008, one-way ANOVA with Tukey’s multiple comparison test. Scale bar = 2 μm (C).
-
Figure 8—source data 1
Source files for TEM data.
This zip archive contains the TEM images for one WT and one Taz iKO used for quantitative analysis shown in Figure 8D–G. Images were taken using a JEOL 1010 electron microscope fitted with a Hamamatsu digital camera and AMT Advantage image capture software. Contrast of the images was adjusted using Photoshop software.
- https://cdn.elifesciences.org/articles/50138/elife-50138-fig8-data1-v2.zip
-
Figure 8—source data 2
Source files for graphs quantifying Yap and Taz levels.
This zip archive contains the raw data for WT and iDKO used for the quantitative analysis shown in Figure 8A. The data are contained in both a text document and an Excel file, both labeled as Mann Whitney data. These files also contain data for Figure 3—figure supplement 1, Figures 3, 4, 6, 7, 8, Figure 8—figure supplement 1E.
- https://cdn.elifesciences.org/articles/50138/elife-50138-fig8-data2-v2.zip
-
Figure 8—source data 3
Source files for graphs quantifying axon density and TEM data.
This zip archive contains the raw data for WT, iDKO and Taz iKO used for the quantitative analysis shown in Figure 8B, D, E, F and G. The data are contained in GraphPad Prism files, as indicated.
- https://cdn.elifesciences.org/articles/50138/elife-50138-fig8-data3-v2.zip
-
Figure 8—source data 4
Loss of TAZ protein expression in sciatic nerves of Taz iKO mice.
Uncropped Western blots of images used to make Figure 8A. Individually processed samples from 3 WT mice (#208,#211,#213) and 3 Taz iKO mice (#210,#216,#249) are shown and used for quantification. X…….X denotes the line along which membranes were cut prior to probing with the relevant antibodies. The following figure supplements are available for Figure 8.
- https://cdn.elifesciences.org/articles/50138/elife-50138-fig8-data4-v2.jpg
Figure 8—figure supplement 1
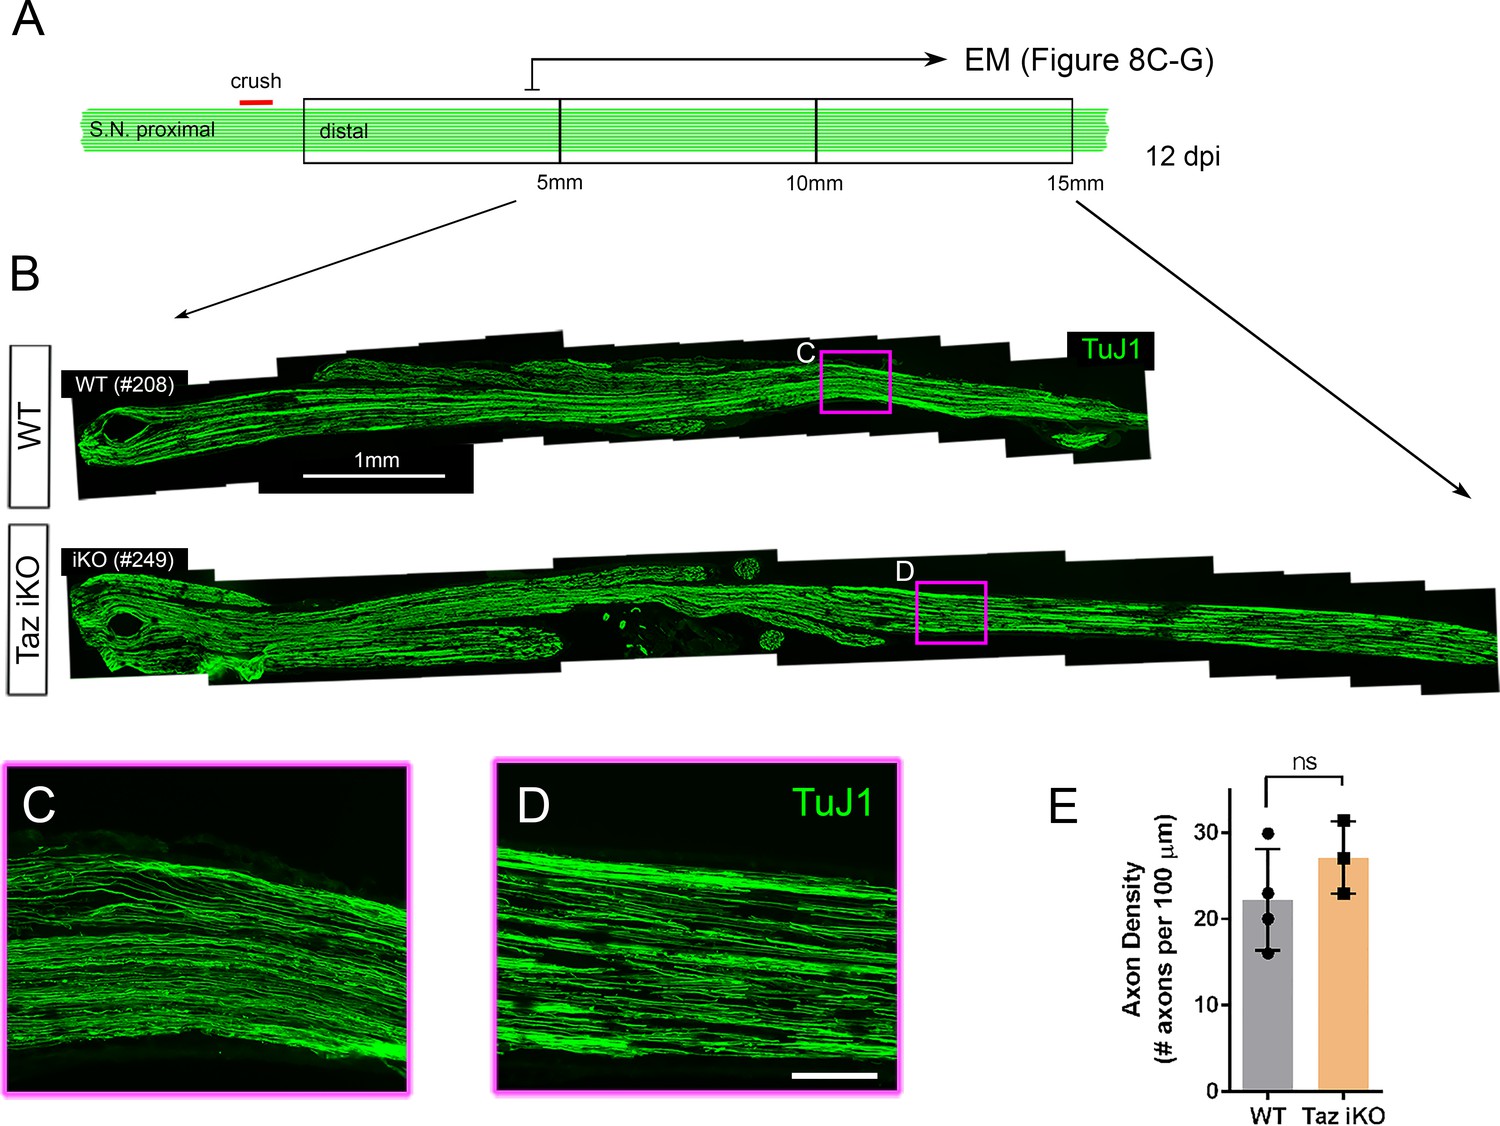
Schwann cells expressing YAP (but lacking TAZ) support axon regeneration.
(A) Schematic showing relative locations and sizes of the distal nerve segments used for light microscopic and TEM analysis of axon regeneration in WT or Taz iDKO, 12 days after nerve crush. (B) Low magnification views of longitudinal nerve sections beginning 5 mm distal to the crush site, showing regenerated axons in iKO as abundant as in WT. Axons are marked by TuJ1. (C, D) High magnification views of boxed areas in (B). Scale bars = 1 mm (B) and 100 μm (C, D). (E) Quantification of axon density measured at ~10 mm distal to the crush site. n = 3 mice per genotype. ns, not significant, p=0.2118, Mann-Whitney.
-
Figure 8—figure supplement 1—source data 1
Source files for graph quantifying axon density.
This zip archive contains the raw data for WT and Taz iKO used for the quantitative analysis shown in Figure 8—figure supplement 1E. The data are contained in both a text document and an Excel file, both labeled as Mann Whitney data. These files also contain data for Figure 3—figure supplement 1, Figures 3, 4, 6, 7, 8.
- https://cdn.elifesciences.org/articles/50138/elife-50138-fig8-figsupp1-data1-v2.zip
Figure 9

Redifferentiation of Schwann cells lacking YAP/TAZ.
Longitudinal sections of crushed nerves of WT and Yap/Taz iDKO at 12 dpi, immunostained by various markers of SC dedifferentiation (c-Jun and Oct-6), proliferation (Ki67) and redifferentiation (Krox20). SCs are marked by Sox10. (A) Representative sections showing c-Jun+ SCs markedly reduced in iDKO, as in WT. (B) Representative sections showing rarely observed Ki67+ proliferating SCs in iDKO, as in WT. (C) Representative sections showing Oct-6+ SCs reduced in iDKO, as in WT. (D) Representative sections showing failed upregulation of Krox20 in iDKO SCs. (E) Quantitative comparison of c-Jun+ SCs at 5 and 12 dpi, showing similar downregulation of c-Jun in WT and iDKO SC. n = 3 mice per genotype, 2-way ANOVA, ns = not significant. WT five dpi vs WT 12 dpi, **p=0.0069; WT five dpi vs iDKO five dpi, p=0.4260; WT 12 dpi vs iDKO 12 dpi, p=0.9574; iDKO five dpi vs iDKO 12 dpi, **p=0.0018. (F) Quantitative comparison of Ki67+ SCs, showing similar reduction in proliferating SCs in WT and iDKO nerves between 5 dpi and 12 dpi. n = 3 mice per genotype, 2-way ANOVA, ns = not significant. WT five dpi vs WT 12 dpi, ****p<0.0001; WT five dpi vs iDKO five dpi, p>0.9999; WT 12 dpi vs iDKO 12 dpi, p=0.6775; iDKO five dpi vs iDKO 12 dpi, ****p<0.0001. (G) Quantitative comparison of Oct-6+ SCs, showing significant downregulation of Oct-6 in WT and iDKO SCs between 5 dpi and 12 dpi. n = 3 mice per genotype, ns = not significant, 2-way ANOVA. WT five dpi vs WT 12 dpi, ***p=0.0005; WT five dpi vs iDKO five dpi, p=0.9817; WT 12 dpi vs iDKO 12 dpi, *p=0.0221; iDKO five dpi vs iDKO 12 dpi, *p=0.0299. (H) Quantitative comparison of Krox20+ SCs, showing upregulation of Krox20 in WT SCs, but not in iDKO SCs between 5 dpi and 12 dpi. n = 3 mice per genotype, 2-way ANOVA, ns = not significant. WT five dpi vs WT 12 dpi, ****p<0.0001; WT five dpi vs iDKO five dpi, p>0.9999; WT 12 dpi vs iDKO 12 dpi, ****p<0.0001; iDKO five dpi vs iDKO 12 dpi, p>0.9999. Scale bar = 10 μm (A–D).
-
Figure 9—source data 1
Source files for Krox20+ SC data.
This zip archive contains the IHC for one WT and one iDKO used for quantitative analysis shown in Figure 9E. Leica SP8 confocal lif images were processed using Imaris software and saved as tiffs.
- https://cdn.elifesciences.org/articles/50138/elife-50138-fig9-data1-v2.zip
-
Figure 9—source data 2
Source files for graphs quantifying c-Jun+ SCs, Ki67+ SCs, Oct6+ SCs and Krox20+ SCs.
This zip archive contains the raw data for WT and iDKO used for the quantitative analysis shown in Figure 9E, F, G and H. The data are contained in GraphPad Prism files, as indicated.
- https://cdn.elifesciences.org/articles/50138/elife-50138-fig9-data2-v2.zip
Tables
Key resources table
| Reagent type (species) or resource | Designation | Source or reference | Identifiers | Additional information |
|---|---|---|---|---|
| Strain, strain background (Mus musculus) | C57Bl/6 | Jackson Laboratory | Stock #: 000664; RRID:IMSR JAX:000664 | |
| Genetic reagent (M. musculus) | Plp1-Cre-ERT2 | MGI:2663093 | (Leone et al., 2003) | |
| Antibody | anti-Yap/Taz (rabbit monoclonal) | Cell Signaling Technology | D24E4, #8418 RRID:AB_10950494 | IHC 1:200 Western 1:1000 |
| Antibody | anti-SCG10 (rabbit monoclonal) | Novus Biologicals | NBP1-49461 RRID:AB_10011569 | IHC 1:5000 |
| Antibody | anti-Yap (rabbit monoclonal) | Cell Signaling Technology | D8H1X, #14074 RRID:AB_2650491 | IHC 1:200 |
| Antibody | anti-Sox10 (goat polyclonal) | R and D Systems | #AF-2864 RRID:AB_442208 | IHC 1:100 |
| Antibody | anti-Sox10 (rabbit monoclonal) | Abcam | EPR4007, #ab155279 RRID:AB_2650603 | IHC 1:250 |
| Antibody | anti-Egr2 (rabbit polyclonal) | Professor Dies Meijer, University of Edinburgh | IHC 1:4000 | |
| Antibody | anti-Oct6 (rabbit monoclonal) | Abcam | EP5421, #ab126746 RRID:AB_11130256 | WB 1:1000 |
| Antibody | anti-Oct6 (rabbit polyclonal) | Abcam | #ab31766 RRID:AB_776899 | IHC 1:800 |
| Antibody | anti-c-Jun (mouse monoclonal) | BD Transduction Laboratories | #610326 RRID:AB_397716 | IHC 1:500 |
| Antibody | anti-c-Jun (rabbit monoclonal) | Cell Signaling Technology | 60A8, #9165 RRID:AB_2130165 | WB 1:1000 |
| Antibody | anti-pS63-c-Jun (rabbit polyclonal) | Cell Signaling Technology | #9261 RRID:AB_2130162 | IHC 1:100 |
| Antibody | anti-Ki67 (rabbit polyclonal) | Abcam | #ab15580 RRID:AB_443209 | IHC 1:200 |
| Antibody | anti-p75NGFR (goat polyclonal) | Neuromics | #GT15057 RRID:AB_2737189 | IHC 1:400 |
| Antibody | anti-Tubulin β3 (rabbit polyclonal) | Biolegend | #802001 RRID:AB_2564645 | IHC 1:1000 |
| Antibody | IRDye-680 (goat anti-mouse) | LI-COR | #926–32220 RRID:AB_621840 | WB 1:15,000 |
| Antibody | HRP-Goat anti-mouse secondary antibody | Jackson Immunoresearch | #715-035-150 RRID:AB_2340770 | WB 1:12,000 |
| Antibody | HRP-Goat anti-rabbit secondary antibody | Jackson Immunoresearch | #115-055-062 RRID:AB_2338533 | WB 1:12,000 |
| Chemical compound, drug | Araldite 6005 | EMS | #10920 | |
| Chemical compound, drug | DDSA | EMS | #13710 | |
| Chemical compound, drug | DBP | EMS | #13101 | |
| Chemical compound, drug | BDMA | EMS | #11400–25 | |
| Other | Coated grids (100 mesh) | EMS | #FF100-Cu | |
| Chemical compound, drug | Osmium tetroxide (4% solution) | EMS | #19170 | |
| Chemical compound, drug | Lead nitrate | EMS | #17900 | |
| Chemical compound, drug | Sodium citrate | EMS | #21140 | |
| Chemical compound, drug | Uranyl acetate | EMS | #22400 | |
| Chemical compound, drug | Sodium borate | EMS | #21130 | |
| Chemical compound, drug | Toluidine blue | EMS | #22050 | |
| Chemical compound, drug | Paraformaldehyde | Sigma-Aldrich | #158127 | |
| Commercial assay or kit | Click-It EdU Alexa Fluor 594 kit | ThermoFisher Scientific | #C10339 | |
| Chemical compound, drug | EdU | ThermoFisher Scientific | #E10187 | |
| Chemical compound, drug | Tamoxifen | Sigma-Aldrich | #T5648 | |
| Other | DAPI stain | Invitrogen | #D1306 | IHC 1:250 |
| Antibody | Alexa 488, 568 or 647 secondaries | Jackson Immunoresearch | IHC 1:250 to 1:1000 | |
| Software, algorithm | Image Studio Lite | LI-COR, Inc | ||
| Software, algorithm | Prism | GraphPad Software, Inc | ||
| Software, algorithm | Stata | StataCorp LP | Mann-Whitney test |
Additional files
Download links
A two-part list of links to download the article, or parts of the article, in various formats.
Downloads (link to download the article as PDF)
Open citations (links to open the citations from this article in various online reference manager services)
Cite this article (links to download the citations from this article in formats compatible with various reference manager tools)
Axon-dependent expression of YAP/TAZ mediates Schwann cell remyelination but not proliferation after nerve injury
eLife 9:e50138.
https://doi.org/10.7554/eLife.50138


