Analysis of stochastic fluctuations in responsiveness is a critical step toward personalized anesthesia
- University of Pennsylvania, United States
- The Ohio State University, United States
- Drexel University College of Medicine, United States
Figures
Figure 1
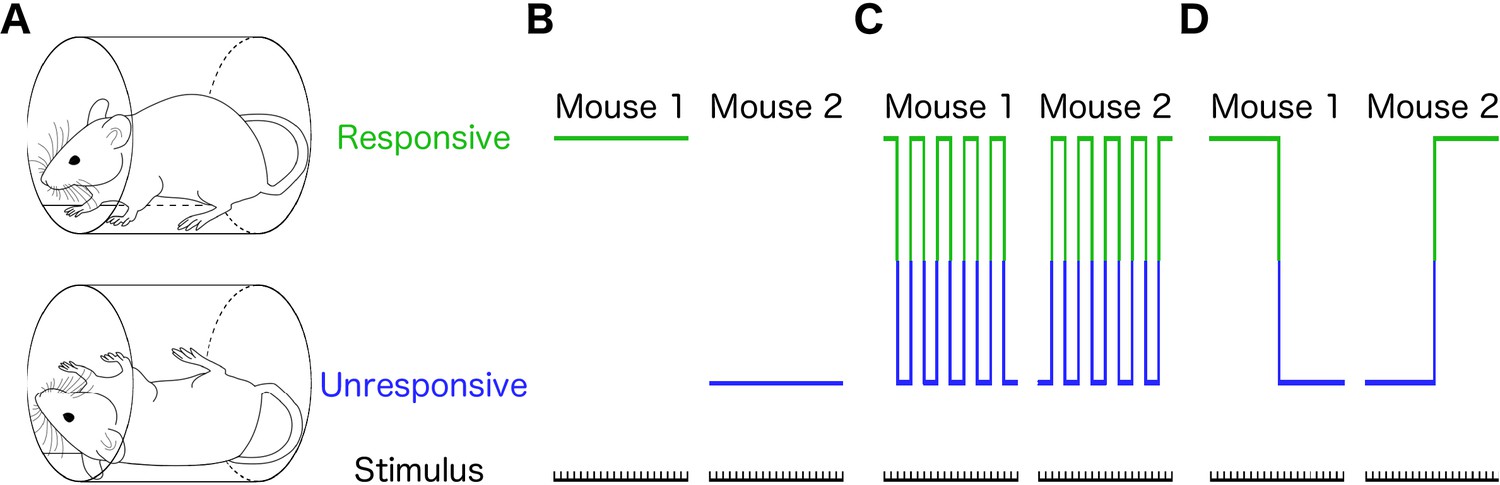
Different individual behaviors can produce identical population effects.
(A) Presence (top) or absence (bottom) of righting reflex is a binary behavioral measure that distinguishes awake from anesthetized mice. Schematic representations of three qualitatively distinct models that yield 50% population responsive probability (PRP) are shown in B-D. (B) Responses in each individual remain constant on repeated righting reflex assessments. Hence, PRP is solely a consequence of individual differences in drug sensitivity. This is the commonly assumed model. (C) PRP is a consequence of a constant response probability for each animal on each trial; responses on repeated trials fluctuate, but the probability of response is independent of the state of the animal. (D) PRP is a consequence of a state-dependent fluctuations in responses to repeated presentation of the stimulus. In this example, animals tend to stay in the previously observed state.
Figure 2 with 3 supplements

Individual responsiveness fluctuates over time with unchanging population response.
(A) Twenty mice were exposed to 0.6% isoflurane for 2 hr, then righting reflex was assessed every 3 min for another 2 hr at the same isoflurane concentration. Fluctuations between responsive (green) and unresponsive (blue) states on repeated trials are seen in every animal. (B) Population response probability (PRP) remains constant over the duration of the entire experiment (R2 = 4.3×10⁻¹⁶, p=1 correlation between trial number and response probability averaged across animals for each trial, Pearson’s R). PRP averaged across animals and trials at 0.60% isoflurane is 0.44 ± 0.06 (mean ± SD, red line). (C) 72 larval zebrafish (five dpf) were exposed to 3 μM propofol for a total of 4 hr, with startle reflex assessed every 30 s for the final 3 hr of the exposure. Fluctuations between responsive and unresponsive states on repeated trials are also seen in every animal. (D) PRP remains constant over the duration of the entire experiment (R2 = 1.2×10⁻¹⁴, p=1, correlation between trial number and response probability averaged across animals for each trial, Pearson’s R). PRP averaged across animals and trials at 3 μM propofol is 0.45 ± 0.05 (mean ± SD, red line). Scale bars represent 15 min. Source data for population response probabilities used for this analysis are available in the Figure 2—source data 1.
-
Figure 2—source data 1
Mean population response probabilities of righting reflex assays in mice at 0.6% isoflurane and startle reflex assays in zebrafish at 3µM propofol.
- https://cdn.elifesciences.org/articles/50143/elife-50143-fig2-data1-v1.xlsx
Figure 2—figure supplement 1
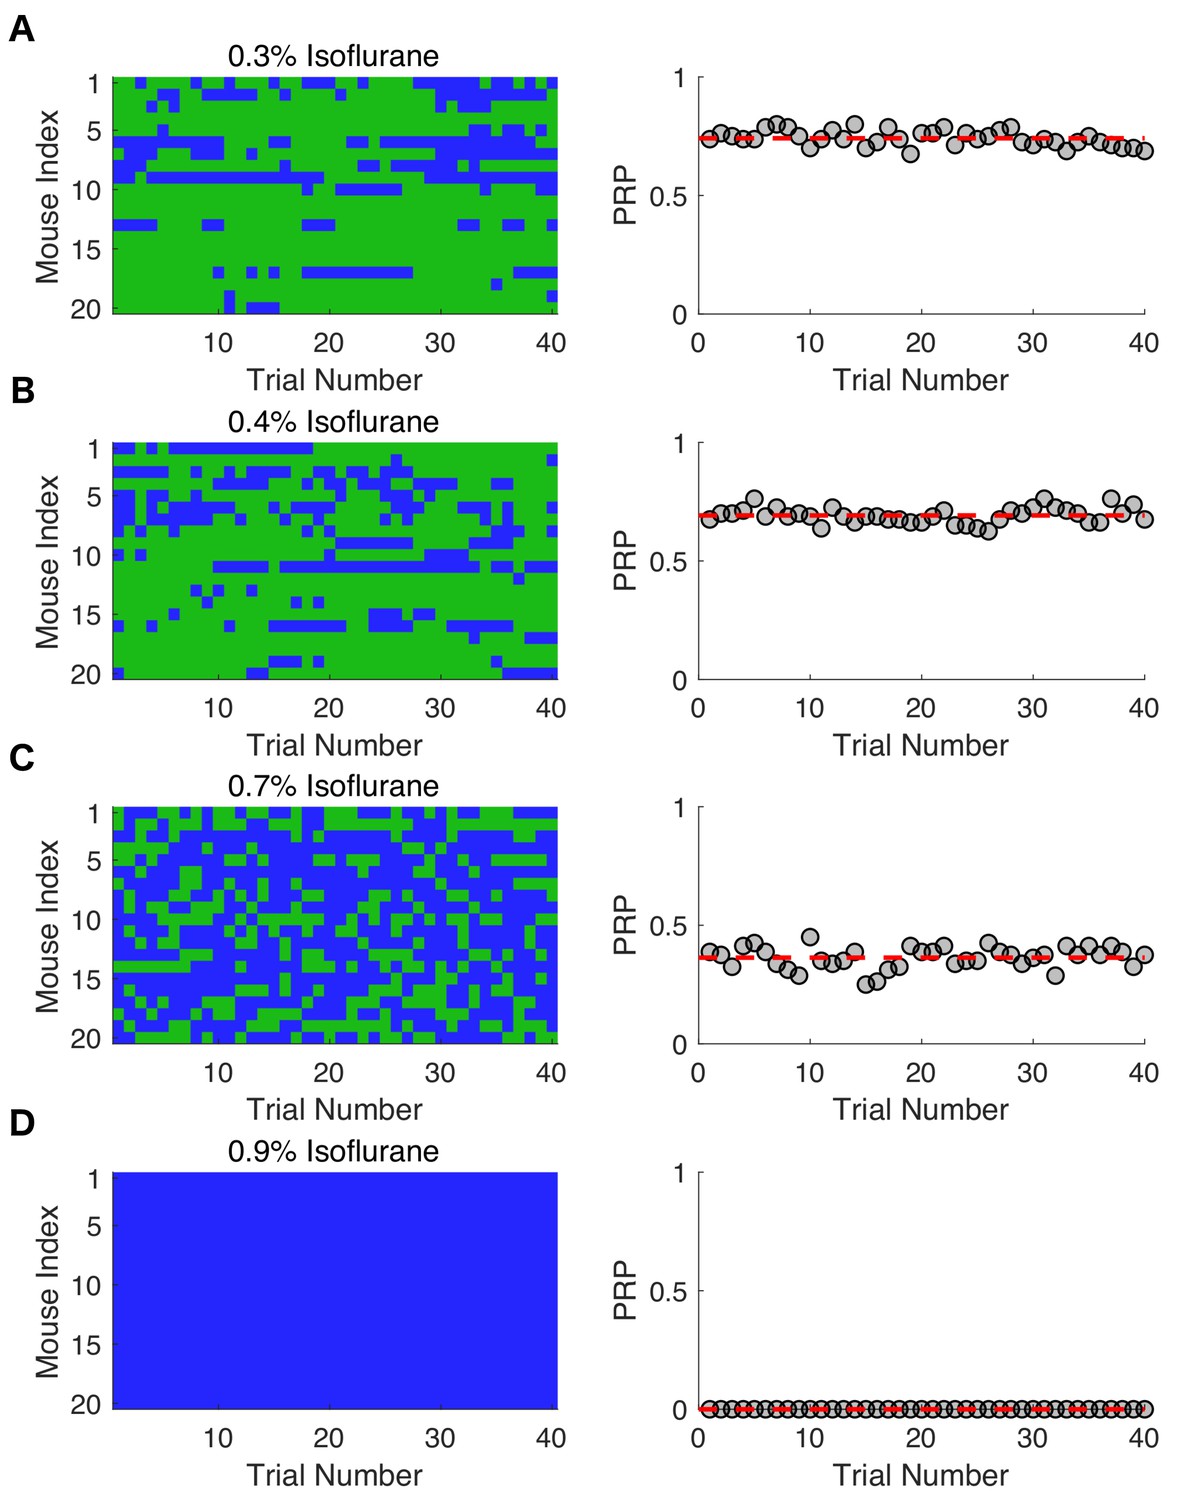
Response probabilities in mice at varying isoflurane concentrations.
Individual response probabilities and population response probabilities (PRP) are shown for 20 mice exposed to (A) 0.3% isoflurane, (B) 0.4% isoflurane, (C) 0.7% isoflurane, and (D) 0.9% isoflurane. Righting reflex (RR) was assessed every 3 min for the final 2 hr of a 4-hr exposure. Green denotes a responsive trial, whereas blue represent an unresponsive trial. The PRP for mice exposed to 0.3% isoflurane reached and stayed steady at 0.74 ± 0.03 (mean ± SD, R2 = 2.9 x 10⁻¹⁵ , p = 1). Steady state PRP at 0.4% isoflurane was 0.69 ± 0.03 (mean ± SD, R2 = 7.59 x 10⁻¹⁶ , p = 1) and for 0.7% isoflurane PRP was 0.36 ± 0.05 (mean ± SD, R2 = 3.7 x 10⁻¹⁶ , p = 1). Steady state PRP for mice exposed to 0.9% isoflurane was 0 (R2 = 0, p = 1).
Figure 2—figure supplement 2
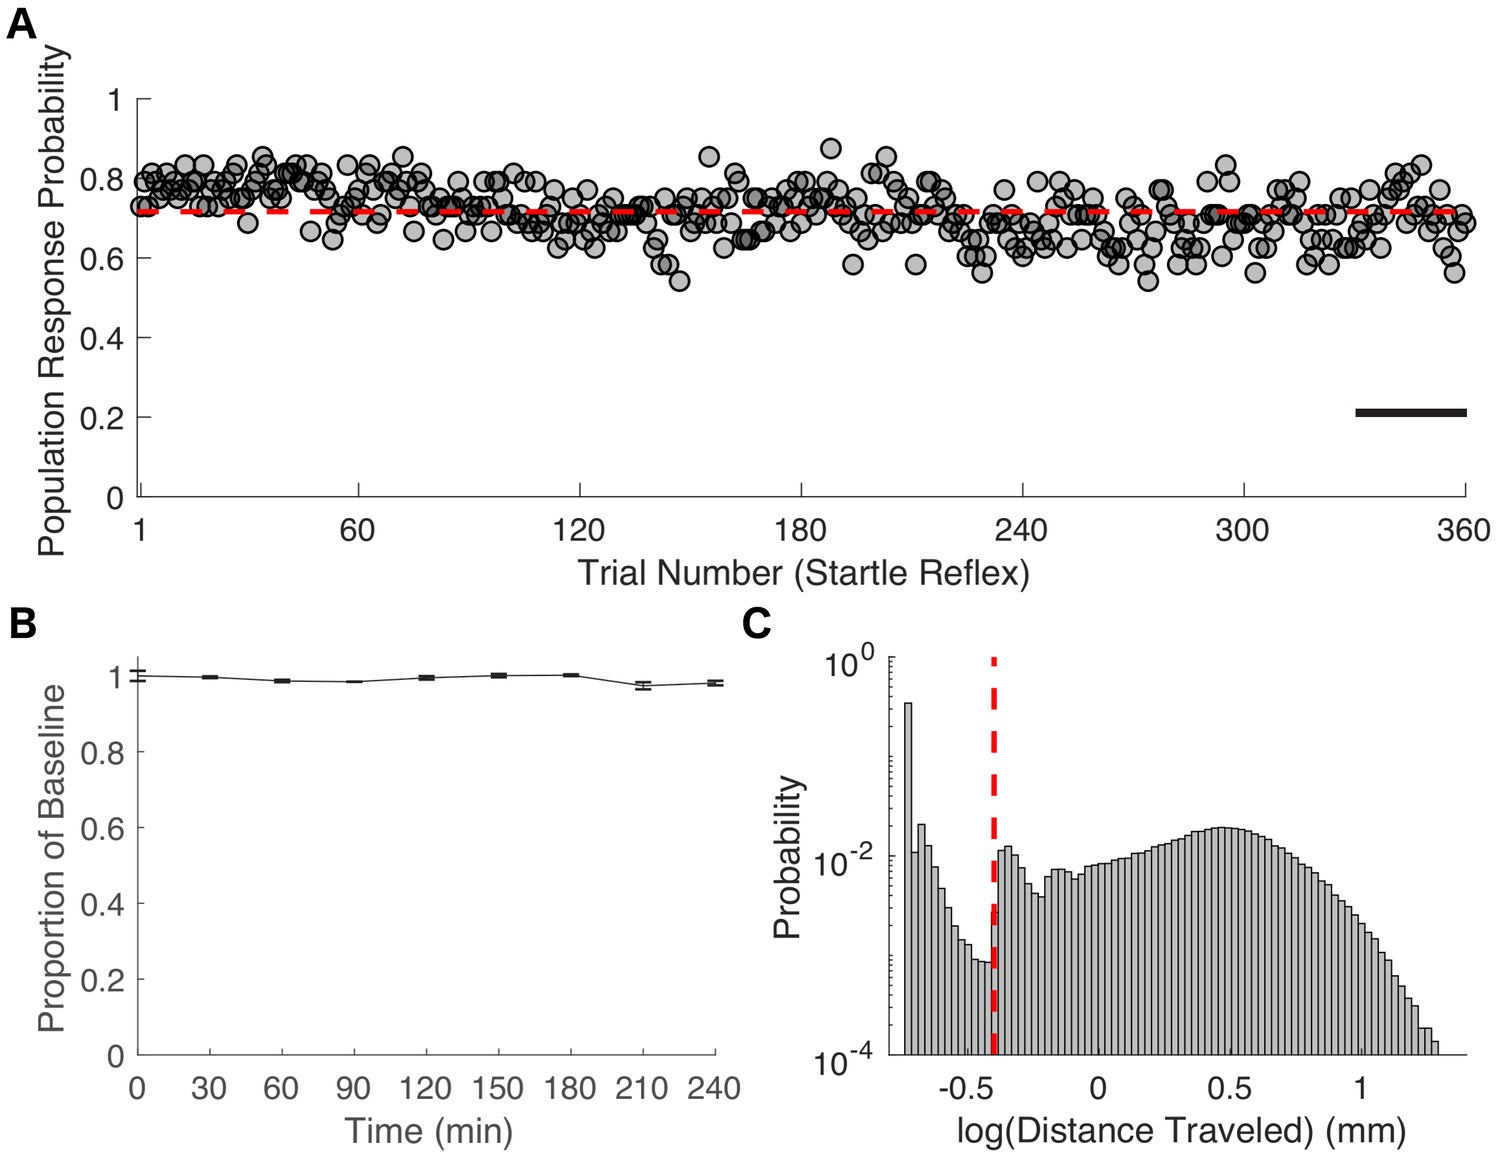
Characterization of zebrafish startle response.
(A) The population response probability averaged across 48 zebrafish exposed to E3 larval medium alone is 0.72 ± 0.07 (mean ± SD, red line in A). SR was assessed every 30 s for 3 hrs after a 1-hr equilibration period. (B) Propofol concentrations remained constant for the duration of a 4-hr exposure. Propofol concentrations were measured in triplicate at 30-min intervals (ThermoFischer Scientific NanoDrop Spectrophotometer). (C) Distribution of velocities elicited by a tap stimulus is bimodal. For the purposes of classifying startle reflex (SR) as responsive or unresponsive, the distance travelled in the first second after the tap stimulus was thresholded at 0.4mm (dashed red line). Scale bar represents 15 min.
Figure 2—figure supplement 3
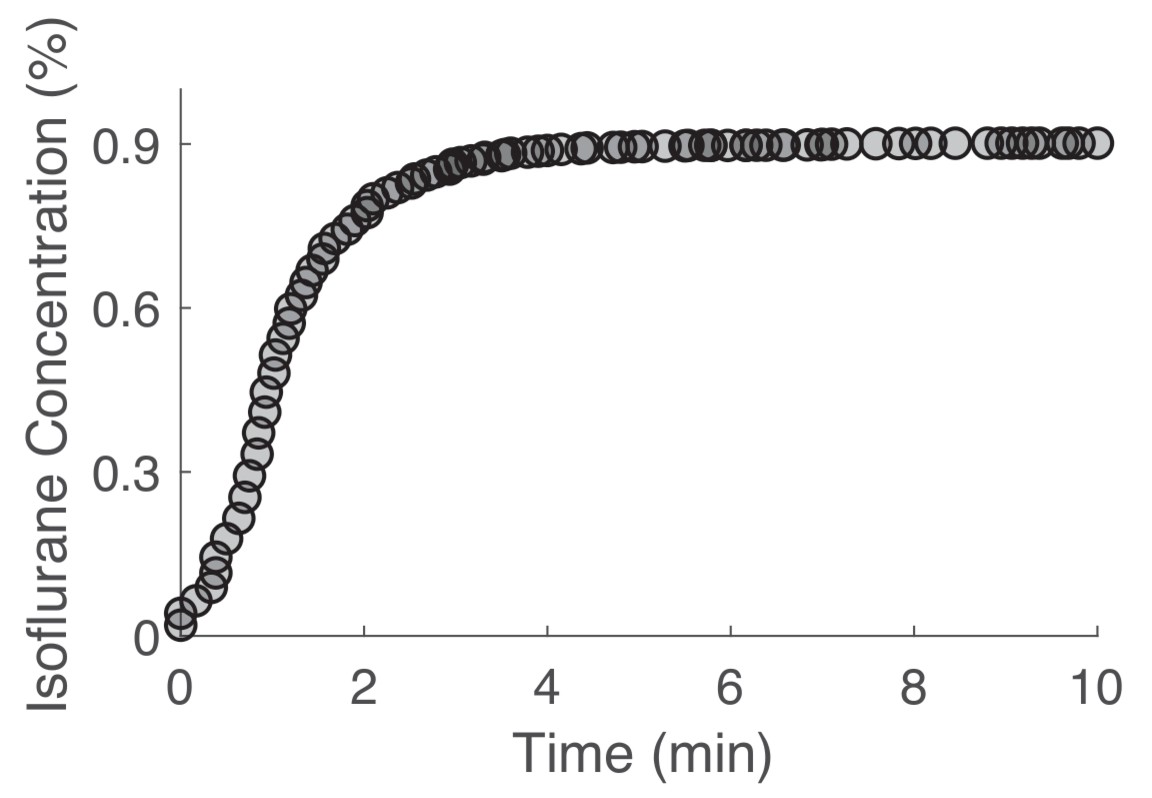
Chamber equilibration occurs within 5 min.
Target volatile anesthetic concentrations were reached within 5 min of drug exposure onset. Chamber equilibration is shown for a target concentration of 0.9% isoflurane. One volume turnover per minute flow rates were used for all volatile anesthetic exposures.
Figure 3
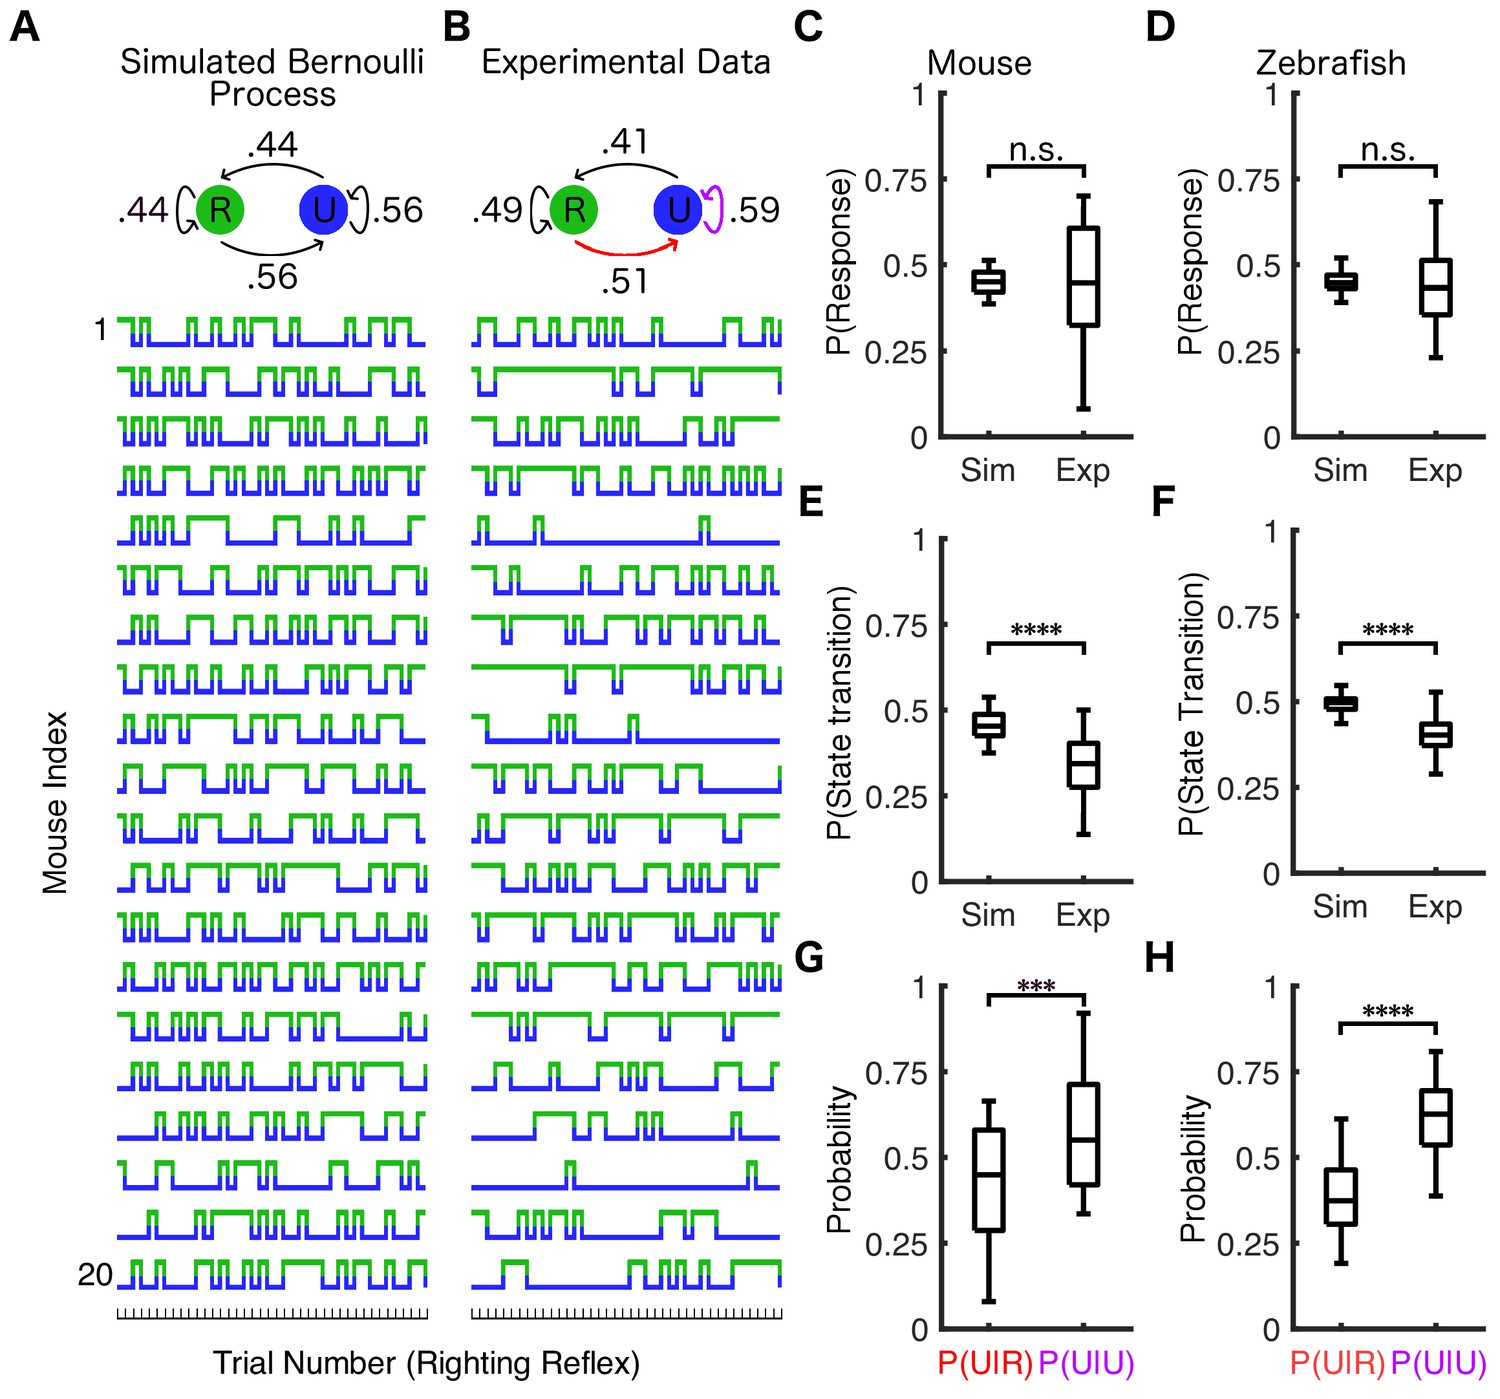
Response probability is state-dependent.
(A) Twenty simulations of a Bernoulli process where the response probability is 44% for all trials (identical to the average PRP in mice at 0.6% isoflurane) were performed. Each simulation consisted of the same number of trials as the experimental data from (B). Similar simulations were conducted for zebrafish using PRP of 0.45. Simulated (A) and experimentally observed (B) transition probability matrices are shown schematically above traces. The population response probability in simulations is not statistically different from experimental observations across mice (C) (U = 197.5, nsim = nexp = 20, p=0.95) or across zebrafish (D) (U = 2276, nsim = nexp = 72, p=0.34). Both mice (E) (U = 48.5, nsim = nexp = 20, p<0.0001) and zebrafish (F) (U = 300.5, nsim = nexp = 72 p<0.0001) have fewer state transitions than simulations of the Bernoulli process. Both mice (G) (U = 103, nP(U|R) = nP(U|U)=20, p<0.001) and zebrafish (H) (U = 501, nP(U|R) = nP(U|U)=72, p<0.0001) are more likely to stay unresponsive if they failed to respond in the previous trial (purple arrow in B) than if they were able to respond to the previous stimulus (red arrow in B). In plots (C–H) box plots show inter-individual differences in estimated parameters (central mark indicates the median, box shows interquartile range, whiskers extend to the most extreme data points). Statistical significance is shown by ***p<0.001 ****p<0.0001. Source data for all quantitative analyses described are available in the Figure 3—source data 1.
-
Figure 3—source data 1
Individual simulated and experimental response probabilities and probability of transitions (total, P(U|U), and P(U|R)).
- https://cdn.elifesciences.org/articles/50143/elife-50143-fig3-data1-v1.xlsx
Figure 4 with 1 supplement
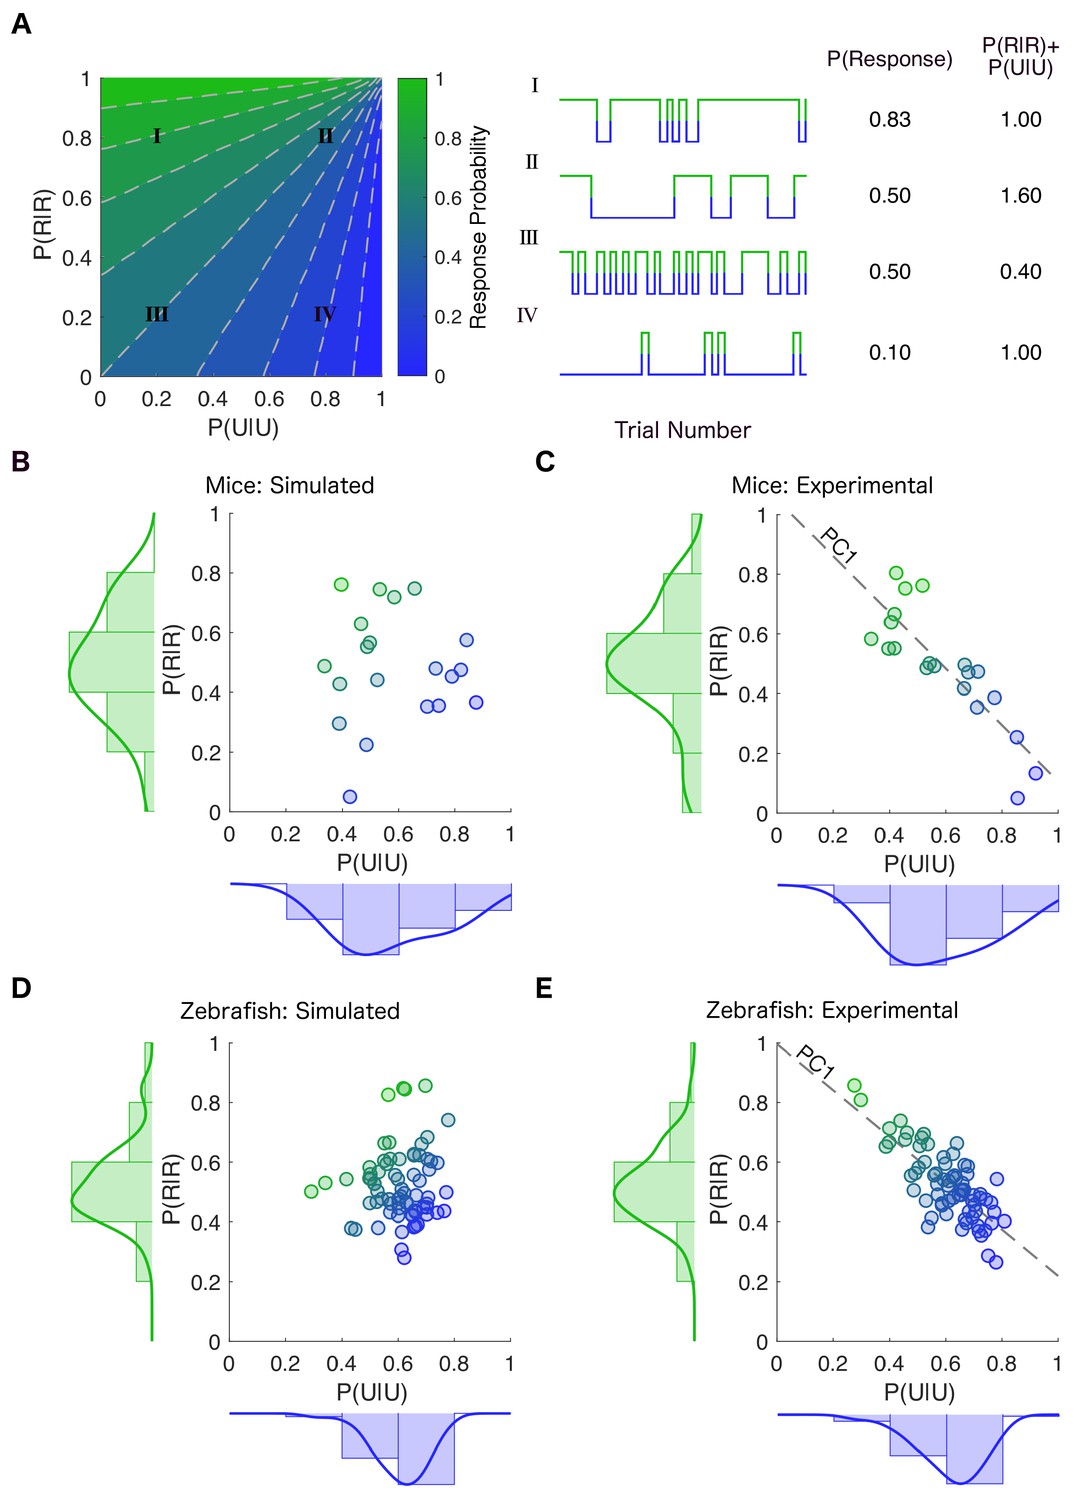
Stability of responsiveness and unresponsiveness are linked.
(A) (Left) The transition probability matrix for each individual can be represented as a point on a plane spanned by the diagonal elements P(U|U) and P(R|R) denoting the probability of staying in the previously observed state. The plane is colored according to the across-trial response probability given by the transition probability matrix at each location in the plane. (Center) Examples of simulations constructed by creating transition probability matrices from the corresponding locations in the parameter plane. (Right) Movement along the dashed gray lines preserves the overall probability of response (Traces II and III). As one moves along the dashed gray line from bottom left to top right, the frequency of state transitions decreases but the overall response probability stays the same. In contrast, movement parallel to the line y = −x results in changes in response probability while conserving the noise driving transition between the responsive and the unresponsive states (Traces I and IV). This is because the line y = −x preserves the sum of stability of the responsive and the unresponsive states. (B) Transition probability matrices were empirically estimated for each mouse at 0.6% isoflurane. The empirically derived distributions of P(U|U) and P(R|R) (shown on the margins) were independently randomly sampled to create simulated individual points in the plane spanned by P(U|U) and P(R|R). Each point’s color shows the average across- trial response probability estimated empirically using simulations constrained to have the same number of trials as experimental observations. (C) Distribution of transition probabilities experimentally observed in individual mice at 0.6% isoflurane. Inter- individual variability is constrained such that the sum of P(U|U) and P(R|R) is approximately the same (R 2 = -0.85, p < 0.0001, Pearson’s R ) in individual mice. (D) A similar estimation and simulation was computed for zebrafish with P(U|U) and P(R|R) assumed to be independent of each other. (E) Distribution of the experimentally observed transition probabilities for individual zebrafish (R 2 = -0.77, p < 0.0001, Pearson’s R ). While each individual transition probability matrix is defined by two parameters, the inter-individual variability in these matrices is well approximated (~90% of variance in both mice and zebrafish) by a single value corresponding to the projection onto the first principal component (PC1) shown by the dotted line in (C) and (E). Source data for experimental plots described are available in the Figure 4—source data 1.
-
Figure 4—source data 1
Individual mouse and zebrafish P(U|U) and P(R|R) values.
- https://cdn.elifesciences.org/articles/50143/elife-50143-fig4-data1-v1.xlsx
Figure 4—figure supplement 1
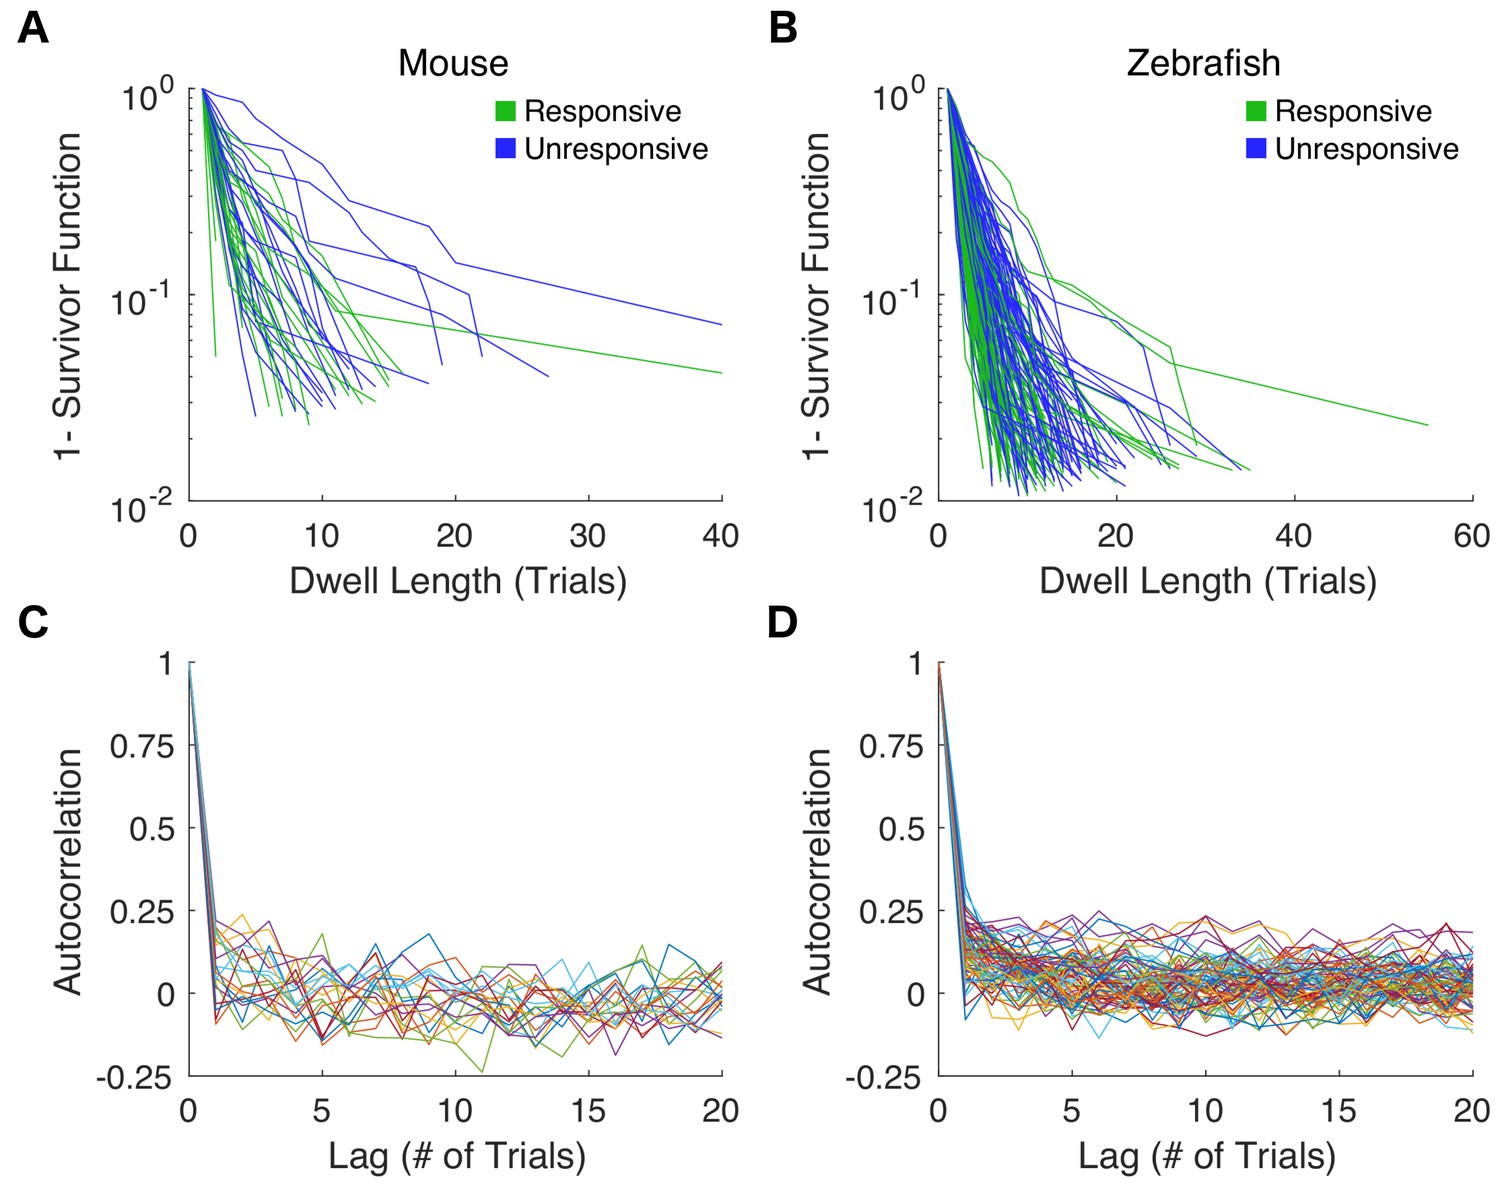
Estimates for dwell time distributions and autocorrelation functions from individual behavioral assays.
(A) Responsive (green) and unresponsive (blue) dwell time distributions for each mouse exposed to 0.6% isoflurane are shown on semi-log scale. (B) Responsive and unresponsive dwell time distributions for individual zebrafish exposure to 3 μM propofol. (C) Autocorrelation functions of responses to repeated righting reflex tests are shown for each mouse. (D) Autocorrelations of responses to consecutive startle reflex assays in zebrafish.
Figure 5
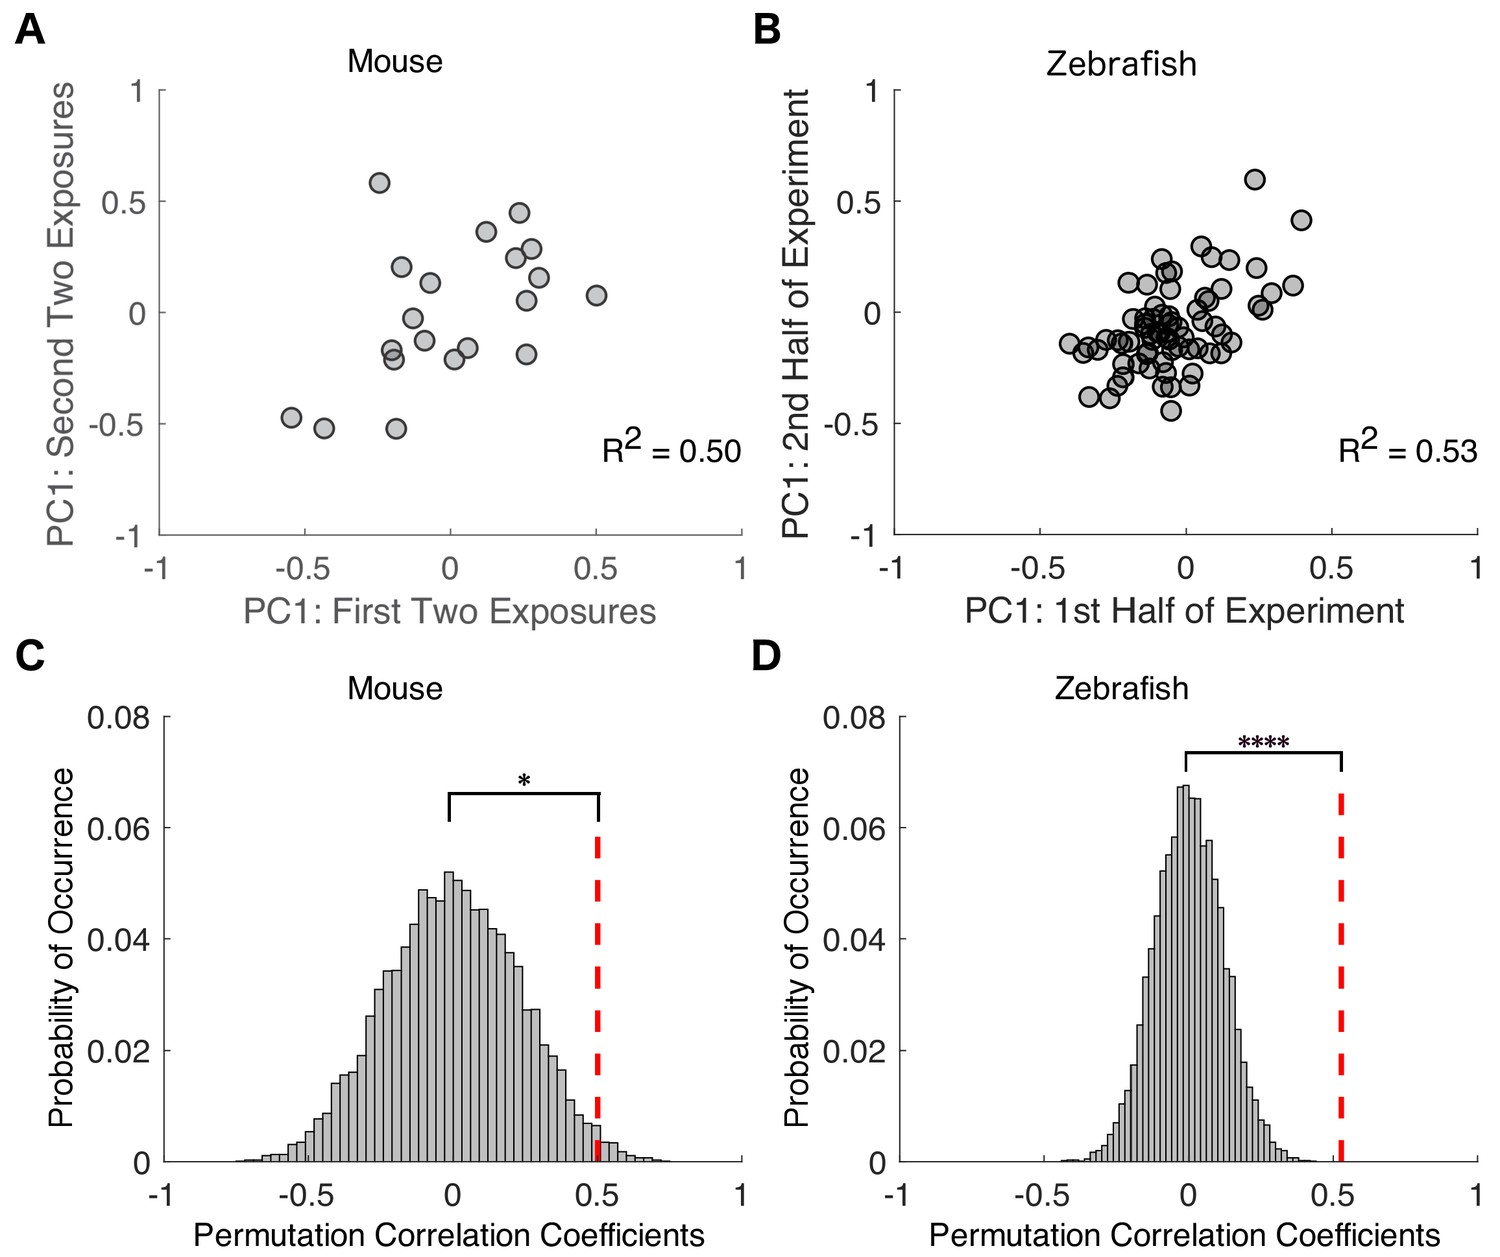
Variability in drug sensitivity is a stable characteristic of an individual at steady state equilibrium.
Transition probability matrices were independently estimated for each mouse across the first two and last two of exposures to isoflurane and projected onto the first principal component. For zebrafish, transition probability matrices were estimated for the first and second halves of propofol exposure. Negative values represent animals that had a high probability of staying responsive and low probability of staying unresponsive, whereas positive values represent animals that had a high probability of staying unresponsive and low probability of staying responsive. (A) In mice, individual transition probability matrices estimated separately for the first two and the last two exposures to 0.6% isoflurane were correlated (R2 = 0.50, p=0.025, Pearson’s R ). (B) In zebrafish, individual transition probability matrices estimated separately for the first and second halves of the exposure to 3 μM propofol were correlated (R2 = 0.53, p<0.0001, Pearson’s R ). (C) Permutation test reveals that, in mice, experimentally observed within-subject correlations are significantly higher than in inter-subject shuffled surrogates (p=0.013). (D) Permutation test computed for zebrafish (p<0.0001). Statistical significance is shown by *p<0.05 ****p<0.0001. Source data for correlation plots described are available in the Figure 5—source data 1.
-
Figure 5—source data 1
PC1 values in mice for exposures 1/2 and 3/4 and in zebrafish for first and second half of exposure.
- https://cdn.elifesciences.org/articles/50143/elife-50143-fig5-data1-v1.xlsx
Figure 6 with 1 supplement
Individual response probabilities between different drug concentrations overlap at a population level.
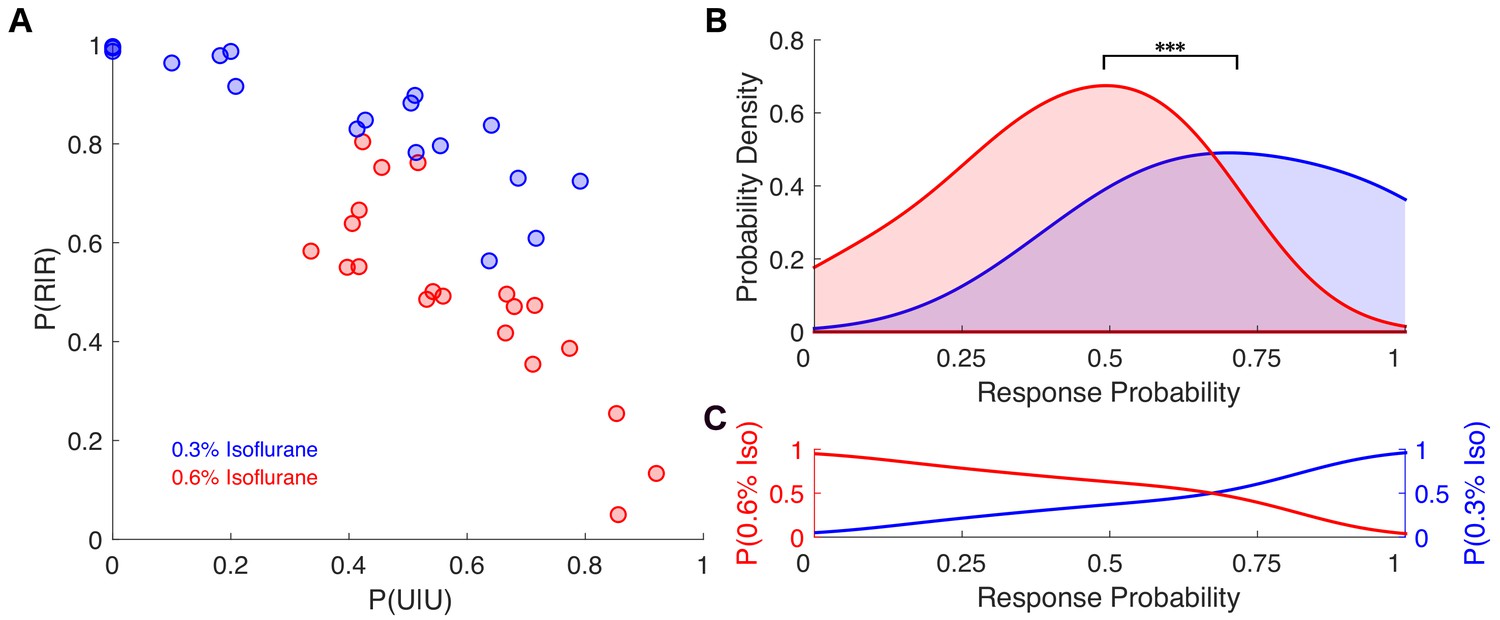
(A) Individual empirically-estimated transition probability matrices are plotted in the plane spanned by P(U|U) and P(R|R) for animals exposed to 0.3% isoflurane (n = 18, blue dots) and 0.6% isoflurane (n = 20, red dots). (B) Probability density of the individual across-trial response probabilities were estimated for mice exposed to 0.3% isoflurane (blue) and 0.6% isoflurane (red). At the population level, distributions of responsiveness at the two isoflurane concentrations are significantly different (U = 54, n0.3% iso = 18, n0.6% iso = 20, p<0.001). Overlap of the two distributions was 57%. (C) Posterior distributions, representing the probability that a mouse with a given across-trial response probability was exposed to 0.3% (blue) isoflurane or 0.6% (red) isoflurane. Over a broad range of response probabilities, the odds of correctly identifying drug concentration on the basis of observed responsiveness is close to chance. Statistical significance is shown by ***p<0.001. Source data for response probability distributions described are available in the Figure 6—source data 1.
-
Figure 6—source data 1
PC1 values for mice exposed to 0.6% and for mice exposed to 0.3% isoflurane.
- https://cdn.elifesciences.org/articles/50143/elife-50143-fig6-data1-v1.xlsx
Figure 6—figure supplement 1
Individual response probabilities between different drug concentrations overlap in zebrafish.
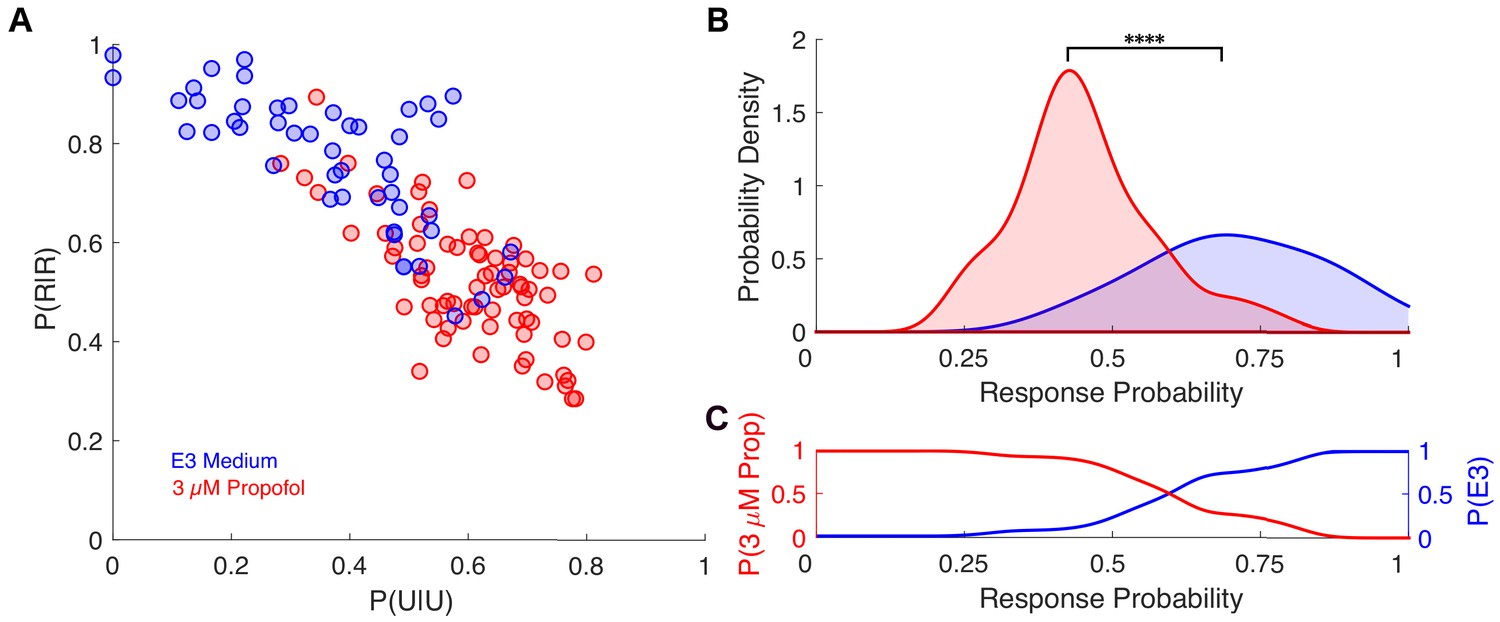
(A) Transition probability matrix estimated for each individual is represented by a point in a plane spanned by P(R|R) and P(U|U) for zebrafish exposed to either E3 medium (n=48, blue dots) or 3 μM propofol in E3 medium (n=72, red dots). (B) Probability density functions of average across-trial response probabilities were estimated for E3 alone (blue) and 3 μM propofol (red) from the projection of the transition probability matrices onto the first principal component (PC1) which accounts for ~90% of the variance among individuals. There is a significant difference between the distributions for fish exposed to E3 or 3 μM propofol (U = 324, nE3 = 48, n3μM = 72, p < 0.0001). (C) Posterior distributions computed using Bayes' theorem representing the probability of a zebrafish being exposed to either E3 (blue) or 3μM (red) propofol given the animals response probability. As in mice, over a broad range of average across-trial response probabilities, the odds of correctly identifying the drug concentration on the basis of observed probability of a response in an individual is close to chance for a broad range of response probabilities. Statistical significance is shown by **** p < 0.0001.
Figure 7 with 1 supplement
Varying degrees of overlap in response probability are present at the individual level between different isoflurane concentrations.
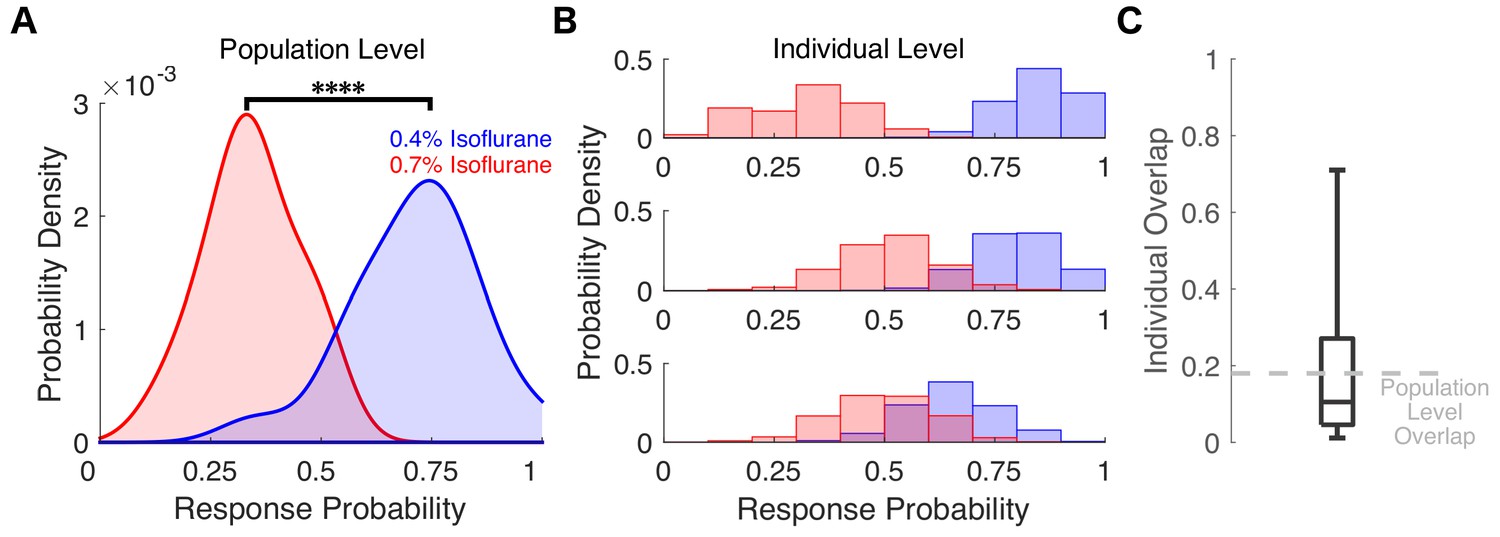
(A) Probability density of the individual across-trial response probabilities were estimated for mice exposed to 0.4% isoflurane (blue) and 0.7% isoflurane (red). In contrast to results in Figure 6B where different populations of mice were used, here the same 20 mice were exposed to both 0.4% and 0.7% isoflurane. At the population level, distributions of responsiveness at the two isoflurane concentrations are significantly different (U = 7, n 0.4% iso = n 0.7% iso = 20, p < 0.0001). Overlap of the two distributions was 18%. (B) Probability density estimates of response probability to exposures of 0.4% (blue) and 0.7% isoflurane (red) were computed with a bootstrap resampling technique (1000 bootstraps for 20 trials with resampling). Representative probability density estimates of the same individual exposed to two drug concentrations highlighting the variability in response probability overlap across the two concentrations are shown, from marginal overlap (top), to some overlap (middle), to high overlap (bottom). (C) Boxplot representing fraction of overlap across individual mice. Box plot central mark indicates the median (11%), box shows interquartile range (5% to 27%), whiskers extend to the most extreme data points (1% and 71%). Statistical significance is shown by ****p < 0.0001. Source data for the response probability distributions described are available in the Figure 7—source data 1.
-
Figure 7—source data 1
PC1 values for mice exposed to both 0.4% and 0.7% isoflurane.
- https://cdn.elifesciences.org/articles/50143/elife-50143-fig7-data1-v1.xlsx
Figure 7—figure supplement 1
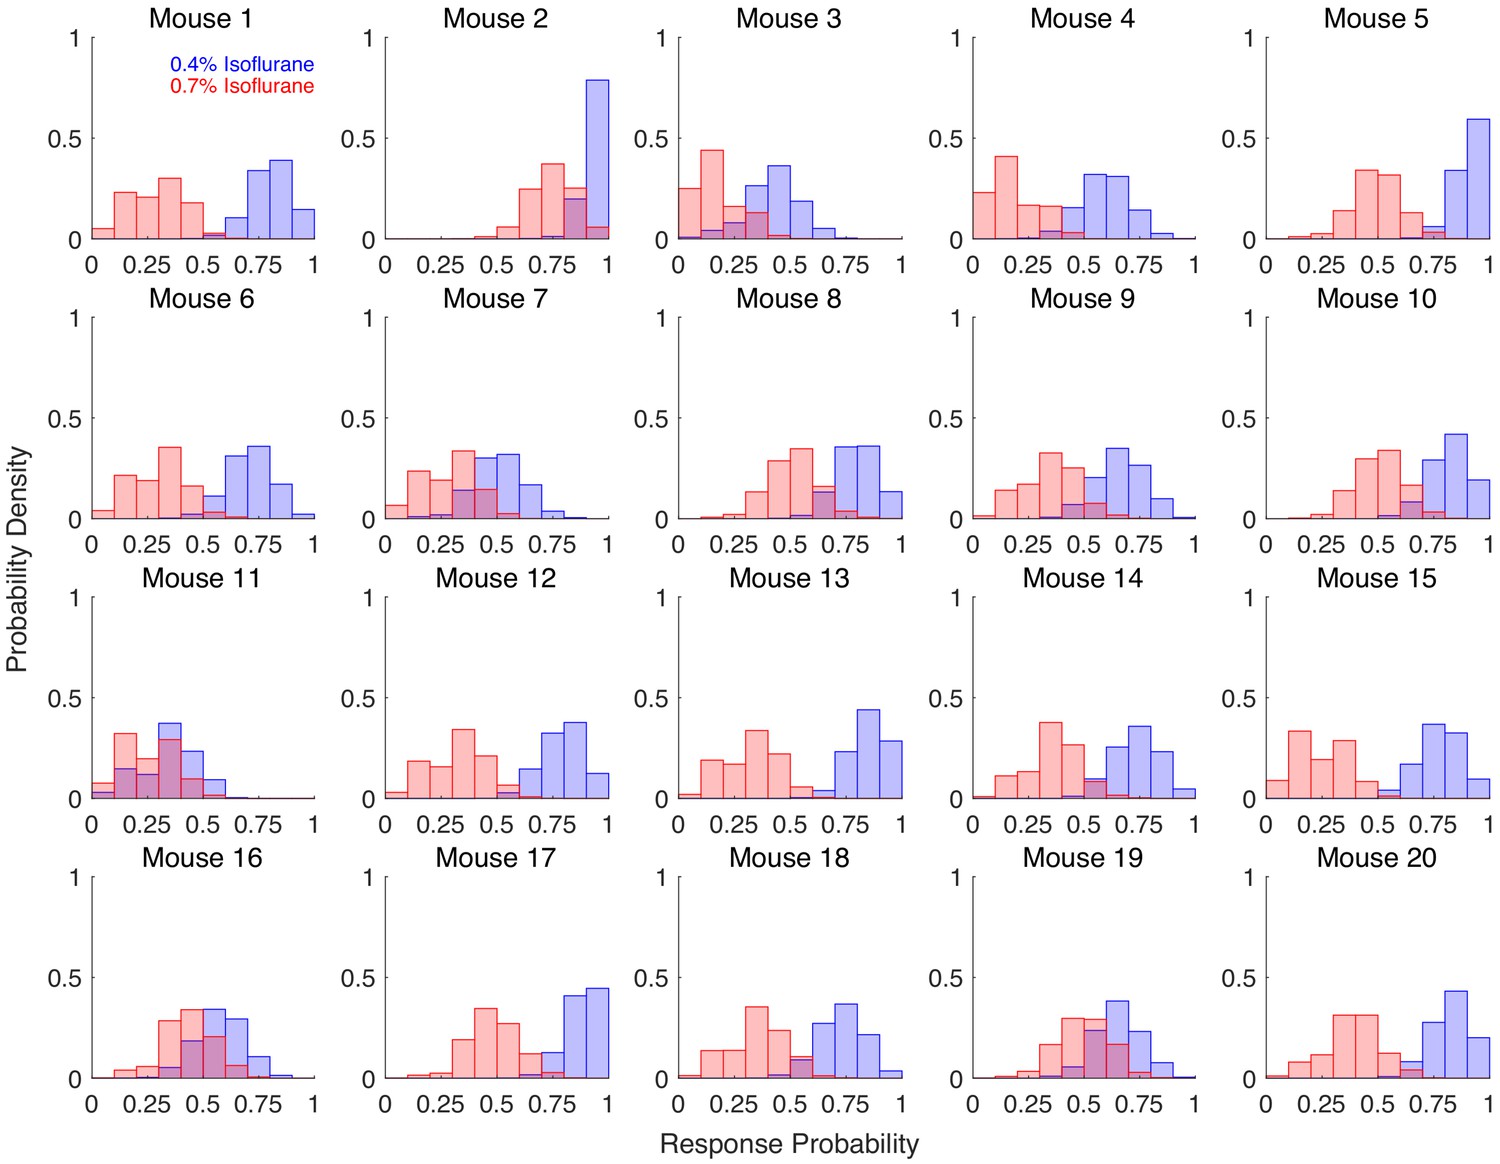
Ability to discriminate across two drug concentrations within individuals is highly variable.
Individual response probabilities are shown for 20 mice exposed to 0.7% isoflurane (blue) and 0.4% isoflurane (red). Righting reflex (RR) was assessed every 3 min for the final 2 hrs of a 4-hr exposure, with 4 exposures at each concentration. Bootstrapped response probabilities (1,000 bootstraps of 20 samples with replacement) are shown for each individual. Degree of overlap between the two concentrations of isoflurane is highly variable, from almost zero overlap (as seen in mouse 13) to almost complete overlap (as seen in mouse 11).
Figure 8
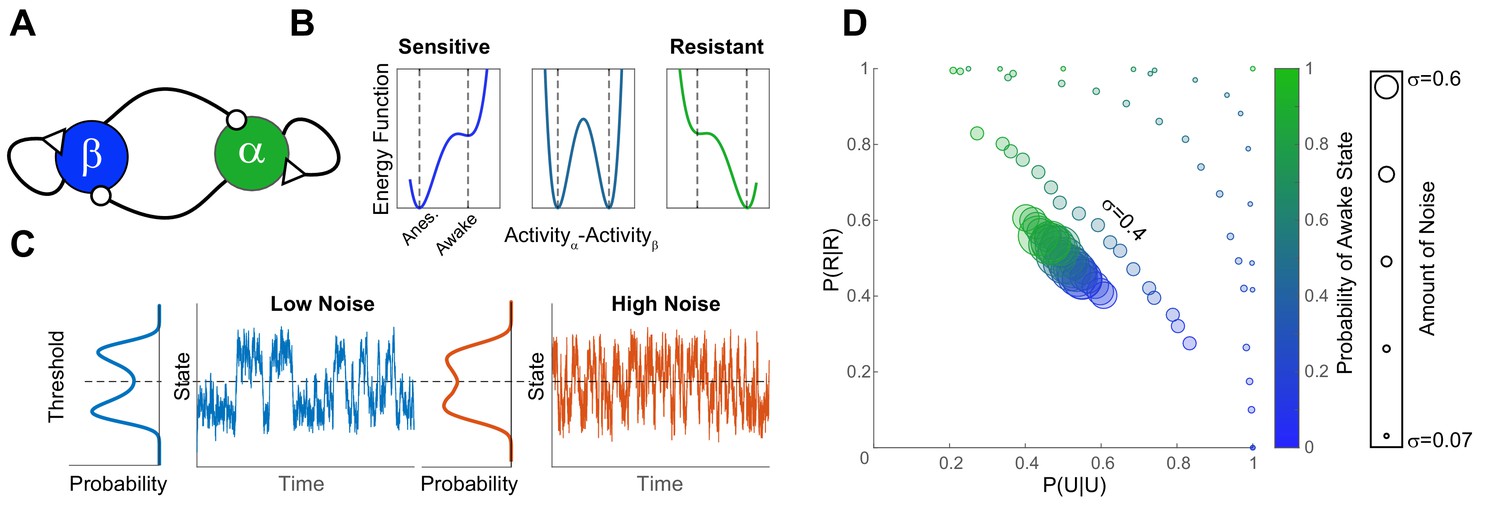
A simple bistable neuronal network model with noise, reproduces experimental findings.
(A) The network consists of two neuronal populations (β and α) which are operationally defined as ‘sleep active’ and ‘wake active’ respectively. Neuronal populations are mutually inhibitory and self-excitatory. Activity of such networks can be parametrized as a function of difference in activity between α and β using an energy function (B). At population-level EC50 (middle panel) some individuals have low probability of being in the awake state (Sensitive), while others have a high righting probability (Resistant). These differences in sensitivity are reflected in the depth of the energy wells which correspond to the Anesthetized (β-dominated) and Awake (α-dominated). The increase in the depth of the anesthetized well is proportional to the decrease in the awake well. (C) Shows the time evolution of network activity (at equal depths of the awake and the anesthetized wells) with different noise amounts. Trace shows the time evolution and the marginal distribution shows the probability distribution of states. Noise drives the time-evolution of the system: as more noise is added, the system fluctuates more rapidly. Since the distribution of states is bimodal, the states of the system can be discretized by applying a threshold. This is analogous to thresholding the SR responses in the zebrafish. (D) Discretized activity of the network was analyzed using a two-state Markov process as for experimental results. The parameters of the transition probability matrix are shown for different anesthetic sensitivities (color) and amounts of noise (symbol size). In order to obtain the data in Figure 4C,E and Figure 6A the amount of noise has to be constrained among individuals (σ = 0.4 matches the results at EC50 for propofol and isoflurane).
Additional files
-
Source code 1
Estimation of Dwell Time Distributions.
- https://cdn.elifesciences.org/articles/50143/elife-50143-code1-v1.m
-
Source code 2
Estimation of Transition Probability Matrix.
- https://cdn.elifesciences.org/articles/50143/elife-50143-code2-v1.m
-
Source code 3
Simulation of a Markov Process.
- https://cdn.elifesciences.org/articles/50143/elife-50143-code3-v1.m
-
Transparent reporting form
- https://cdn.elifesciences.org/articles/50143/elife-50143-transrepform-v1.docx
Download links
A two-part list of links to download the article, or parts of the article, in various formats.
Downloads (link to download the article as PDF)
Open citations (links to open the citations from this article in various online reference manager services)
Cite this article (links to download the citations from this article in formats compatible with various reference manager tools)
Analysis of stochastic fluctuations in responsiveness is a critical step toward personalized anesthesia
eLife 8:e50143.
https://doi.org/10.7554/eLife.50143


