The ribosomal P-stalk couples amino acid starvation to GCN2 activation in mammalian cells
- University of Cambridge, United Kingdom
- Wellcome Trust Sanger Institute, Wellcome Genome Campus, United Kingdom
- Medical Research Council Laboratory of Molecular Biology, United Kingdom
Figures
Figure 1 with 1 supplement
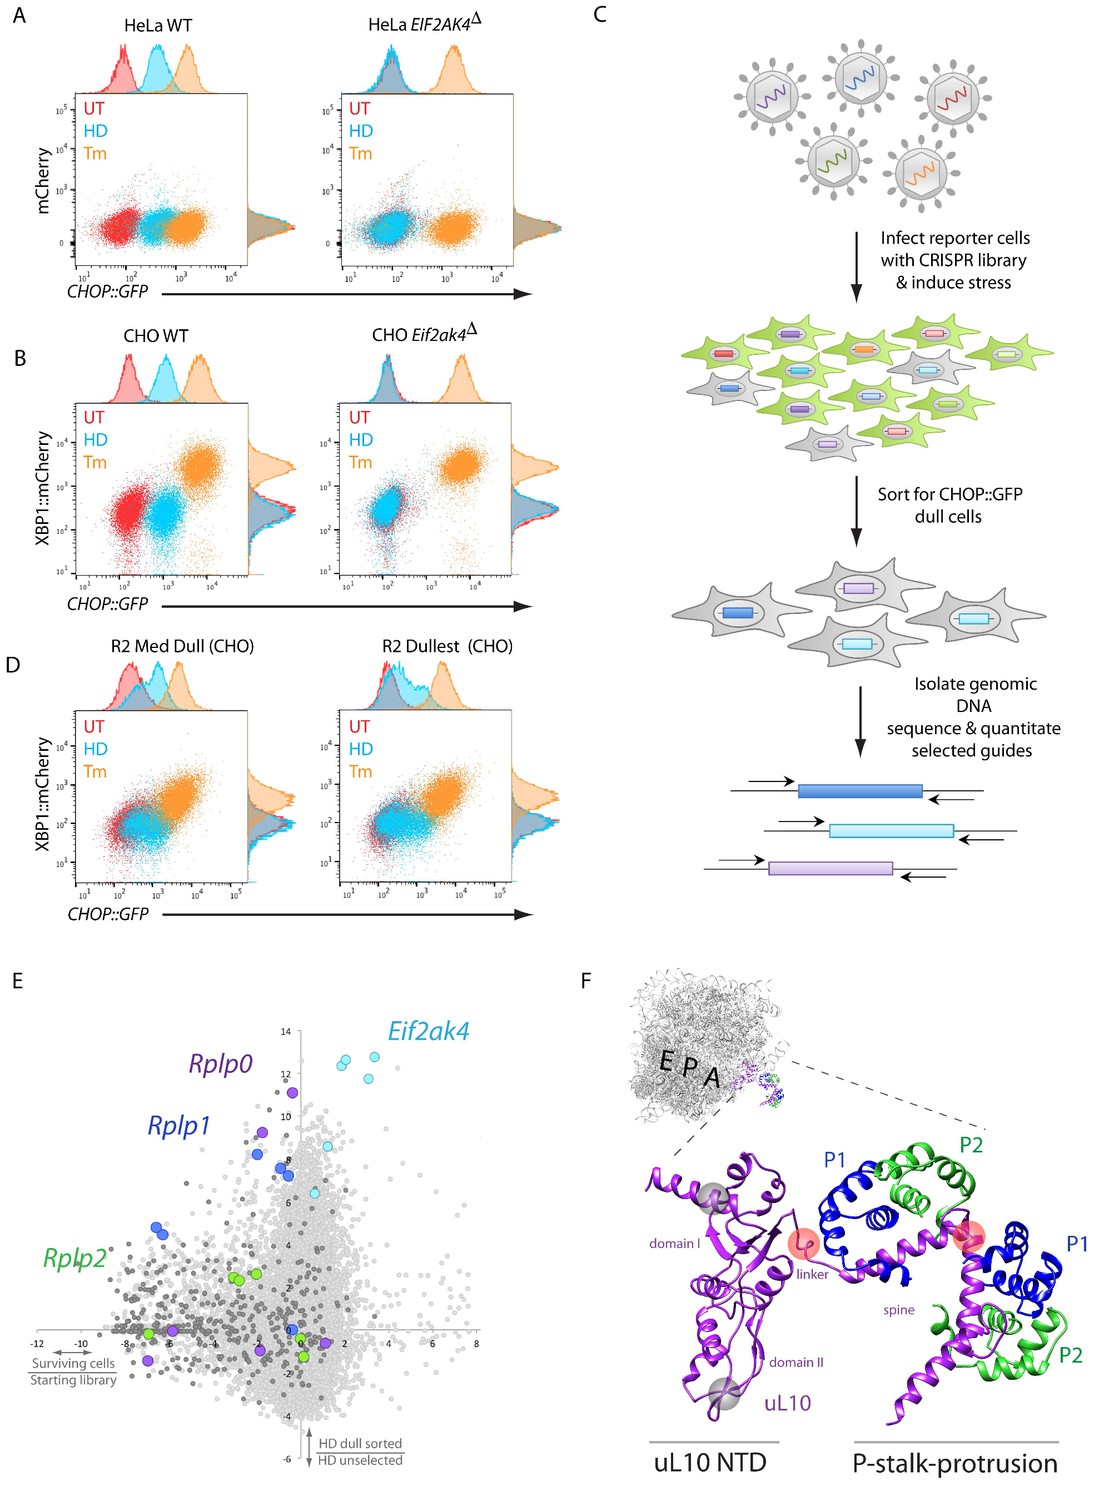
A CRISPR-Cas9-based genome-wide screen implicates the ribosomal P-stalk in ISR induction.
(A) Overlay plot of the fluorescence signal from wildtype (WT) or GCN2-ablated Eif2ak4∆ mutant HeLa cells with an ISR sensitive CHOP::GFP reporter (horizontal axis Ex: 488 nm/ Em530 ± 30 nm) and a constitutive mCherry reporter (vertical axis Ex 561/Em 610 ± 20 nm). The cells were untreated (UT, red), treated with histidinol (2 mM HeLa, 0.5 mM CHO, HD, blue) or tunicamycin (2 μg/ml, Tm, orange). Histograms of the signal in each channel are displayed on the axes. (B) Flow cytometry plot as in ‘A’ but from wildtype or GCN2-ablated CHO cells with the CHOP::GFP reporter (horizontal axis) and an ER-stress sensitive XBP1::mCherry reporter (vertical axis). Color-coding as in A. (C) Schema used to enrich for cells with CRISPR-Cas9 induced genetic lesions that impair ISR activation (CHOP::GFP dull cells) and for identification of the guide RNA sequences they harbor. (D) Flow cytometry plot as in B but from pools of CRISPR-Cas9 mutagenized CHO cells following two rounds of FACS-based enrichment for histidinol-treated CHOP::GFP dull cells. ‘R2 Med Dull’ and ‘R2 Dullest’ refers to pools selected for medium or strong impairment of CHOP::GFP induction. (E) Plot of the mean log2 fold enrichment or depletion of guides. The vertical axis compares the histidinol-treated CHOP::GFP dull population to an unselected population of histidinol-treated CHO cells. The horizontal axis reports on the enrichment or depletion of guides from unselected cells compared to their abundance in the original library. Guides targeting Eif2ak4, Rplp0, Rplp1 and Rplp2 are color coded. All other ribosomal proteins are in dark grey. Note that only Rplp0 guides that were not depleted from the unselected pool of transduced cells were enriched in the CHOP::GFP dull population. (F) Cartoon of the structure of the human ribosome with the position of the E, P, and A, sites highlighted and the P-stalk (based on PDB 4v6x) in close up. The ribosome associated N-terminal domain (NTD) of uL10 and the P-stalk protrusion are indicated. The unstructured acidic C-termini of uL10, P1, and P2, unresolved in PDB 4v6x, are not shown. The approximate positions on the protein corresponding to the site targeted by the Rplp0 guides enriched in the CHOP::GFP dull cells or depleted from the unselected pool of transduced cells are indicated by the red and grey translucent spheres, respectively.
Figure 1—figure supplement 1
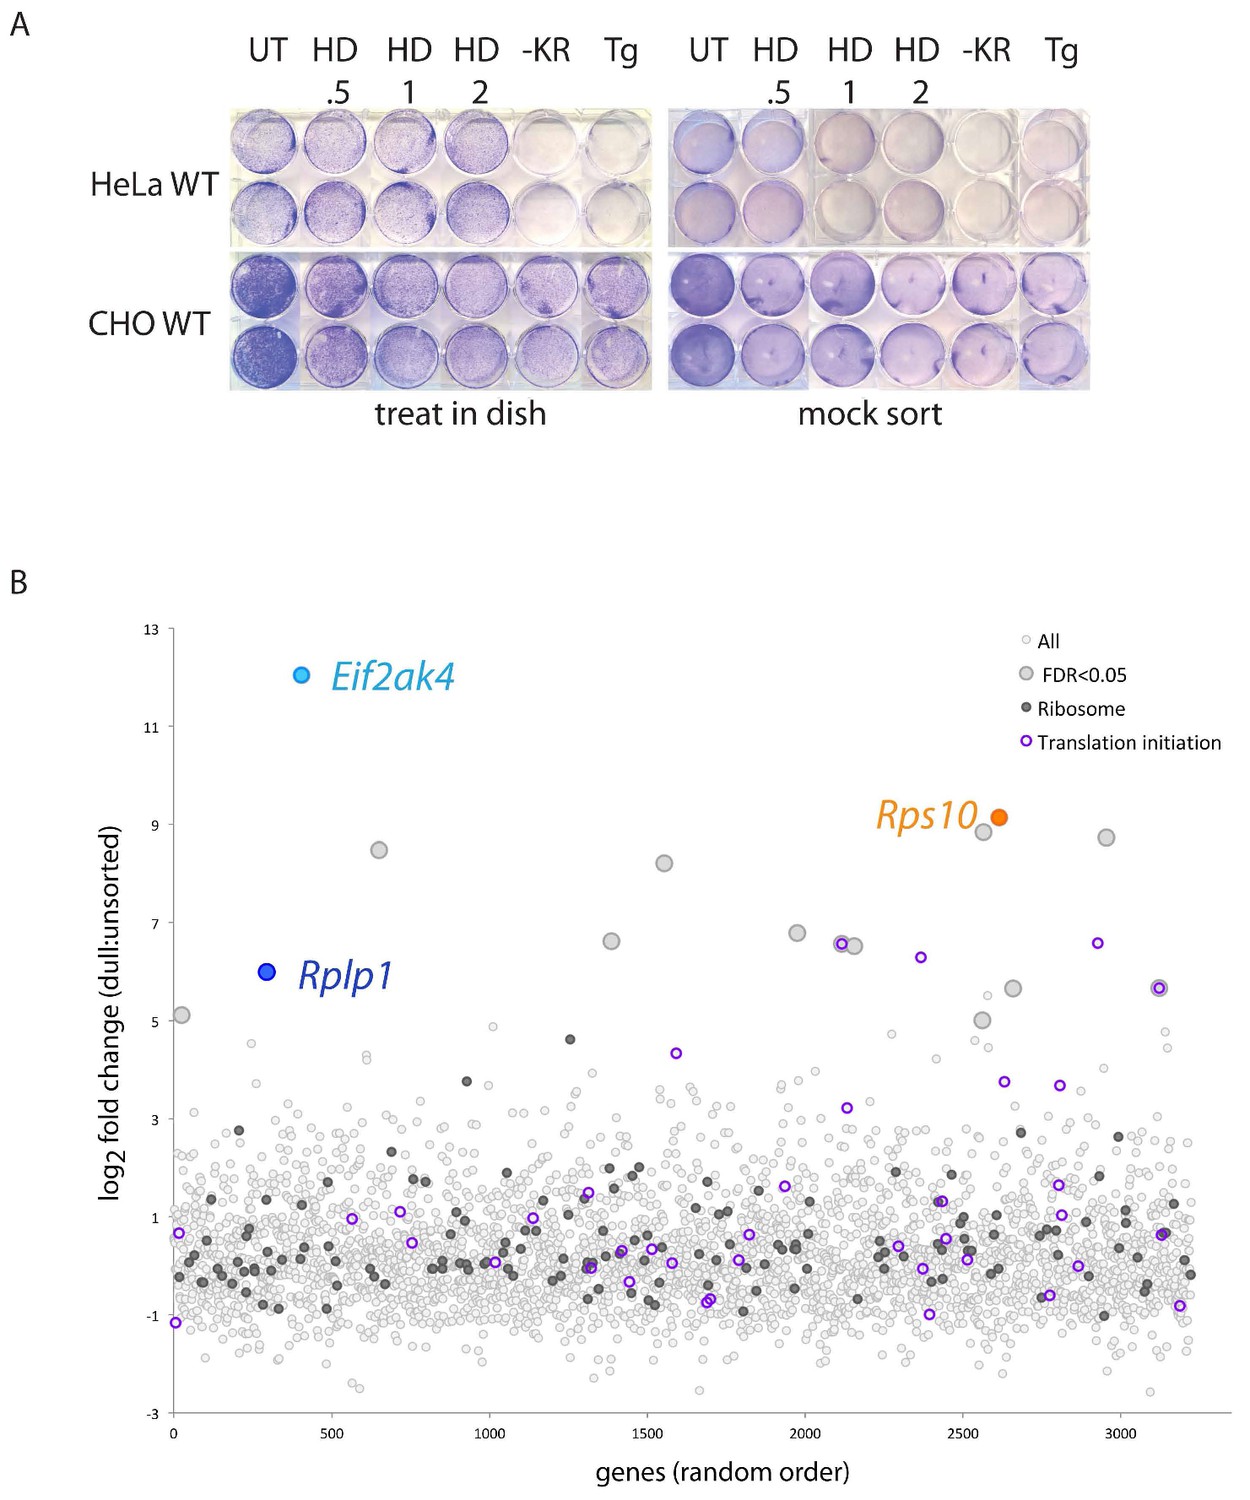
Poor clonogenic potential of stressed HeLa compared with CHO cells.
(A) Photograph of crystal violet stained plates of cultured and CHO cells following exposure to the indicated concentration of histidinol (in mM, for 20 hr), starvation of lysine and arginine (-KR, 20 hr) or treatment with thapsigargin (500 nM, 20 hr). The cells to the left were allowed to recover in the original dish following treatment (‘treat in dish’), whereas those to the right were released in PBS 4 mM EDTA, washed in PBS-0.1% BSA, stored on ice for 1 hr in the same buffer and re-plated (‘mock sort’) to mimic the conditions encountered in a screen with FACS-based enrichment step (B) Plot of the mean log2 fold change from for each of the 3222 genes in the CHO mini library in selected dull histidinol treated cells compared to histidinol treated un-sorted cells. For 3210 genes n = 6 guides/gene, and for 12 genes n = 1 to 5 guides/gene. Color-coding of circular symbols indicates genes of the following categories: most (open light grey), false discovery rate (FDR) < 0.05 (large, filled light gray), ribosomal (filled dark grey), translation initiation factors (open purple), eIF2ak4 (light blue), Rps10 (orange), and Rplp1 (dark blue).
Figure 2
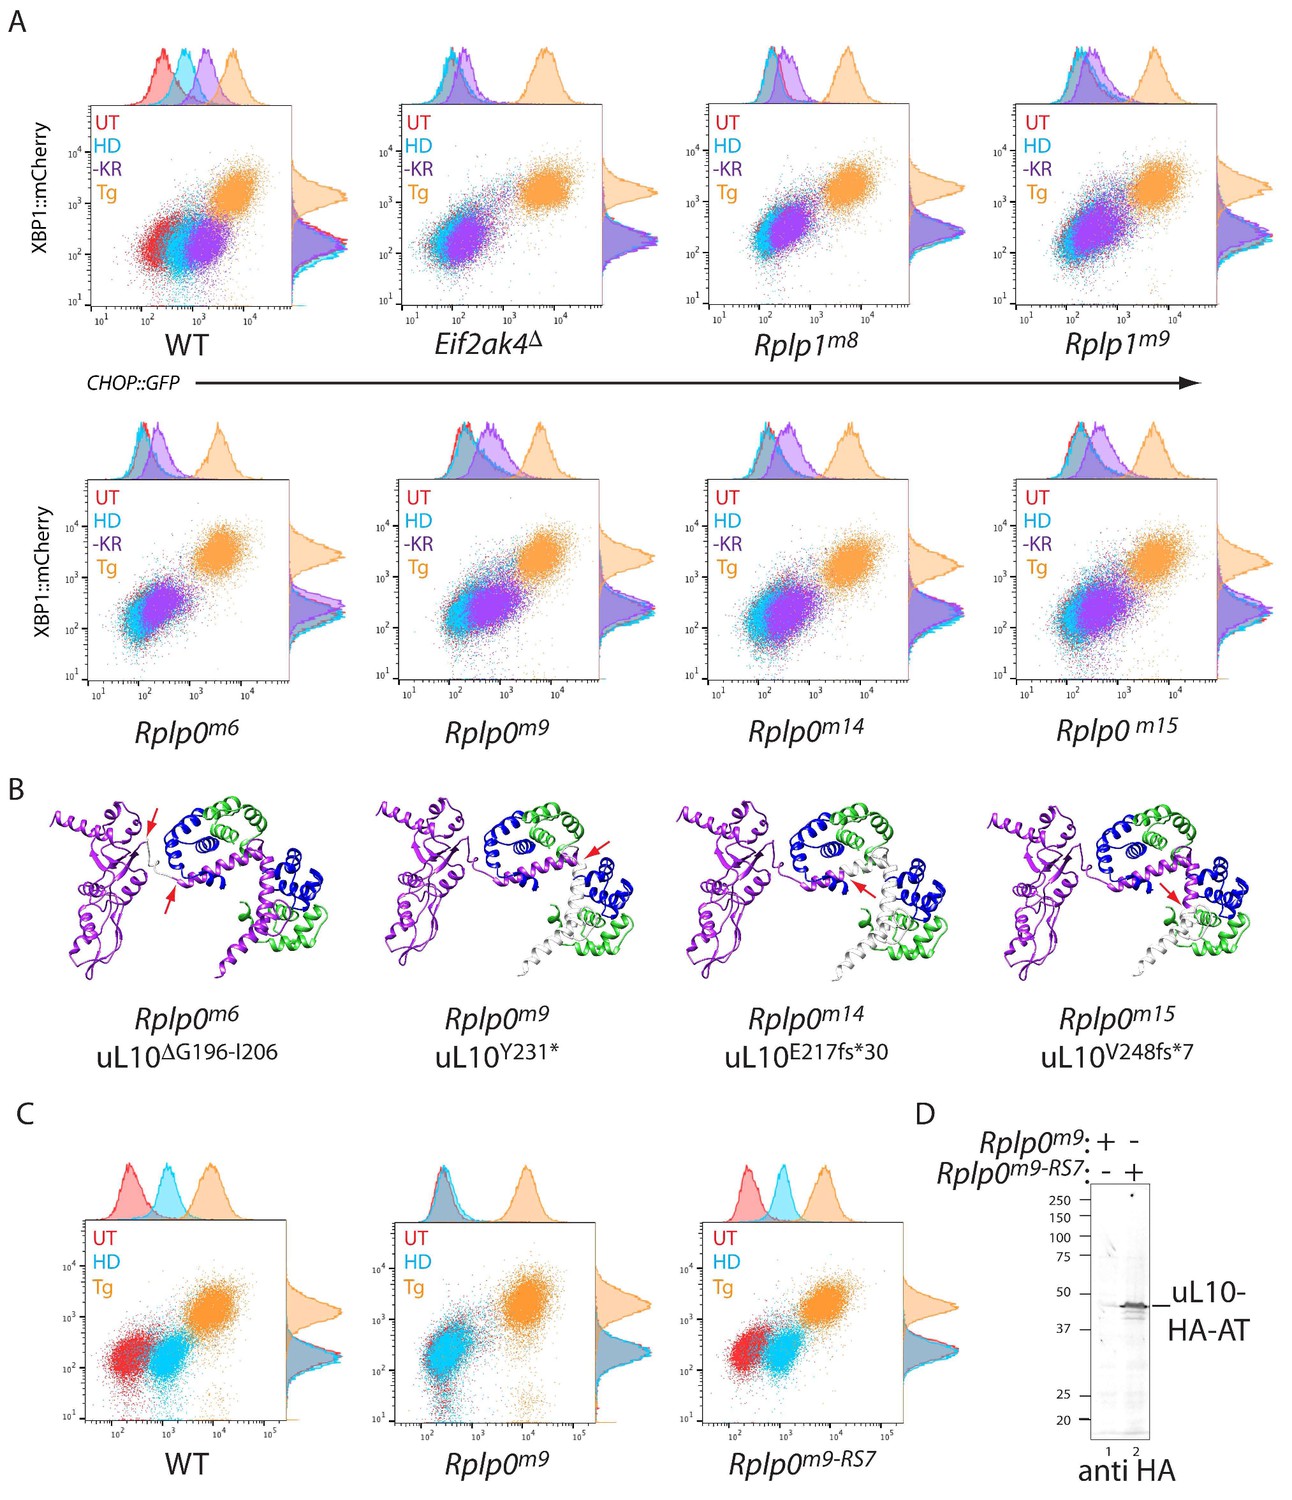
CRISPR-Cas9-based P-stalk lesions impair CHOP::GFP induction upon histidinol treatment or amino acid starvation.
(A) Flow cytometry analysis of the ISR-inducible CHOP::GFP and the UPR inducible XBP1::mCherry reporters from untreated (UT red), histidinol-treated (0.5 mM, HD, blue), thapsigargin-treated (1 mM, Tg, orange), or cells starved for lysine and arginine (-KR, purple) all for 20 hr. Cells were targeted with guides to the indicated genes. (B) Depiction of the genetic lesion in the Rplp0-mutant clones whose flow cytometry profile is shown above. Shown is a ribbon diagram of the P-stalk (as in Figure 1E) Red arrows indicate the boundaries of the mutations and deleted regions are colored light grey. (C) Flow cytometry analysis of parental (wildtype, WT) CHO cells, the Rplp0m9 mutant and the mutant following restoration of the P-stalk by re-targeting the mutant Rplp0 with a repair template encoding a wildtype allele with an HA epitope tag (Rplp0m9-RS7) (D) Anti-HA immunoblot of cytoplasmic extracts from the parental Rplp0m9 and rescued Rplp0m9-RS7 cells.
Figure 3 with 1 supplement
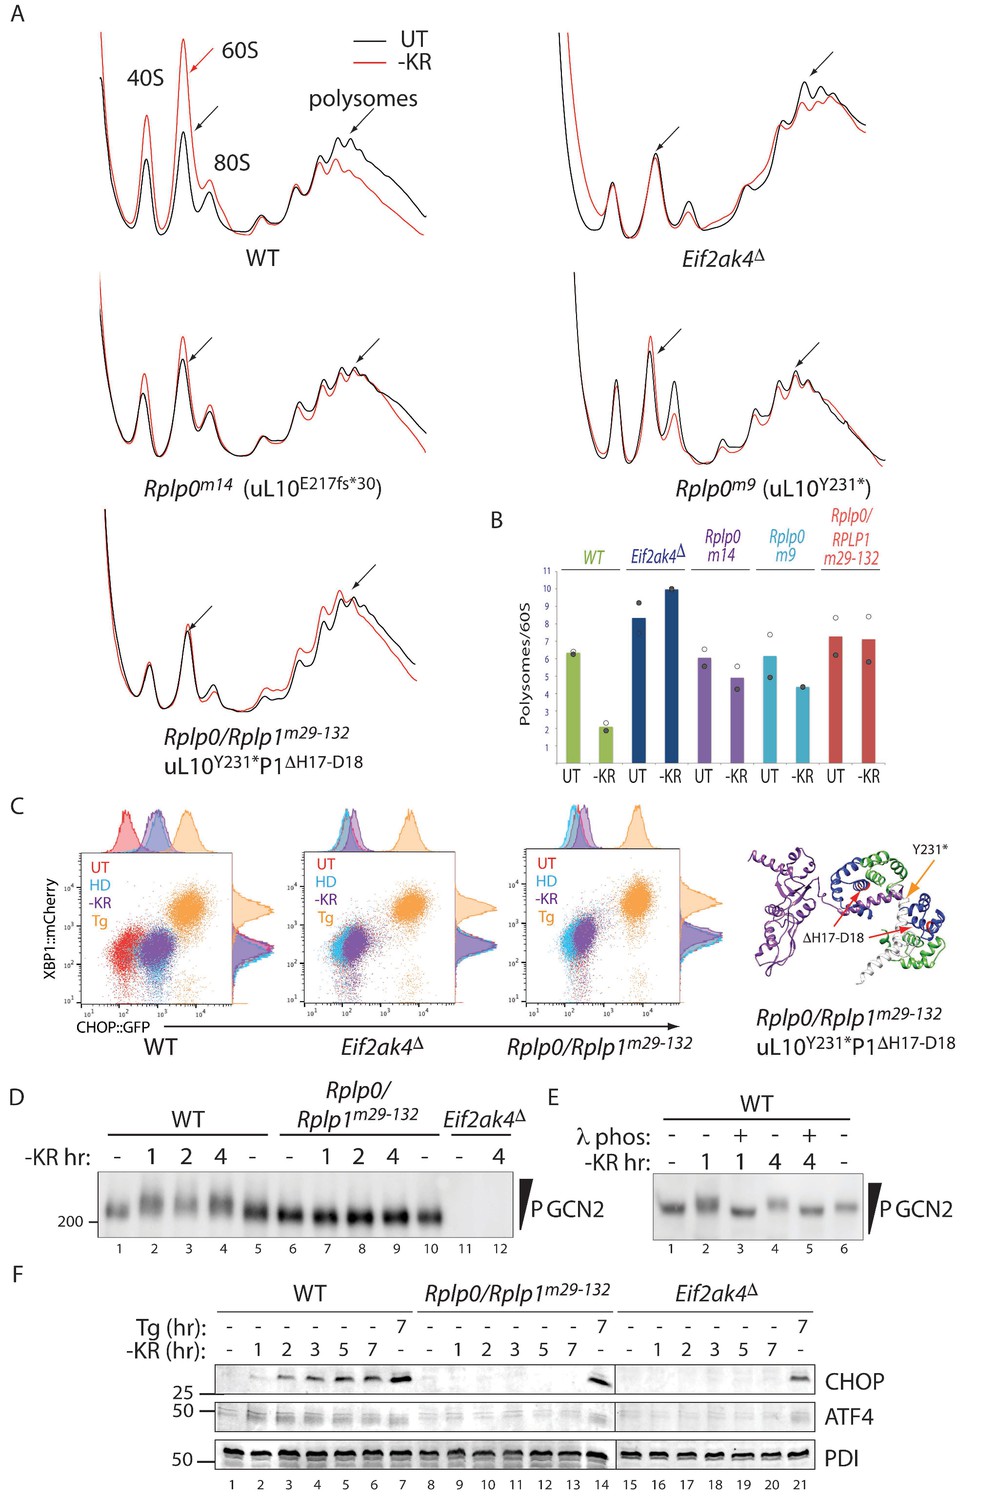
Impaired translational control, GCN2 activation, and ISR induction in amino acid starved P-stalk mutant cells.
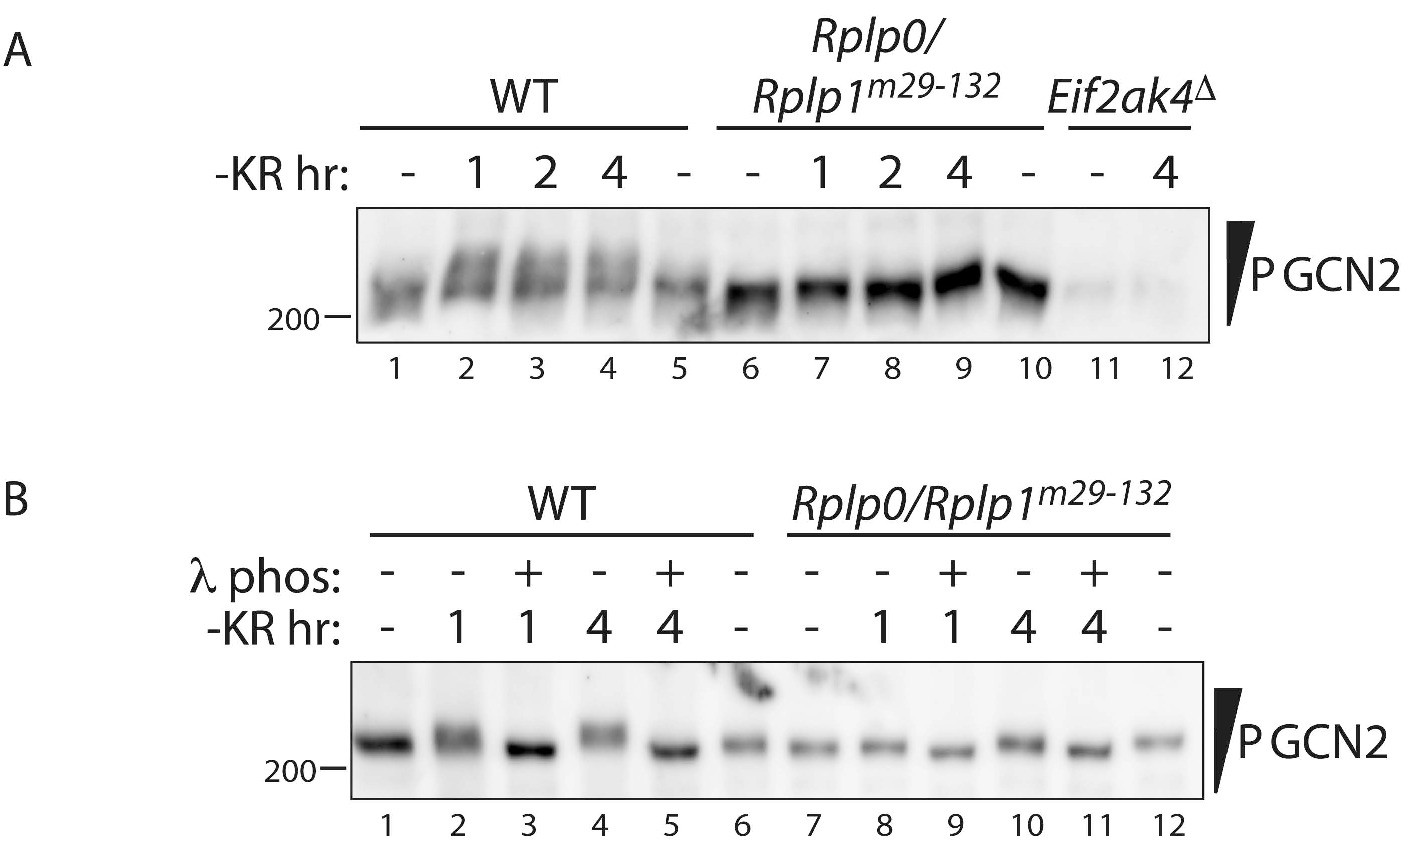
(A) Overlaid A260 traces from 10–50% sucrose gradients loaded with cytoplasmic extracts from wildtype and the indicated mutant cells left untreated (UT, black) or starved for lysine and arginine (-KR, red). The 40S, 60S, 80S, and polysome peaks are labeled for orientation. Note the marked re-distribution of ribosomes from the denser polysome fractions to the lighter fractions in stressed wildtype cells, the lack of such redistribution in both the GCN2-ablated Eif2ak4∆ and compound P-stalk lesioned Rplp0/Rplp1m29-132 mutants and the partial defect in the weaker Rplp0m14 and Rplp0m9 mutants. Shown are representative traces of A260 (vertical axis) vs. sedimentation velocity (horizontal axis) from one of two such experiments. (B) Bar diagram of the ratio of the polysome to the free 60S subunit signal in stressed and unstressed cells of all five genotypes in the two experiments. The height of the bar reflects the mean of two experiments with values from matched experiments shown in open and closed circles respectively. (C) Flow cytometry analysis of wildtype (WT), GCN2-ablated (Eif2ak4∆) or the compound P-stalk Rplp0/Rplp1m29-132 double mutant cells with treatments as in Figure 2A indicated. To the right is a ribbon diagram of the P-stalk (color coded as in Figure 2B). The red arrows point to the (H17–D18) deletion in P1 and the orange arrow to the truncation in uL10 at Y231. (D) GCN2 immunoblot of extracts from wildtype (WT), compound P-stalk Rplp0/Rplp1m29-132 double mutant cells, or GCN2-ablated Eif2ak4Δ mutant cells, untreated or starved of lysine and arginine (-KR) resolved by phos-tag SDS-PAGE. (E) As in ‘D’ but following in vitro exposure of the lysate to λ phosphatase (λ phos). (F) CHOP and ATF4 immunoblots of extracts from wildtype (WT), compound P-stalk Rplp0/Rplp1m29-132 double mutant cells and GCN2-ablated Eif2ak4Δ mutant cells, untreated, starved of lysine and arginine (-KR) or exposed to 1 μM thapsigargin (Tg) for the indicated time. Protein disulfide isomerase (PDI) serves as a loading control.
Figure 3—figure supplement 1
Impaired translational control, GCN2 activation, and ISR induction in amino acid starved P-stalk mutant cells (reporting on reproducibility of the observations shown in Figure 3).
(A) GCN2 immunoblot of extracts from wildtype (WT), compound P-stalk Rplp0/Rplp1m29-132 double mutant cells, or GCN2-ablated Eif2ak4Δ mutant cells, untreated or starved of lysine and arginine (-KR) resolved by phos-tag SDS-PAGE. (B) As in ‘B’ but following in vitro exposure of the lysate to λ phosphatase (λ phos).
Figure 4
Defective ribosome association of P1 and P2 in mutant CHO cells.
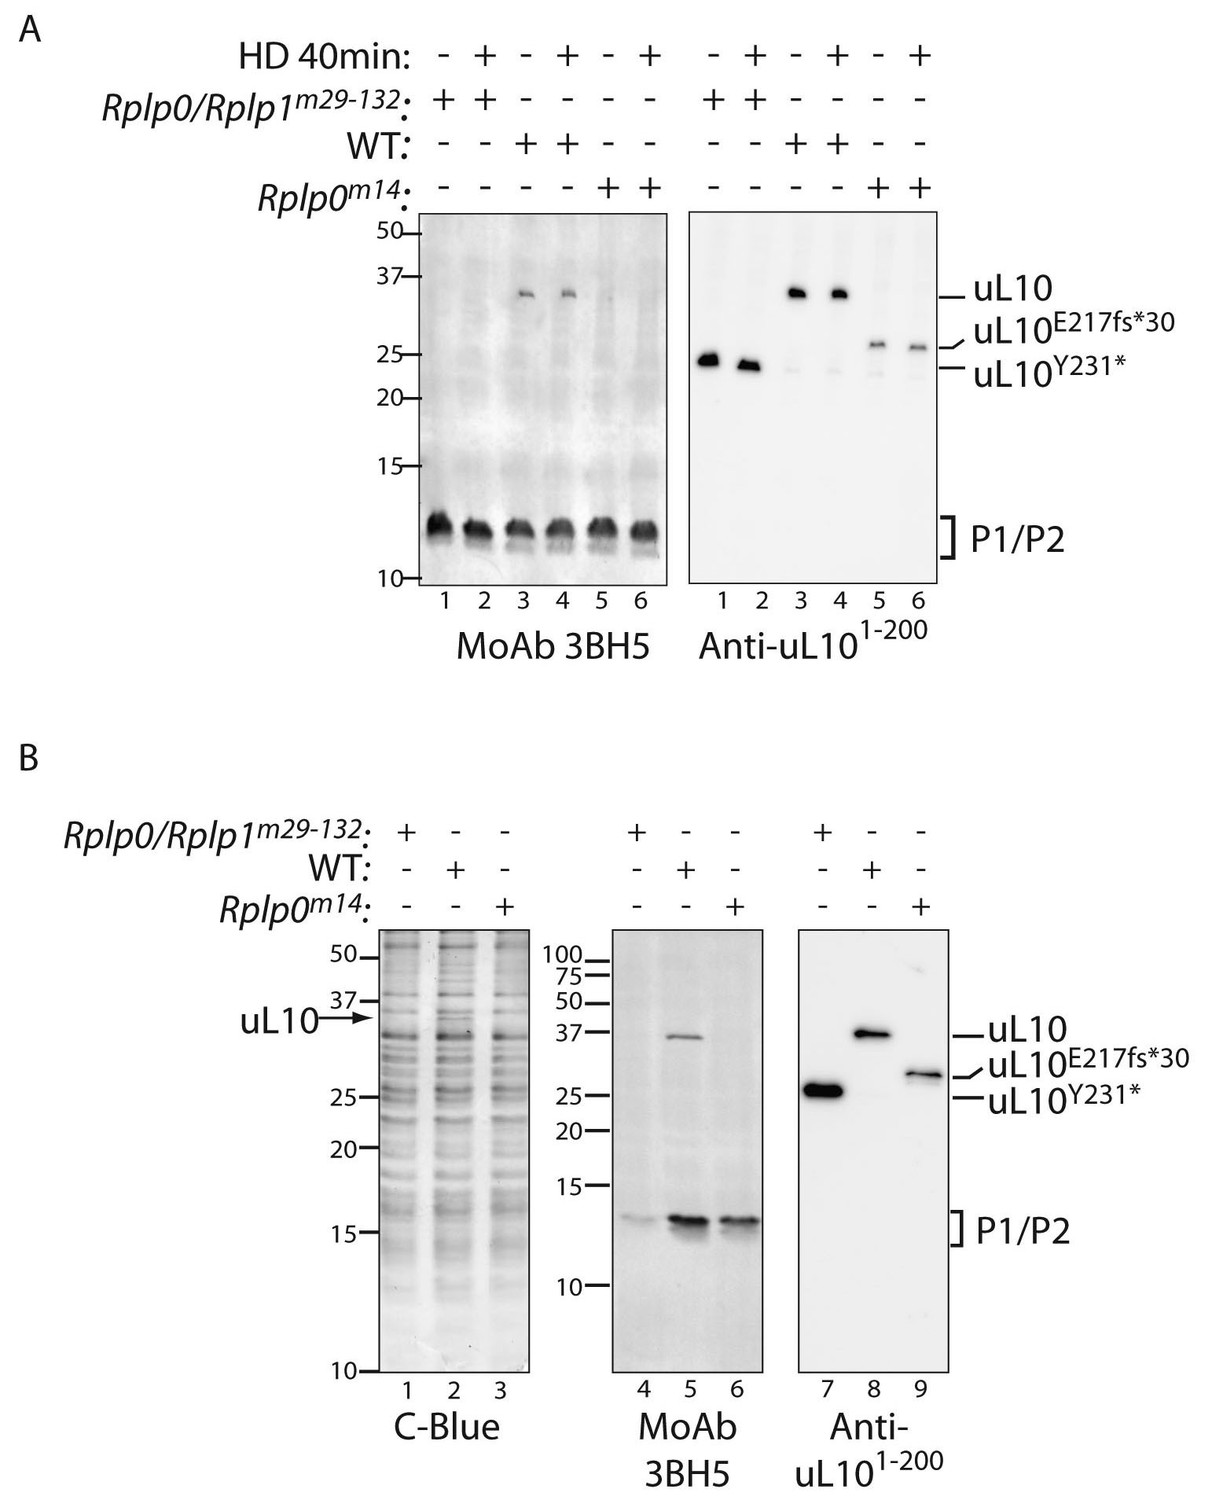
(A) Immunoblot of cytoplasmic extracts from untreated or histidinol-treated (HD, 0.5 mM) wildtype and the indicated mutant CHO cells. The polyclonal serum (anti uL101-200) recognizes the N-terminal portion of uL10 and the monoclonal antibody (MoAb 3BH5) recognizes the conserved acidic C-terminus of all three P-stalk proteins. The deletion mutants of uL10 are readily distinguishable in both immunoblots, but wildtype P1, P2, and the P1∆H17-D18 mutant are not resolved. (B) Coomassie blue stained SDS-PAGE gel (left) and immunoblots of the protein content of ribosomes purified from wildtype (WT) or mutant CHO cells as in ‘A’ above. Note the near absence of P1/P2 proteins associated with ribosomes purified from the Rplp0/Rplp1m29−132 mutant cells, despite their presence in the whole cell extract (above).
Figure 5 with 1 supplement

P-stalk lesions impair ribosome stimulation of eIF2α directed GCN2 kinase activity.
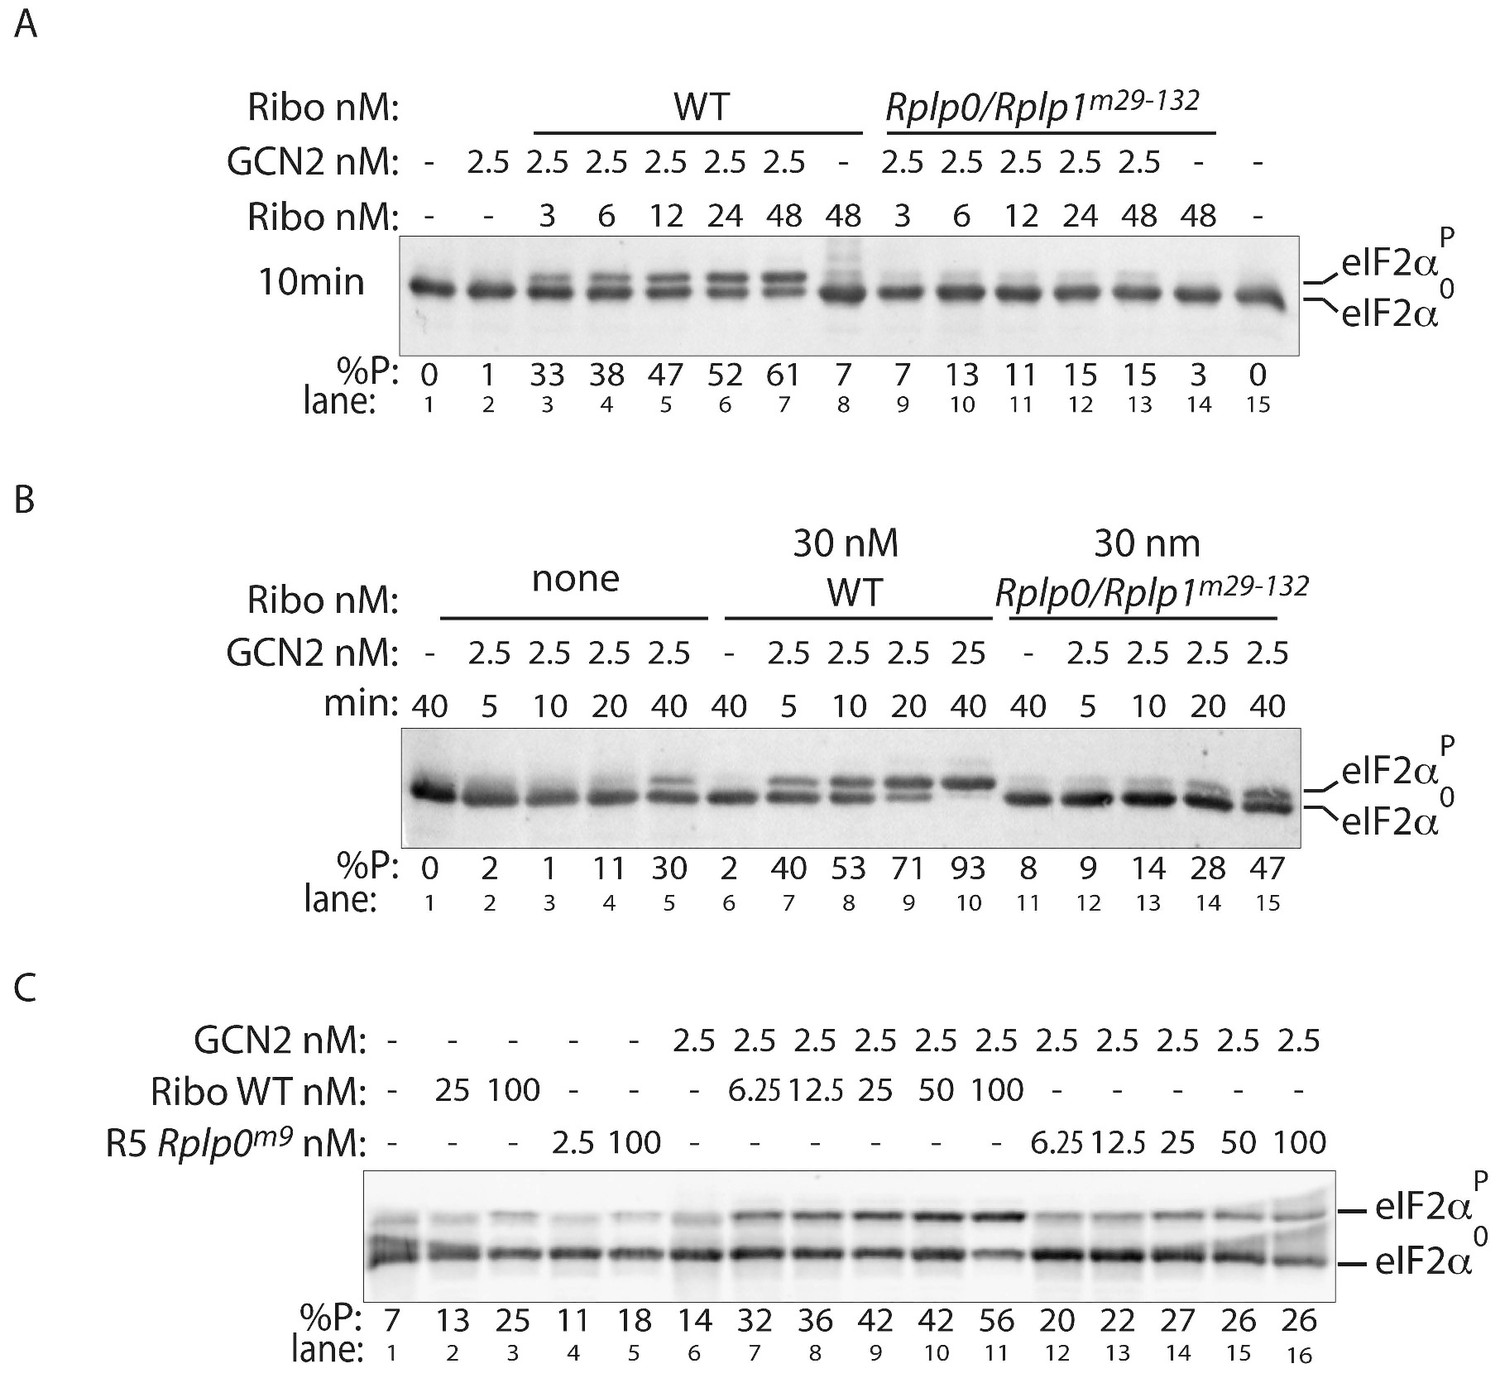
(A) Immunoblot of eIF2α from in vitro phosphorylation reactions resolved by phos-tag SDS-PAGE. The concentration of purified GCN2 kinase, ribosomes, and the genotype of the ribosomes is indicated above the panel. The fraction of phosphorylated eIF2α is below the panel, the incubation time is on the left, and the migration of the phosphorylated (eIF2αP) and non-phosphorylated protein (eIF2α0) is on the right. (B) A time course of eIF2α phosphorylation reactions with 30 nM ribosomes annotated as in ‘A’ above. (C) Graph depicting the percent phosphorylation plotted against time from reactions shown in ‘B’ above and two similar experiments, all data points are shown along with the mean and range. (Shown are representative of experiments reproduced more than three times with independently isolated wildtype and mutant ribosomes).
Figure 5—figure supplement 1
P-stalk lesions (reproducibly) impair ribosome stimulation of eIF2α directed GCN2 kinase activity.
(A) Immunoblot of eIF2α from in vitro phosphorylation reactions resolved by phos-tag SDS-PAGE, as in Figure 5A but utilizing different preparation of wildtype and Rplp0/Rplp1m29-132 compound mutant ribosomes. Reaction time was 10 min (B) Time course, as in Figure 5B but utilizing different preparation of wildtype and Rplp0/Rplp1m29-132 compound mutant ribosomes (at 30 nM) or no ribosomes. (C) As in ‘A’ above but using wildtype or Rplp0m9 mutant ribosomes. (Shown are representative of experiments reproduced at least twice).
Figure 6 with 1 supplement
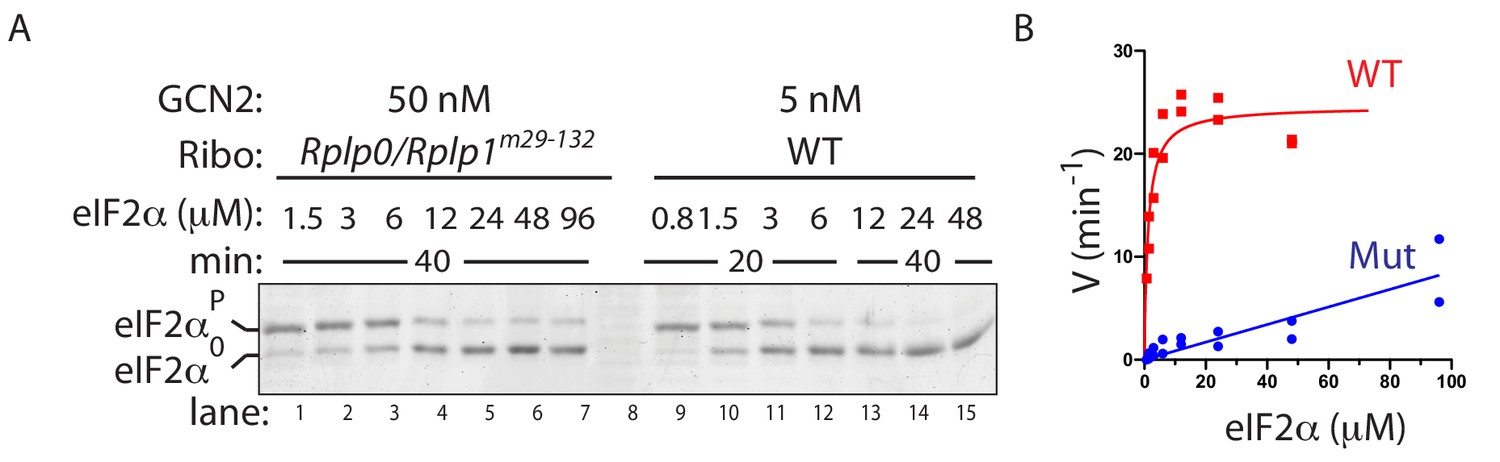
Ribosome activation alters GCN2 enzyme kinetics.
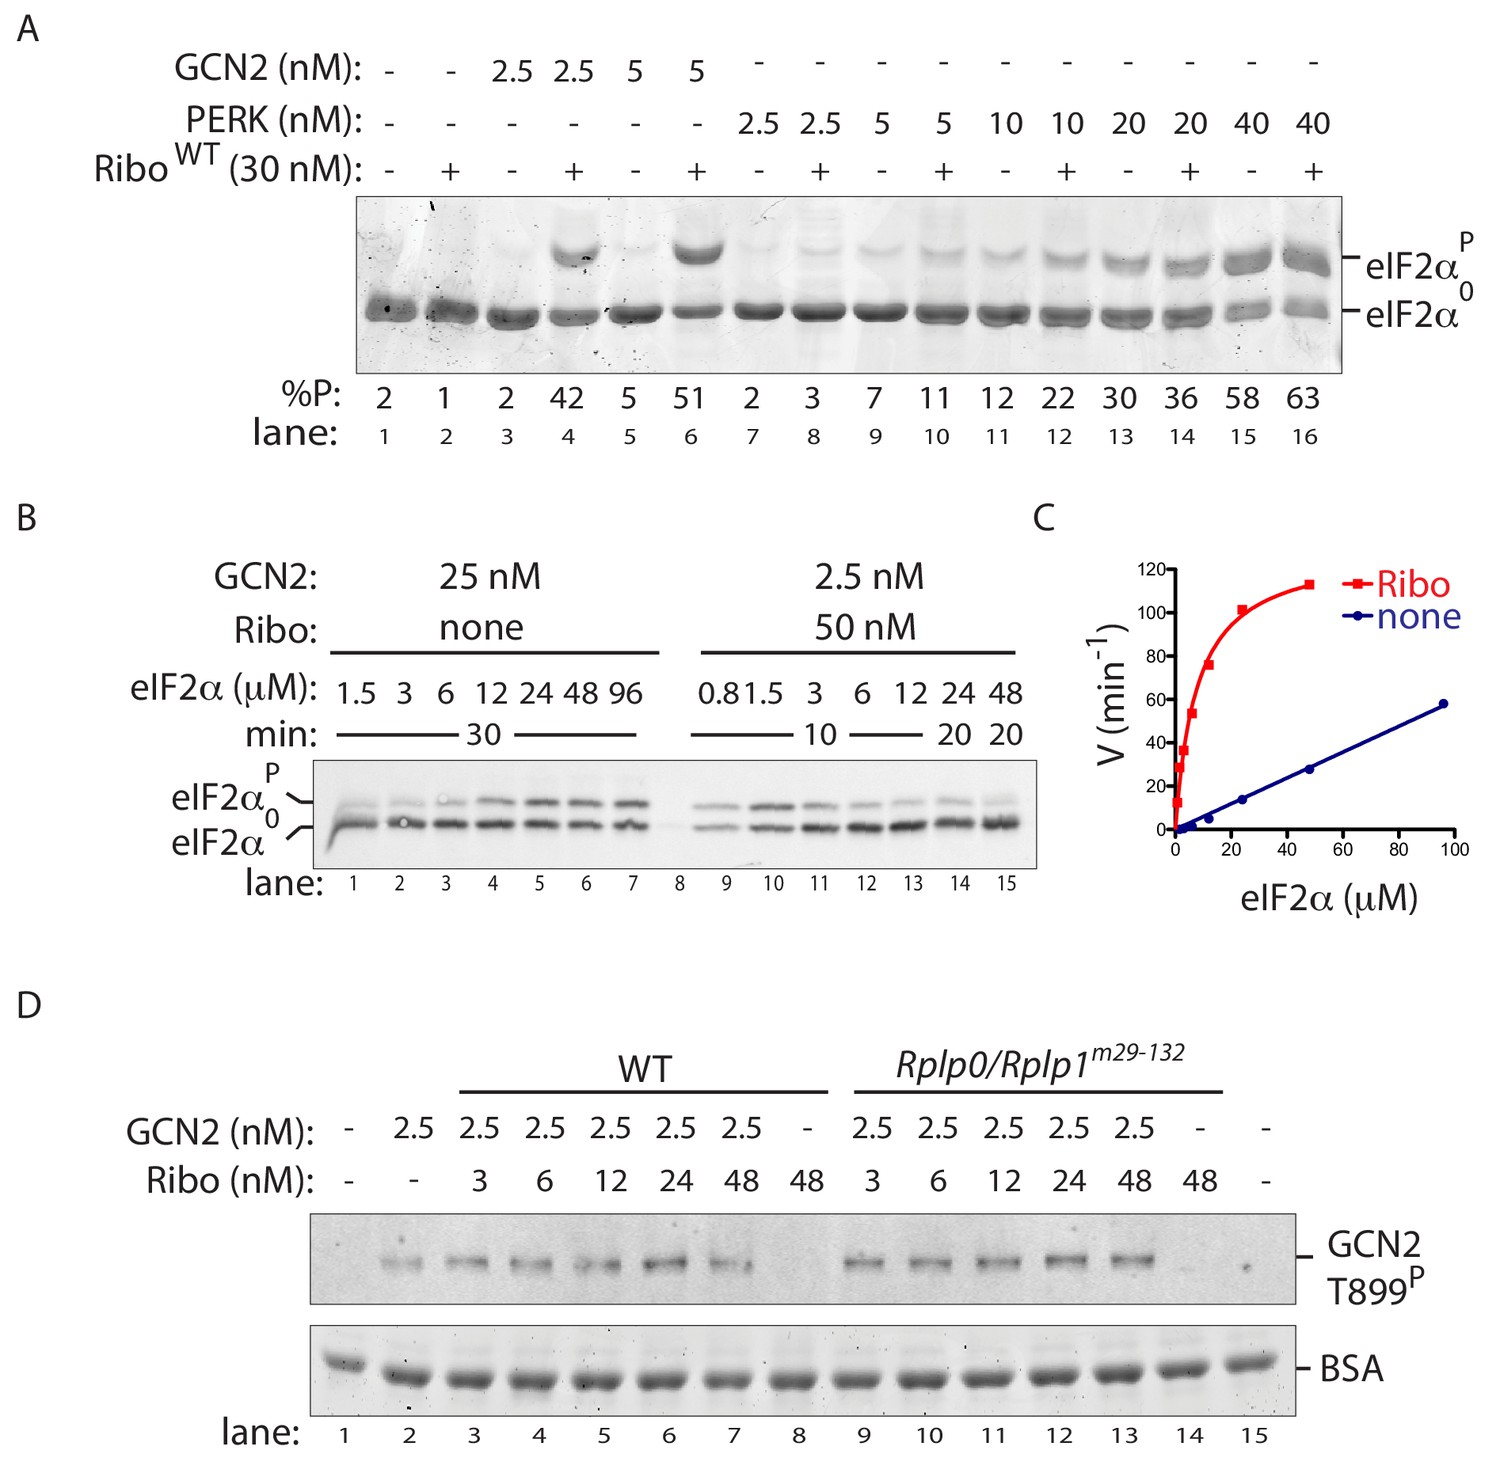
(A) Coomassie-stained phos-tag PAGE of eIF2α from in vitro phosphorylation reactions with purified GCN2 or the cytosolic kinase domain of PERK, in presence or absence of wildtype ribosomes. (B) Immunoblot of eIF2α from in vitro phosphorylation reactions with escalating concentration of eIF2α substrate. Aliquots of each reaction containing equal amounts of eIF2α (~120 ng) were applied to the phos-tag gel. (Shown is a representative of experiments reproduced twice). (C) Plot of individual values of enzyme velocity (in min−1) against substrate concentration (in µM) of the reactions shown in ‘B’ and Michaelis–Menten curve fit. Reactions with ribosomes appears to reach saturation at around 50 μM eIF2α whereas reactions without ribosomes exhibited no saturation at the highest concentrations tested. (D) Top panel: Immunoblot of phospho-GCN2-T899P signal from reactions incubated for 10 min with the indicated concentration of wildtype or mutant ribosomes in the presence of ATP. Lower panel: Coomassie-stain of the bovine serum albumin present in all reactions and serving as a recovery marker.
Figure 6—figure supplement 1
Ribosome activation alters GCN2 enzyme kinetics.
(A) Immunoblot of eIF2α from in vitro phosphorylation reactions with escalating concentration of eIF2α substrate and ribosomes from cells of the indicated genotype (added at 30 nM). Aliquots of each reaction containing equal amounts of eIF2α (~120 ng) were applied to the phos-tag gel. (Shown is a representative of experiments reproduced twice). (B) Plot of individual values of enzyme velocity (in min−1) against substrate concentration (in µM) of the reactions from two experiments (as in ‘A’) and Michaelis–Menten curve fit. Reactions with wildtype ribosomes were saturable whereas reactions with mutant ribosomes exhibited no saturation at the highest concentrations of substrate tested. The difference in the absolute values of reaction velocity in comparison with the experiment shown in Figure 6C likely reflects differences in the specific activity of the GCN2 enzyme used.
Figure 7
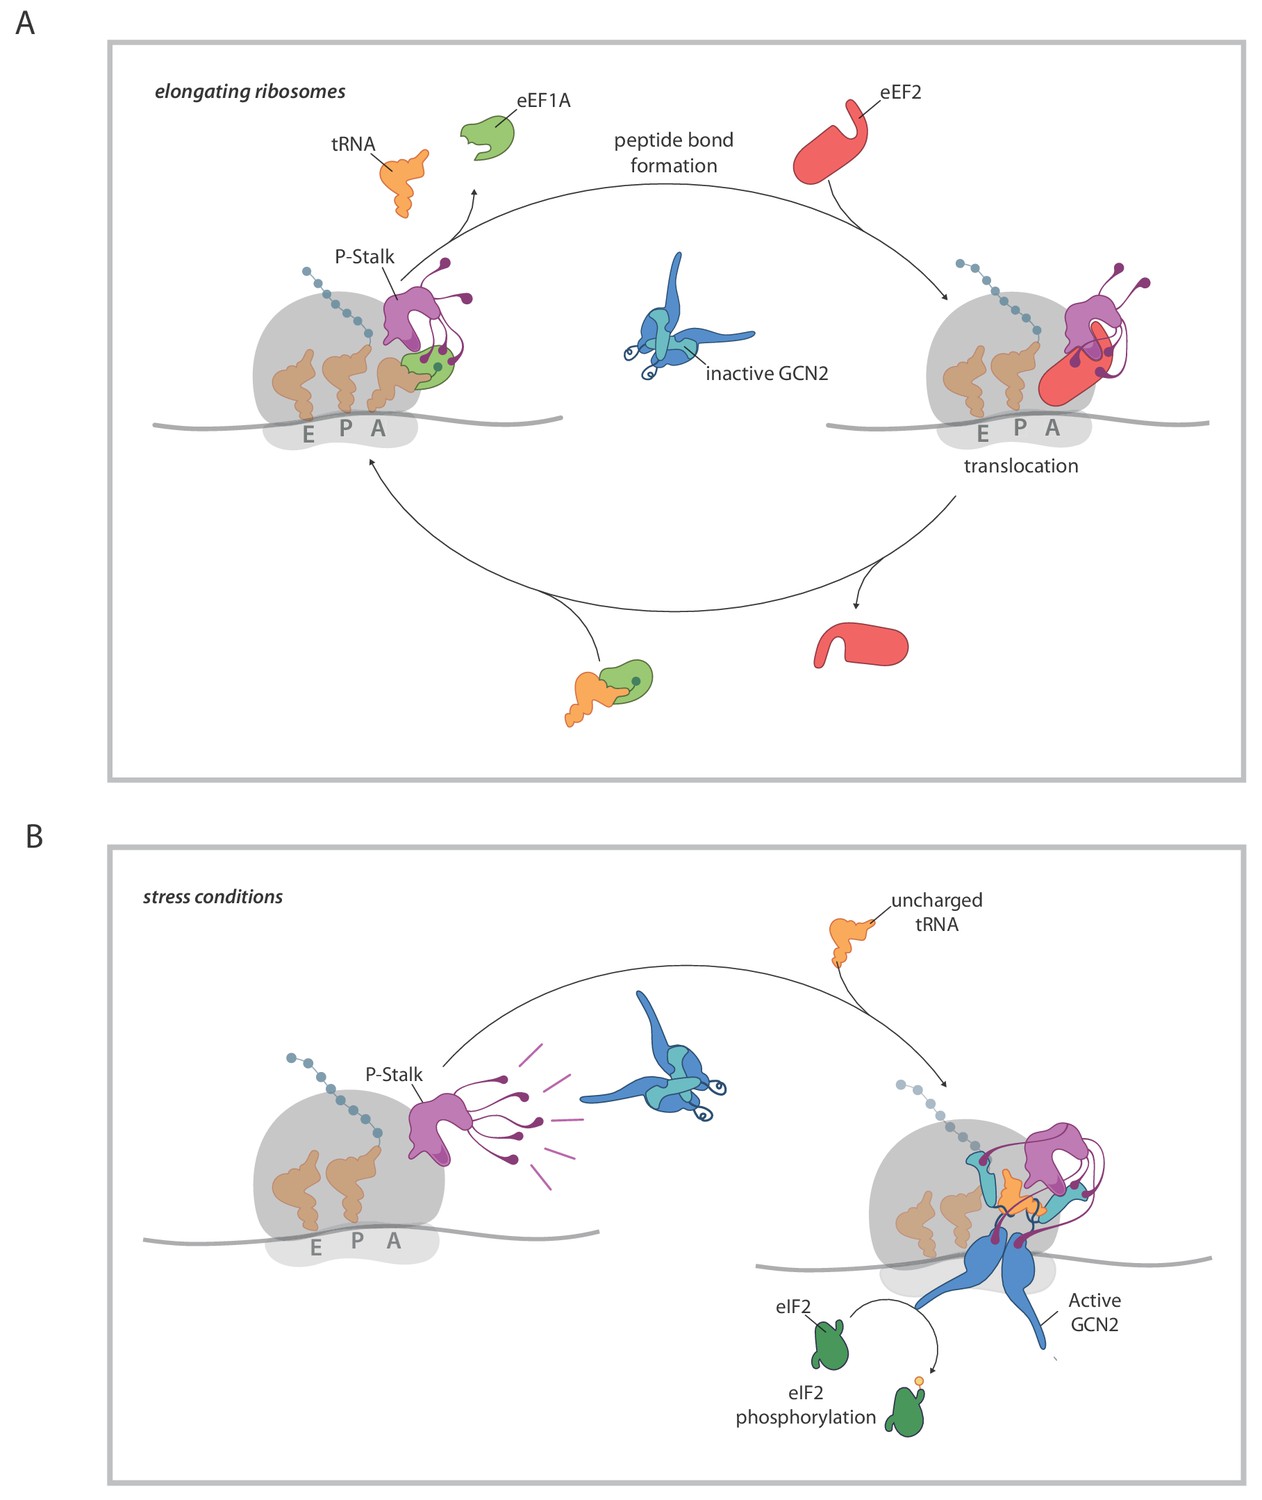
A model for ribosome state-dependent GCN2 activation by the P-stalk.
(A) In amino acid replete cells, charged tRNAs and elongation factors eEF1A and eEF2 cycle through the GTPase associated centre repressing the P-stalk’s latent ability to activate GCN2. Repression may arise from competition for domain II of uL10 (a GCN2 binding site, shaded deep purple), engagement of the acid C-terminal tails of the pentameric P-stalk (cartooned as tentacle-like extensions) or imposition of a conformation that is not conducive to GCN2 activation, amongst other mechanisms. (B) By limiting the pool of charged tRNAs, amino acid starvation or inhibition of tRNA synthetases disrupts the cycling of factors through the GTPase associated centre exposing the latent ability of the P-stalk to activate GCN2. This is speculatively presented as arising from the sequential binding of inactive GCN2 to the P-stalk and a subsequent activation step in which the acid C-terminal tails play a role. Active GCN2 (possibly in complex with uncharged tRNAs engaging its HisRS domain (pale blue)) phosphorylates its substrate, eIF2α.
Additional files
-
Supplementary file 1
Key resources table.
- https://cdn.elifesciences.org/articles/50149/elife-50149-supp1-v2.xlsx
-
Transparent reporting form
- https://cdn.elifesciences.org/articles/50149/elife-50149-transrepform-v2.docx
Download links
A two-part list of links to download the article, or parts of the article, in various formats.
Downloads (link to download the article as PDF)
Open citations (links to open the citations from this article in various online reference manager services)
Cite this article (links to download the citations from this article in formats compatible with various reference manager tools)
The ribosomal P-stalk couples amino acid starvation to GCN2 activation in mammalian cells
eLife 8:e50149.
https://doi.org/10.7554/eLife.50149


