Figures
Figure 1 with 5 supplements
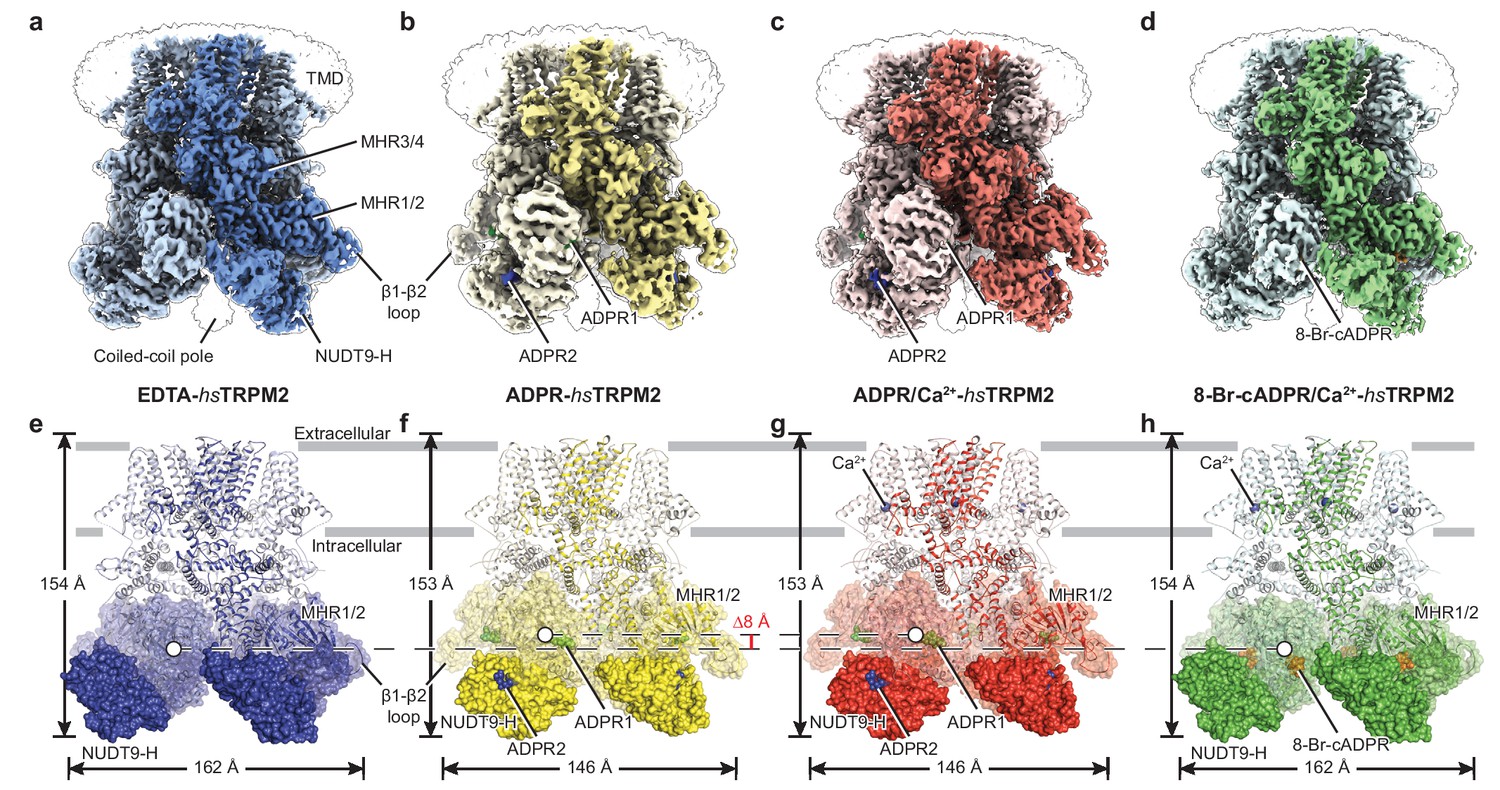
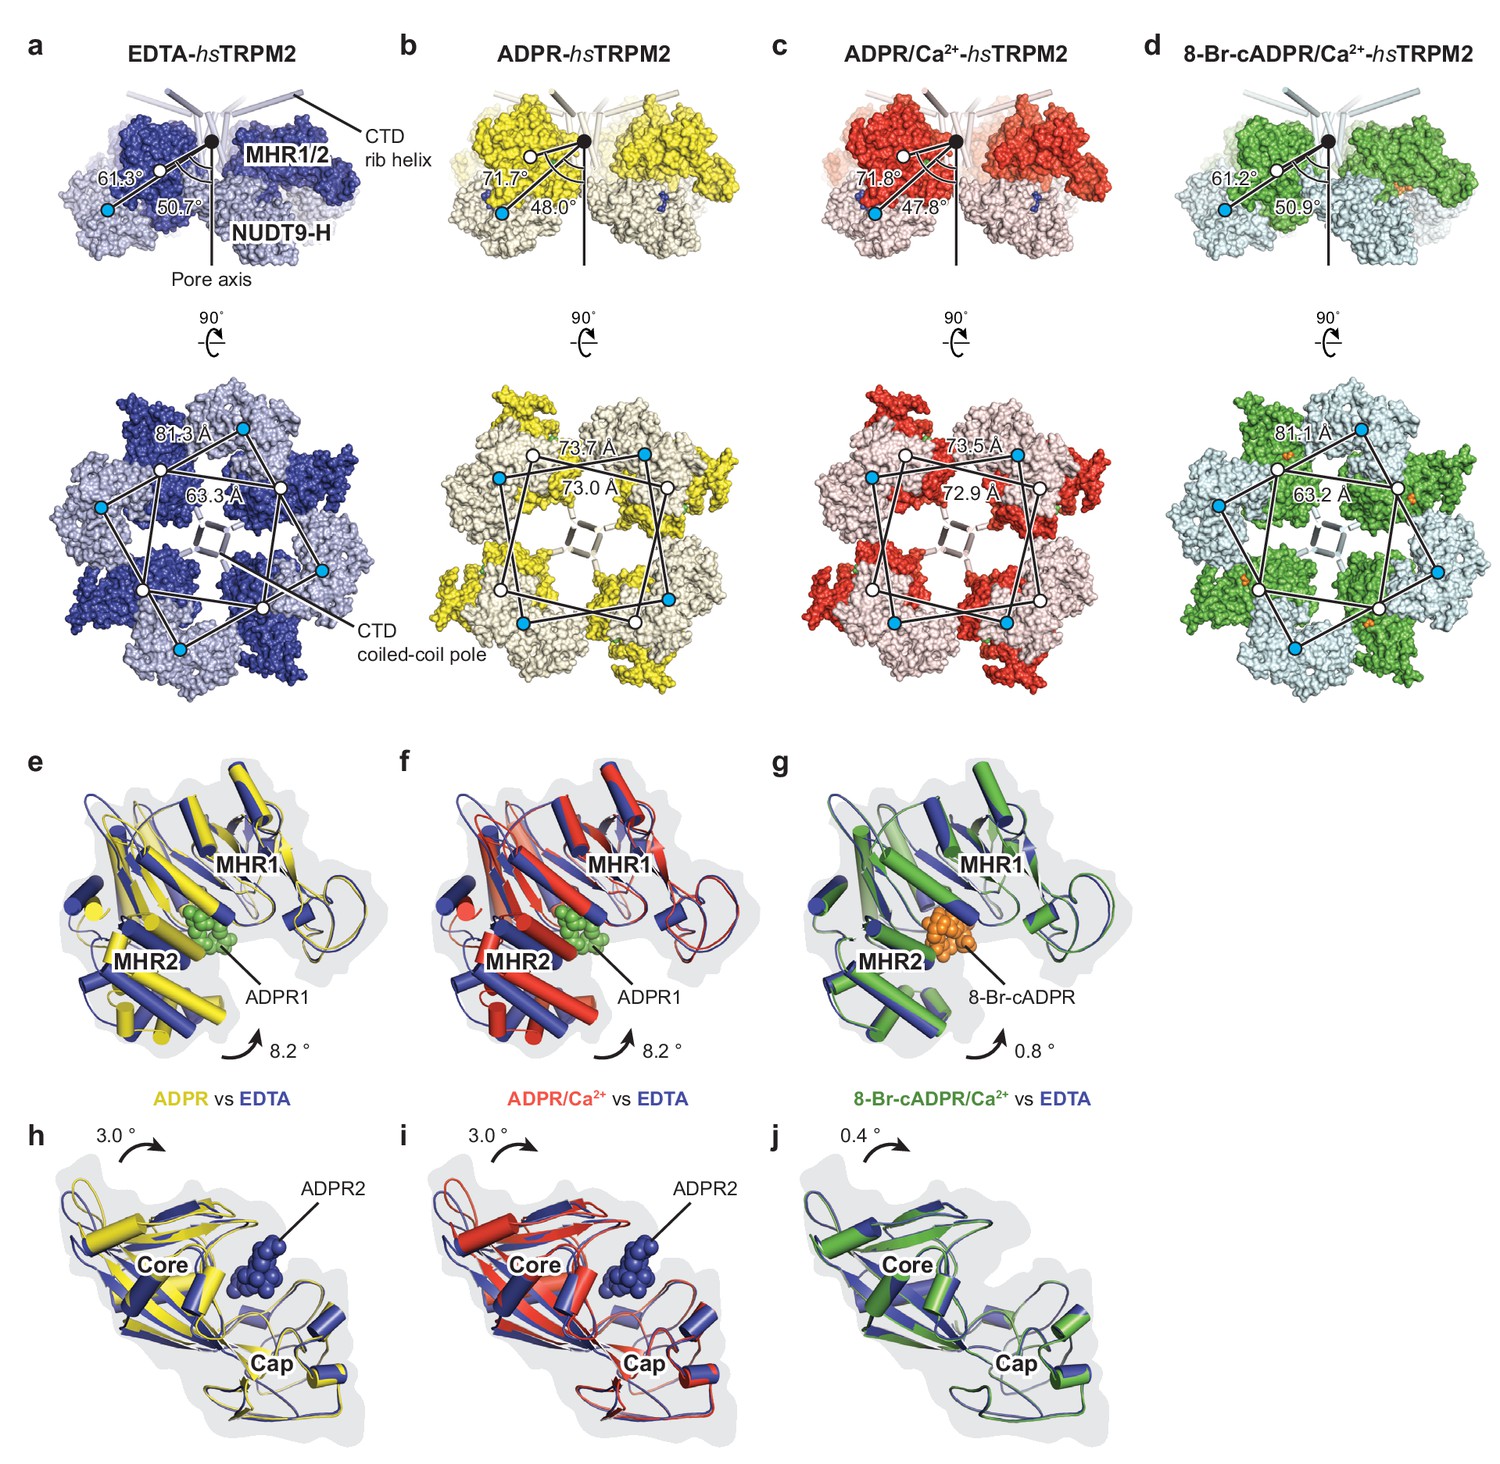
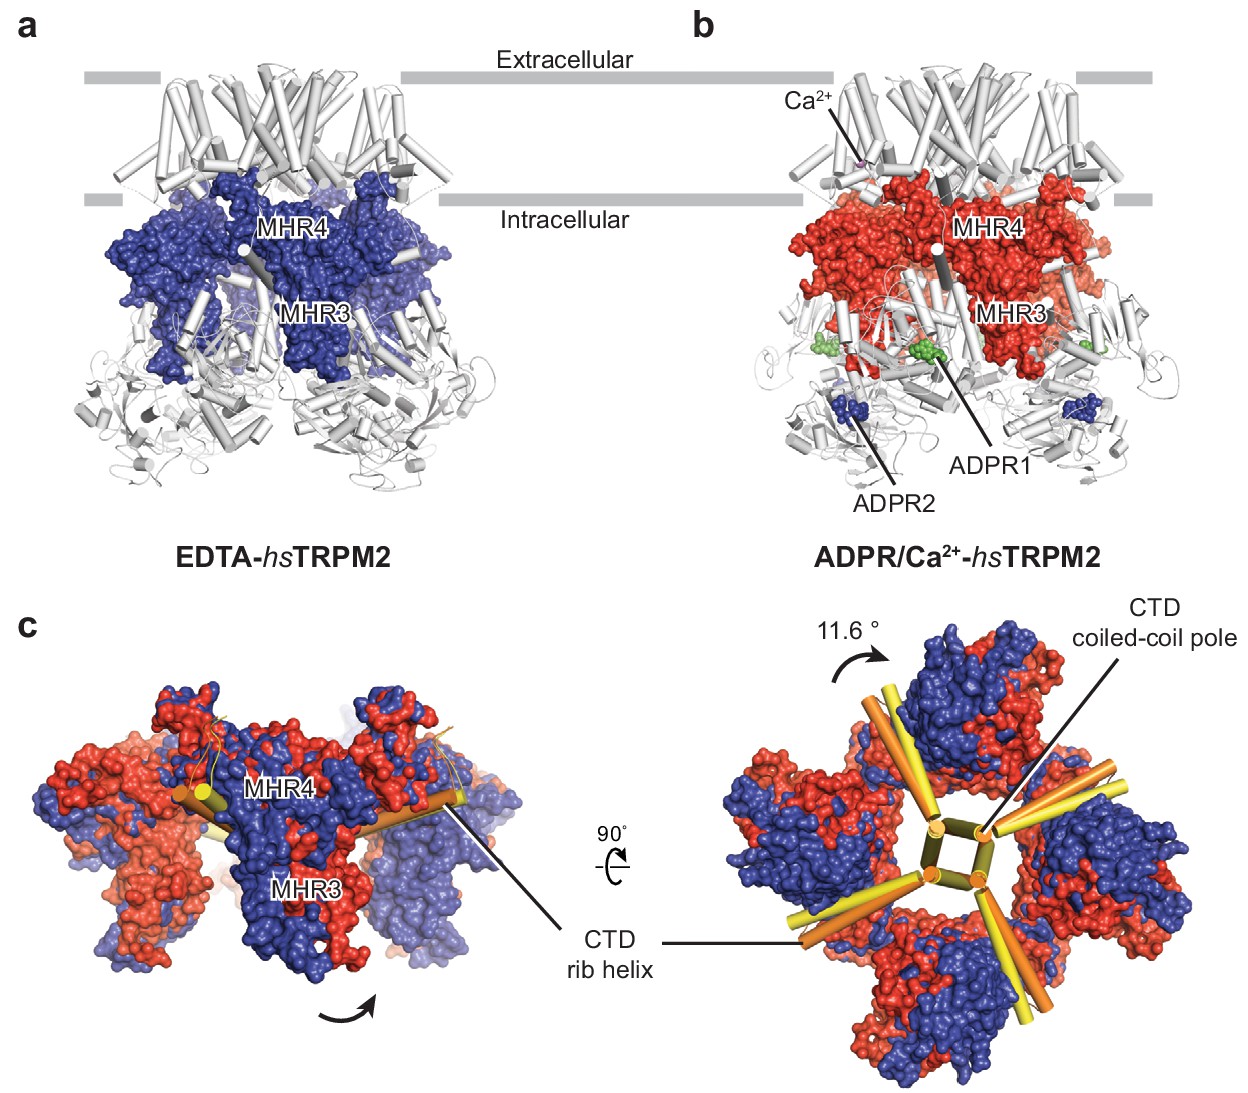
The overall architecture of hsTRPM2.
The three-dimensional reconstructions of (a) EDTA-hsTRPM2, (b) ADPR-hsTRPM2, (c) ADPR/Ca2+-hsTRPM2, and (d) 8-Br-cADPR/Ca2+-hsTRPM2. The unsharpened reconstructions are shown as transparent envelopes. One subunit is highlighted. (e–h) Atomic models of the corresponding reconstructions in panels a-d. The NUDT9-H domains are shown in solid surface, the MHR1/2 domains are shown in transparent surface, and the rest of the proteins are shown in cartoon representation. Ca2+, ADPR1, ADPR2, and 8-Br-cADPR are shown in purple, green, blue, and orange spheres, respectively. The center-of-mass (COM) of the MHR1/2 domain of one subunit in each structure is shown as a circle filled with white. The dimensions of the proteins and the difference between COMs along the pore axis are labeled.
Figure 1—figure supplement 1
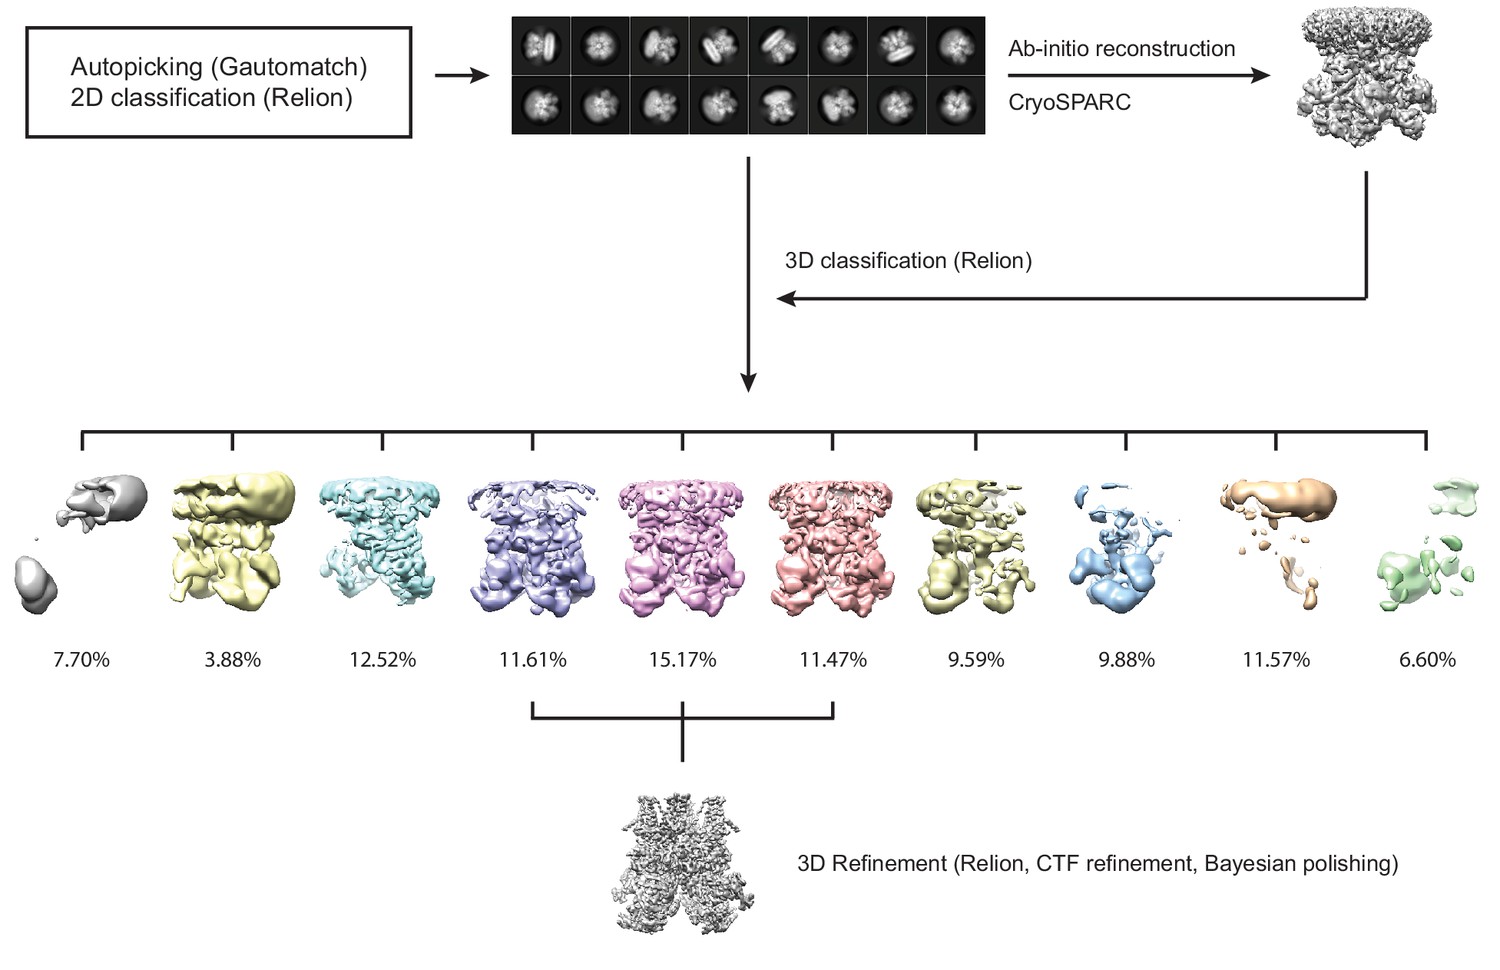
The cryo-EM data processing flowchart for hsTRPM2 using the data of ADPR/Ca2+-hsTRPM2 as an example.
https://doi.org/10.7554/eLife.50175.003
Figure 1—figure supplement 2
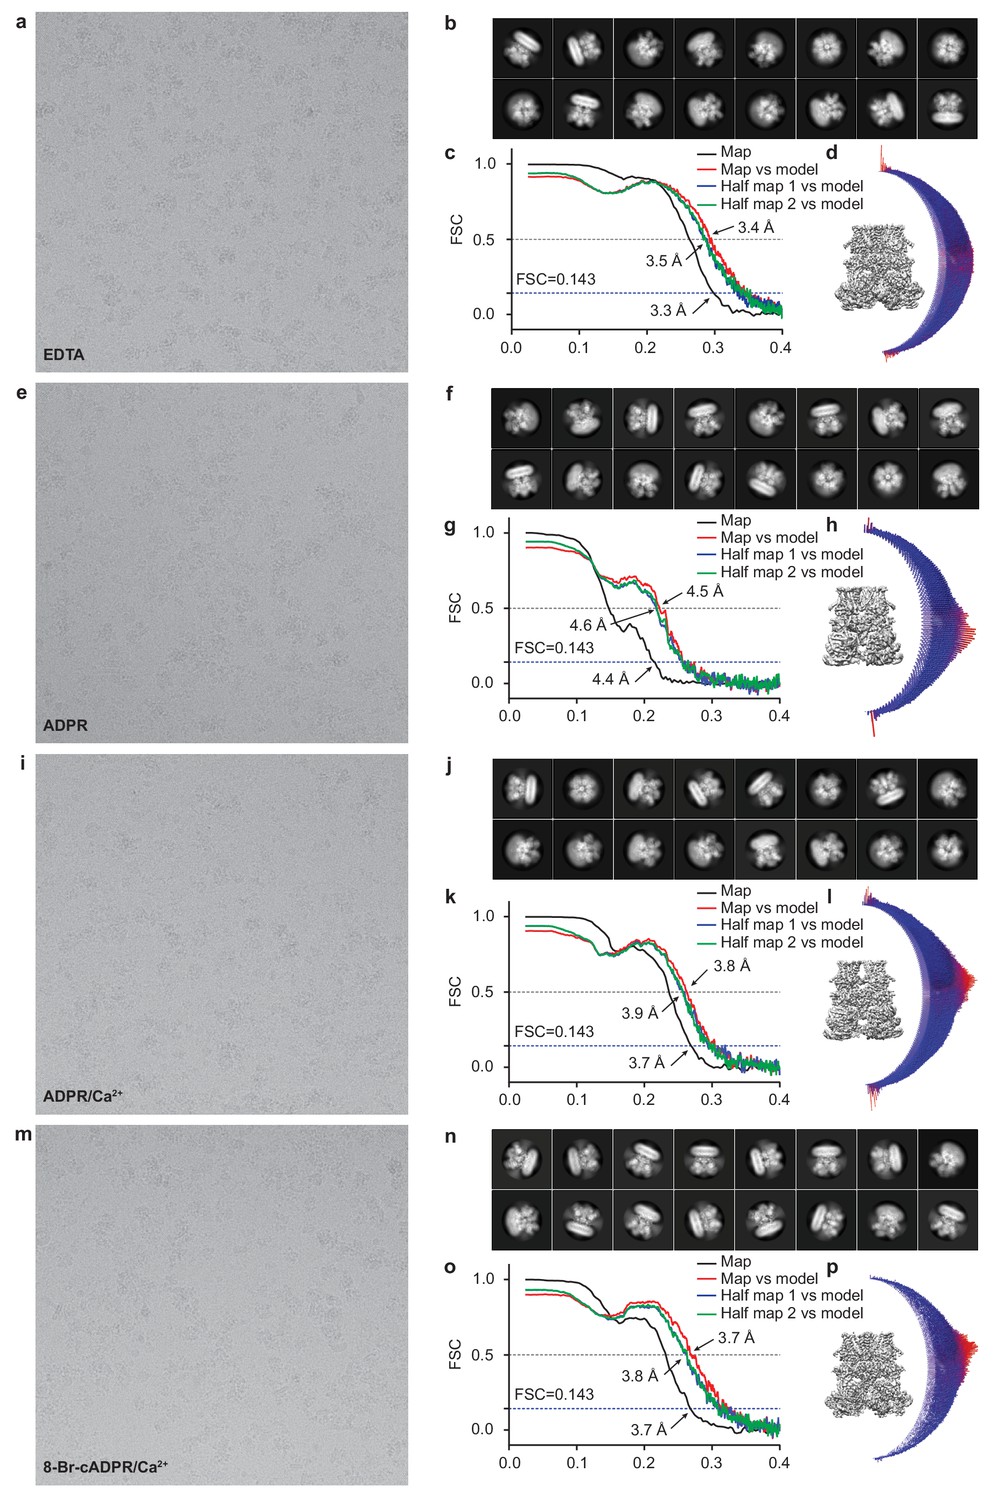
Cryo-EM data analysis of hsTRPM2.
Representative electron micrograph; 2D class averages; the gold-standard Fourier shell correlation (FSC) curves for the electron microscopy map; the FSC curves between the atomic model and the final electron microscopy map; and angular distribution of refined particles for EDTA-hsTRPM2 (a–d), ADPR-hsTRPM2 (e–h), ADPR/Ca2+-hsTRPM2 (i–l), and 8-Br-cADPR/Ca2+-hsTRPM2 (m–p).
Figure 1—figure supplement 3
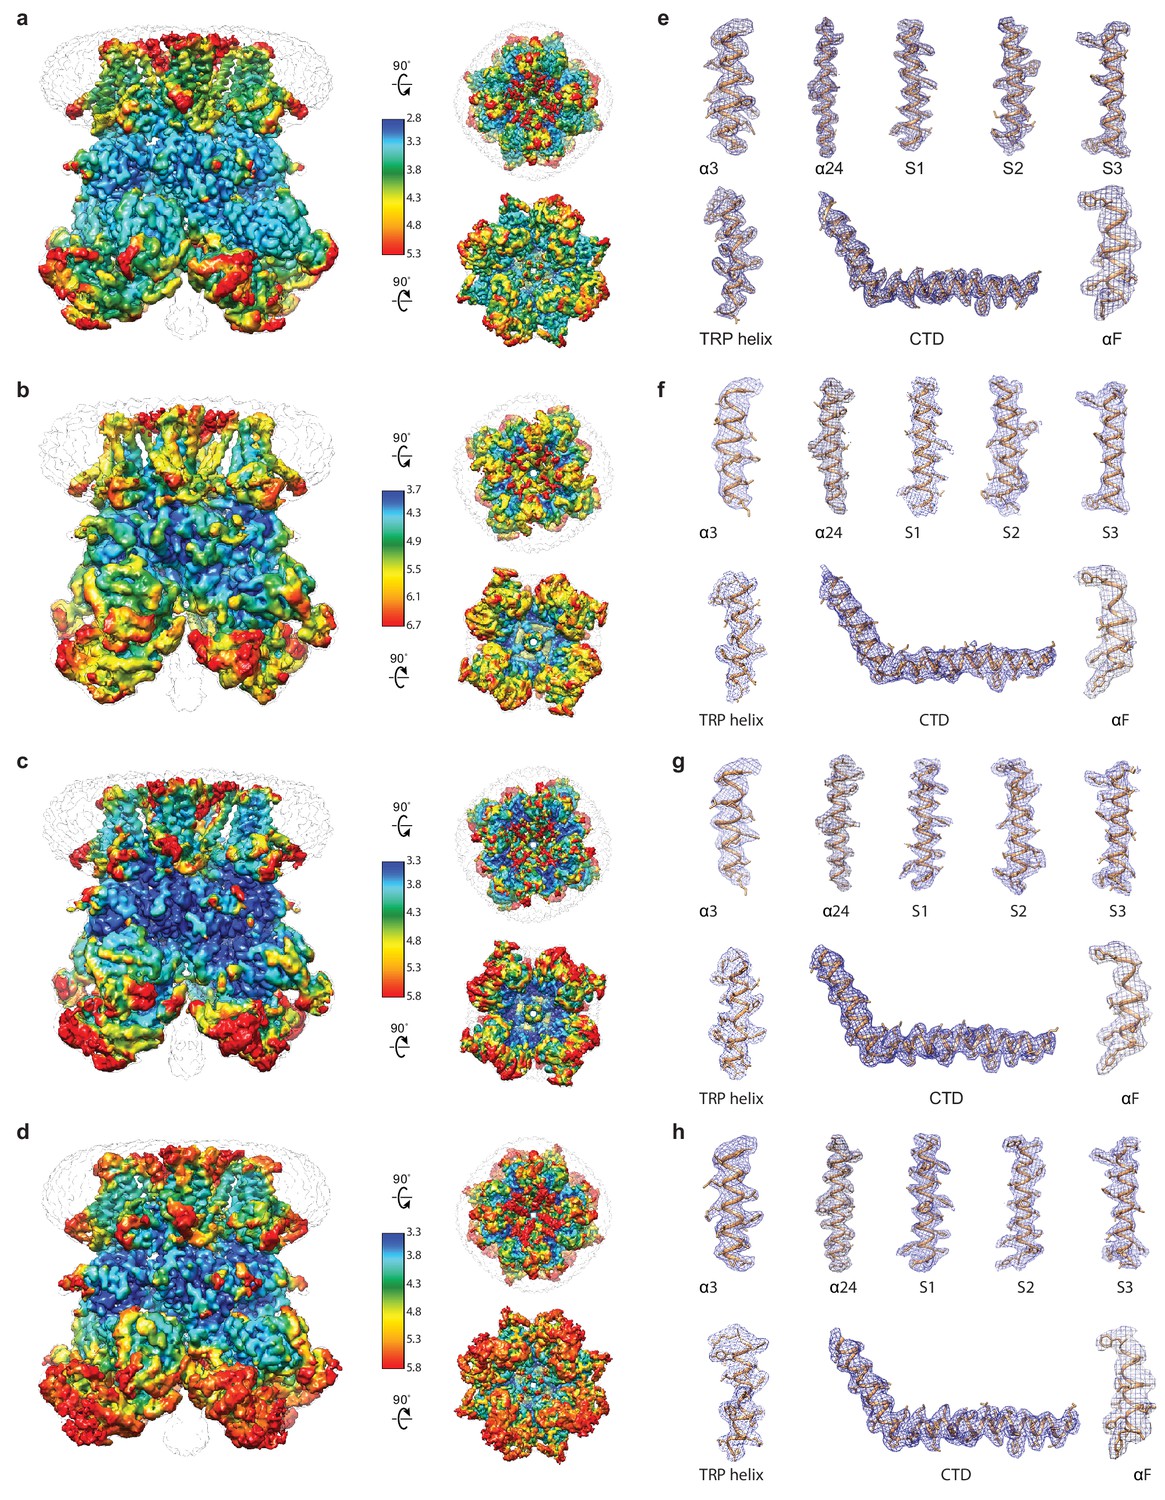
Local resolution estimation and representative densities of hsTRPM2 structures.
(a–d) Local resolution estimation of EDTA-hsTRPM2 (a), ADPR-hsTRPM2 (b), ADPR/Ca2+-hsTRPM2 (c), and 8-Br-cADPR/Ca2+-hsTRPM2 (d). The map is color-coded according to local resolution estimation. The unsharpened reconstructions are shown as transparent envelopes. (e–h) Representative densities of EDTA-hsTRPM2 (e), ADPR-hsTRPM2 (f), ADPR/Ca2+-hsTRPM2 (g), and 8-Br-cADPR/Ca2+-hsTRPM2 (h).
Figure 1—figure supplement 4

Ligand densities.
(a) The 2D chemical structures of ADPR and 8-Br-cADPR. (b) The densities for ADPR and 8-Br-cADPR in the full map, half map 1 and half map 2 of ADPR-hsTRPM2, ADPR/Ca2+-hsTRPM2 and 8-Br-cADPR/Ca2+-hsTRPM2.
Figure 1—figure supplement 5

Comparison of the structures of hsTPPM2, drTRPM2, and nvTRPM2.
The atomic models of EDTA-hsTRPM2 (a), ADPR/Ca2+-hsTRPM2 (b), EDTA-drTRPM2 (c), ADPR/Ca2+-drTRPM2 (d), and Ca2+-nvTRPM2 (e). The NUDT9-H domains are shown as a solid surface; the MHR1/2 domains are shown as transparent surfaces; and the rest of the proteins are shown in cartoon representation. The Ca2+, ADPR1, ADPR2, and 8-Br-cADPR are shown in purple, green, blue, and orange spheres, respectively. The center-of-mass (COM) of the MHR1/2 domain of one subunit in each structure is shown as a circle filled with white. The dimensions of the proteins, as well as the difference between COMs along pore axis are labeled. The invisible NUDT9-H domains in Ca2+-nvTRPM2 (e) are shown in cartoon representation with a dashed outline.
Figure 2 with 1 supplement
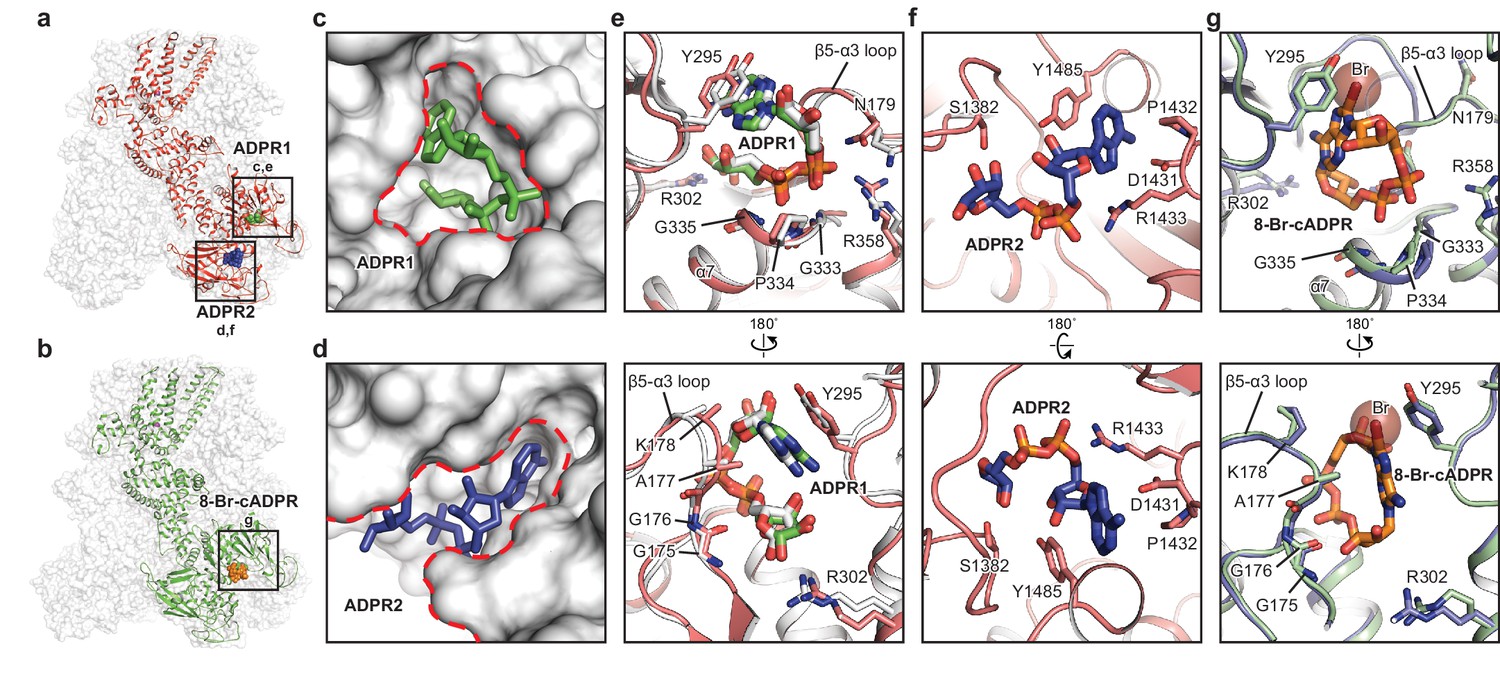
The ADPR1, ADPR2, and 8-Br-cADPR binding sites.
The structures of the ADPR/Ca2+-hsTRPM2 (a) and 8-Br-cADPR/Ca2+-hsTRPM2 (b), with the locations of the ADPR1, ADPR2, and 8-Br-cADPR binding sites boxed. (c–d) Shapes of the ADPR1 (c) and ADPR2 (d) binding sites (outlined by red dashes). ADPR1 and ADPR2 are shown as sticks. (e–g) The ligand binding sites for ADPR1 (e), ADPR2 (f), and 8-Br-cADPR (g). The ligands, and key residues involved in ligand binding are shown as sticks. Superimposition of the human TRPM2 (protein in red and ADPR in green) with the zebrafish TRPM2 (white) shows that the ADPR1 sites are conserved in both organisms (e). Superimposition of the EDTA-hsTRPM2 with 8-Br-cADPR/Ca2+-hsTRPM2 shows that binding of 8-Br-cADPR barely induces conformational change of the ADPR1 binding site. The bromine atom is shown as transparent sphere.
Figure 2—figure supplement 1
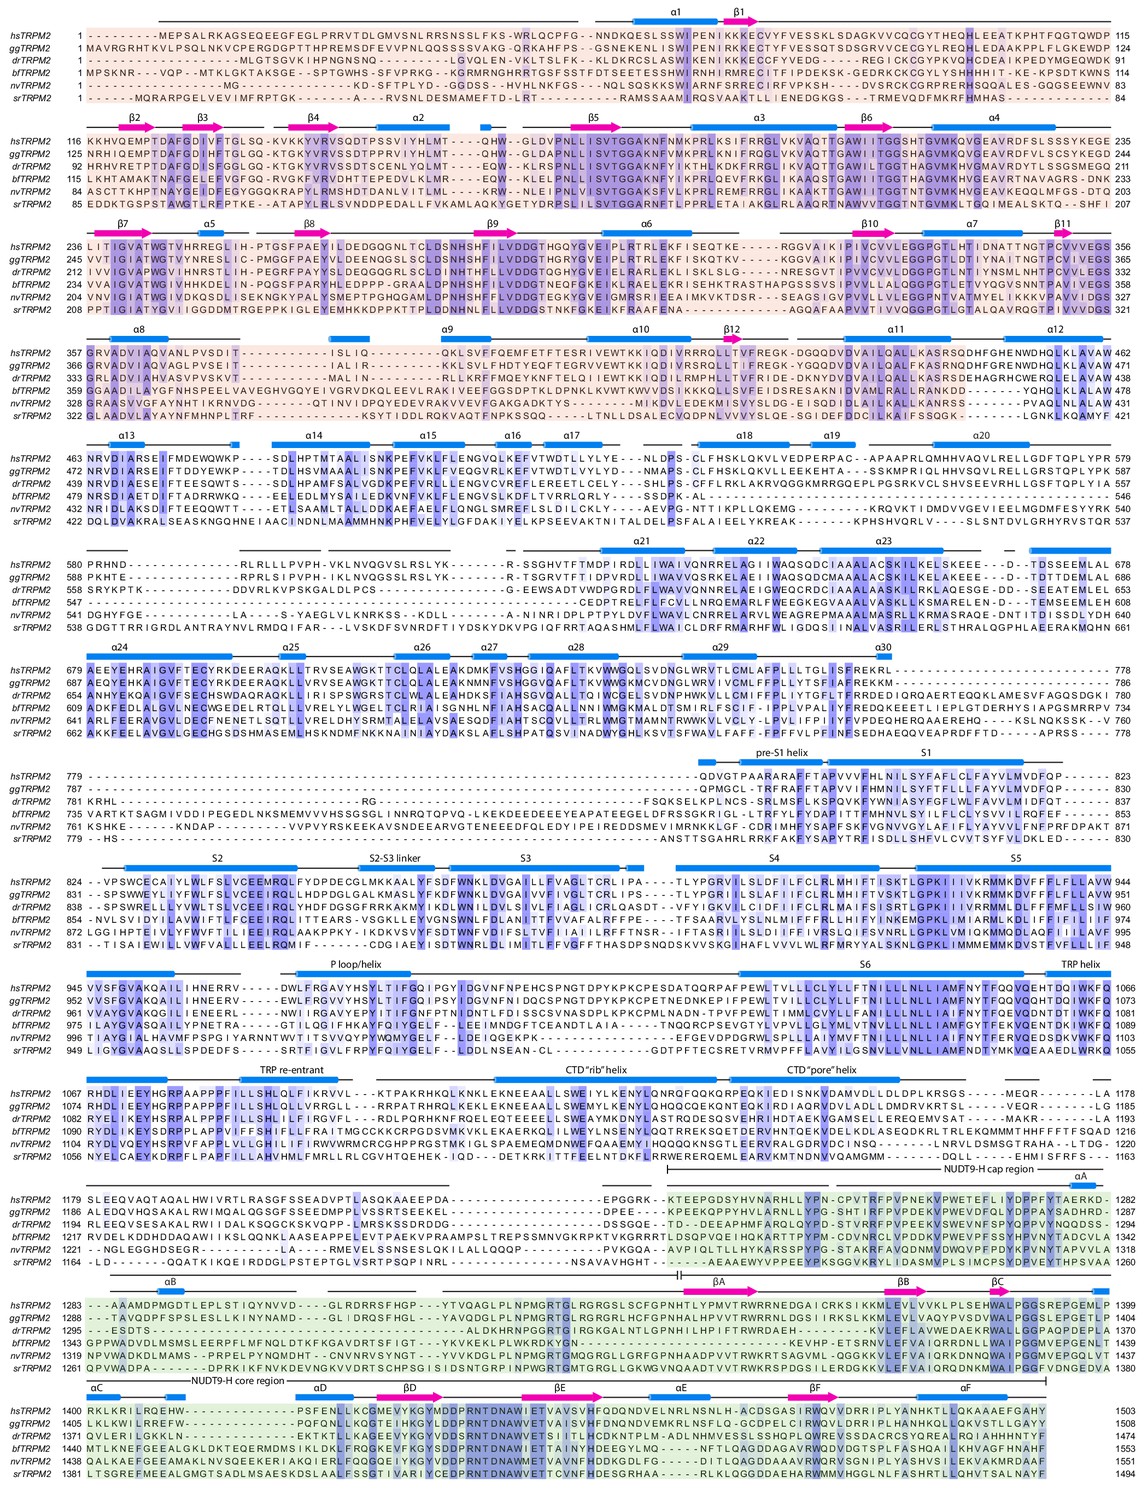
Secondary structure arrangement of hsTRPM2 and sequence alignment of TRPM2 from selected species.
The TRPM2 sequences are from Homo sapiens (hsTRPM2), Gallus gallus (ggTRPM2), Branchiostoma floridae (bfTRPM2), Danio rerio (drTRPM2), Nematostella vectensis (nvTRPM2), and Salpingoeca rosetta (srTRPM2). The secondary structure prediction for hsTRPM2 was made using the JPred online server (Drozdetskiy et al., 2015). The sequences were aligned using Clustal Omega (Sievers et al., 2011).
Figure 3
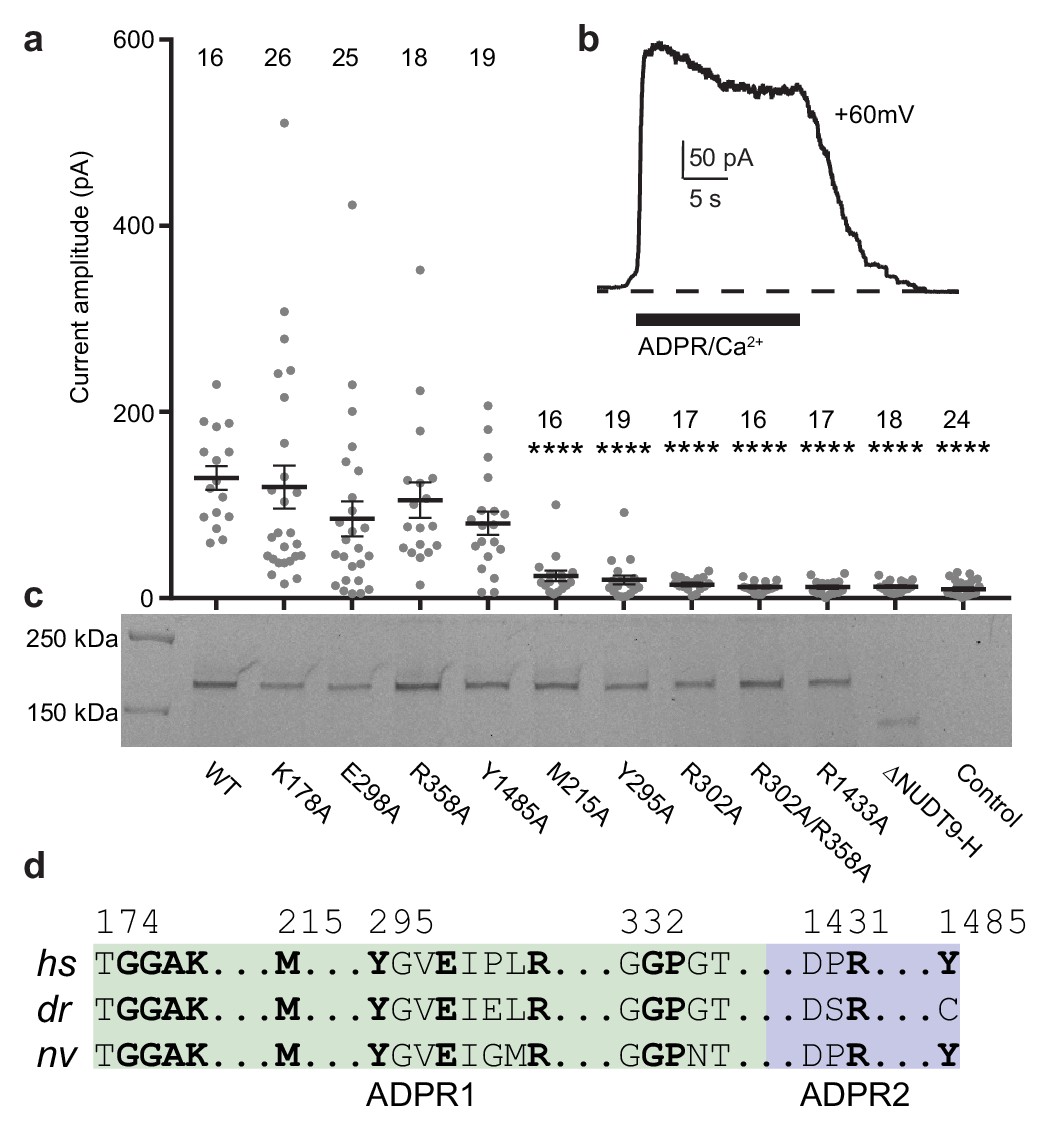
Residues and domain that are critical for ADPR-invoked channel activation.
(a) Statistics of current amplitudes and cell numbers of inside-out patches pulled from HEK293 cells transfected with wild-type hsTPRM2, alanine mutants of key residues in the ADPR1 and ADPR2 sites, and a NUDT9-H-truncated construct, ∆NUDT9-H. Control experiments were carried out using non-transfected HEK293 cells. Mutants showing significantly smaller currents than the wild-type hsTRPM2 are labeled with asterisks (****: p<0.0001). Data represent the mean ± s. e. m. and numbers on the top of each column indicated the number of patches that recorded. Values from individual experiments are shown as filled circles. (b) Representative current in an inside-out patch pulled from HEK293 cell transfected with wild-type hsTRPM2 cDNA. (c) Surface expression profiles of hsTRPM2 constructs used in (b), detected by in-gel GFP fluorescence. Most of the mutants showed expression comparable to that of the wild-type hsTRPM2; the ∆NUDT9-H showed weaker but recognizable expression at lower molecular weight due to truncation of the NUDT9-H domain. (d) Sequence alignment of the ADPR1 and ADPR2 binding sites (hs = Homo sapiens; dr = Danio rerio; nv = Nematostella vectensis). Key residues for ligand binding are in bold.
Figure 4 with 1 supplement

Domain rearrangement of the ligand-sensing layer – the MHR1/2 and NUDT9-H domains – upon binding of ADPR or 8-Br-cADPR.
Comparison of (a) the MHR1/2 domains and (b) the NUDT9-H domains of EDTA-hsTRPM2 (blue) and ADPR/Ca2+-hsTRPM2 (red) by superimposition of the MHR1 domains or the cap regions. Domain closure was observed in the MHR1/2 and NUDT9-H domains upon ADPR binding. (c) In the apo resting state, the intersubunit interface (resting interface) is formed by the MHR1 domain and the adjacent core region of the NUDT9-H domain. The rectangle is enlarged in the lower image. (d) Upon binding of ADPR, the intersubmit interface (activation interface) is reorganized and is formed by the MHR2 domain and the adjacent core region. The two adjacent subunits are colored in dark or light colors. Key elements involved in intersubunit interfaces are labeled. (e) Binding of 8-Br-cADPR to the MHR1/2 domain does not result in domain rearrangement of the ligand-sensing layer relative to the apo state shown in panel c.
Figure 4—figure supplement 1
Conformational rearrangements in the ligand-sensing layer of hsTRPM2 upon binding of ligands.
(a–d) Conformational changes of NUDT9-H domain and MHR1/2 domain upon ADPR or 8-Br-cADPR binding for EDTA-hsTRPM2 (a, blue), ADPR-hsTRPM2 (b, yellow), ADPR/Ca2+-hsTRPM2 (c, red), and 8-Br-cADPR-hsTRPM2/Ca2+-hsTRPM2 (d, green). The lower rotations are viewed from the intracellular side. The distances between the center of mass of the NUDT9-H domain and the MHR1/2 domain, and the angles between the center of mass of the NUDT9-H domain and the CTD coiled-coil pole along the pore axis, were measured and are indicated. (e–g) Comparisons of the MHR1/2 domain by superimposition of the MHR1 domains; colors show the structures from panels a-d that are being compared. ADPR1 binding produces an obvious MHR1/2 domain closure (e, f), and 8-Br-cADPR stabilizes MHR1/2 in an apo-like conformation (g). (h–j) Comparison of the NUDT9-H domain by superimposition of the cap regions, showing that ADPR2 binding produces noticeable domain closure; colors as for panels (e-g).
Figure 5 with 1 supplement
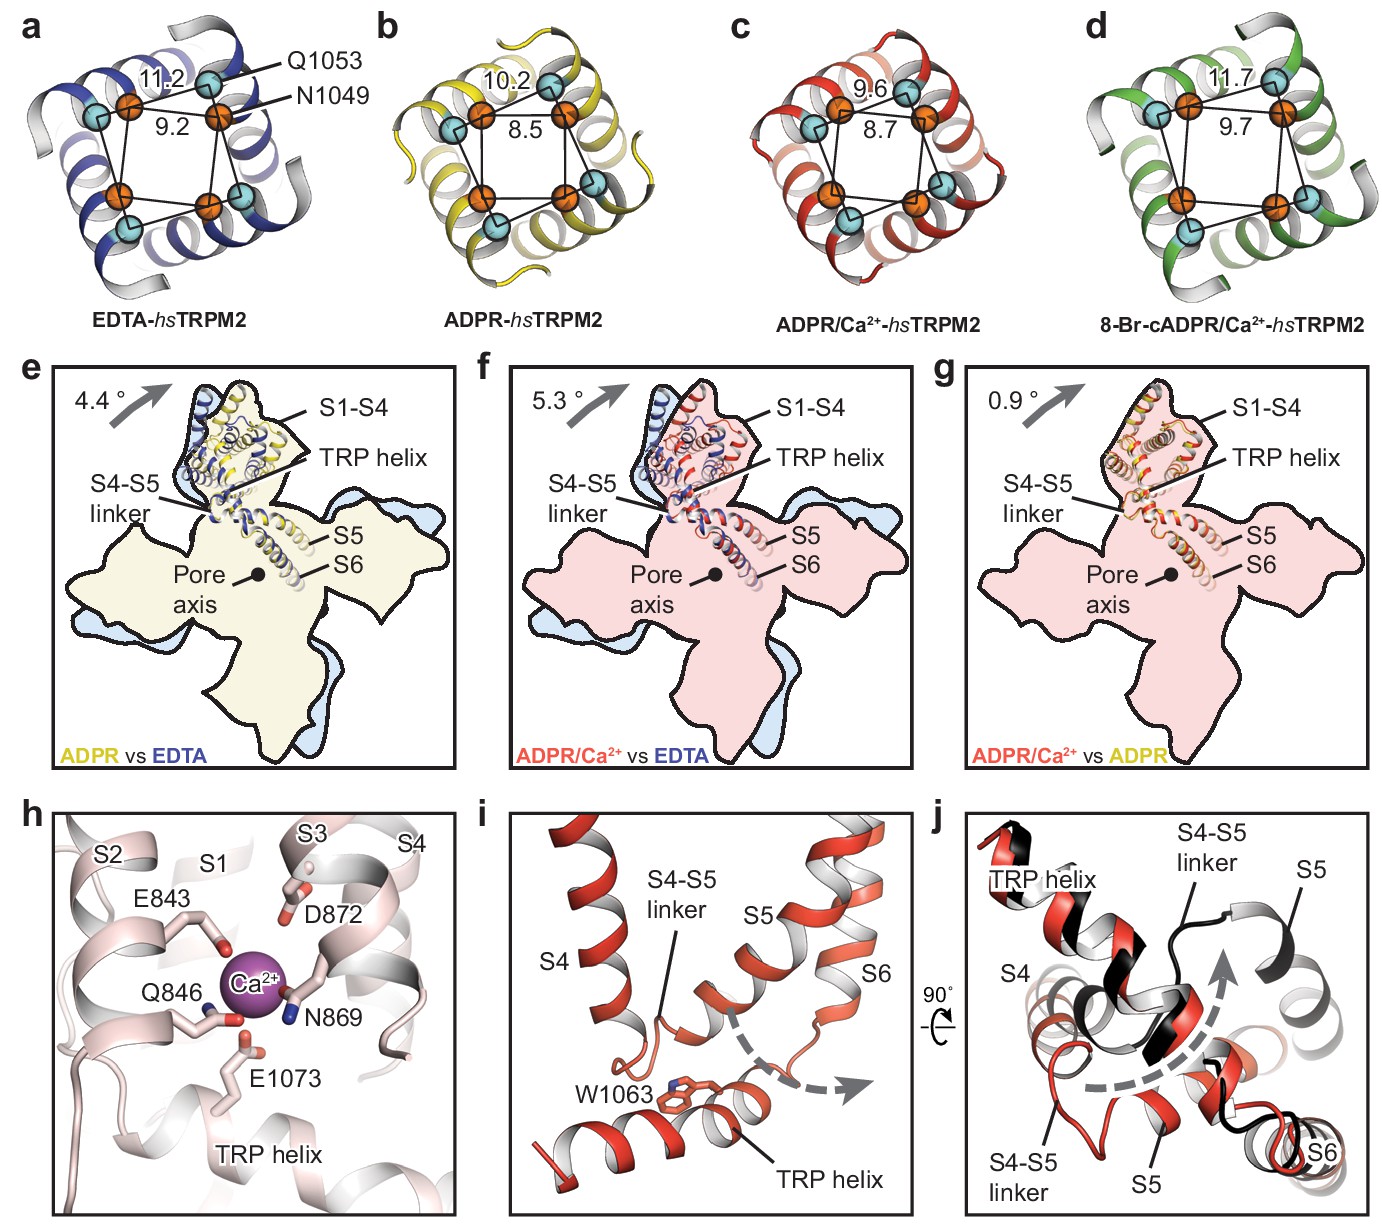
The ion-conducting pore.
The gates of (a) EDTA-hsTRPM2, (b) ADPR-hsTRPM2, (c) ADPR/Ca2+-hsTRPM2, and (d) 8-Br-cADPR/Ca2+-hsTRPM2, viewed from the intracellular side. The distances between the Cα atoms of adjacent N1049 and the distances between the Cα atoms of adjacent Q1053 are indicated. (e–g) Comparison of the TMDs of EDTA-hsTRPM2 and ADPR-hsTRPM2 (e), EDTA-hsTRPM2 and ADPR/Ca2+-hsTRPM2 (f), and ADPR-hsTRPM2 and ADPR/Ca2+-hsTRPM2 (g) by superimposition of their pore domain of the tetramer. While the pore-lining S6 and S5 are well aligned, a clockwise rotation of the S1-S4 domain and TRP helix is observed from EDTA-hsTRPM2 and ADPR/Ca2+-hsTRPM2. (h) Calcium binding sites in the ADPR/Ca2+-hsTRPM2 structure. (i) The relative positioning between the S4-S5 linker and the TRP helix in ADPR/Ca2+-hsTRPM2, viewed parallel to the membrane. The dashed arrow illustrates the proposed movement of the S4-S5 linker from one side to the other of the TRP helix, which is required for channel opening upon binding of ADPR/Ca2+ that is observed in drTRPM2 (Huang et al., 2018). (j) Comparison of the S4-S5 linkers in ADPR/Ca2+-hsTRPM2 (red) and ADPR/Ca2+-drTRPM2 (black), viewed from the intracellular side. The two structures are superimposed using the TRP helix.
Figure 5—figure supplement 1
Conformational changes in the MHR3/4 domains upon binding of ADPR.
(a–b) The interfaces between the MHR3/4 domains and the transmembrane domain layer, and between the MHR3/4 domains and the MHR1/2 layer, in EDTA-hsTRPM2 (a) and ADPR/Ca2+-hsTRPM2 (b). (c) Superimposition of the MHR3/4 domain layer of EDTA-hsTRPM2 and ADPR/Ca2+-hsTRPM2, by aligning the CTD coiled-coil poles (residues 1144 to 1165), showing a counterclockwise upward rotation of MHR3/4 domain upon binding of ADPR and Ca2+. ADPR1 is shown as green spheres and ADPR2 is shown as blue spheres.
Figure 6 with 1 supplement
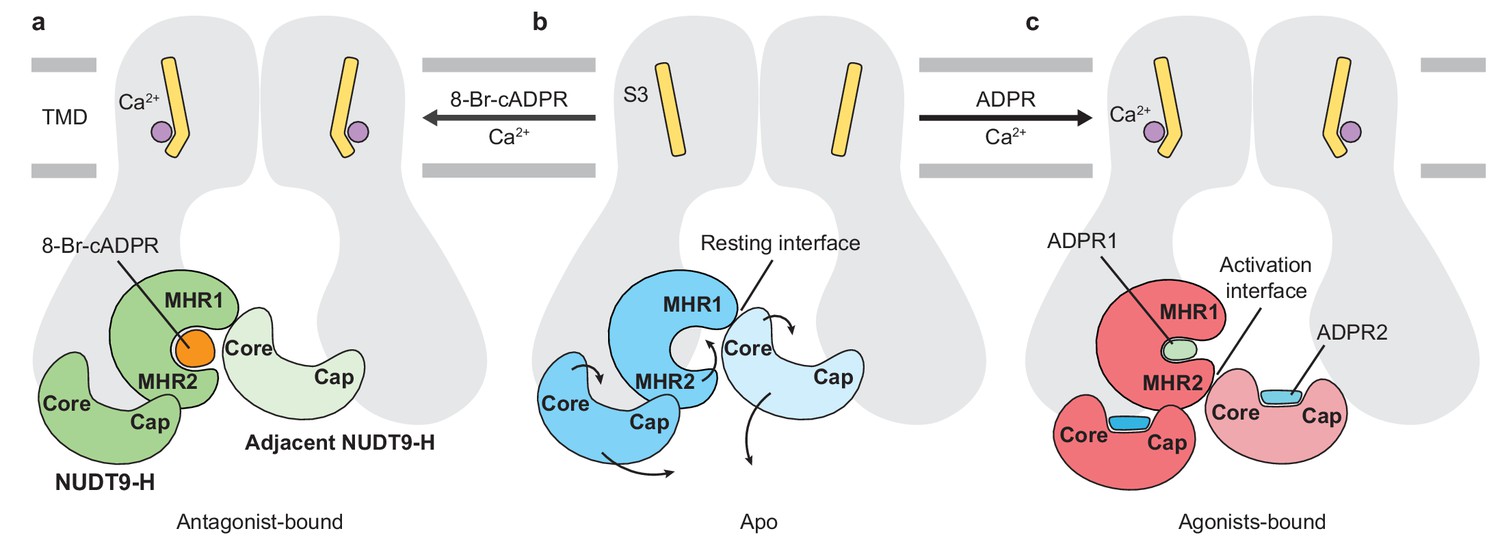
Schematic of ligand-sensing of hsTRPM2.
(a–c) Conformational changes of hsTRPM2 among antagonist-bound (a), apo-resting (b), and agonist-bound (c) structures, focusing on the three ligand-binding sites. (a) 8-Br-cADPR binds only to the cleft of the MHR1/2 domain but not to the NUDT9-H domain. It inhibits the channel by stabilizing the MHR1/2 domain in an apo-like conformation. The Ca2+ binding causes a tilting of the nearby S3 in the TMD, which is suggested to facilitate channel opening in the presence of agonist ADPR (Csanády and Törocsik, 2009; McHugh et al., 2003; Starkus et al., 2007). However, Ca2+ alone is not sufficient to open the channel. (c) Conformational changes of hsTRPM2 upon binding of Ca2+ and ADPR in triple binding sites with Ca2+ bound nearby S3, the U-shaped ADPR1 (green) in the cleft of MHR1/2 domain, and the extended ADPR2 (blue) in the cleft of NUDT9-H domain. Binding of ADPR1 and ADPR2 induces bi-lobed domain closure of the MHR1/2 domain and the NUDT9-H domain, respectively. The MHR1/2 domain shows a counterclockwise rotation and the NUDT9-H domain swings toward the pore center. As a result, the resting interface is disrupted, and an activation interface is created between adjacent subunits. The movements induced by ADPR in the MHR1/2 domain and NUDT9-H domain are shown by arrows.
Figure 6—figure supplement 1

Comparison of the NUDT9-H domain with the NUDT9 enzyme.
(a–b) Superimposition of NUDT9 enzyme (PDB: 1QVJ, cyan) and NUDT9-H domain in EDTA-hsTRPM2 (a, blue) and ADPR/Ca2+-hsTRPM2 (b, red) by aligning the cap regions. The ribose-5-phosphate (R5P) in the NUDT9 is shown as cyan spheres and the ADPR2 in the ADPR/Ca2+-hsTRPM2 is shown as blue spheres.
Tables
Table 1
Statistics of 3D reconstruction and model refinement.
https://doi.org/10.7554/eLife.50175.017| Data collection/processing | EDTA-hsTRPM2 | ADPR-hsTRPM2 | ADPR/Ca2+-hsTRPM2 | 8-Br-cADPR/Ca2+-hsTRPM2 |
|---|---|---|---|---|
| Microscope | Titan Krios (FEI) | Titan Krios (FEI) | Titan Krios (FEI) | Titan Krios (FEI) |
| Voltage (kV) | 300 | 300 | 300 | 300 |
| Defocus range (µM) | 1.0–2.5 | 1.0–2.5 | 1.0–2.5 | 1.0–2.5 |
| Exposure time (s) | 8 | 8 | 8 | 8 |
| Dose rate (e-/Å2/s) | 6.8 | 6.8 | 6.8 | 6.8 |
| Number of frames | 40 | 40 | 40 | 40 |
| Pixel size (Å) | 1.076 | 1.076 | 1.076 | 1.076 |
| Particles picked | 783,885 | 537,671 | 2,342,060 | 1,822,211 |
| Particles 2D | 415,415 | 346,032 | 759,700 | 729,269 |
| Particles refined | 161,360 | 117,350 | 287,184 | 102,259 |
| Resolution (Å) | 3.3 | 4.4 | 3.7 | 3.7 |
| FSC threshold | 0.143 | 0.143 | 0.143 | 0.143 |
| Resolution range (Å) | 322.2–3.3 | 322.2–4.4 | 322.2–3.7 | 322.2–3.7 |
| Model statistics | ||||
| Number of atoms | 37816 | 37308 | 37408 | 38492 |
| Protein | 37816 | 37020 | 37116 | 38344 |
| Ligand | 0 | 288 | 292 | 148 |
| r.m.s. deviations | ||||
| Bond length (Å) | 0.007 | 0.008 | 0.009 | 0.006 |
| Bond angle (°) | 0.907 | 1.015 | 1.051 | 0.941 |
| Ramachandran plot | ||||
| Favored (%) | 92.18 | 91.59 | 91.53 | 94.33 |
| Allowed (%) | 7.59 | 8.02 | 8.08 | 5.44 |
| Disallowed (%) | 0 | 0 | 0 | 0 |
| Rotamer outlier (%) | 0.35 | 1.40 | 1.38 | 1.13 |
Additional files
-
Transparent reporting form
- https://doi.org/10.7554/eLife.50175.018
Download links
A two-part list of links to download the article, or parts of the article, in various formats.
Downloads (link to download the article as PDF)
Open citations (links to open the citations from this article in various online reference manager services)
Cite this article (links to download the citations from this article in formats compatible with various reference manager tools)
Ligand recognition and gating mechanism through three ligand-binding sites of human TRPM2 channel
eLife 8:e50175.
https://doi.org/10.7554/eLife.50175


