HIPK4 is essential for murine spermiogenesis
- Department of Chemical and Systems Biology, Stanford University School of Medicine, United States
- Stanford University Mass Spectrometry, Stanford University, United States
- Chan Zuckerberg Biohub, Stanford University, United States
- Cell Science Imaging Facility, Stanford University School of Medicine, United States
- Department of Obstetrics and Gynecology, Reproductive Endocrinology and Infertility, Stanford University School of Medicine, United States
- Transgenic, Knockout, and Tumor Model Center, Stanford University School of Medicine, United States
- Department of Developmental Biology, Stanford University School of Medicine, United States
- Department of Chemistry, Stanford University, United States
Figures
Figure 1
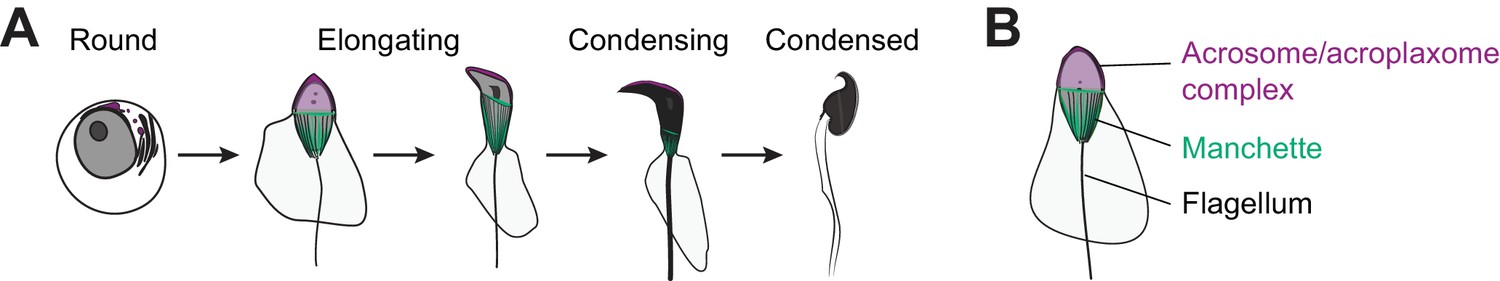
Key steps of spermiogenesis.
(A) Schematic representation of murine male germ cells transitioning from round spermatids to elongated spermatozoa. These steps occur within the testis seminiferous epithelium and are conserved in all mammals. (B) Illustration of an elongating spermatid highlighting structural features that are established during spermiogenesis.
Figure 2 with 2 supplements

HIPK4 is expressed in spermatids and required for male fertility in mice.
(A) Hipk4 expression in various murine tissues as determined by qPCR analysis of the Origene TissueScan Mouse Normal cDNA array. Data are normalized to Gapdh. (B–C) Hipk4 expression in adult mouse (B) and human (C) testis sections as determined by in situ hybridization. (D) Validation of Hipk4 knockout by PCR of tail-derived genomic DNA and western blot analyses of whole testis lysates. Immunoblots are from the same membrane and exposure time. (E) Weights of WT, Hipk4+/-, and Hipk4-/- males at 6–7 weeks of age. (F–G) HIPK4 protein expression in adult mouse seminiferous tubule sections (Stage VI-VII) as determined by immunofluorescence imaging. Asterisks indicate non-specific antibody binding (see Figure 2—figure supplement 2). (H) Number of live pups per litter resulting from crosses between 7-week-old males and age-matched, WT females. (I) WT, Hipk4+/-, and Hipk4-/- testis weights at 6 weeks of age. (J) Fertilization potential of Hipk4-/- sperm using IVF and ICSI. ND = not determined. Experiments were conducted by the Stanford Transgenic, Knockout, and Tumor Model Center, and the wild-type data represent the core facility’s average results using C57BL/6NJ sperm. (K) Pups born via ICSI using Hipk4-/- sperm. Scale bars: B-C, 100 µm; F-G, 20 µm. Statistical analyses: error bars depicted in panels E, H, and I represent the average value ± s.d.
Figure 2—figure supplement 1
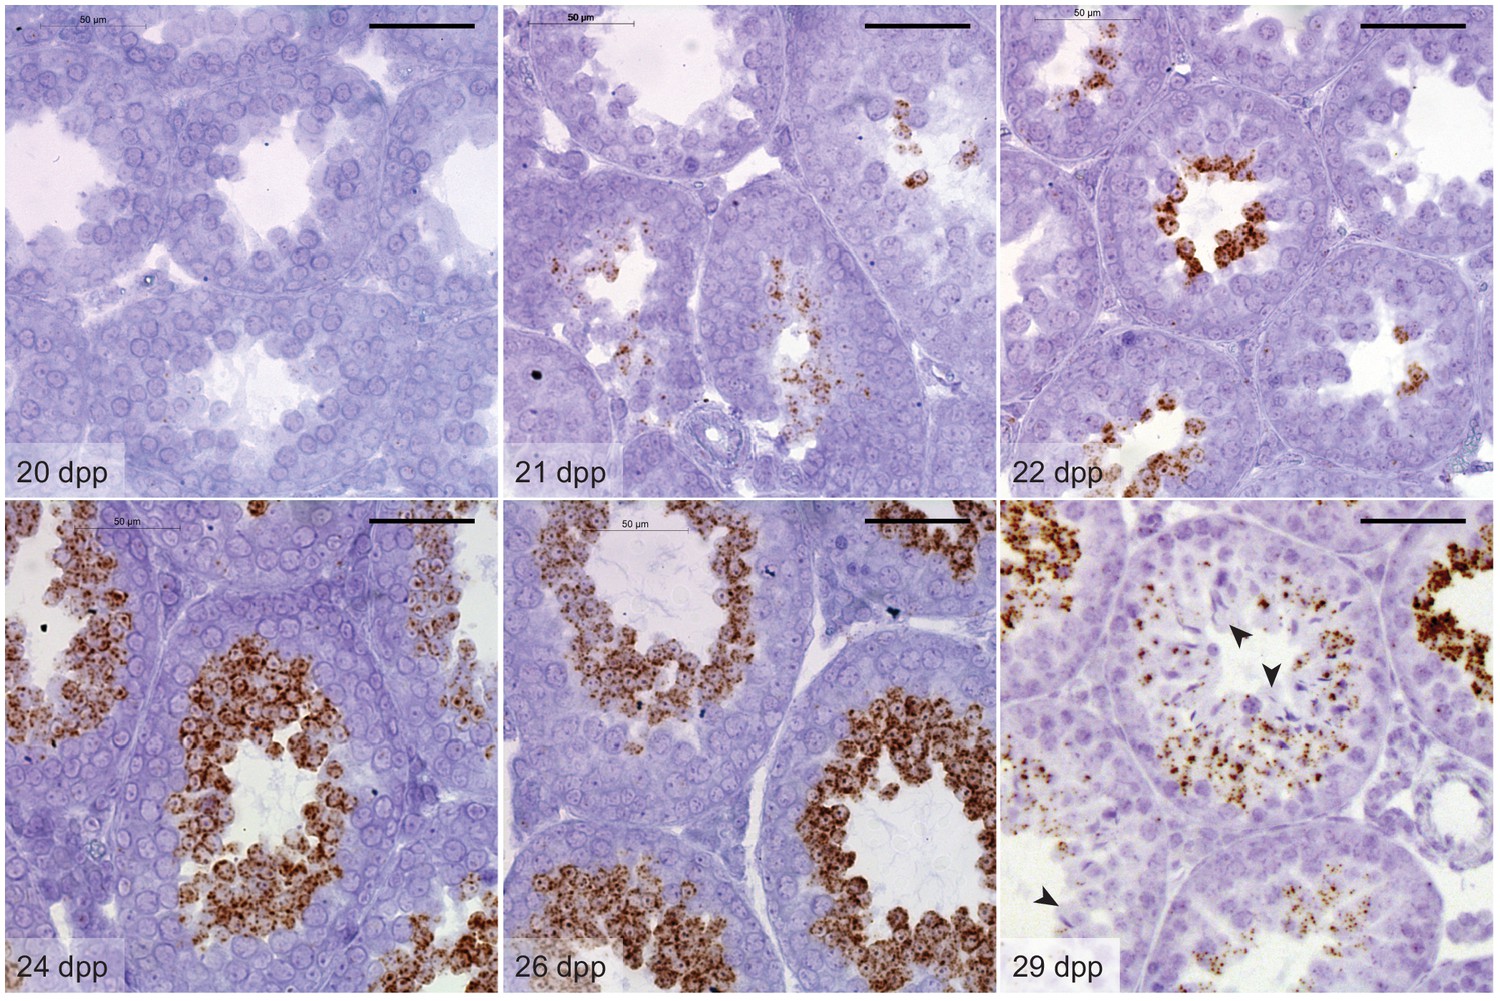
Hipk4 mRNA expression during the first wave of murine spermatogenesis.
Hipk4 transcript labeling by in situ hybridization in formalin-fixed, paraffin-embedded testis sections from wild-type C57BL/6NJ mice of the designated ages. Arrowheads indicate the loss of Hipk4 expression in elongating spermatids circumscribing the seminiferous tubule lumen (29 dpp). Scale bars: 50 µm.
Figure 2—figure supplement 2
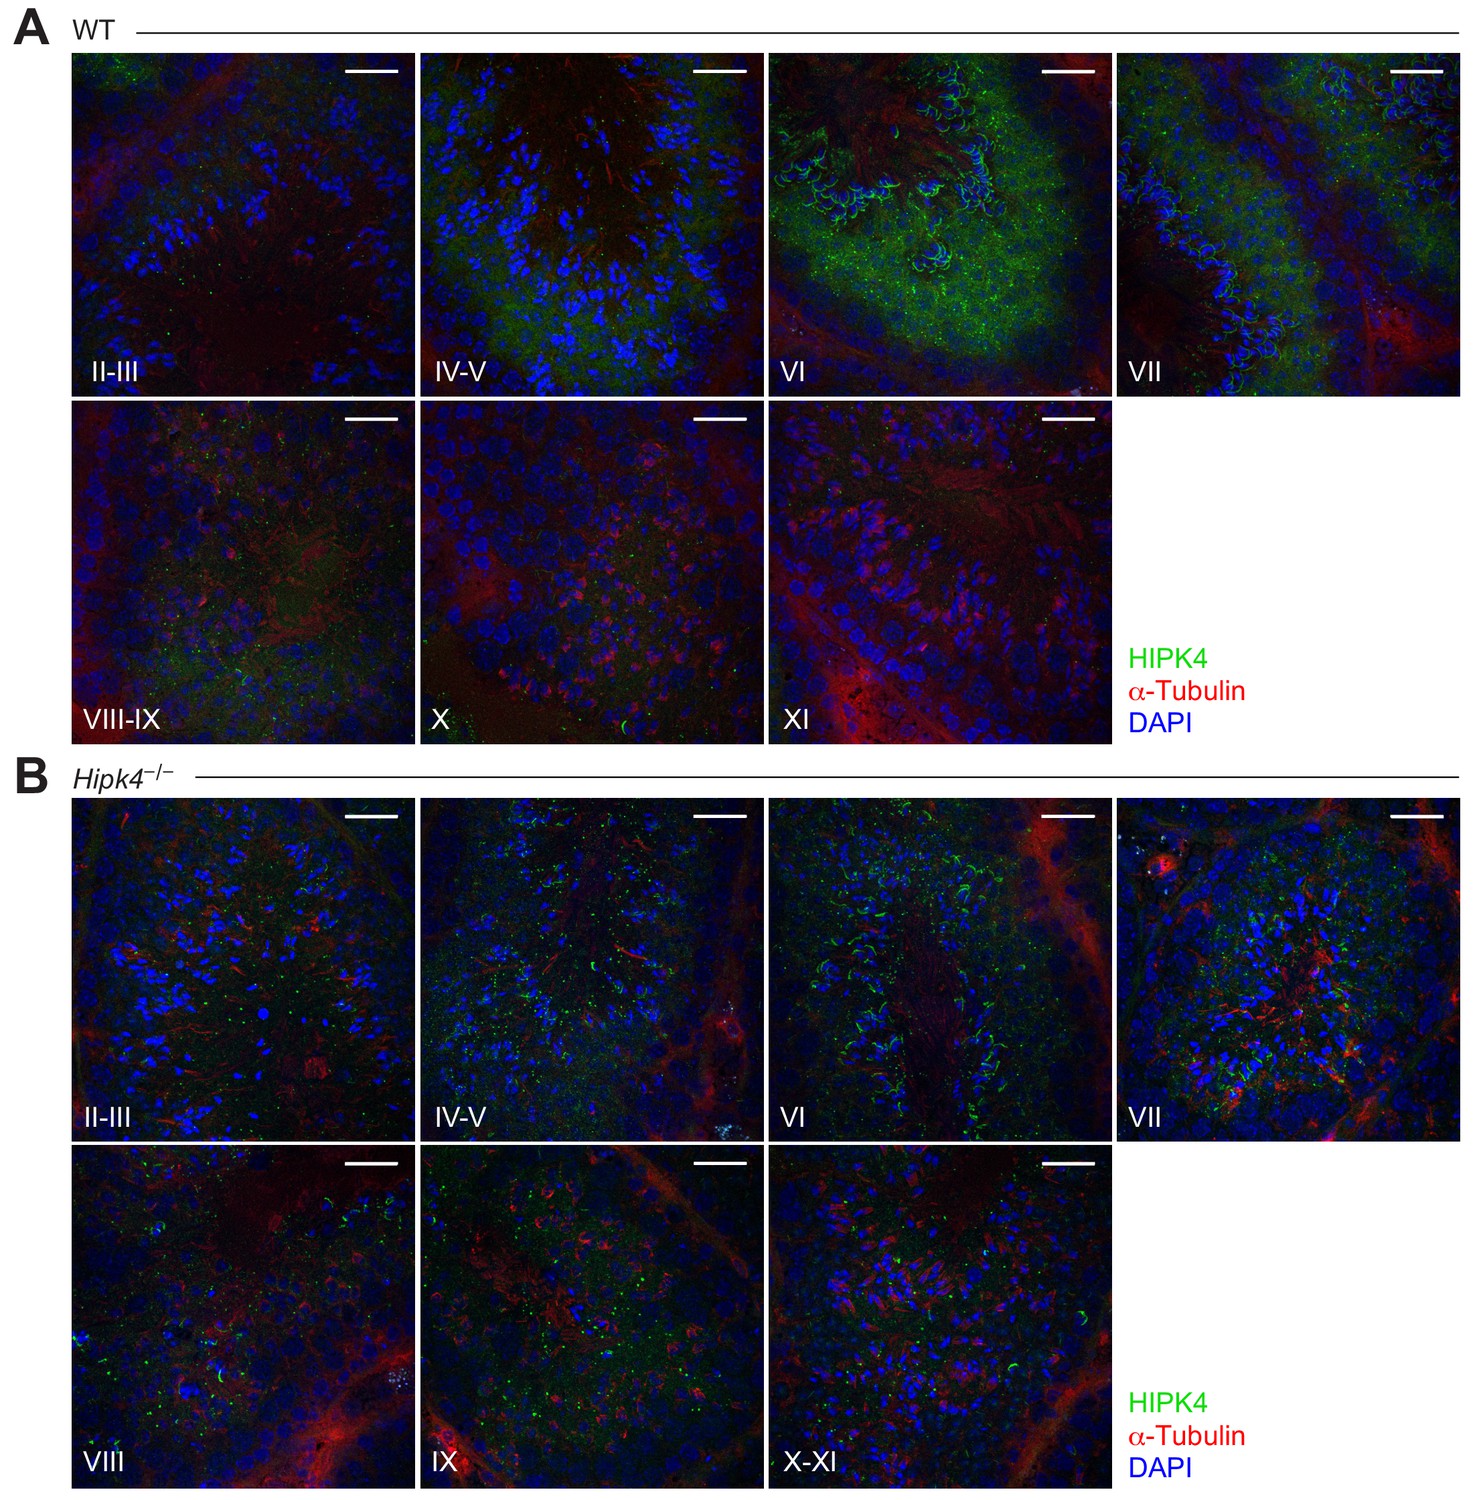
HIPK4 protein expression in adult murine seminiferous tubules.
(A-B) Immunofluorescence images of cryosectioned testes from adult wild-type (A) and HIPK4 knockout (B) mice. Stages for each testis section are shown. Scale bars: 20 µm.
Figure 3 with 2 supplements

HIPK4 knockout mice exhibit oligoasthenoteratozoospermia.
(A) Concentrations of epididymal sperm ± s.d. P values for the indicated statistical comparison are shown. (B) Percentage of epididymal sperm that were motile ± s.d. P values for the indicated statistical comparison are shown. (C) CASA measurements of progressive sperm motility. Data connected by the dashed lines are showing motility of >500 sperm from the same samples before and after capacitation ± s.d. (D, E) Percentage of sperm with abnormal head or tail morphology ± s.d. as assessed by phase contrast microscopy (>500 sperm analyzed for each genotype; see also Figure 3—figure supplement 1 for phase contract images). (F) Quantification of TUNEL-positive epididymal sperm from an individual male of each genotype (n = number of sperm analyzed). (G) SEM images of epididymal sperm. AA = anterior acrosome, EQ = equatorial segment, PAS = postacrosomal segment, VS = ventral spur, HR = hook rim. Arrowheads point to the axoneme wrapped inside a demembranated sperm head. (H, H’) Centrioles at the basal body of step 15 spermatid axonemes. (I, I’) Mitochondria along the midpiece of step 15 spermatids. (J, J’) Cross section of step 15 spermatid flagella at the midpiece. (K, K’) Cross section of step 15 spermatid flagella at the principal piece. (L) Acrosomal changes in capacitated sperm treated with a Ca2+ ionophore (A23187) as assessed by immunofluorescence and staining with FITC-labeled PNA. Nuclei were stained with DAPI. (M) Number of oocyte-bound sperm under standard IVF conditions after extensive washing ± s.e.m. Data are from a single experiment using 24–30 COCs for each sperm incubation. Scale bars: G, 2 µm; H, 1 µm; I, 1 µm; J, 0.5 µm; K, 0.2 µm; L, 5 µm.
Figure 3—figure supplement 1

Morphologies of wild-type and Hipk4 mutant sperm.
Phase contrast images of sperm obtained from mice with the designated genotypes. Sperm were treated with Diff-Quik stain prior to imaging, and multiple examples of homozygous mutant sperm are shown to illustrate the range of morphological phenotypes. Scale bars: 2 µm.
Figure 3—figure supplement 2

HIPK4 is not essential for sperm capacitation or acrosomal exocytosis.
(A) Western blot detection of soluble phosphotyrosine-containing proteins in sperm before or after capacitation with TYH medium + BSA (Cap buffer). (B) Percentage of wild-type or Hipk4 knockout sperm with an acrosome after treatment with Cap buffer for 1.5 hr or after an additional 1 hr incubation with either the Ca2+ ionophore A23187. Data are the average of three independent experiments ± s.e.m., and the number of sperm counted for each condition was between 213 and 1228. P-values (T-test; two-tailed, equal variance) are shown. (C) Representative differential interference contrast (DIC) images of oocytes following standard IVF conditions using wild-type or Hipk4 knockout sperm. Scale bars = 20 µm.
Figure 4 with 3 supplements

HIPK4 regulates the acrosome–acroplaxome complex.
(A,A’) PAS-stained sections of seminiferous tubules from WT or Hipk4-/- mice at stages IX-XII of spermatogenesis. Green arrowheads point to the heads of representative elongating spermatids (Step 9–12, respectively). (B, B’) H and E-stained sections of caudal epididymides from WT or Hipk4-/- mice. (C–E) TEM images. (C, C’) Step 6–11 spermatids from WT or Hipk4-/- mice. The areas outlined by green boxes are shown at higher magnification in D-D’. (D, D’) Groove belt region of step 10 spermatids. Green arrowheads label to electron densities in the acroplaxome that are normally associated with the posterior edge of the acrosome (false-colored purple). Red arrowheads indicated keratin 5 filaments within the acroplaxome marginal ring, and blue arrowheads point to filaments linking the manchette to the nuclear envelope. (E, E’) TEM images of condensed spermatids in WT and Hipk4-/- testis sections. Scale bars: A-B, 20 µm; C, 1 µm; D, 0.2 µm; E, 2 µm.
Figure 4—figure supplement 1

Comparison of the seminiferous epithelium and epididymis of WT and Hipk4 knockout mice.
(A-B) Fixed, paraffin-embedded testis sections from WT (A) and Hipk4–/– (B) mice stained with PAS reagents. Stages for the tubules shown in each micrograph are indicated. (C-D) Fixed, paraffin-embedded epididymis sections from WT (C) and Hipk4–/– (D) mice stained with hematoxylin and eosin. Epididymal regions associated with each section are indicated. Scale bars: 20 µm.
Figure 4—figure supplement 2

HIPK4 null spermatids exhibit acrosome–acroplaxome defects.
(A) TEM images of step 4–8 spermatids from adult WT and Hipk4–/– mice. (B) TEM images of step 10 Hipk4–/– spermatids. (C) Higher magnification TEM images of the groove belt region in step 10 WT and Hipk4–/– spermatids. Acrosomes are false-colored purple, and green arrowheads label electron densities in the acroplaxome that normally are associated with the acrosome or plasma membrane. Scale bars: A, 1 µm; B, 2 µm; C, 1 µm.
Figure 4—figure supplement 3

HIPK4 does not regulate the localization of anterior LINC complexes or manchette dynamics.
(A) Immunofluorescence imaging of the inner nuclear membrane protein DPY19L2 (red) in dissociated spermatids. The acrosome is labeled with FITC-PNA (green), and nuclei are stained with Hoechst 33342 (blue). (B) Immunofluorescence imaging of the LINC complex proteins SUN1 (red) and nesprin3 (green) in dissociated spermatids. Nuclei are stained with Hoechst 33342 (blue). (C) Immunofluorescence imaging of EB3 (manchette, green) and ZP3R (red) in testis cryosections. Nuclei are stained with DAPI, and stages of each section are indicated. (D) Immunofluorescence imaging of EB3 (manchette green) in dissociated spermatids. Nuclei are stained with Hoechst 33342 (blue). Scale bars: A-B (scale bars are representative for all images across the row), 2 µm; C, 5 µm; D, 2 µm.
Figure 5
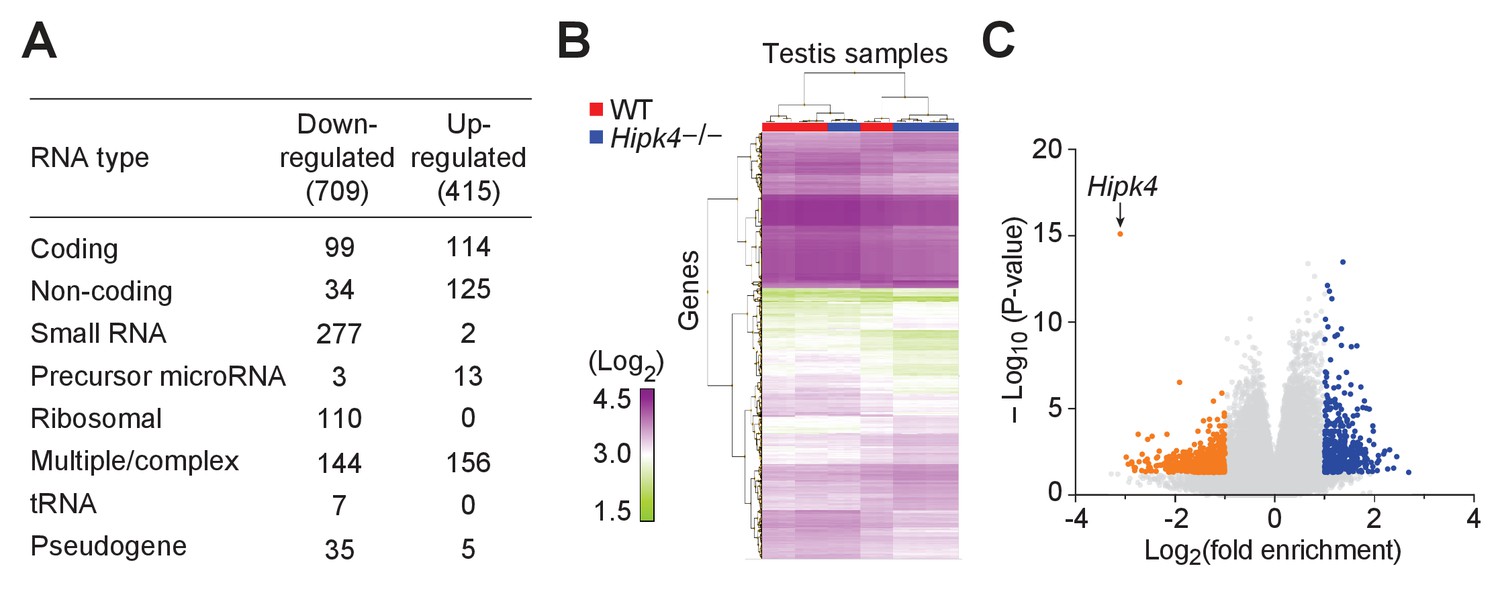
Wild-type and HIPK4 knockout testes have similar transcriptomes.
(A) Summary of the types of RNA that were increased (up-regulated) or decreased (down-regulated) in Hipk4 knockout testes compared to wild-type, as measured by quadruplicate microarray analysis of three testis samples. (B) Histogram of normalized signal intensities (Log2) of gene expression levels in individual microarrays. Color scheme was arbitrarily assigned. (C) Volcano plot depicting the transcriptional differences between Hipk4 knockout and wild-type testes. RNA species that exhibited a > 2 fold change in abundance and had a P value<0.05 are shown in orange (down-regulated) or blue (up-regulated).
-
Figure 5—source data 1
Testis microarray data comparing WT and HIPK4 KO transcripts .
- https://cdn.elifesciences.org/articles/50209/elife-50209-fig5-data1-v1.xlsx
Figure 6
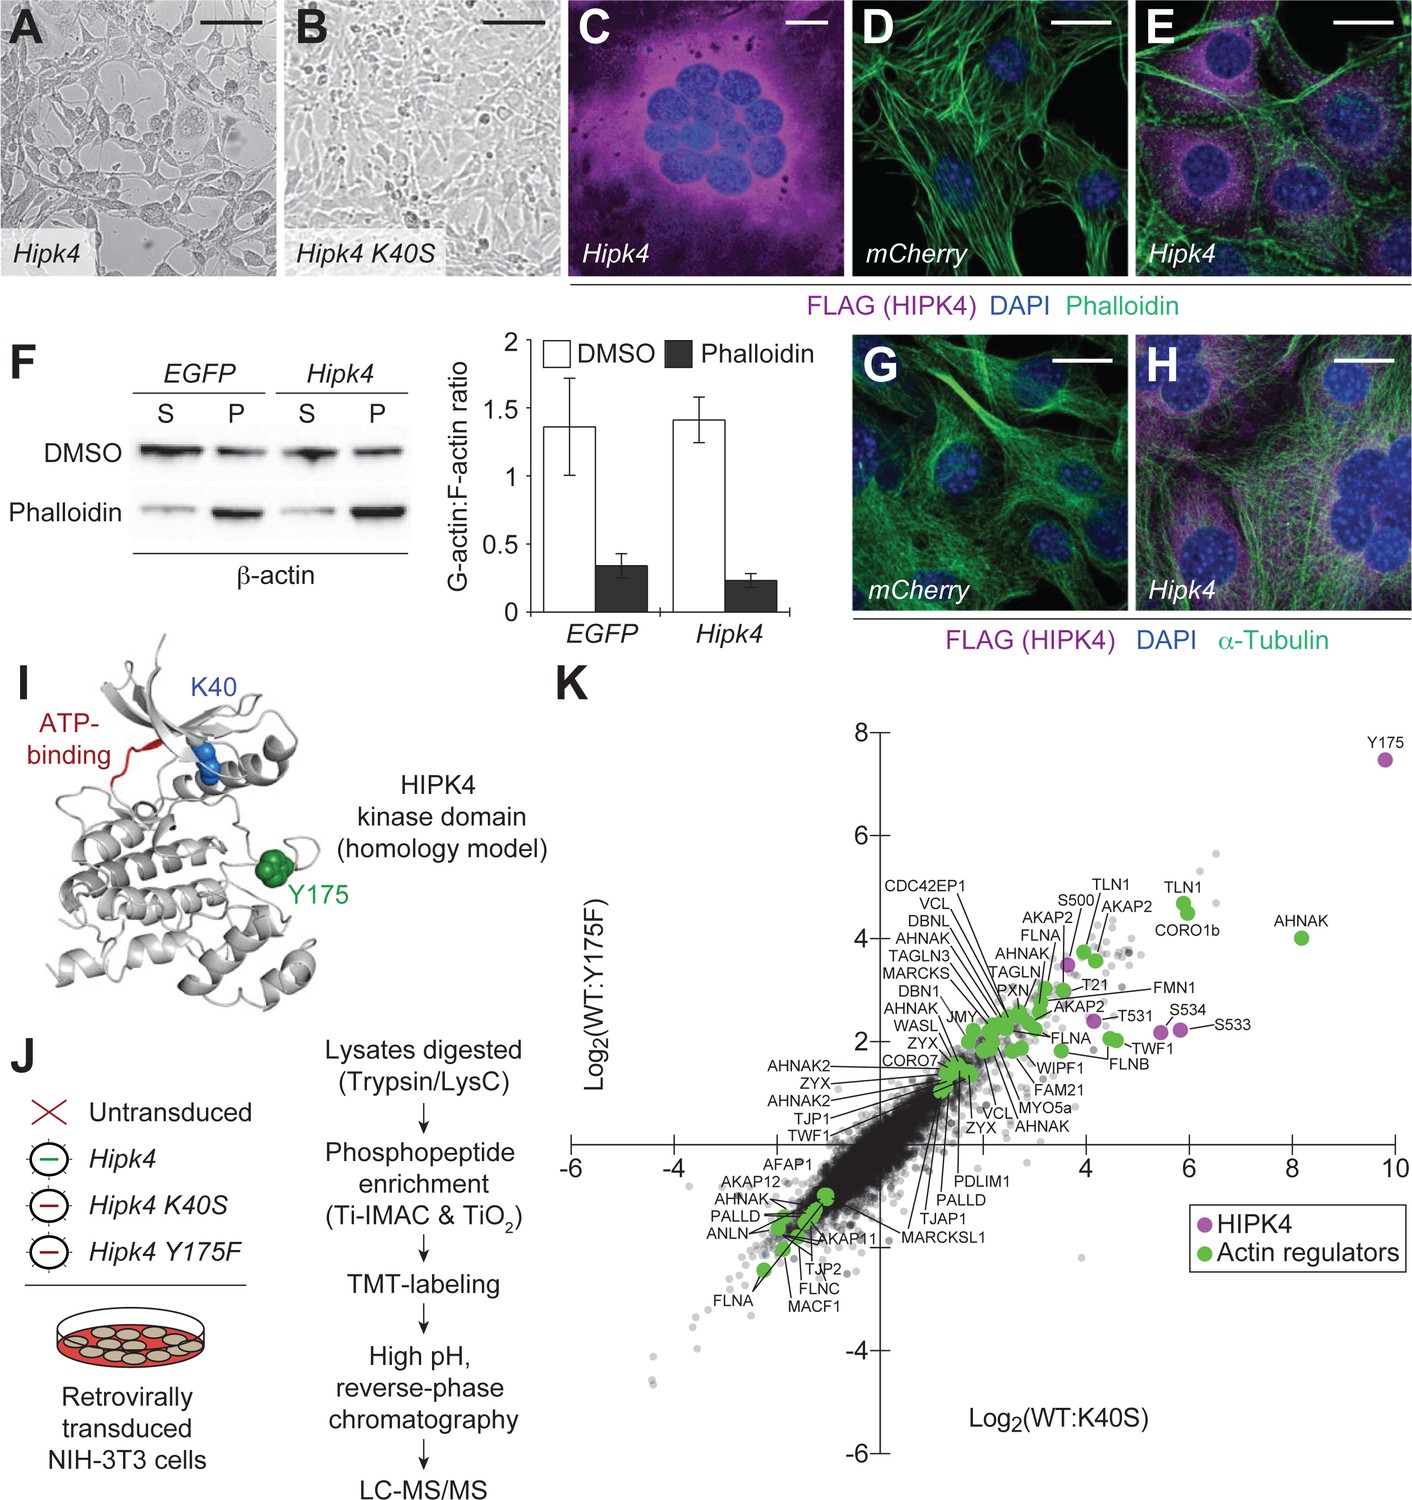
HIPK4 overexpression remodels the actin cytoskeleton in cultured cells.
(A–B) Brightfield images of NIH-3T3 cells retrovirally transduced with FLAG-tagged Hipk4 or kinase-dead Hipk4 K40S. (C) HIPK4-expressing NIH-3T3 cell with multiple nuclei. (D–E) Phalloidin and anti-FLAG staining of NIH-3T3 cells transduced with mCherry or FLAG-tagged Hipk4. (F) G- and F-actin levels in NIH-3T3 cells transduced with EGFP or FLAG-tagged Hipk4 and then treated with DMSO or phalloidin after lysis. The western blot shows the soluble (S; G-actin) and pelleted (P; F-actin) pools of actin after ultracentrifugation, and the graph depicts the average G-actin:F-actin ratios of quadruplicate samples ± s.e.m. (G–H) α-Tubulin and FLAG immunostaining of NIH-3T3 cells transduced with mCherry or FLAG-tagged Hipk4. (I) Homology model of the HIPK4 kinase domain using the DYRK1A structure as a template (PDB ID: 3ANQ). The ATP-binding site is colored red, and residues that are essential for catalytic activity are depicted as blue or green space-filling models. (J) Work flow used to characterize the HIPK4-dependent phosphoproteome in NIH-3T3 cells. (K) Scatter plot of 6941 phosphosites identified by LC-MS/MS, graphed according to their relative levels in NIH-3T3 cells overexpressing wild-type or catalytically inactive HIPK4. Selected HIPK4-regulated phosphosites in actin-modulating proteins are shown in green and phosphosites in HIPK4 are shown in purple. Scale bars: A-B, 100 µm; C-E and G-H, 20 µm.
-
Figure 6—source data 1
Phosphoproteome of HIPK4-expressing NIH-3T3 cells.
- https://cdn.elifesciences.org/articles/50209/elife-50209-fig6-data1-v1.xlsx
Figure 7 with 1 supplement
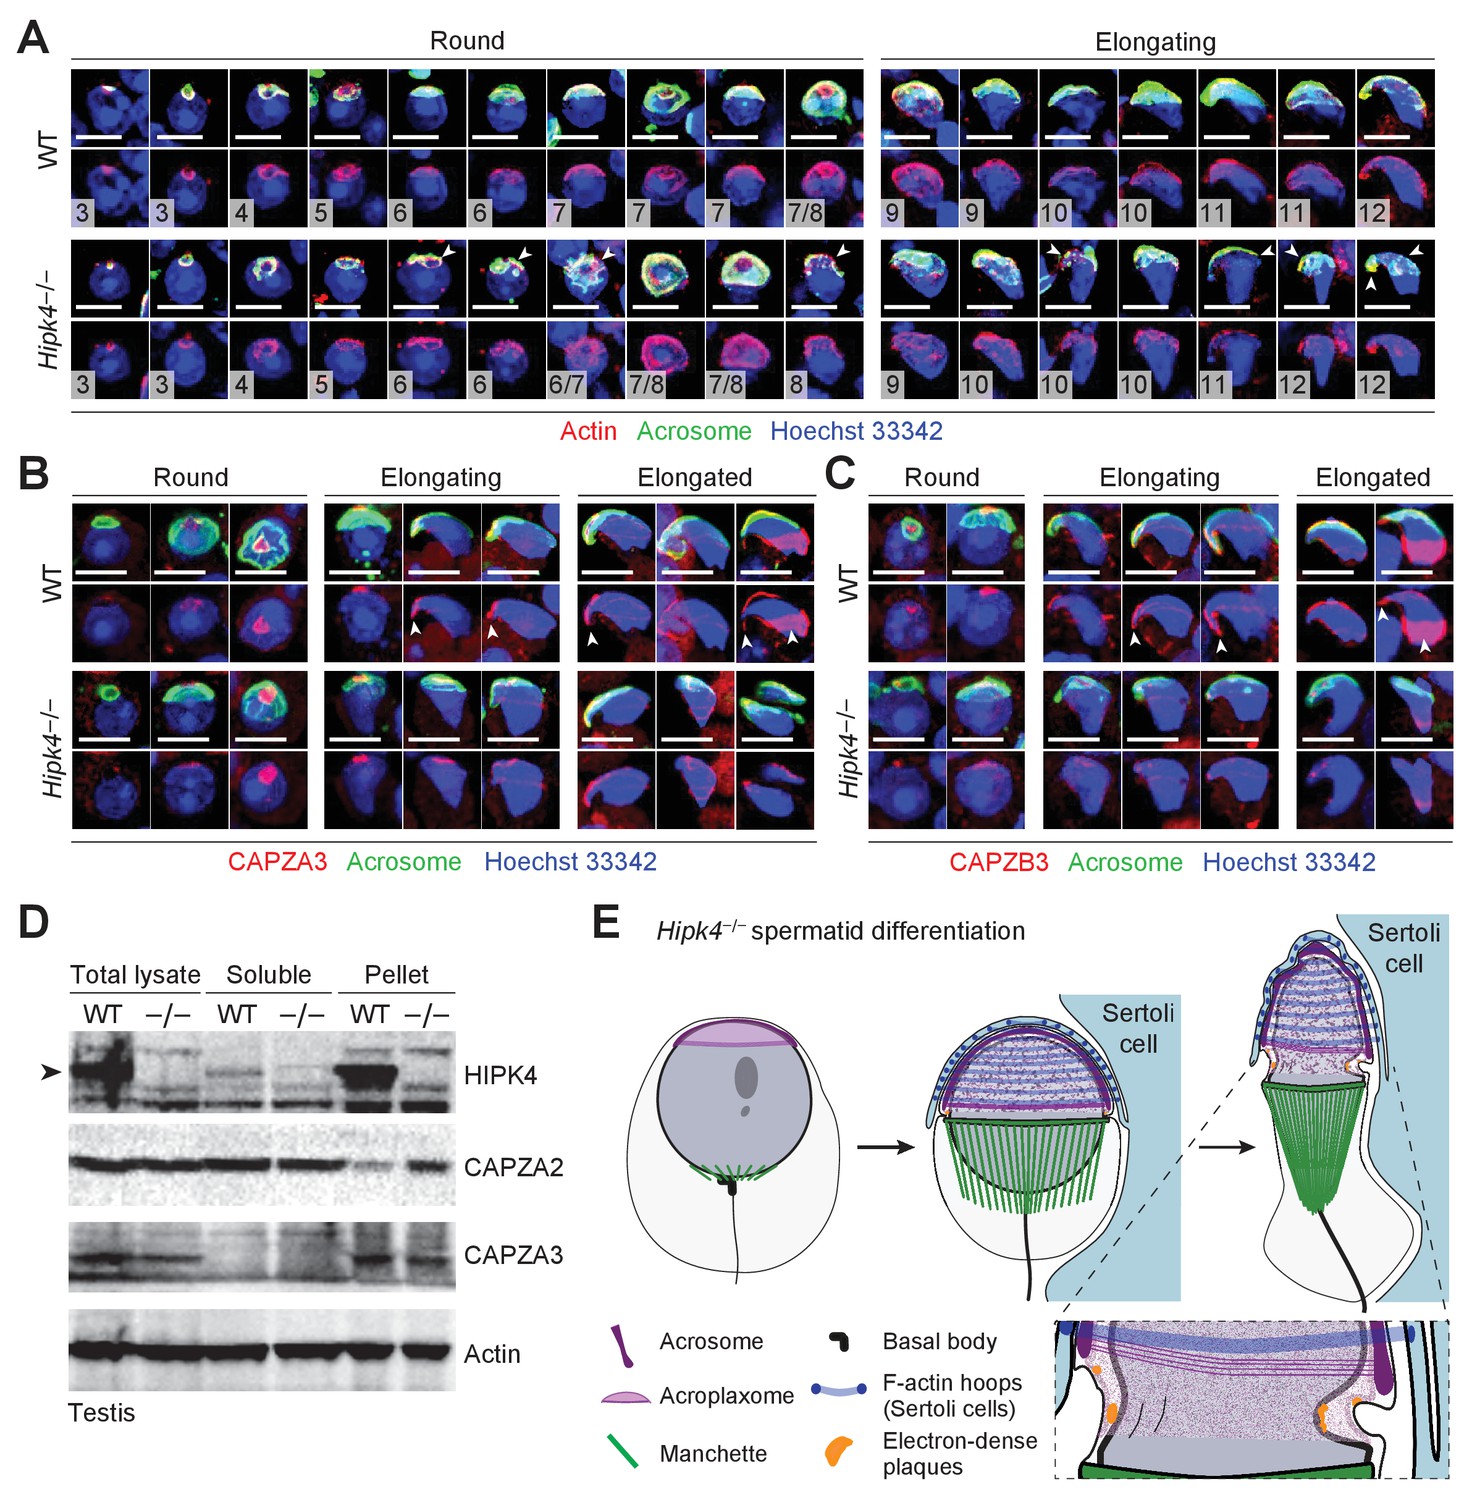
Loss of HIPK4 function alters actin dynamics in the acroplaxome.
(A–C) Fluorescence imaging of enzymatically dissociated spermatids co-labeled with FITC-PNA and (A) anti-bβ actin, (B) anti-CAPZA3, or (C) anti-CAPZB3. Nuclei were stained with Hoeschst 33342. Spermatid steps are numbered in (A), and arrowheads point to fragmented acrosomes. Arrowheads in (B–C) indicate the sharp hooked apical tip of wild-type spermatids that correspond to the perforatorium and postacrosomal sheath regions. (D) Western blot of testis lysates before and after F-actin isolation by ultracentrifugation, demonstrating that HIPK4 co-precipitates with F-actin and that HIPK4 deficiency increases CAPZA2 levels in the F-actin pellet. A representative blot from three biological replicates is shown. (E) A model illustrating that HIPK4 is required to maintain the connection between the acrosome, acroplaxome, and nuclear lamina during spermatid elongation. We hypothesize that loss of HIPK4 reduces the scaffolding function of the acroplaxome, compromising its ability to withstand forces applied by the F-actin hoops of Sertoli cells. Scale bars: A-C, 2 µm.
Figure 7—figure supplement 1
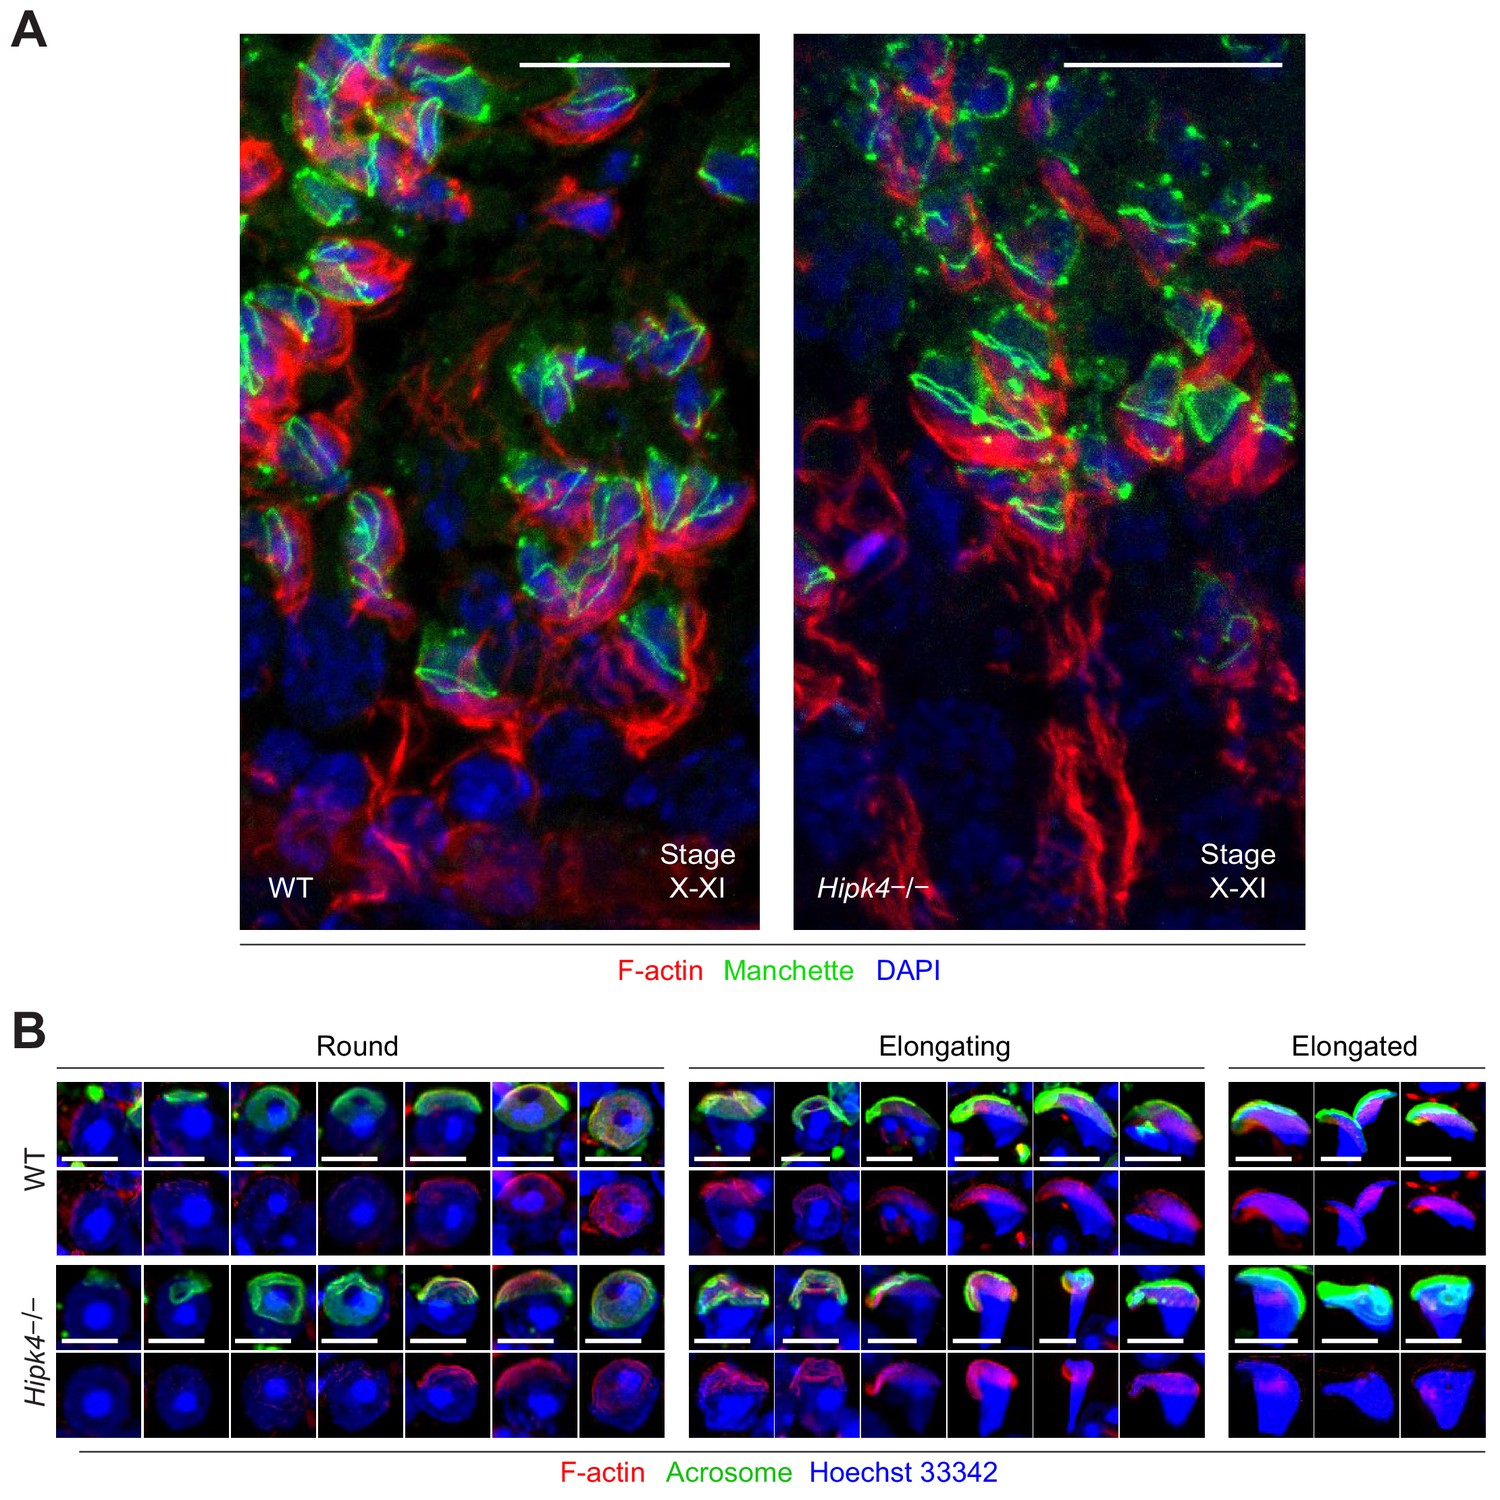
Phalloidin staining of F-actin dynamics in the acroplaxome.
(A) Cryosectioned seminiferous tubules (stage X/XI) stained with Alexa Fluor-647-phalloidin to stain F-actin and an Alexa Fluor-488-anti-EB3 antibody to stain the manchette. Basal and apical ectoplasmic specializations are the only visible actin features. (B-D) Enzymatically dissociated elongating spermatids stained with FITC-PNA and Alexafluor-647-phalloidin. Scale bars: A, 20 µm; B, 2 µm.
Author response image 1
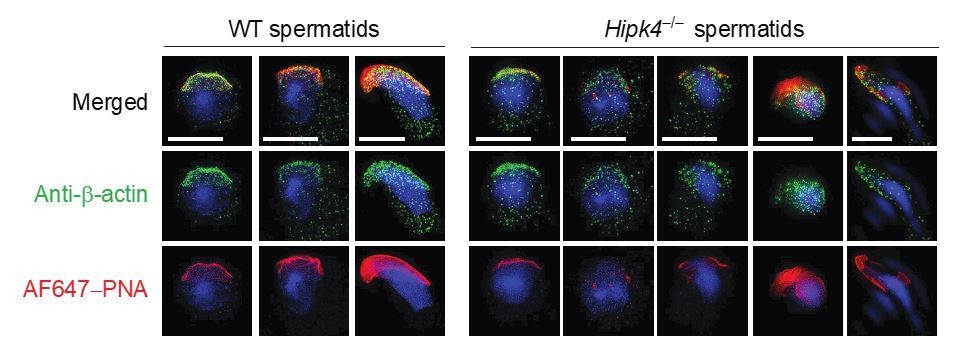
Two-dimensional structured illumination microscopy (SIM) of wild-type and Hipk4-/- spermatids.
Spermatids were isolated from the testes of wild-type and Hipk4-/- mice, fixed, and then stained with a rabbit polyclonal anti-β-actin antibody and Alexa Fluor 488-conjugated anti-rabbit IgG secondary antibody to visualize the actin cytoskeleton. Acrosomal structures in the germ cells were stained with Alexa Fluor 647-conjugated peanut agglutinin (AF647-PNA). Scale bar: 3 μm.
Additional files
-
Supplementary file 1
Key Resources Table.
- https://cdn.elifesciences.org/articles/50209/elife-50209-supp1-v1.docx
-
Transparent reporting form
- https://cdn.elifesciences.org/articles/50209/elife-50209-transrepform-v1.docx
Download links
A two-part list of links to download the article, or parts of the article, in various formats.
Downloads (link to download the article as PDF)
Open citations (links to open the citations from this article in various online reference manager services)
Cite this article (links to download the citations from this article in formats compatible with various reference manager tools)
HIPK4 is essential for murine spermiogenesis
eLife 9:e50209.
https://doi.org/10.7554/eLife.50209


