Estimating effectiveness of case-area targeted response interventions against cholera in Haiti
- Ministry of Public Health and Population, Directorate of Epidemiology Laboratory and Research, Haiti
- Aix-Marseille Université, APHM, INSERM, IRD, SESSTIM, Hop Timone, BiSTIC, Biostatistics and ICT, France
- United Nations Children's Fund, Haiti
- Centre d'Épidémiologie et de Santé Publique des Armées, Service de Santé des Armées, France
- Ministry of Public Health and Population, National Laboratory of Public Health, Haiti
- Sorbonne Université, INSERM, Institut Pierre-Louis d’Epidémiologie et de Santé Publique (IPLESP), AP-HP, Hôpital Pitié-Salpêtrière, France
- APHM, Hôpital Européen, Aix Marseille Université, INSERM, IRD, SESSTIM, IPLESP, France
- Sorbonne Université, INSERM, Institut Pierre-Louis d’Epidémiologie et de Santé Publique, France
Figures
Figure 1 with 1 supplement
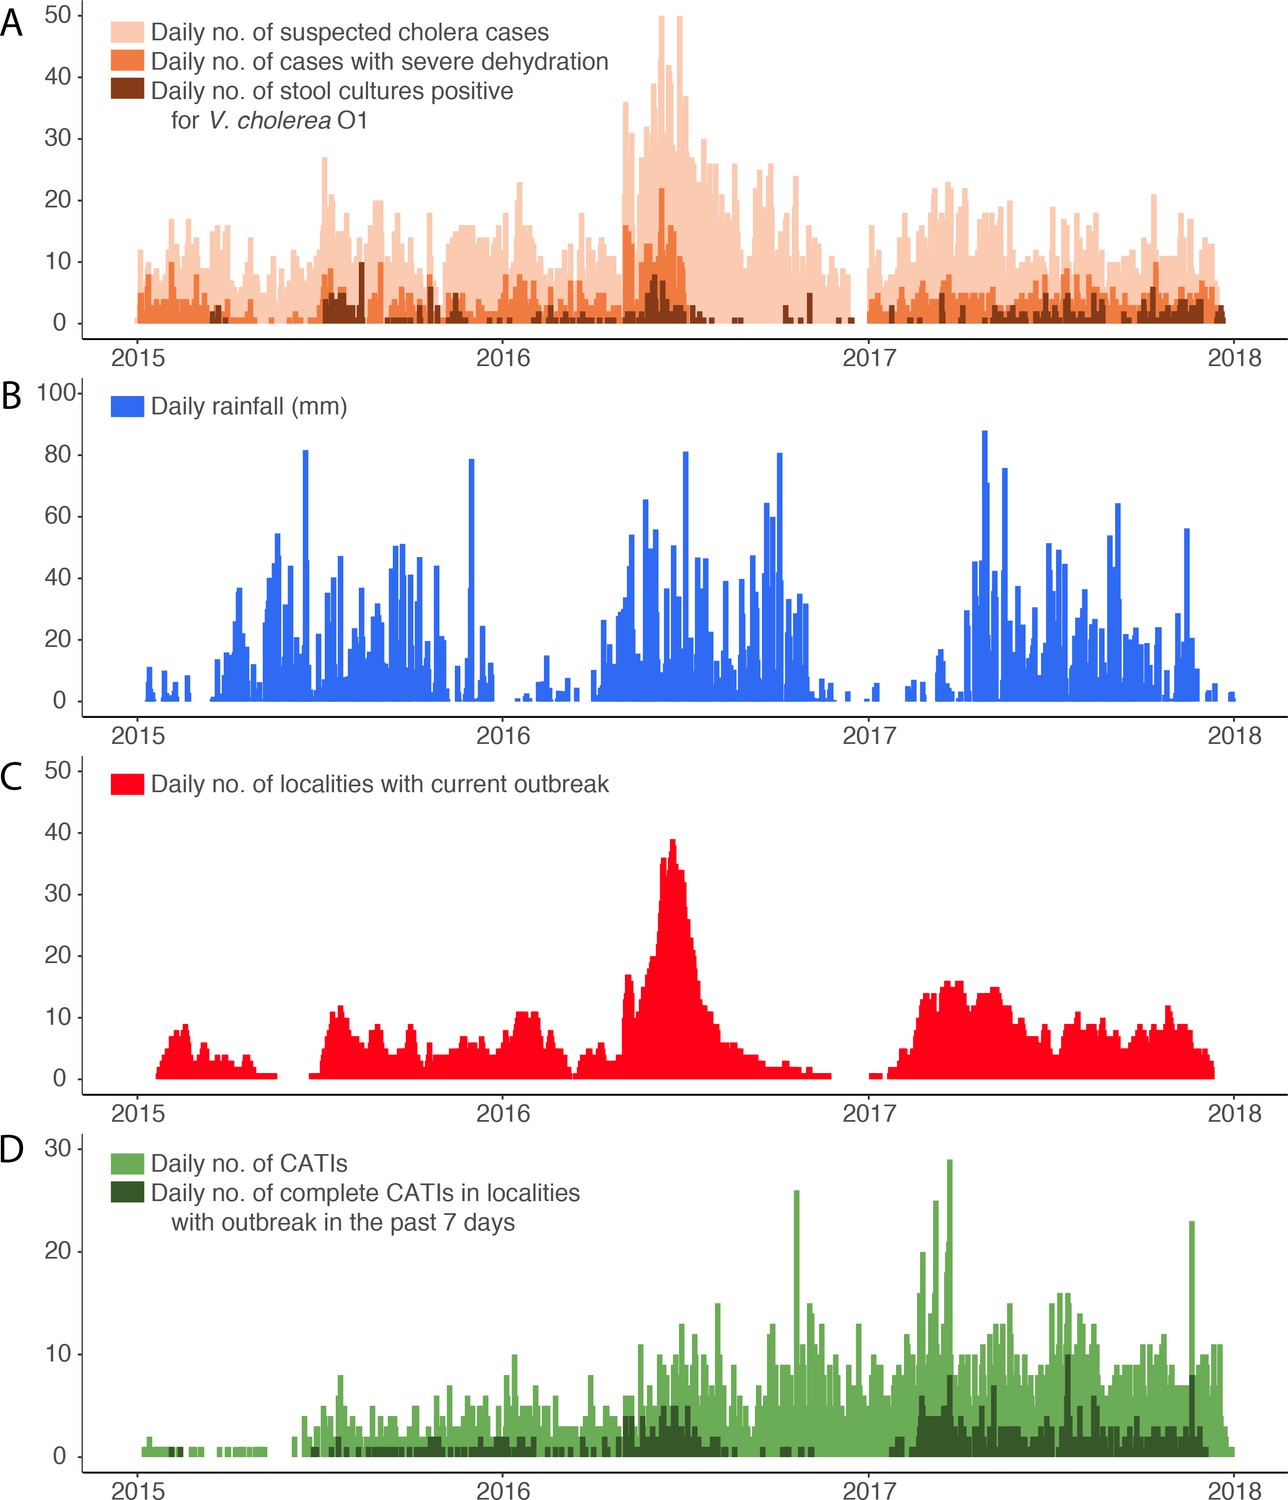
Daily evolution of (A) suspected cholera cases, cases with severe dehydration and stool cultures positive for V. cholerae O1, (B) accumulated rainfall, (C) localities with a current cholera outbreak, and (D) case-area targeted interventions (CATIs), in the Centre department of Haiti between January 2015 and December 2017.
-
Figure 1—source data 1
Daily evolution of suspected cholera cases, cases with severe dehydration, stool cultures positive for V. cholerae O1, accumulated rainfall, localities with a current cholera outbreak, and case-area targeted interventions (CATIs), between January 2015 and December 2017 in.
- https://cdn.elifesciences.org/articles/50243/elife-50243-fig1-data1-v2.xlsx
Figure 1—figure supplement 1
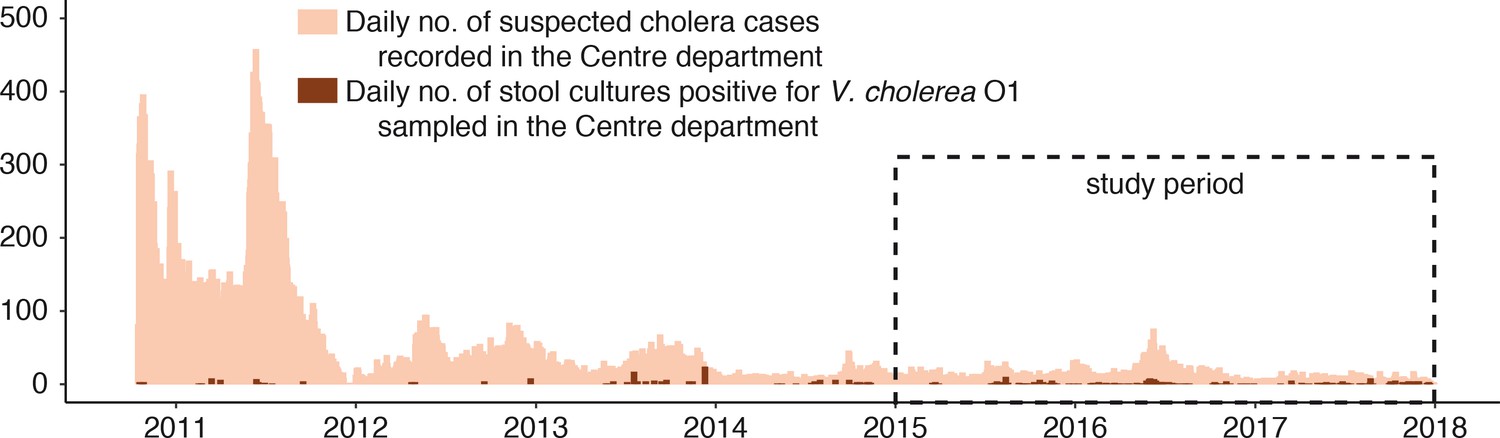
Daily evolution of suspected cholera cases recorded and stool cultures positive for V. cholerae O1 sampled in the Centre department of Haiti between October 2010 and December 2017.
Figure 2
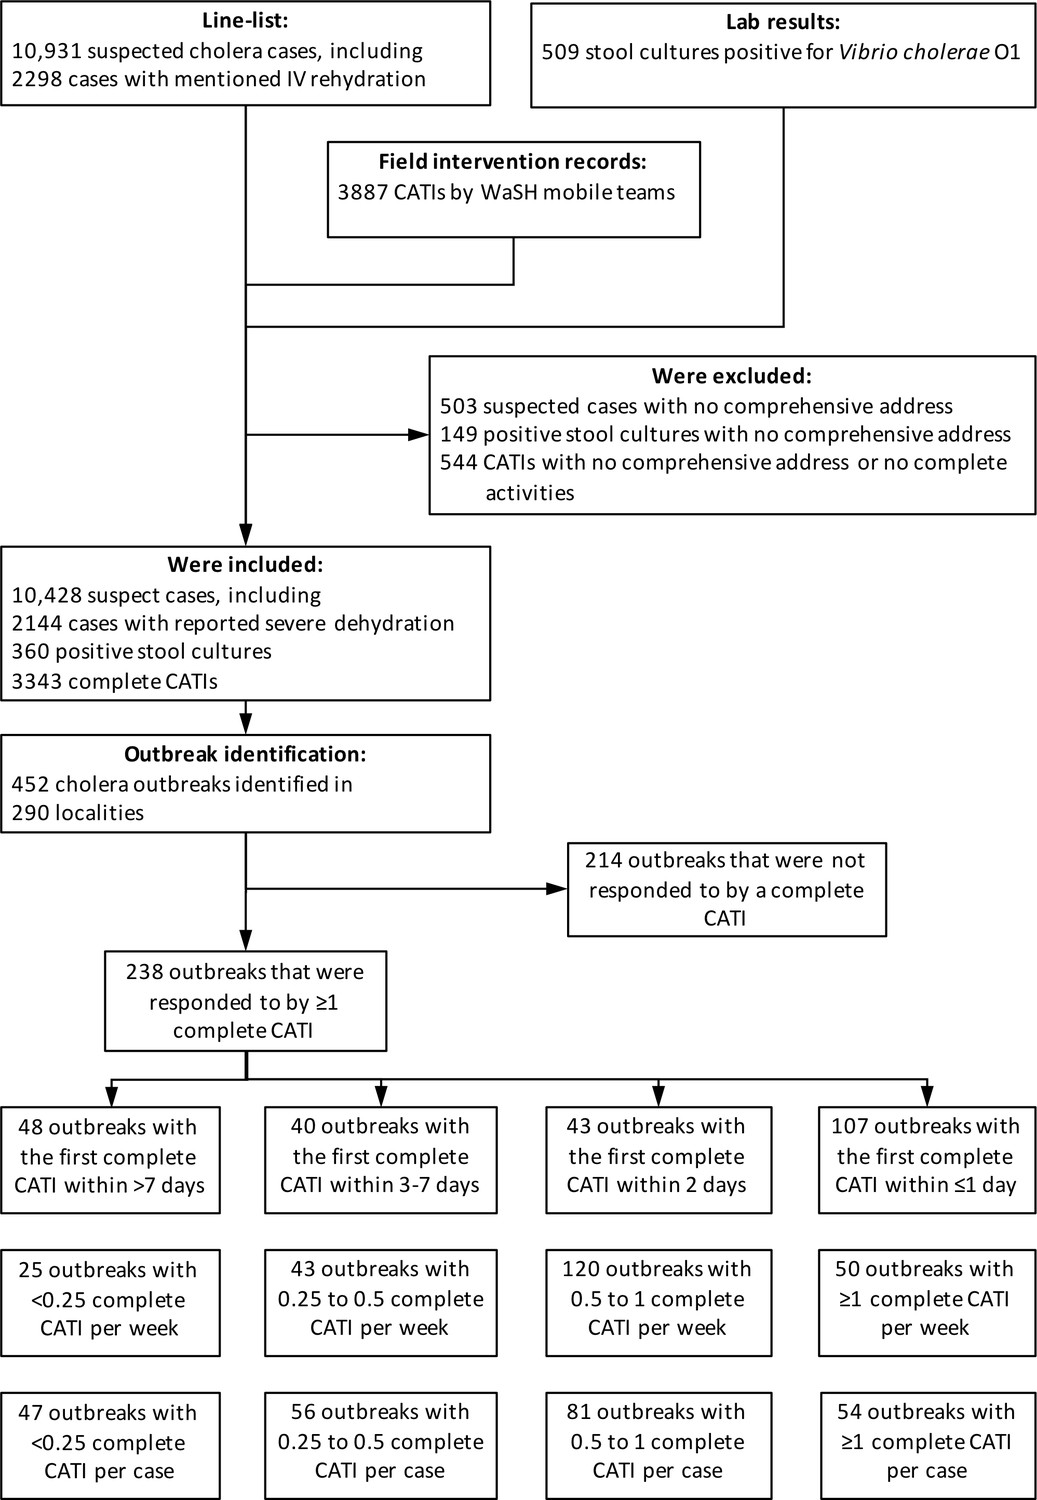
Identification of outbreaks and stratification of outbreaks according to response promptness and response intensity.
-
Figure 2—source data 1
Line-listing of suspected cholera cases, lab results of stool cultures for Vibrio cholerae O1 and list of case-area targeted interventions against cholera in the Centre department of Haiti between January 2015 and December 2017.
- https://cdn.elifesciences.org/articles/50243/elife-50243-fig2-data1-v2.xlsx
Figure 3

Cholera outbreaks in the Centre department, Haiti, between January 2015 and December 2017: spatial distribution and number of identified outbreaks (size of pie charts); proportion of outbreaks that were and were not responded with at least one complete CATI (angle of green and red slices, respectively).
Figure 4
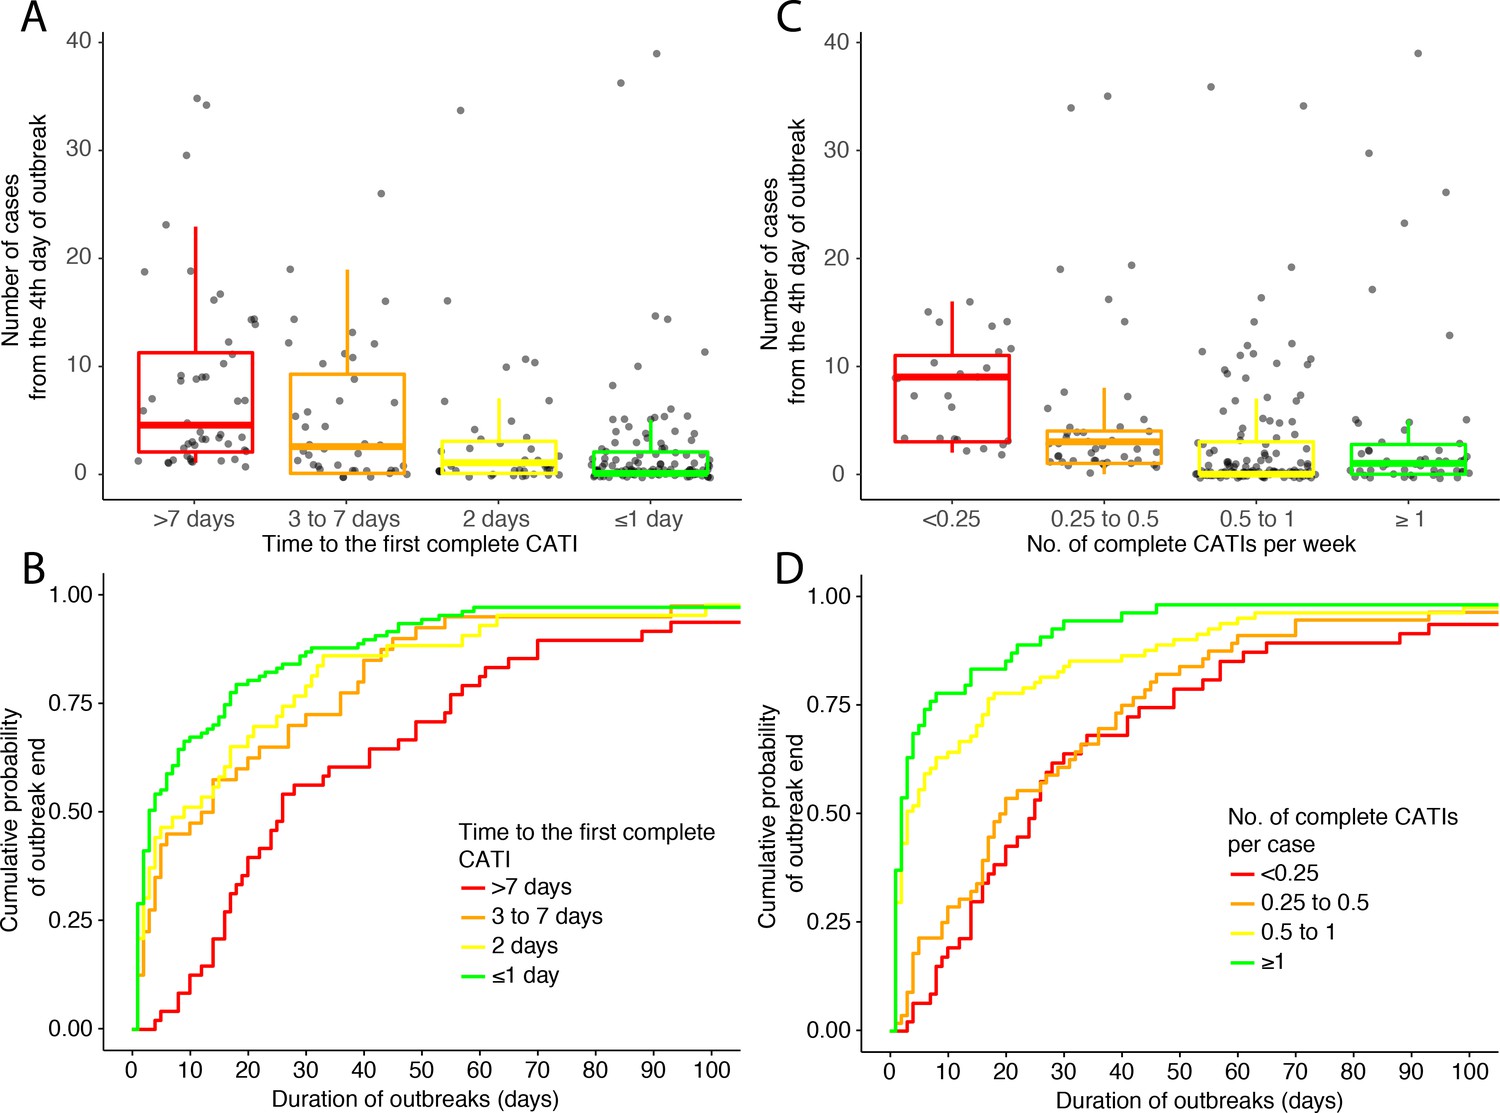
Outbreak outcome according to the class of response promptness.
(A and B) and to the class of response intensity (C and D): (A and C) comparison of the outbreak size (number of suspected cholera cases from the fourth day of outbreak) and (B and D) Kaplan-Meier comparison of the outbreak duration (in days), according to the time to the first complete CATI (A and B), to the number of complete CATIs per week (C) and to the number of complete CATIs per case (D).
-
Figure 4—source data 1
Main characteristics of outbreak response and outcome: class of time to the first complete CATI; class of number of complete CATIs per week; class of number of complete CATIs per case; number of suspected cholera cases from the fourth day of outbreaks; duration of outbreaks.
- https://cdn.elifesciences.org/articles/50243/elife-50243-fig4-data1-v2.xlsx
Appendix 2—figure 1
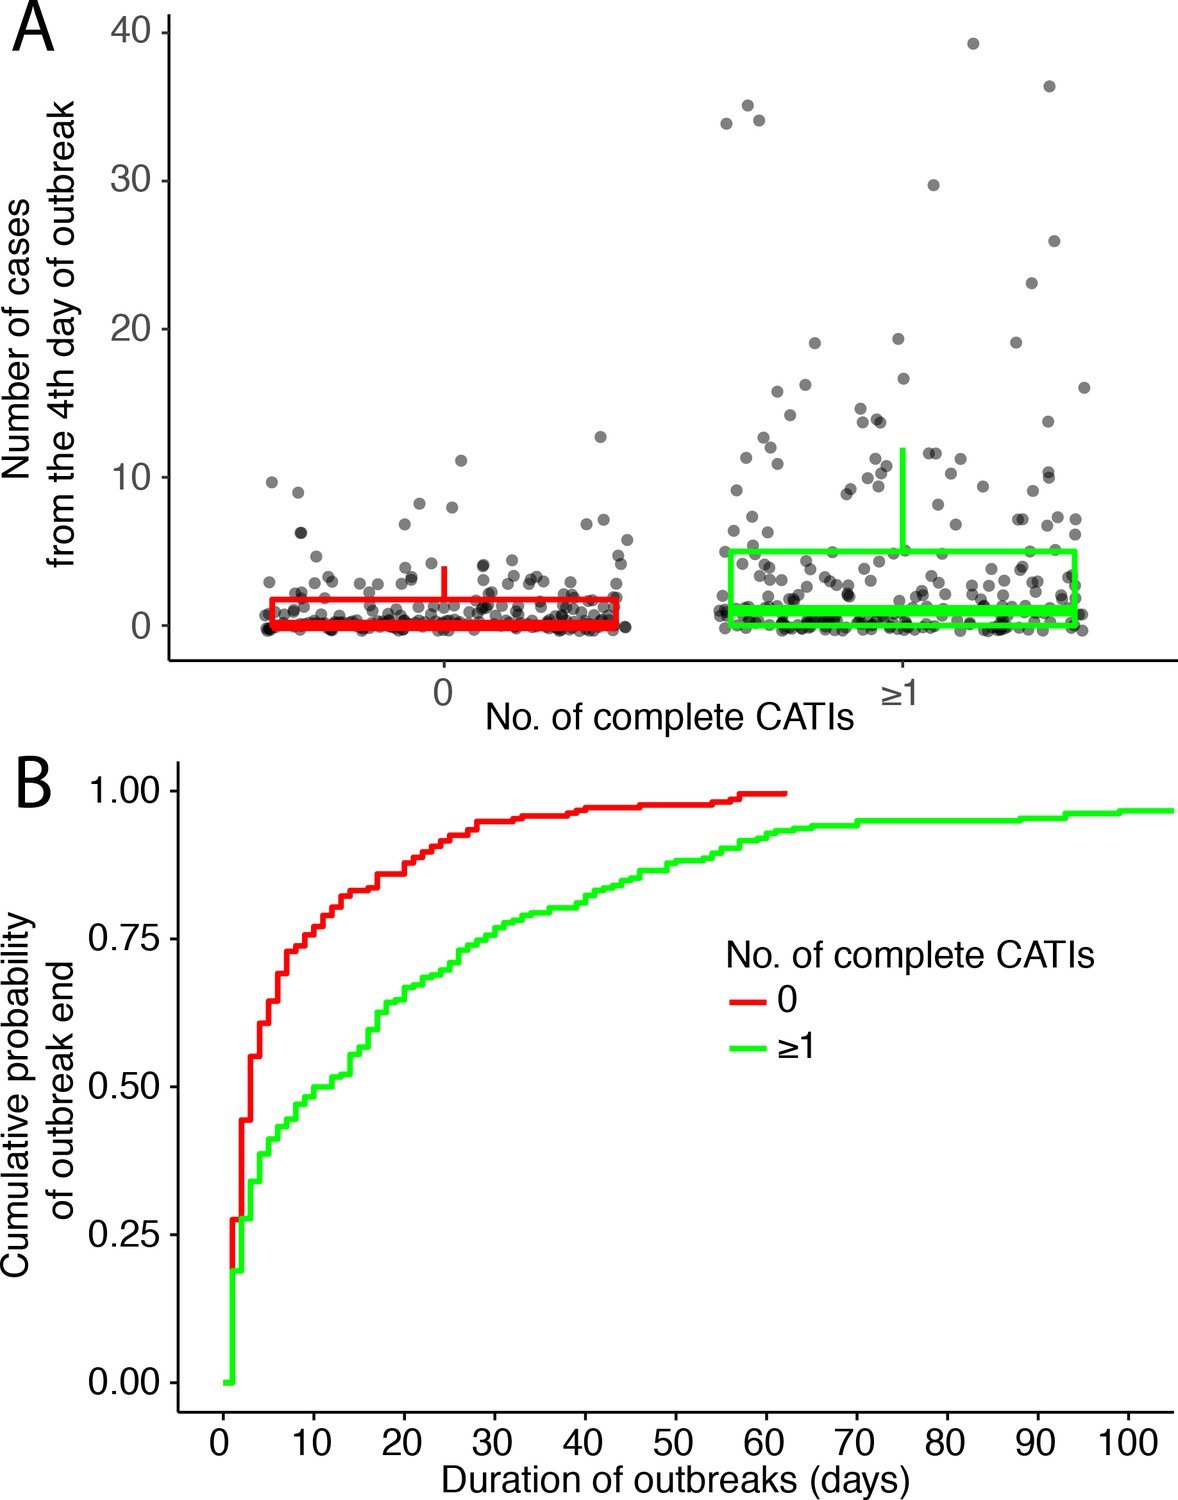
Outbreak outcome of outbreaks that were and were not responded to: (A) comparison of the outbreak size (number of suspected cholera cases from the 4th day of outbreak) and (B) Kaplan-Meier comparison of the outbreak duration (in days).
Tables
Table 1
Baseline characteristics of outbreaks that were responded to, according to the response promptness (time to the first complete case-area targeted intervention).
| All outbreaks | Outbreaks responded to with ≥ 1 complete CATI | Class of response promptness (time to the first complete CATI) | Comparison between classes of promptness | |||||
|---|---|---|---|---|---|---|---|---|
| >7 days | 3 to 7 days | 2 days | ≤1 day | Hazard ratio (95% CI)† | p-value† | |||
| No. of outbreaks | 452 | 238 (53%) | 48 (20%) | 40 (17%) | 43 (18%) | 107 (45%) | ||
| Semester sinceJanuary 2015 | 1.10e7 (1.64e6 to 7.40e7) | <0.0001* | ||||||
| Population density, median (IQR; inhab./km2) | 3.5 (6.5) | 3.6 (11.5) | 4.3 (10.6) | 2.8 (4.6) | 3.7 (8.9) | 3.8 (12.6) | 1.01 (1 to 1.02) | 0.0039* |
| Travel time to thenearest town, median (IQR;minutes) | 26.7 (33.2) | 24.9 (31.8) | 30 (3 4.3) | 27.1 (42.1) | 24.8 (28.4) | 22 (32) | 1 (0.99 to 1) | 0.274 |
| Accumulated incidence between 2010 and 2014, median (IQR; per 1000 inhabitants) | 103.8 (77.5) | 103.8 (77.5) | 103.8 (131.4) | 103.8 (49.1) | 103.8 (56.6) | 103.8 (77.5) | 0.4 (0.09 to 1.83) | 0.237 |
| Coverage of OCVcampaigns between 2012 and 2014, median (IQR;%) [mean, SD] | 0% (86) [25%, 40] | 0% (0) [21%, 38] | 0% (86) [30%, 42] | 0% (0) [18%, 36] | 0% (0) [15%, 33] | 0% (0) [21%, 38] | 0.61 (0.38 to 0.98) | 0.0393* |
| Previous cases inthe same localityduring the study, median (IQR; no.per year) | 4.3 (10.1) | 5.2 (10.5) | 7.2 (10.1) | 5 (11.5) | 6.9 (11.1) | 5 (8.5) | 0.99 (0.97–1.02) | 0.6540 |
| Previous completeCATIs in the samelocality during thestudy, median(IQR; no. per year) | 0.2 (1.9) | 0.9 (2.7) | 0.7 (2.2) | 0.5 (2.3) | 1.2 (2.9) | 1.4 (2.7) | 0.98 (0.91–1.06) | 0.6500 |
| Daily rainfall during outbreak,median (IQR; mm) | 6.6 (13.3) | 7.7 (13.3) | 12 (6) | 6.9 (10.8) | 10 (13.7) | 3.6 (14.4) | 0.99 (0.96 to 1.03) | 0.638 |
| No. of cases duringthe first 3 daysofoutbreak, median (IQR) [mean, SD] | 2 (1) [2.5, 1.5] | 2 (1) [2.7, 1.9] | 2 (1) [2.5, 1.0] | 2.5 (1) [3.4, 2.1] | 2 (0.5) [2.8, 2.4] | 2 (1) [2.5, 1.9] | 1.04 (0.93 to 1.16) | 0.488 |
| No. of positiveculture during thefirst 3 daysof outbreak, median(IQR) [mean, SD] | 0 (0) [0.2, 0.6] | 0 (0) [0.3, 0.7] | 0 (0) [0.1, 0.3] | 0 (0) [0.2, 0.5] | 0 (1) [0.5, 0.9] | 0 (1) [0.4, 0.7] | 2.03 (1.3 to 3.17) | 0.0018* |
-
CATI, case-area targeted intervention; IQR, interquartile range; SD, standard deviation.
†Univariate comparisons between classes of response promptness using Cox models for Andersen-Gill counting process (AG-CP), with time to the first complete CATI modelled as a recurrent time-to-event outcome.
-
*Significant p-value.
Table 2
Baseline characteristics of outbreaks that were responded to, according to the response intensity (number of complete case-area targeted interventions per week or per case).
| No. of complete CATIs per week | Comparison between classes of CATIs per week | |||||
|---|---|---|---|---|---|---|
| <0.25 | 0.25 to 0.5 | 0.5 to 1 | ≥1 | OR (95% CI)† | p-value† | |
| No. of outbreaks | 25 (11%) | 43 (18%) | 120 (50%) | 50 (21%) | ||
| Semester since January 2015 | 1.14 (1.03 to 1.25) | 0.0111* | ||||
| Population density, median (IQR;inhab./km2) | 3.9 (11.8) | 3.4 (3.8) | 3.4 (12) | 3.7 (11.8) | 1 (1 to 1.01) | 0.4093 |
| Travel time to the nearest town, median (IQR; minutes) | 30 (26.8) | 33.5 (41.9) | 22.1 (28) | 25.4 (34.2) | 1 (1 to 1.01) | 0.8379 |
| Accumulated incidencebetween 2010 and 2014, median (IQR; per 1000 inhab) | 125.8 (250.9) | 99.5 (97.8) | 103.8 (49) | 103.8 (79.6) | 0.64 (0.37 to 1.1) | 0.1037 |
| Coverage of OCVcampaigns between2012 and 2014, median(IQR; %) [mean, SD] | 0% (86) [43%, 44] | 0% (0) [11%, 29] | 0% (0) [19%, 36] | 0% (86) [25%, 40] | 1.03 (0.74 to 1.44) | 0.8464 |
| Previous cases in thesame locality during thestudy, median (IQR; no.per year) | 10.1 (9.4) | 6 (8.8) | 4 (9) | 5.9 (11.7) | 1.01 (0.99–1.02) | 0.5011 |
| Previous complete CATIsin the same localityduring the study, median(IQR; no. per year) | 0.7 (2.1) | 0.4 (2.5) | 1 (2.7) | 1.5 (3.2) | 1.04 (1–1.08) | 0.0763 |
| Daily rainfall duringoutbreak, median (IQR;mm) | 12 (4) | 8 (11.5) | 6.6 (16.3) | 6.2 (11.1) | 0.99 (0.98 to 1.01) | 0.331 |
| No. of cases during thefirst 3 daysof outbreak,median (IQR) [mean, SD] | 2 (0) [3.1, 2.7] | 2 (1) [2.7, 1.5] | 2 (0) [2.3, 1.4] | 3 (2) [3.4, 2.5] | 0.81 (0.71 to 0.93) | 0.3806 |
| No. of positive cultureduring the first 3 daysofoutbreak, median (IQR) [mean, SD] | 0 (0) [0.2, 0.6] | 0 (0) [0.2, 0.4] | 0 (1) [0.4, 0.8] | 0 (0) [0.2, 0.6] | 1.03 (0.85 to 1.25) | 0.7569 |
| No. of complete CATIs per case | Comparison between classes of CATIs per case | |||||
| <0.25 | 0.25 to 0.5 | 0.5 to 1 | ≥1 | OR (95% CI)† | p-value† | |
| No. of outbreaks | 47 (20%) | 56 (24%) | 81 (34%) | 54 (23%) | ||
| Semester since January2015 | 1.24 (1.13 to 1.37) | <0.0001* | ||||
| Population density,median (IQR;inhab./km2) | 3 (5) | 4.2 (14.7) | 3.3 (3.6) | 3.7 (12.9) | 1 (1 to 1.01) | 0.468 |
| Travel time to thenearest town, median(IQR; minutes) | 31.2 (42.1) | 17.3 (44.4) | 25.5 (27.3) | 18.9 (23.7) | 1 (0.99 to 1) | 0.344 |
| Accumulated incidencebetween 2010 and 2014, median (IQR; per 1000 inhabitants) | 125.8 (77.5) | 103.8 (93.5) | 103.8 (64.6) | 103.8 (43.3) | 1.01 (0.42 to 2.43) | 0.981 |
| Coverage of OCVcampaigns between 2012 and 2014, median(IQR; %) [mean, SD] | 0% (86) [30%, 42] | 0% (0) [13%, 31] | 0% (0) [21%, 38] | 0% (0) [22%, 38] | 0.96 (0.6 to 1.54) | 0.881 |
| Previous cases in thesame locality during the study, median (IQR; no. per year) | 4.4 (9.9) | 8.4 (16.3) | 6.2 (7.9) | 3.5 (6.4) | 1 (0.98–1.02) | 0.7730 |
| Previous complete CATIsin the same locality during the study, median(IQR; no. per year) | 0 (1) | 1.4 (4.3) | 1.4 (2.7) | 1 (2.6) | 1.03 (0.97–1.08) | 0.3550 |
| Daily rainfall duringoutbreak, median (IQR;mm) | 12 (4.3) | 6.1 (13.7) | 5.3 (13.6) | 6.1 (13.7) | 1 (0.98 to 1.02) | 0.983 |
| No. of cases during thefirst 3 daysof outbreak,median (IQR) [mean, SD] | 3 (3) [4.3, 3.2] | 2 (1) [2.6, 1.1] | 2 (0) [2.5, 1.3] | 2 (1) [1.8, 0.8] | 0.81 (0.71 to 0.93) | 0.0019* |
| No. of positive cultureduring the first 3 daysofoutbreak, median (IQR)[mean, SD] | 0 (0) [0.2, 0.9] | 0 (0) [0.3, 0.5] | 0 (0) [0.2, 0.6] | 0 (1) [0.6, 0.7] | 1.14 (0.92 to 1.42) | 0.232 |
-
CATI, case-area targeted intervention; IQR, interquartile range; SD, standard deviation; OR (95% CI), Odds ratio (95%-confidence interval).
†Univariate comparisons using generalized linear mixed models with CATIs/weeks ratio or CATIs/cases ratio as model outcome and a negative-binomial distribution.
-
*Significant p-value.
Table 3
CATI effectiveness (CE1) of the response promptness (time to the first complete CATI) on outbreak size (number of cases from the fourth day of outbreak).
| No. of cases from the 4th day of outbreak | Crude estimate of CATI effectiveness (cCE1)† | Adjusted estimate of CATI effectiveness (aCE1)‡ | ||||
|---|---|---|---|---|---|---|
| N | Median (IQR) | % (95% CI) | p-value | % (95% CI) | p-value | |
| Time to the first complete CATI | ||||||
| >7 days | 48 | 4.5 (9.25) | Ref | Ref | Ref | Ref |
| 3 to 7 days | 40 | 2.5 (9.25) | 49% (6 to 72) | 0.0318* | 50% (9 to 72) | 0.0222* |
| 2 days | 43 | 1 (3) | 76% (55 to 87) | <0.0001* | 68% (40 to 83) | 0.0004* |
| ≤1 day | 107 | 0 (2) | 83% (71 to 90) | <0.0001* | 76% (59 to 86) | <0.0001* |
-
CATI, case-area targeted intervention; IQR, interquartile range.
*Significant p-value.
-
†Crude CATI effectiveness (cCE1) was estimated on the No. of cases from the fourth day of outbreak, using generalized linear mixed models with a negative-binomial distribution, as (1 – Incidence ratio).
‡Estimates of CATI effectiveness (aCE1) were adjusted according to covariates for which p-values were less than 0.25 at the initial univariate step (Table 1): number of positive cultures during the first 3 days of outbreak, population density, accumulated case incidence between 2010 and 2014, coverage of OCV campaigns between 2012 and 2014 and semester.
Table 4
CATI effectiveness (CE2) of the response promptness (time to the first complete CATI) on outbreak duration (in days).
| Duration of outbreak | Crude estimate of CATI effectiveness (cCE2)† | Adjusted estimate of CATI effectiveness (aCE2)‡ | ||||
|---|---|---|---|---|---|---|
| N | Median (IQR; days) | % (95% CI) | p-value | % (95% CI) | p-value | |
| Time to the first complete CATI | ||||||
| >7 days | 48 | 26 (39) | Ref | Ref | Ref | Ref |
| 3 to 7 days | 40 | 13 (33) | 45% (17 to 64) | 0.0046* | 53% (29 to 69) | 0.0004* |
| 2 days | 43 | 9 (25) | 37% (−6 to 62) | 0.0810 | 27% (−22 to 56) | 0.2322 |
| ≤1 day | 107 | 3 (15.5) | 59% (36 to 74) | <0.0001* | 61% (41 to 75) | <0.0001* |
-
CATI, case-area targeted intervention; IQR, interquartile range.
*Significant p-value.
-
†Crude CATI effectiveness (cCE2) was estimated on the duration of outbreak, using Cox models for Andersen-Gill counting process (AG-CP), as (1–1/hazard ratio).
‡Estimates of CATI effectiveness (aCE2) were adjusted according to covariates for which p-values were less than 0.25 at the initial univariate step (Table 1): number of positive cultures during the first 3 days of outbreak, population density, accumulated case incidence between 2010 and 2014, coverage of OCV campaigns between 2012 and 2014 and semester.
Table 5
CATI effectiveness (CE3) of the response intensity (number of complete CATIs per week) on outbreak size (number of cases from the fourth day of outbreak).
| No. of cases after the 4th day of outbreak | Crude estimate of CATI effectiveness (cCE3)† | Adjusted estimate of CATI effectiveness (aCE3)‡ | ||||
|---|---|---|---|---|---|---|
| N | Median (IQR) | % (95% CI) | p-value | % (95% CI) | p-value | |
| No. of complete CATIs per week | ||||||
| <0.25 | 25 | 9 (8) | Ref | Ref | Ref | Ref |
| 0.25 to 0.5 | 43 | 3 (3) | 55% (1 to 79) | 0.0457* | 45% (−17 to 74) | 0.1206 |
| 0.5–1 | 120 | 0 (3) | 79% (59 to 89) | <0.0001* | 70% (42 to 84) | 0.0003* |
| ≥1 | 50 | 1 (2.75) | 74% (44 to 88) | 0.0006* | 59% (11 to 81) | 0.0235* |
-
CATI, case-area targeted intervention; IQR, interquartile range.
*Significant p-value.
-
†Crude CATI effectiveness (cCE3) was estimated on the No. of cases from the fourth day of outbreak, using generalized linear mixed models with a negative-binomial distribution, as (1 – Incidence ratio).
‡Estimates of CATI effectiveness (aCE3) were adjusted according to covariates for which p-values were less than 0.25 at the initial univariate step (Table 2): accumulated case incidence between 2010 and 2014, and semester.
Table 6
CATI effectiveness (CE4) of the response intensity (number of complete CATIs per case) on outbreak duration (in days).
| Duration of outbreak | Crude estimate of CATI effectiveness (cCE4)† | Adjusted estimate of CATI effectiveness (aCE4)‡ | ||||
|---|---|---|---|---|---|---|
| N | Median (IQR; days) | % (95% CI) | p-value | % (95% CI) | p-value | |
| No. of complete CATIs per case | ||||||
| <0.25 | 47 | 25 (32) | Ref | Ref | Ref | Ref |
| 0.25 to 0.5 | 56 | 19.5 (30.75) | 8% (−35 to 37) | 0.6738 | 1% (−45 to 32) | 0.9759 |
| 0.5 to 1 | 81 | 3 (16) | 59% (35 to 75) | 0.0002* | 57% (30 to 74) | 0.0007* |
| ≥1 | 54 | 2 (5.75) | 76% (54 to 88) | <0.0001* | 73% (49 to 86) | <0.0001* |
-
CATI, case-area targeted intervention; IQR, interquartile range.
*Significant p-value.
-
†Crude CATI effectiveness (cCE4) was estimated on the duration of outbreak, using Cox models for Andersen-Gill counting process (AG-CP), as (1–1/hazard ratio).
‡Estimates of CATI effectiveness (aCE4) were adjusted according to covariates for which p-values were less than 0.25 at the initial univariate step (Table 2): number of cases and number of positive cultures during the first 3 days of outbreak, yearly number of previous complete CATIs during the study, and semesters.
Table 7
Effectiveness of complete CATIs stratified by antibiotic prophylaxis.
| Outbreak subgroup | All outbreaks responded to by any complete CATIs (Tables 3–6) | Outbreaks only responded to by complete CATIs with ATB | Outbreaks only responded to by complete CATIs without ATB | ||||
|---|---|---|---|---|---|---|---|
| No. of outbreaks that were responded to (%) | 238 (53%) | 115 (25%) | 78 (17%) | ||||
| % (95% CI) | p-value | % (95% CI) | p-value | % (95% CI) | p-value | ||
| CATI effectiveness according to the response promptness | |||||||
| ≤1 day vs > 7 days adjusted estimate of CATI effectiveness on accumulated cases (aCE1)† | 76% (59 to 86) | <0.0001* | 63% (24 to 82) | 0.007* | 39% (−38 to 73) | 0.2369 | |
| ≤1 day vs > 7 days adjusted estimate of CATI effectiveness on outbreak duration (aCE2)‡ | 61% (41 to 75) | <0.0001* | 74% (43 to 88) | 0.0009* | 58% (11 to 80) | 0.0237* | |
| CATI effectiveness according to the response intensity | |||||||
| ≥1 vs<0.25 completeCATIsper week adjusted estimateof CATI effectivenessonaccumulated cases (aCE3)$ | 59% (11 to 81) | 0.0235* | 62% (3 to 85) | 0.042 | 76% (12 to 94) | 0.0312 | |
| ≥1 vs<0.25 completeCATIs per case adjusted estimateof CATI effectivenessonoutbreak duration (aCE4)£ | 73% (49 to 86) | <0.0001* | 90% (72 to 96) | <0.0001* | 79% (46 to 92) | 0.0012* | |
-
CATI, case-area targeted intervention.
ATB, antibiotic prophylaxis.
-
†Estimates of CATI effectiveness (aCE1) were adjusted according to covariates for which p-values were less than 0.25 at the initial univariate step (Table 1): number of positive cultures during the first 3 days of outbreak, population density, accumulated case incidence between 2010 and 2014, coverage of OCV campaigns between 2012 and 2014 and semester.
‡Estimates of CATI effectiveness (aCE2) were adjusted according to covariates for which p-values were less than 0.25 at the initial univariate step (Table 1): number of positive cultures during the first 3 days of outbreak, population density, accumulated case incidence between 2010 and 2014, coverage of OCV campaigns between 2012 and 2014 and semester.
-
$Estimates of CATI effectiveness (aCE3) were adjusted according to covariates for which p-values were less than 0.25 at the initial univariate step (Table 2): accumulated case incidence between 2010 and 2014, and semester.
£Estimates of CATI effectiveness (aCE4) were adjusted according to covariates for which p-values were less than 0.25 at the initial univariate step (Table 2): number of cases and number of positive cultures during the first 3 days of outbreak, yearly number of previous complete CATIs during the study, and semesters.
-
*significant after Bonferroni correction.
Appendix 1—table 1
Baseline characteristics of suspected cholera cases, cholera stool cultures and case-area targeted interventions (CATIs) from January 1, 2015, to December 31, 2017.
| Suspected cholera cases | |
|---|---|
| Total no. of cases | 10931 |
| Median age (IQR) | 18 (35) |
| Sex ratio (M/F) | 1.0 |
| No. of cases with a comprehensive location (%) | 10428 (95%) |
| No. of different localities | 1497 |
| No. of cases with IV rehydration (%) | 2301 (21%) |
| No. of cases with a comprehensive location and IV rehydration (%) | 2144 (20%) |
| Stool cultures | |
| Total no. of stool samples cultured | 1070 |
| No. of stool cultures positive for V. cholerae O1 (%) | 509 (48%) |
| No. of positive cultures with a comprehensive location (%) | 360 (34%) |
| No. of different localities | 176 |
| Case-area targeted interventions (CATIs) | |
| Total no. of CATIs | 3887 |
| No. of CATIs conducted with EMIRA staff (%) | 2719 (70%) |
| No. of CATIs with a comprehensive location (%) | 3533 (91%) |
| No. of different localities | 815 |
| No. of CATIs with reported house decontamination (%) | 3655 (94%) |
| No. of decontaminated houses per CATI, median (IQR) | 4 (5) |
| No. of CATIs with reported education (%) | 3815 (98%) |
| No. of educated people per CATI, median (IQR) | 30 (47) |
| No. of CATIs with reported chlorine distribution (%) | 3748 (96%) |
| No. of household receiving chlorine per CATI, median (IQR) | 7 (8) |
| No. of CATIs with reported antibiotic prophylaxis (%) | 2002 (52%) |
| No. of people receiving antibiotic prophylaxis per CATI, median (IQR) | 20 (19) |
| No. of complete CATIs (%) | 3596 (93%) |
| No. of complete CATIs with antibiotic prophylaxis (%) | 1922 (49%) |
-
EMIRA, cholera rapid response team of the Ministry of health; IQR, interquartile range.
*Complete CATI, at least decontamination, education and distribution of chlorine tablets.
Appendix 2—table 1
Baseline characteristics of outbreaks that were and were not responded to.
| All outbreaks | Outbreaks with no complete CATI | Outbreaks with ≥ 1 complete CATI | Odds radio† (95% CI) | p-value† | |
|---|---|---|---|---|---|
| No. of outbreaks | 452 | 214 (47%) | 238 (53%) | ||
| Semester since January 2015 | 2.03 (1.63 to 2.51) | <0.0001* | |||
| Population density,median (IQR; inhab./km2) | 3.5 (6.5) | 3.4 (4.8) | 3.6 (11.5) | 1.01 (1 to 1.02) | 0.0308* |
| Travel time to thenearest town, median(IQR; minutes) | 26.7 (33.2) | 30.2 (31.9) | 24.9 (31.8) | 0.99 (0.98 to 1) | 0.0143* |
| Accumulated incidencebetween 2010 and 2014,median (IQR; per 1000inhabitants) | 103.8 (77.5) | 103.8 (293.4) | 103.8 (77.5) | 0.43 (0.08 to 2.33) | 0.327 |
| Coverage of OCVcampaigns between 2012 and 2014, median(IQR; %) [mean, SD] | 0% (86) [25%, 40] | 0% (86) [30%, 42] | 0% (0) [21%, 38] | 0.52 (0.3 to 0.87) | 0.0137* |
| Previous cases in thesame locality during the study, median (IQR; no.per year) | 4.3 (10.1) | 4 (9) | 5.2 (10.5) | 1.01 (0.99–1.04) | 0.2320 |
| Previous complete CATIs in the same localityduring the study, median(IQR; no. per year) | 0.2 (1.9) | 0 (0.8) | 0.9 (2.7) | 1.23 (1.11–1.36) | <0.0001* |
| Daily rainfall duringoutbreak, median (IQR;mm) | 6.6 (13.3) | 5.2 (12.5) | 7.7 (13.3) | 1.01 (0.99 to 1.03) | 0.359 |
| No. of cases during thefirst 3 daysof outbreak, median (IQR) [mean, SD] | 2 (1) [2.5, 1.5] | 2 (0) [2.3, 0.9] | 2 (1) [2.7, 1.9] | 1.22 (1.04 to 1.43) | 0.0156* |
| No. of positive cultureduring the first 3 daysofoutbreak, median (IQR) [mean, SD] | 0 (0) [0.2, 0.6] | 0 (0) [0.2, 0.5] | 0 (0) [0.3, 0.7] | 1.64 (1.12 to 2.39) | 0.0101* |
-
CATI, case-area targeted intervention; SD, standard deviation.
†Univariate comparisons using univariate logistic mixed models with response as model outcome and a binomial distribution, and outbreaks with no complete CATI as the reference class.
-
*Significant p-value.
Appendix 2—table 2
Protective effectiveness of response: comparison of the number of suspected cholera cases from the 4th day of outbreak between outbreaks that were and were not responded to (CE5).
| No. of cases from the 4th day of outbreak | Crude estimate of CATI effectiveness (cCE5)† | Adjusted estimate of CATI effectiveness (aCE5)‡ | ||||
|---|---|---|---|---|---|---|
| N | Median (IQR) | % (95% CI) | p-value | % (95% CI) | p-value | |
| No. of CATIs during outbreak | ||||||
| No CATI* | 214 | 0 (2) | Ref | Ref | Ref | Ref |
| ≥1 CATIs | 238 | 1 (5) | −228% (−353 to −138) | <0.0001 | −411% (−638 to −254) | <0.0001 |
-
CATI, case-area targeted intervention; IQR, interquartile range.
*Reference class.
-
†Crude CATI effectiveness (cCE3) was estimated on the No. of cases from the 4th day of outbreak, using logistic mixed models, as (1 – Odds ratio).
‡Estimates of CATI effectiveness (aCE3) were adjusted according to covariates for which p-values were less than 0.25 at the initial univariate step (Appendix 2—table 1): number of cases and number of positive cultures during the first 3 days of outbreak, population density, travel time to the nearest town, coverage of OCV campaigns between 2012 and 2014 OCV campaigns, and semesters.
Appendix 2—table 3
Protective effectiveness of response: comparison of the duration of outbreaks between outbreaks that were and were not responded to (CE6).
| Duration of outbreak | Crude estimate of response effectiveness (cCE6)† | Adjusted estimate of response effectiveness (aCE6)‡ | ||||
|---|---|---|---|---|---|---|
| N | Median (IQR; days) | % (95% CI) | p-value | % (95% CI) | p-value | |
| No. of CATIs during outbreak | ||||||
| No CATI* | 214 | 3 (8) | Ref | Ref | Ref | Ref |
| ≥1 CATIs | 238 | 11 (26.75) | −319% (−457 to −216) | <0.0001 | −300% (−441 to −196) | <0.0001 |
-
CATI, case-area targeted intervention; IQR, interquartile range.
*Reference class.
-
†Crude response effectiveness (CCE4) was estimated on the duration of outbreak, using Cox models for repeated events with Anderson-Gills correction (AGCP), as (1–1/hazard ratio).
‡Estimates of CATI effectiveness (aCE4) were adjusted according to covariates for which p-values were less than 0.25 at the initial univariate step (Appendix 2—table 1): number of cases and number of positive cultures during the first 3 days of outbreak, population density, travel time to the nearest town, coverage of OCV campaigns between 2012 and 2014 OCV campaigns, and semesters.
Appendix 3—table 1
Alternative outbreak definitions.
| Cholera outbreak | Definition | Remark | No. of outbreaks |
|---|---|---|---|
| Outbreak A | • suspected cholera cases ≥ 2 • (severely dehydrated case + positive culture)≥1 • onset time window = 3 days • refractory period = 21 days | Scenario 1 Main manuscript Appendix 2 Appendix 3.2 Appendix 3.3 | 452 |
| Outbreak Cu0 | • suspected cholera cases ≥ 2 • irrespective of severely dehydrated cases and positive cultures • onset time window = 3 days • refractory period = 21 days | Scenario 2 | 2043 |
| Outbreak Cu1 | • suspected cholera cases ≥ 2 • positive culture ≥ 1 • irrespective of severely dehydrated cases • onset time window = 3 days • refractory period = 21 days | Scenario 3 | 64 |
| Outbreak Ca1 | • suspected cholera cases ≥ 1 • (severely dehydrated case + positive culture)≥1 • onset time window = 3 days • refractory period = 21 days | Scenario 4 | 1514 |
| Outbreak T1 | • same as Outbreak A except: • onset time window = 1 day | Scenario 5 | 267 |
| Outbreak T2 | • same as Outbreak A except: • onset time window = 2 days | Scenario 6 | 394 |
| Outbreak T4 | • same as Outbreak A except: • onset time window = 4 days | Scenario 7 | 494 |
| Outbreak T5 | • same as Outbreak A except: • onset time window = 5 days | Scenario 8 | 535 |
| Outbreak R7 | • same as Outbreak A except: • refractory period = 7 days | Scenario 9 | 519 |
| Outbreak R14 | • same as Outbreak A except: • refractory period = 14 days | Scenario 10 | 486 |
Appendix 3—table 2
Sensitivity analysis on outbreak and CATI definitions.
| Scenario | 1 | 2 | 3 | 4 | 5 | 6 | 7 | 8 | 9 | 10 |
|---|---|---|---|---|---|---|---|---|---|---|
| Outbreak definition* | Outbreak A | Outbreak Cu0 | Outbreak Cu1 | Outbreak Ca1 | Outbreak T1 | Outbreak T2 | Outbreak T4 | Outbreak T5 | Outbreak R7 | Outbreak R14 |
| Response definition† | CATIc7 | CATIc7 | CATIc7 | CATIc7 | CATIc7 | CATIc7 | CATIc7 | CATIc7 | CATIc7 | CATIc7 |
| No. of outbreaks | 452 | 2043 | 64 | 1514 | 267 | 394 | 494 | 535 | 519 | 486 |
| No. of CATIs | 3596 | 3596 | 3596 | 3596 | 3596 | 3596 | 3596 | 3596 | 3596 | 3596 |
| No. of CATIs during outbreaks (%) | 633 (18%) | 1445 (40%) | 153 (4%) | 1000 (28%) | 386 (11%) | 540 (15%) | 670 (19%) | 717 (20%) | 497 (14%) | 576 (16%) |
| No. of outbreaks that were responded to (%) | 238 (53%) | 730 (36%) | 45 (70%) | 500 (33%) | 152 (57%) | 211 (54%) | 256 (52%) | 276 (52%) | 242 (47%) | 240 (49%) |
| Comparison between outbreaks that were and were not responded to | ||||||||||
| No. of cases during the first 3 days of outbreak, Odds ratio (95% CI) | 1.22 (1.04 to 1.43) | 1.61 (1.43 to 1.8) | 24.69 (1.4 to 435.42) | 1.69 (1.47 to 1.96) | 1.1 (0.85 to 1.43) | 1.15 (0.96 to 1.37) | 1.19 (1.04 to 1.36) | 1.19 (1.05 to 1.34) | 1,25 (1,07 to 1,45) | 1,24 (1,06 to 1,45) |
| No. of positive culture during the first 3 days of outbreak, Odds ratio (95% CI) | 1.64 (1.12 to 2.39) | 2.29 (1.63 to 3.21) | 1.82 (0.64 to 5.21) | 2.16 (1.61 to 2.9) | 1.35 (0.77 to 2.36) | 1.6 (1.06 to 2.41) | 1.85 (1.26 to 2.72) | 1.85 (1.29 to 2.65) | 2,08 (1,42 to 3,06) | 1,91 (1,3 to 2,8) |
| CATI effectiveness according to the response promptness | ||||||||||
| ≤1 day vs >7 days crude estimate of CATI effectiveness on accumulated cases (95% CI) (cCE1) | 83% (71 to 90) | 85% (79 to 89) | 40% (−86 to 81) | 89% (83 to 92) | 73% (48 to 87) | 79% (63 to 88) | 86% (86 to 87) | 84% (70 to 91) | 89% (69 to 96) | 86% (72 to 93) |
| ≤1 day vs >7 days crude estimate of CATI effectiveness on outbreak duration (95% CI) (cCE2) | 59% (36 to 74) | 74% (66 to 80) | 22% (−81 to 66) | 78% (69 to 84) | 48% (18 to 67) | 54% (29 to 70) | 61% (40 to 75) | 58% (34 to 73) | 65% (39 to 80) | 62% (43 to 75) |
| CATI effectiveness according to the response intensity | ||||||||||
| ≥1 vs <0.25 CATIs per week crude estimate of CATI effectiveness on accumulated cases (95% CI) (cCE3) | 74% (44 to 88) | 77% (62 to 85) | 74% (−122 to 97) | 69% (43 to 84) | 28% (−85 to 72) | 69% (33 to 86) | 82% (60 to 92) | 83% (61 to 92) | 87% (86 to 87) | 66% (−10 to 89) |
| ≥1 vs <0.25 CATIs per case crude estimate of CATI effectiveness on outbreak duration (95% CI) (cCE4) | 76% (54 to 88) | 89% (85 to 92) | 55% (−155 to 92) | 91% (86 to 94) | 89% (79 to 95) | 81% (66 to 89) | 76% (55 to 87) | 75% (54 to 86) | 78% (59 to 88) | 81% (68 to 88) |
-
*see Appendix 3—table 1.
†see Appendix 3—table 2.
Appendix 3—table 3
Alternative response definitions.
| Cholera outbreak | Definition | Remark | No. of CATIs | No. of CATIs during outbreaks (%) |
|---|---|---|---|---|
| CATIc7 | • Complete CATI (mobile teams reported at least education, house decontamination by spraying and distribution of chlorine tablets) • Implemented within 7 days after the last recorded case of the outbreak | Scenario 1 Main manuscript Appendix 2 Appendix 3.1 Appendix 3.3 | 3596 | 633 (18%) |
| CATIc0 | • Complete CATI • implemented before the last recorded case of the outbreak | Scenario 11 | 3596 | 501 (14%) |
| CATI7 | • All CATI (irrespective of activities reported by mobile teams • Implemented within 7 days after the last recorded case of the outbreak | Scenario 12 | 3887 | 681 (18%) |
| CATIcEMIRA7 | • Complete CATI • Conducted by NGO mobile teams in tandem with EMIRA staff • Implemented within 7 days after the last recorded case of the outbreak | Scenario 13 | 2539 | 458 (18%) |
| CATIcATB7 | • Complete CATI and reported antibiotic prophylaxis • Implemented within 7 days after the last recorded case of the outbreak | Scenario 14 Main manuscript | 1922 | 350 (18%) |
-
EMIRA, cholera rapid response team of the Ministry of health.
Appendix 3—table 4
Sensitivity analysis on outbreak and CATI definitions.
| Scenario | 1 | 11 | 12 | 13 | 14 |
|---|---|---|---|---|---|
| Outbreak definition* | Outbreak A | Outbreak A | Outbreak A | Outbreak A | Outbreak A |
| Response definition† | CATIc7 | CATIc0 | CATI7 | CATIcEMIRA7 | CATIcATB7 |
| No. of outbreaks | 452 | 452 | 452 | 452 | 452 |
| No. of CATIs | 3596 | 3596 | 3887 | 2539 | 1922 |
| No. of CATIs during outbreaks (%) | 633 (18%) | 501 (14%) | 681 (18%) | 458 (18%) | 350 (18%) |
| No. of outbreaks that were responded to (%) | 238 (53%) | 172 (38%) | 244 (54%) | 201 (44%) | 160 (35%) |
| Comparison between outbreaks that were and were not responded to | |||||
| No. of cases during the first 3 days of outbreak, Odds ratio (95% CI) | 1.22 (1.04 to 1.43) | 1.49 (1.24 to 1.80) | 1.22 (1.04 to 1.43) | 1.21 (1.04 to 1.40) | 1.09 (0.97 to 1.24) |
| No. of positive culture during the first 3 days of outbreak, Odds ratio (95% CI) | 1.64 (1.12 to 2.39) | 1.63 (1.14 to 2.32) | 1.62 (1.11 to 2.37) | 2.12 (1.44 to 3.11) | 1.92 (1.35 to 2.73) |
| CATI effectiveness according to the response promptness | |||||
| ≤1 day vs >7 days crude estimate of CATI effectiveness on accumulated cases (95% CI) (cCE1) | 83% (71 to 90) | 85% (76 to 91) | 83% (71 to 90) | 89% (81 to 94) | 90% (81 to 94) |
| ≤1 day vs >7 days crude estimate of CATI effectiveness on outbreak duration (95% CI) (cCE2) | 59% (36 to 74) | 65% (44 to 78) | 57% (33 to 72) | 76% (61 to 85) | 84% (74 to 90) |
| CATI effectiveness according to the response intensity | |||||
| ≥1 vs <0.25 CATIs per week crude estimate of CATI effectiveness on accumulated cases (95% CI) (cCE3) | 74% (44 to 88) | 81% (64 to 90) | 70% (35 to 86) | 77% (49 to 90) | 85% (64 to 94) |
| ≥1 vs <0.25 CATIs per case crude estimate of CATI effectiveness on outbreak duration (95% CI) (cCE4) | 76% (54 to 88) | 54% (−14 to 82) | 75% (53 to 86) | 86% (72 to 93) | 86% (71 to 93) |
-
*see Appendix 3—table 1.
†see Appendix 3—table 3.
Appendix 3—table 5
Alternative adjustment methods for CATI effectiveness estimates.
| Crude estimates | Estimates adjusted for covariates selected by p-values† | Estimates adjusted for all covariates | Estimates adjusted for covariates selected by AIC* | |||||
|---|---|---|---|---|---|---|---|---|
| No. of covariates (AIC*) | cCE* | No. of covariates (AIC*) | aCE* | No. of covariates (AIC*) | aCE* | No. of covariates (AIC*) | aCE* | |
| CATI effectiveness according to the response promptness | ||||||||
| ≤1 day vs >7 days estimate of CATI effectiveness on accumulated cases (95% CI) (CE1) | 0 (1102.35) | 83% (71 to 90) | 5 (1 096.91) | 76% (59 to 86) | 8 (1073.75) | 77% (62 to 87) | 6 (1072.51) | 79% (65 to 88) |
| ≤1 day vs >7 days crude estimate of CATI effectiveness on outbreak duration (95% CI) (CE2) | 0 (956.25) | 59% (36 to 74) | 5 (933.42) | 61% (41 to 75) | 8 (929.93) | 65% (46 to 77) | 5 (924.20) | 65% (46 to 77) |
| CATI effectiveness according to the response intensity | ||||||||
| ≥1 vs <0.25 CATIs per week estimate of CATI effectiveness on accumulated cases (95% CI) (CE3) | 0 (1123.91) | 74% (44 to 88) | 2 (1112.44) | 58% (8 to 81) | 8 (1093.38) | 62% (18 to 82) | 7 (1092.17) | 62% (22 to 81) |
| ≥1 vs <0.25 CATIs per case estimate of CATI effectiveness on outbreak duration (95% CI) (CE4) | 0 (945.29) | 76% (54 to 88) | 3 (949.59) | 73% (49 to 86) | 8 (931.29) | 76% (56 to 87) | 3 (925.52) | 54% (27 to 71) |
Additional files
-
Source code 1
R code for statistical comparisons between outbreak groups and estimation of response effectiveness.
- https://cdn.elifesciences.org/articles/50243/elife-50243-code1-v2.r
-
Transparent reporting form
- https://cdn.elifesciences.org/articles/50243/elife-50243-transrepform-v2.docx
Download links
A two-part list of links to download the article, or parts of the article, in various formats.
Downloads (link to download the article as PDF)
Open citations (links to open the citations from this article in various online reference manager services)
Cite this article (links to download the citations from this article in formats compatible with various reference manager tools)
Estimating effectiveness of case-area targeted response interventions against cholera in Haiti
eLife 8:e50243.
https://doi.org/10.7554/eLife.50243


