Micronuclei-based model system reveals functional consequences of chromothripsis in human cells
- TU Kaiserslautern, Germany
- University Medical Center, Netherlands
- Max Planck Institute of Biochemistry, Germany
- Cold Spring Harbor Laboratory, United States
Figures
Figure 1 with 3 supplements
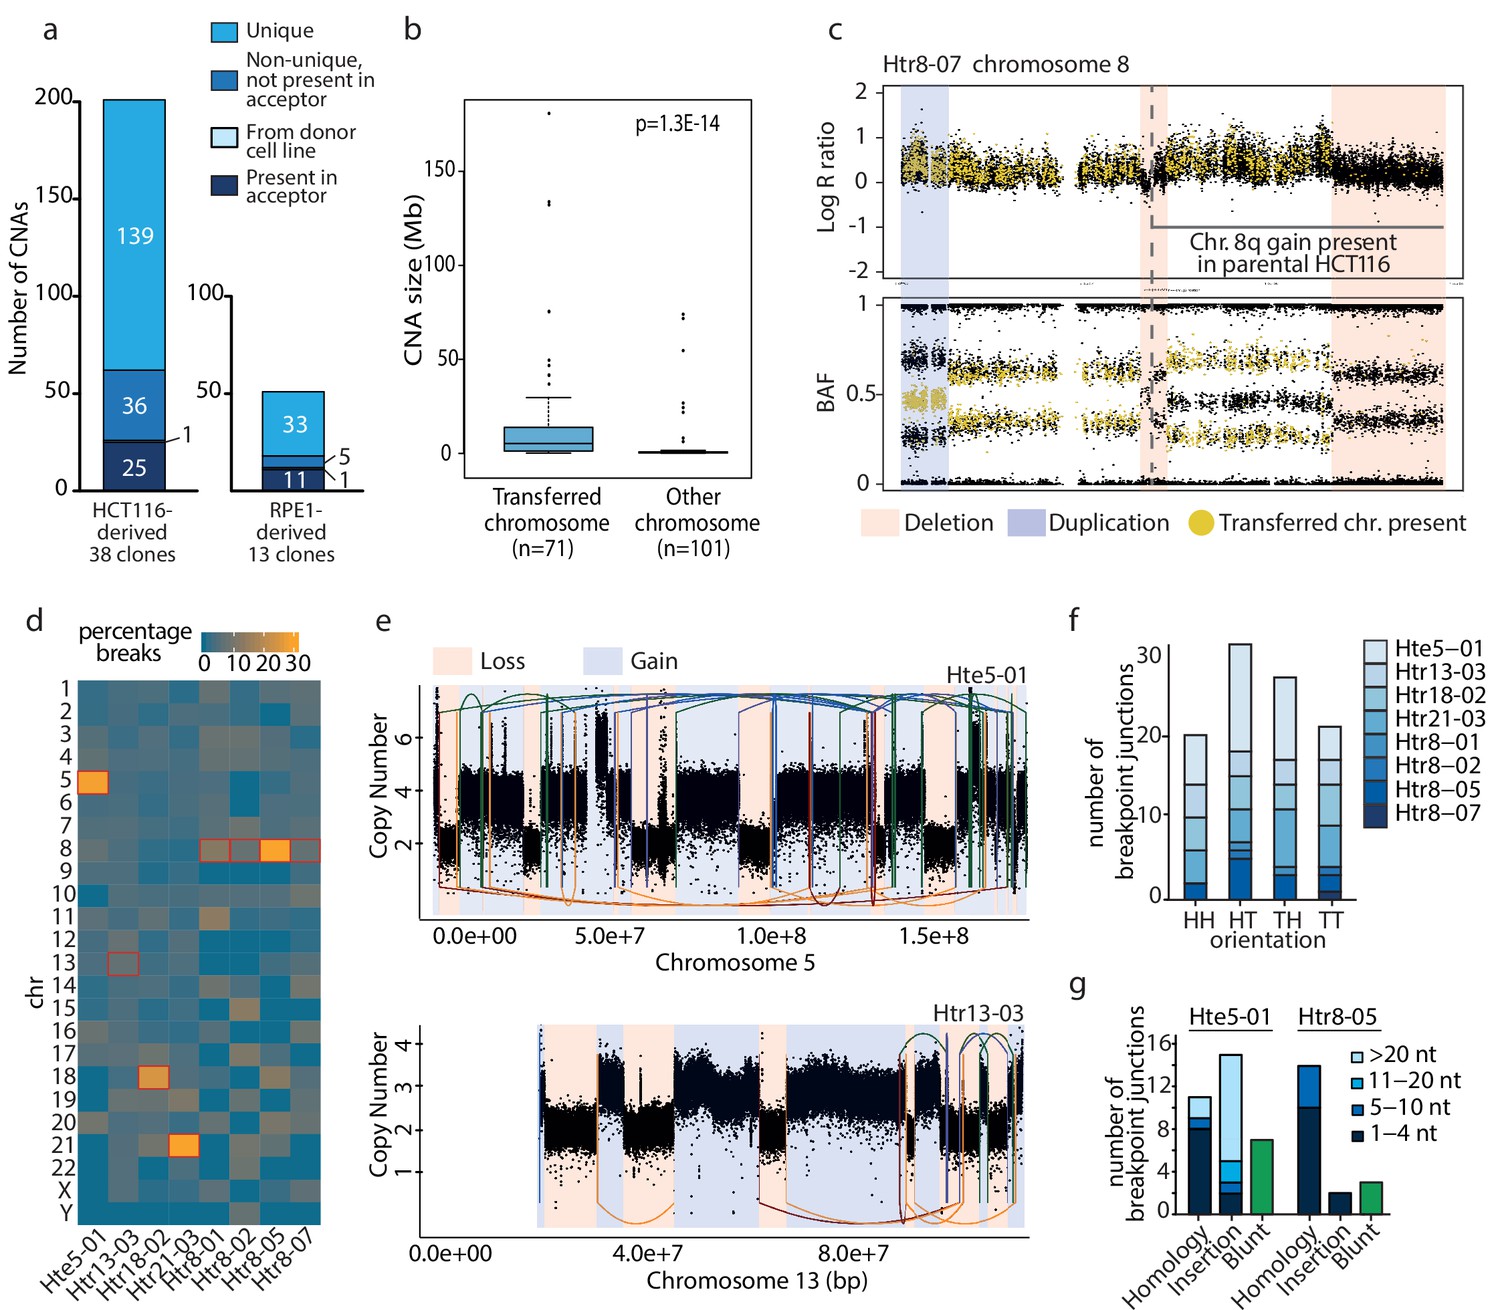
Unique de novo CNAs specifically affect the transferred chromosome and resemble chromothripsis.
(a) Detection of CNAs in HCT116- and RPE1-derived cell lines with extra chromosome. A total of 201 (HCT116) and 50 (RPE1) CNAs were found. (b) Boxplot showing CNA sizes on the transferred versus the other chromosomes for all cell lines (t-test). (c) Deletions (red bars) and duplications (blue bar) on the aneuploid chromosome specifically affect the transferred chromosome. Top and bottom panel: The absence of yellow dots in the deleted regions of the aneuploidy chromosome indicates deletions affecting the transferred chromosome. Bottom panel: the specific change in BAF allows determination of the affected allele for duplications. Here, the shift in BAF from ~0.3 or~0.7 to~0.5 indicates a duplication of the transferred chromosome. (d) Heatmap presenting the percentage of breakpoints per chromosome in cell lines analyzed by whole genome sequencing. (e) Complex chromosomal rearrangements detected in Hte5-01 (top) and Htr13-03 (bottom). Linear plots show the breakpoint junctions (solid lines) and CNAs detected by WGS. Lines are colored according to the orientation of the breakpoint junction, from low to high chromosomal coordinate: tail-head (blue), head-tail (green), head-head (orange), tail-tail (red). (f) Breakpoint junction orientation of the de novo structural rearrangements on the aneuploid chromosome. (g) Breakpoint characteristics of the breakpoint junctions that were validated to a nucleotide resolution on the aneuploid chromosome in the Hte5-01 and Htr8-05. Colors indicate the amount of nucleotides (nt) for (micro)homology or insertions found at breakpoint junctions.
Figure 1—figure supplement 1
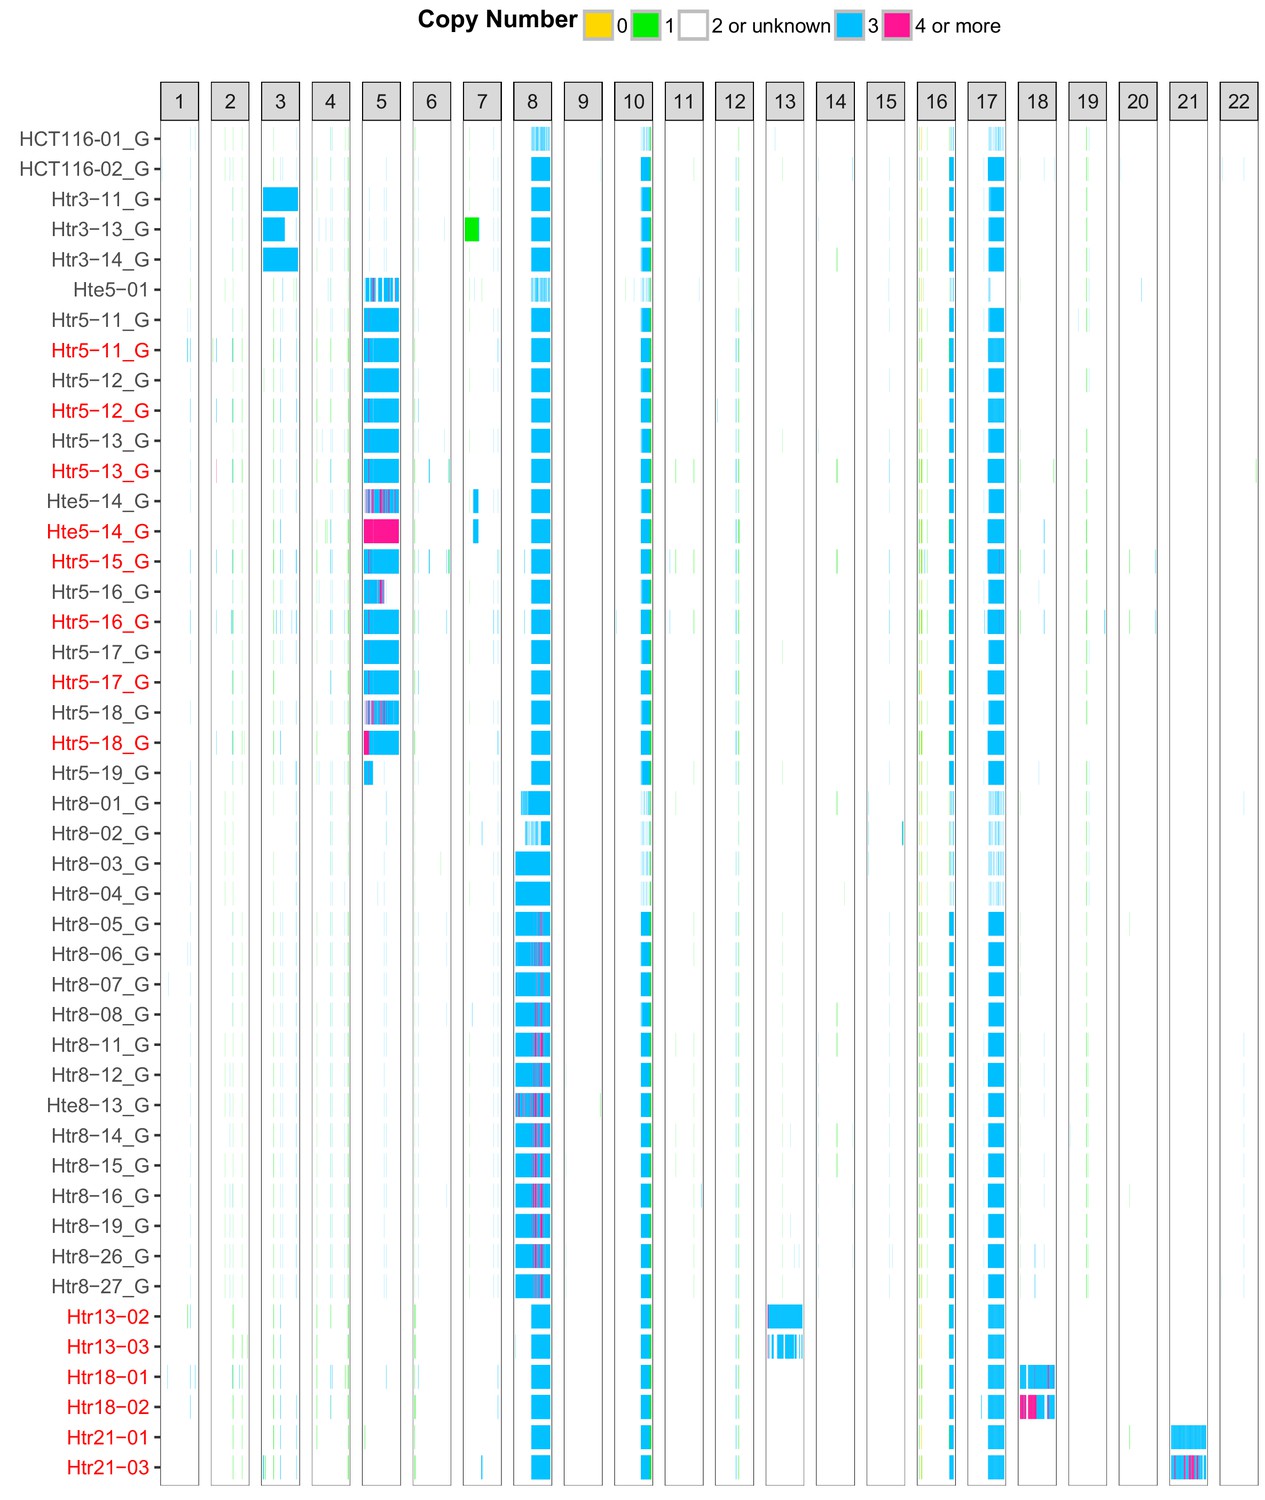
SNP and SMASH array analysis shows stable addition of the extra chromosome to HCT116 acceptor cells.
Each column represents one chromosome, each row one dataset from SNP array (black) or SMASH (red) analyses. The chromosome copy number is colour-coded. Only autosomes are visualized.
Figure 1—figure supplement 2
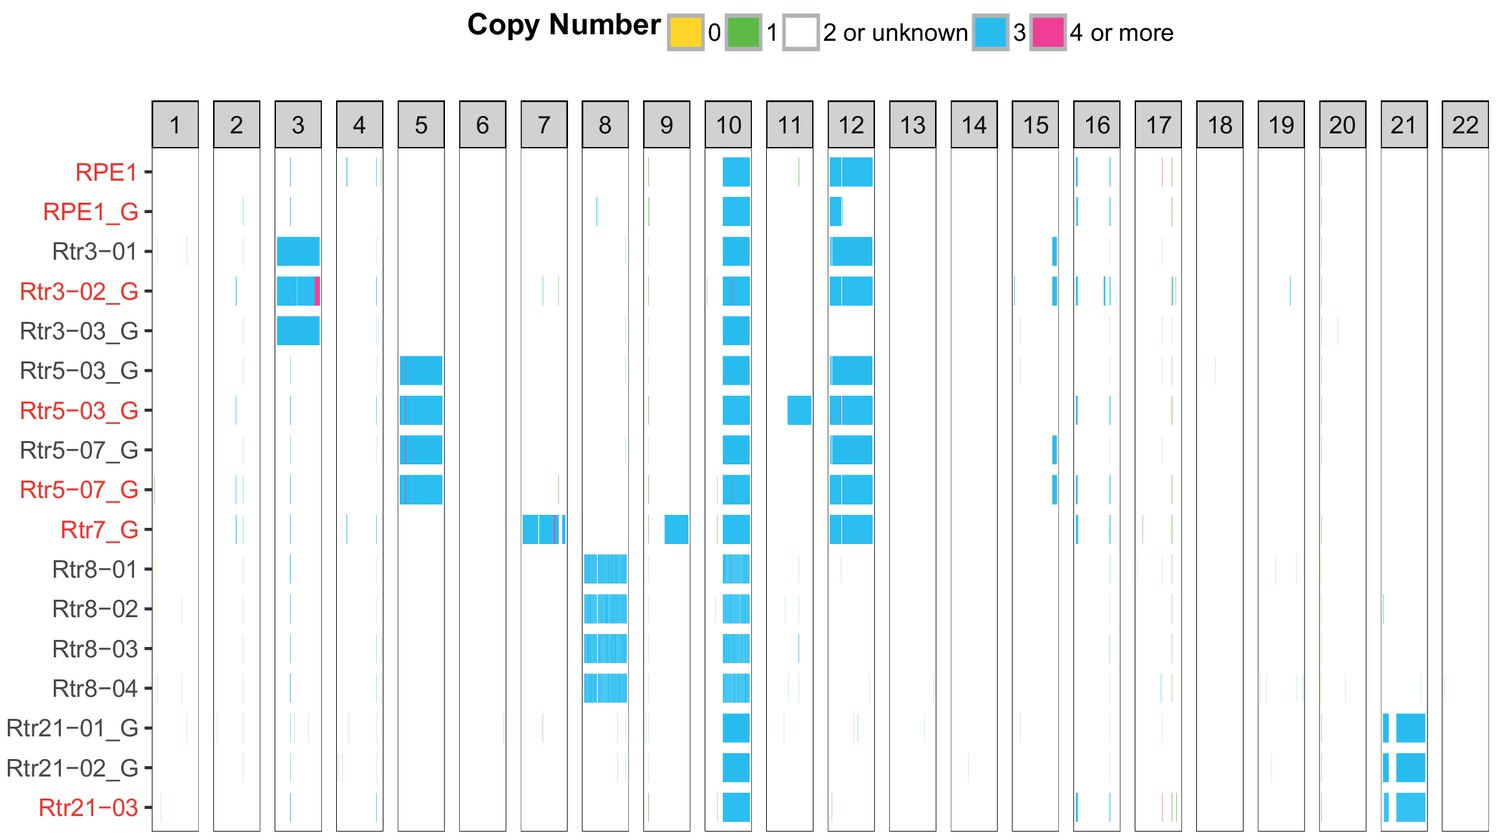
SNP and SMASH array analysis shows stable addition of the extra chromosome to RPE1 acceptor cells.
Each column represents one chromosome, each row one dataset from SNP array (black) or SMASH (red) analyses. The chromosome copy number is colour-coded. Only autosomes are visualized. Please note that chromosome 12 is frequently spontaneously gained in RPE1 cell line.
Figure 1—figure supplement 3
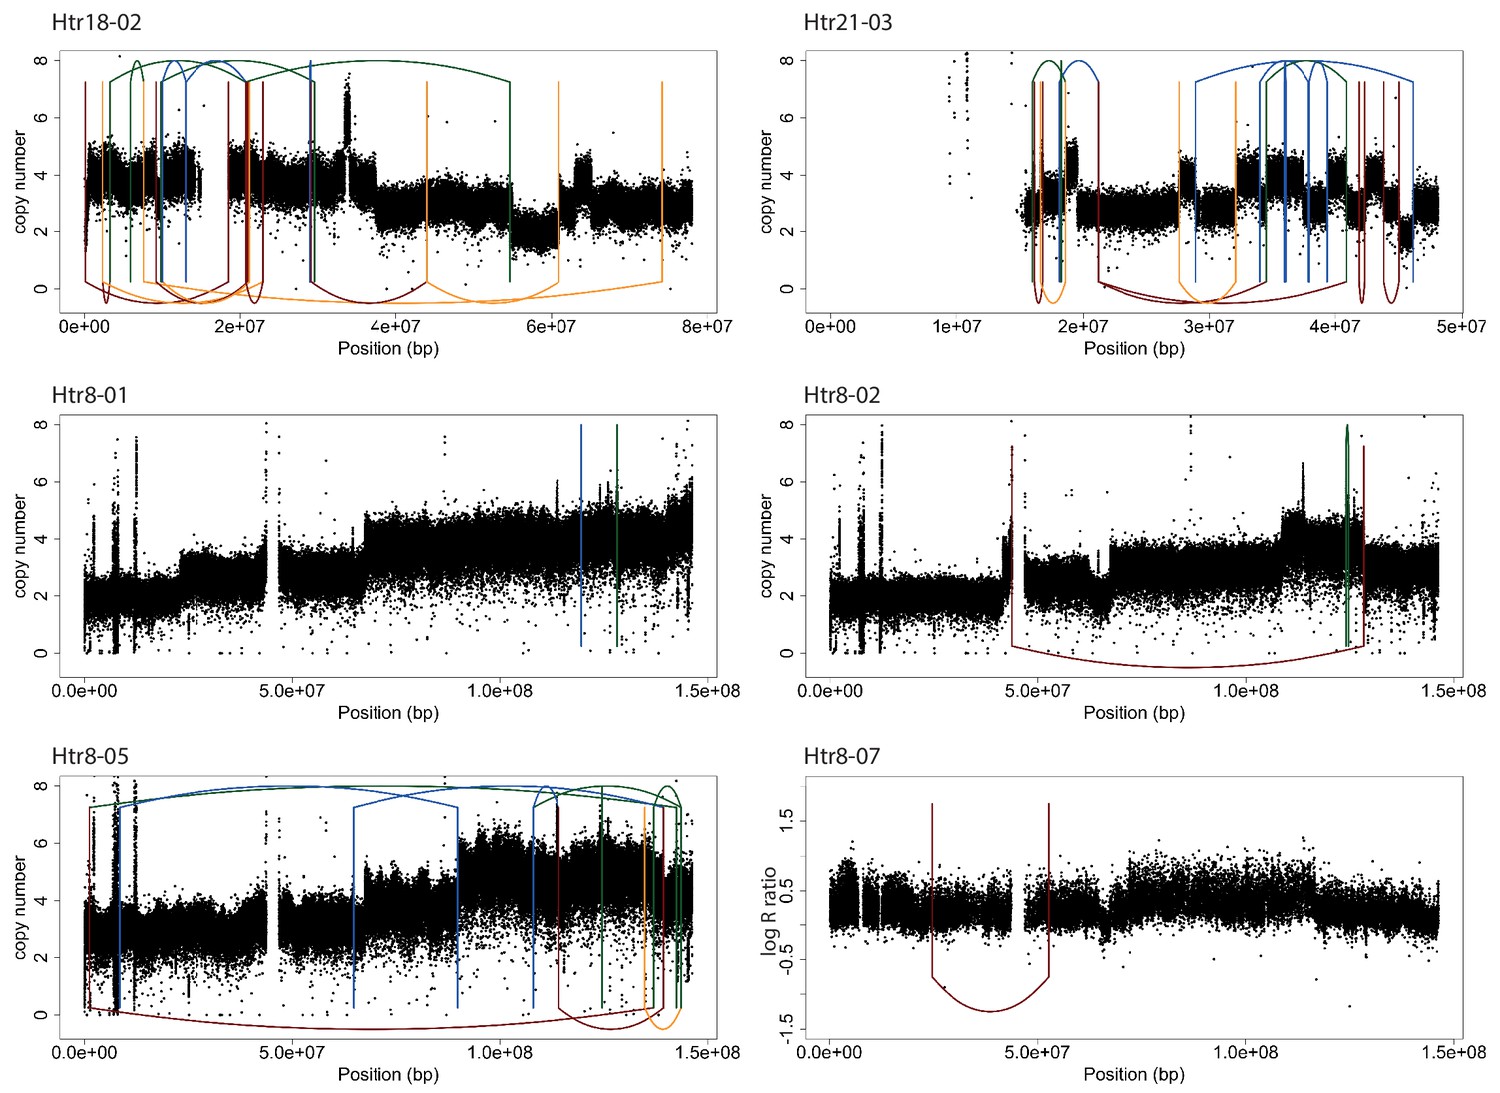
Copy number and structural rearrangement breakpoint junctions for cell lines analyzed by whole genome sequencing.
Plots show the breakpoint junctions (solid lines) and CNAs (black dots) detected by WGS. Lines are colored according to the orientation of the breakpoint junction, from low to high chromosomal coordinate: tail-head (blue), head-tail (green), head-head (orange), tail-tail (red).
Figure 2 with 1 supplement
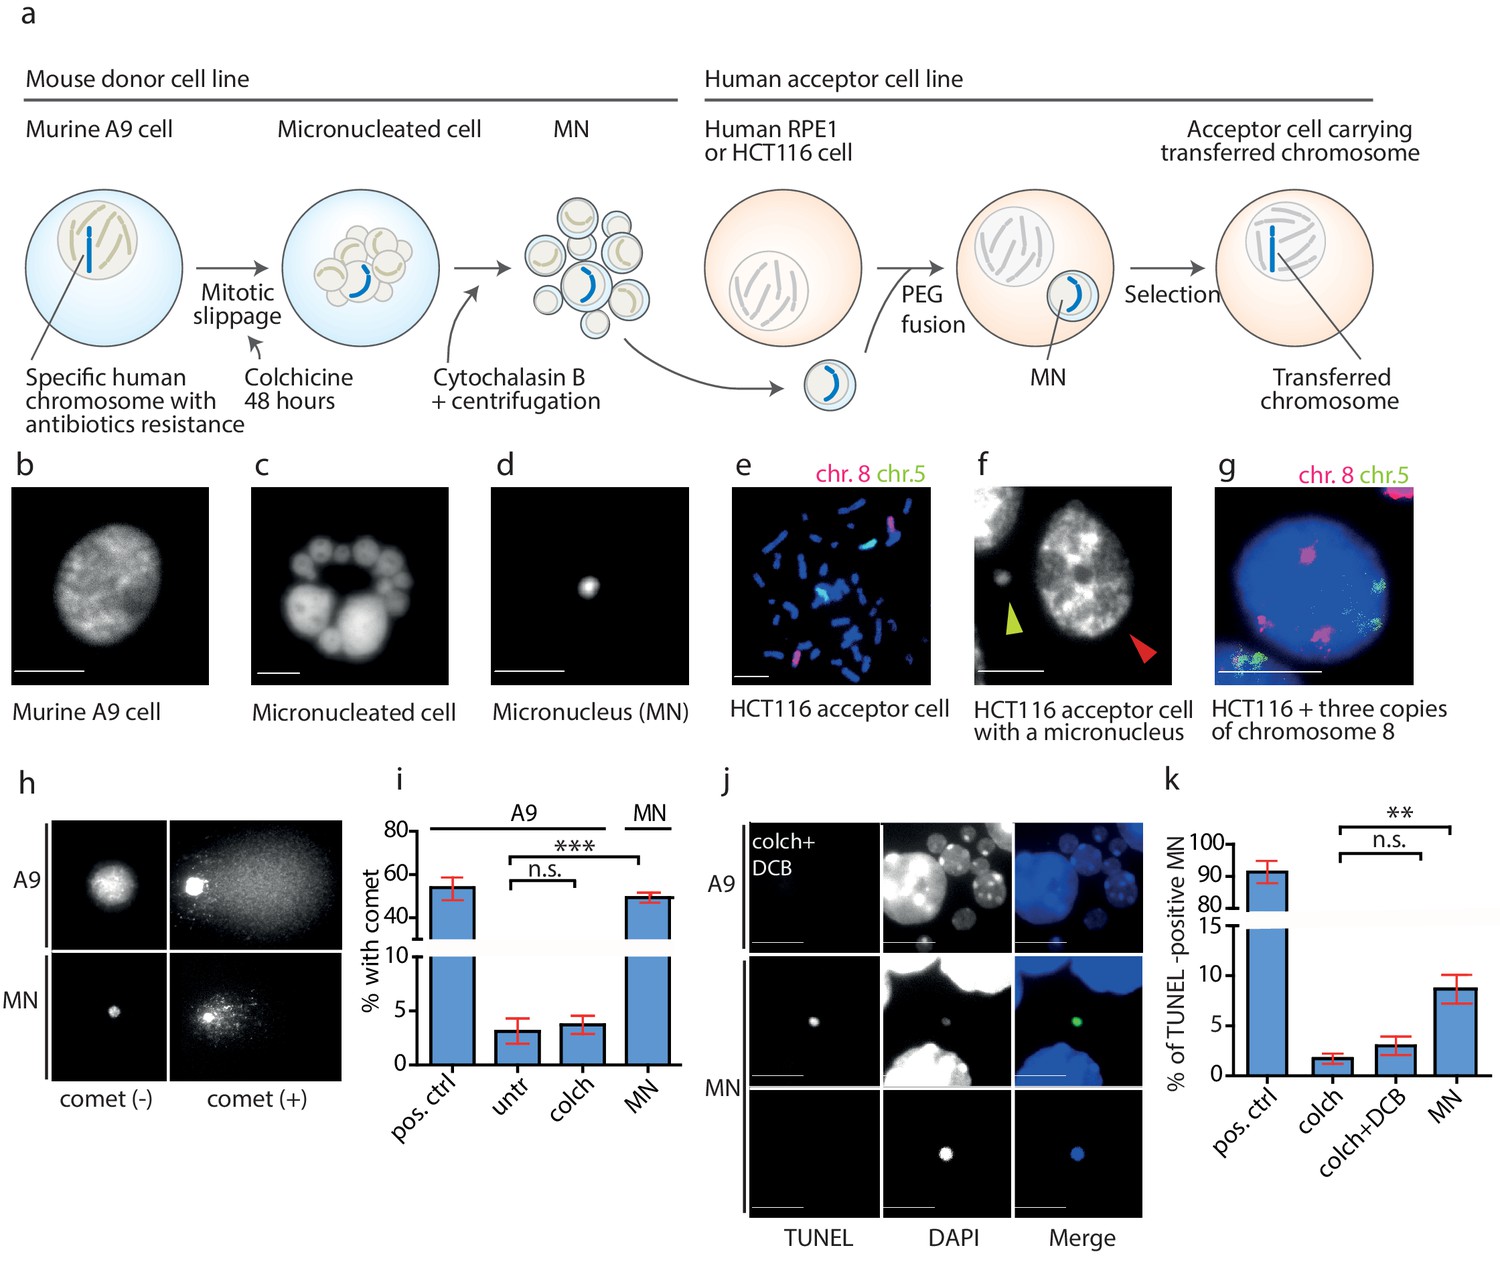
DNA damage in isolated micronuclei after mitotic slippage.
(a) Schematic depiction of MMCT. (b) Murine A9 cell before micronucleation. (c) Formation of micronuclei in the A9 donor cell upon colchicine treatment. (d) Microcells with micronucleus isolated via centrifugation. (e) Chromosome painting with probes for chromosome 5 (green) and chromosome 8 (red) in HCT116 before fusion. (f) Micronucleus (yellow arrowhead) next to the primary nucleus in the acceptor cell (HCT116, red arrowhead). (g) Chromosome painting of interphase nuclei in trisomic HCT116. (h) Examples of nucleus of an A9 cell and isolated MN without (-) and with (+) DNA apparent comet. DNA was stained with DAPI. (i) Quantification of cells with a comet in untreated cells (untr), cells treated with colchicine for 48 hr (colch) and in isolated MN. Doxorubicin treated A9 cells were used as a positive control (pos. ctrl). All plots show mean ± s.e.m. of three independent experiments; at least 100 nuclei or MN were scored in each experiment. T-test; p<0.0005. (j) Examples of TUNEL assay in A9 cells treated with colchicine for 48 hr followed by 30 min cytochalasin B (colch+DCB) and in isolated MN. DNA was stained with DAPI. (k) Quantification of TUNEL positive MN under conditions as in (c). All plots show mean ± s.e.m. of at least three independent experiments. N: pos. ctrl = 213, colch = 660, colch+DCB = 137, MN = 2003. T-test; p<0.005. Scale bar: 10 μm.
-
Figure 2—source data 1
Source data for Figure 2.
- https://cdn.elifesciences.org/articles/50292/elife-50292-fig2-data1-v2.xlsx
Figure 2—figure supplement 1
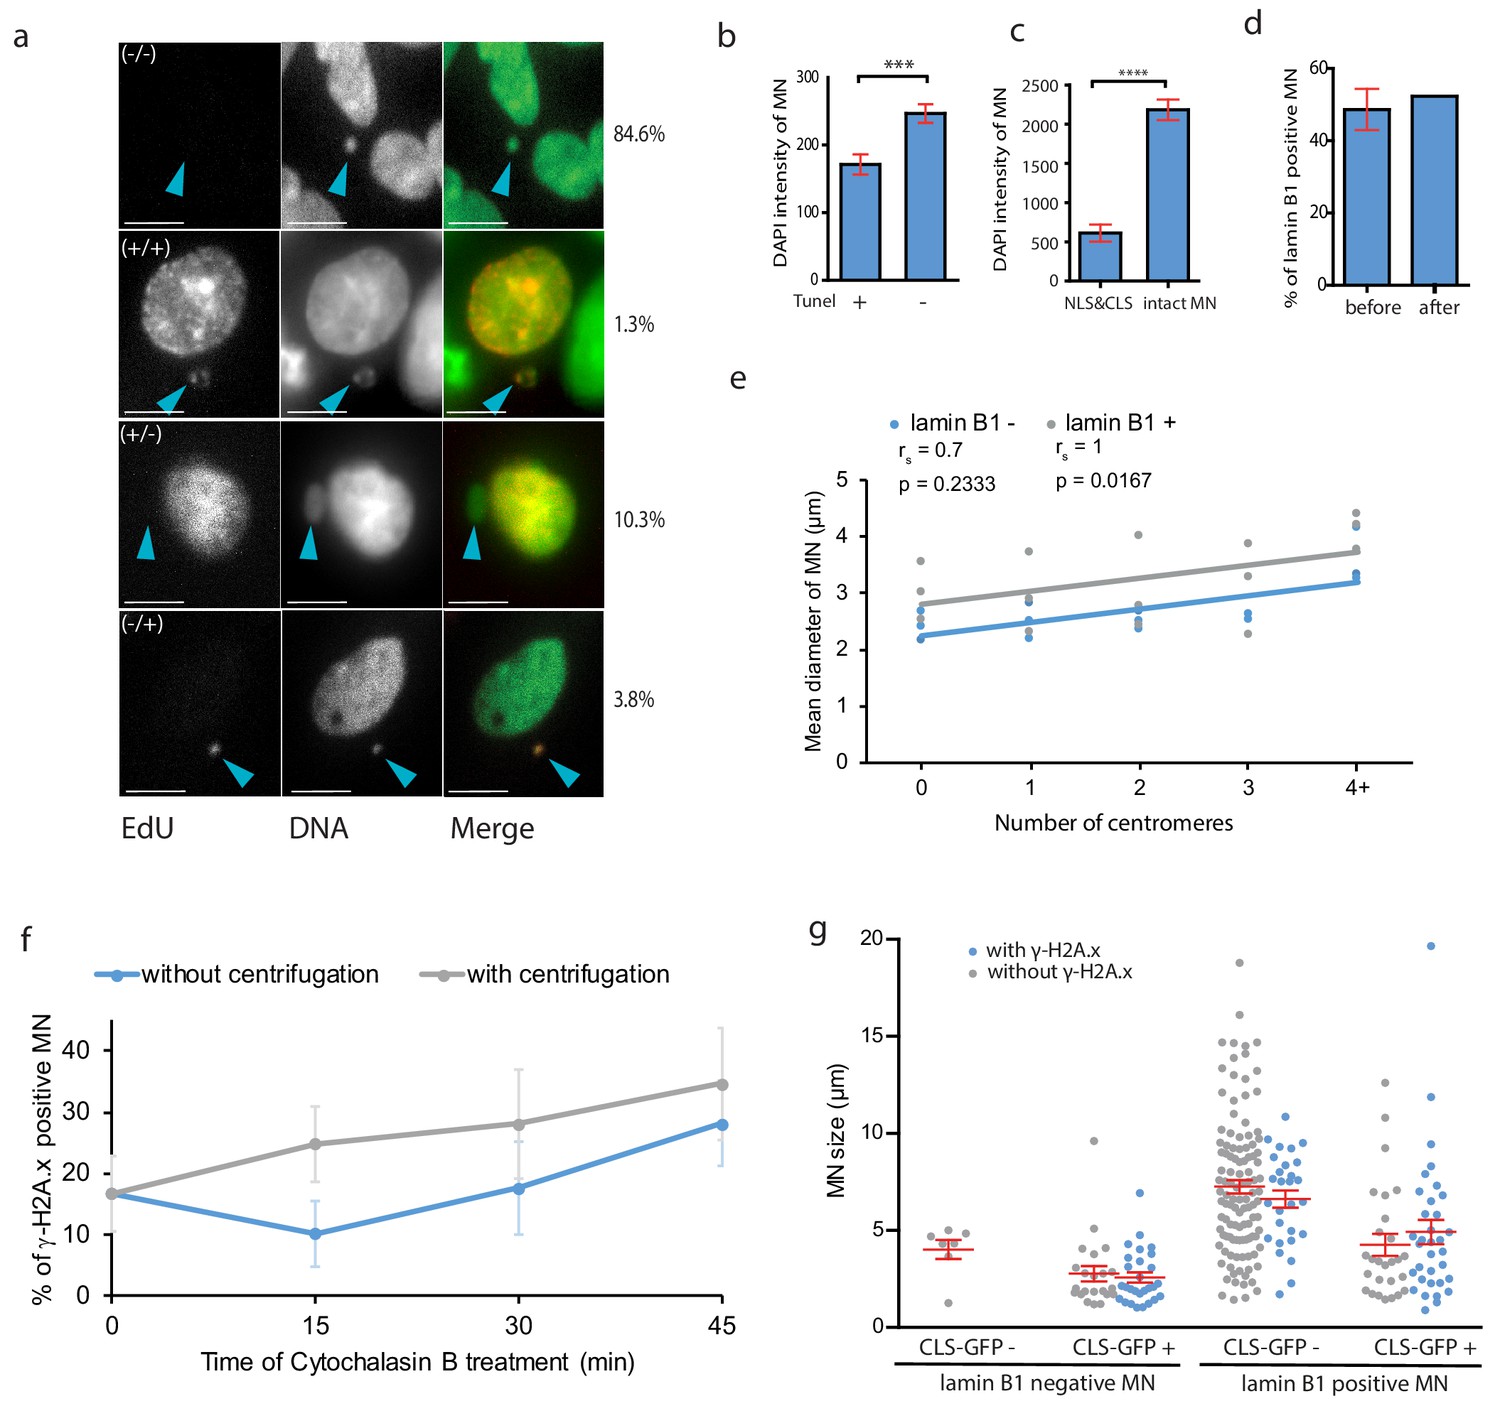
Characteristics of micronuclei.
(a) Cells after fusion with isolated MNs were immunolabelled with anti-EdU (red) to detect DNA replication. They were categorized in four groups: non-replicating DNA in primary nuclei (PN) and MN (-/-); replicating DNA in both the PN and MN (+/+); replicating DNA in PN and non-replicating DNA in MN (+/-); non-replicating DNA in PN and replicating DNA in MN (-/+). Representative images of each category were chosen. MNs are marked with arrowheads. DNA was stained with DAPI and Sytox green. RPE1 cells 20 hr after fusion were quantified. Total n: 78. Scale bar: 10 μm. (b) Mean DAPI intensities in TUNEL positive (+) and negative (-) MN. Three independent experiments were performed. N = 280. T-test; p=0.0001. (c) Mean DAPI intensities in MN with NLS and CLS signals and in intact MN. Three experiments, N = 62, T-test; ****p<0.0001. (d) Distribution of lamin B1 positive MN before and after micronuclei isolation. Plots show mean ± s.e.m. of two (before isolation) and one (after isolation) independent experiments. Total N: before = 168; after = 122 MNs. (e) The mean diameter of MN after colchizine treatment quanti_ed in lamin B positive (+) and negative (-) MN visualized with either no (0), 1, 2, 3 or 4 or more (4+) centromeres, three independent experiments. N > 170 MN. (f) _-H2A.x positive MN during a time course of cytochalasin B treatment, without (blue) and with centrifugation (grey). (g) Lamin B1 positive and negative MN were visualized with their diameter (μm) and grouped depending on cytosolic incorporation and DNA damage presence (γ-H2A.x positive in blue and γ-H2A.x negative in grey). Total N: 295 MN. Plots show mean ± s.e.m. of three independent experiments.
Figure 3
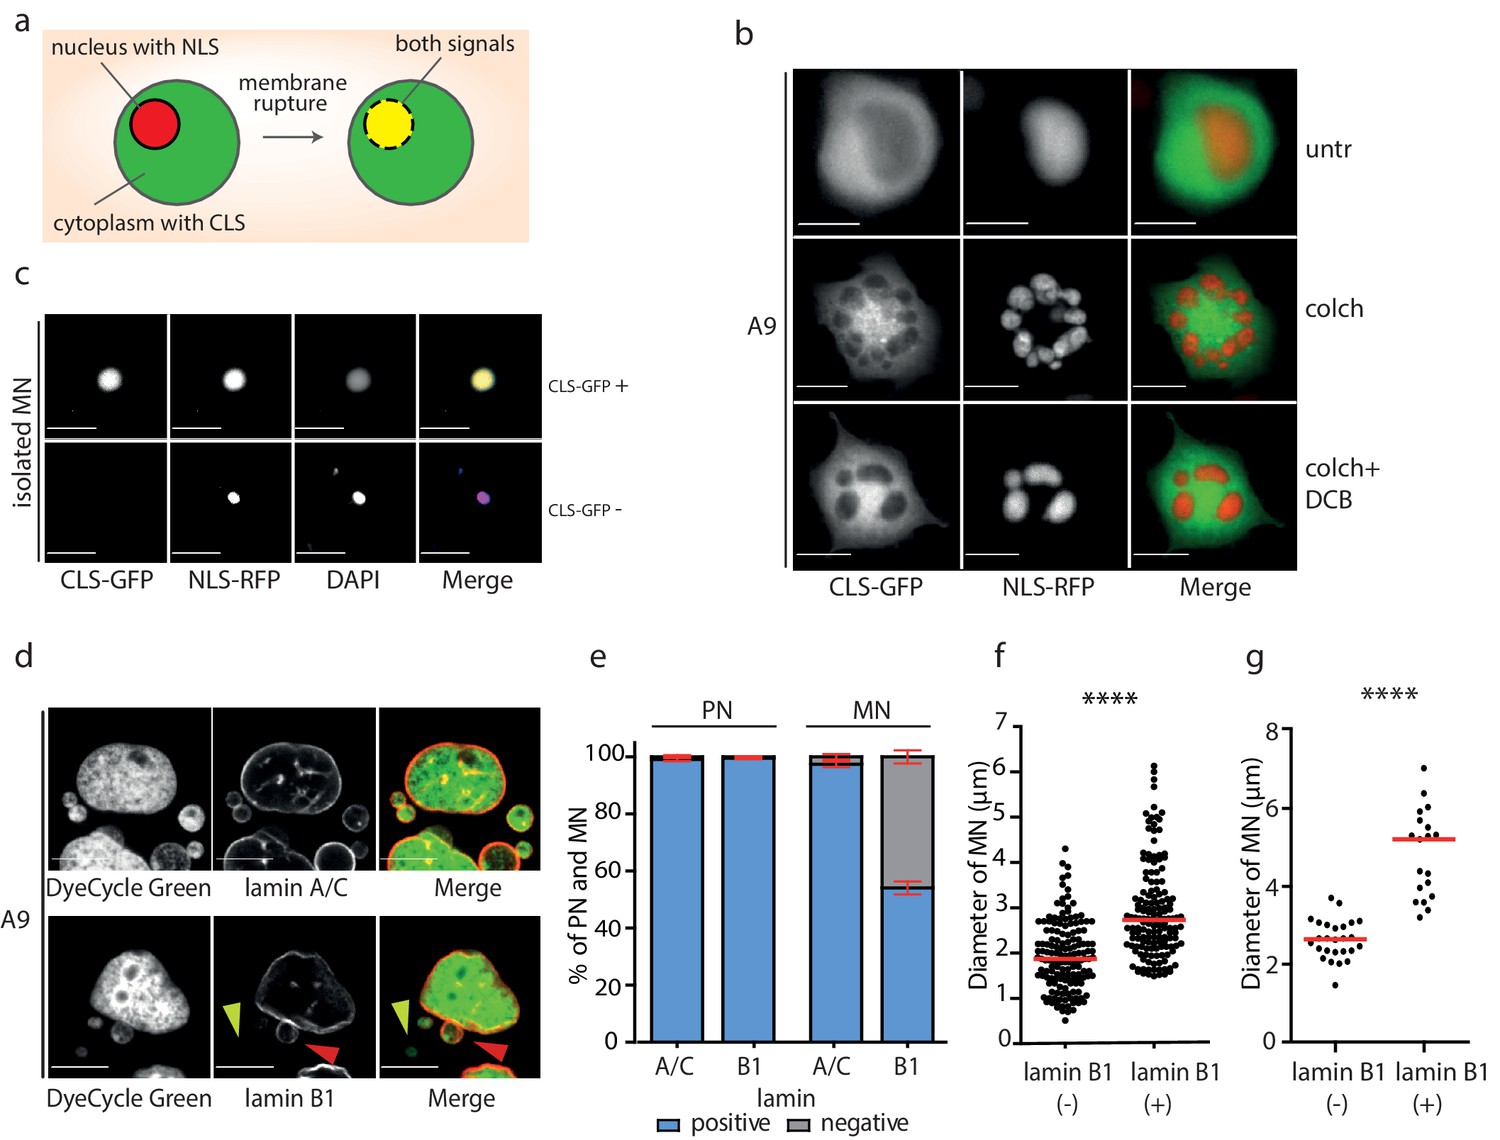
Micronuclei frequently lack lamin B1 in the nuclear envelope.
(a) Schematic depiction of marker proteins with nuclear localization (red) and cytoplasmic localization (green) after nuclear envelope rupture. (b) Localization of NLS-RFP and CLS-GFP in untreated cells (untr), cells treated with 48 hr of colchicine (colch) and 48 hr of colchicine followed by 30 min of cytochalasin B (colch+DCB) and (c) in isolated MN. (d) Immunofluorescence staining of A9 nuclei and MN with lamin A/C and lamin B1 antibody. The lamin B1 negative MN is highlighted by the yellow arrowhead and the lamin B1 positive MN is indicated by red arrowhead. DNA was stained with DyeCycle Green. (e) Quantification of primary nuclei (PN) and MN positive and negative for lamin A/C and lamin B1. All plots show mean ± s.e.m. of three independent experiments; at least 400 nuclei were scored in each experiment. (f) The diameters of lamin B1 negative (-) and positive (+) MN are visualized. Each dot represents the diameter of one MN. The medians are highlighted in red. Three independent experiments, N = 304. Mann Whitney test, p=0.00012. (g) The diameters of lamin B1 negative (-) and positive (+) MN spontaneously arising in RPE1 cells are plotted. Each dot represents the diameter of one MN. The medians are in red. N = 45. Mann Whitney test, ****p<0.0001. Scale bar: 10 μm in all images.
-
Figure 3—source data 1
Source data for Figure 3.
- https://cdn.elifesciences.org/articles/50292/elife-50292-fig3-data1-v2.xlsx
Figure 4
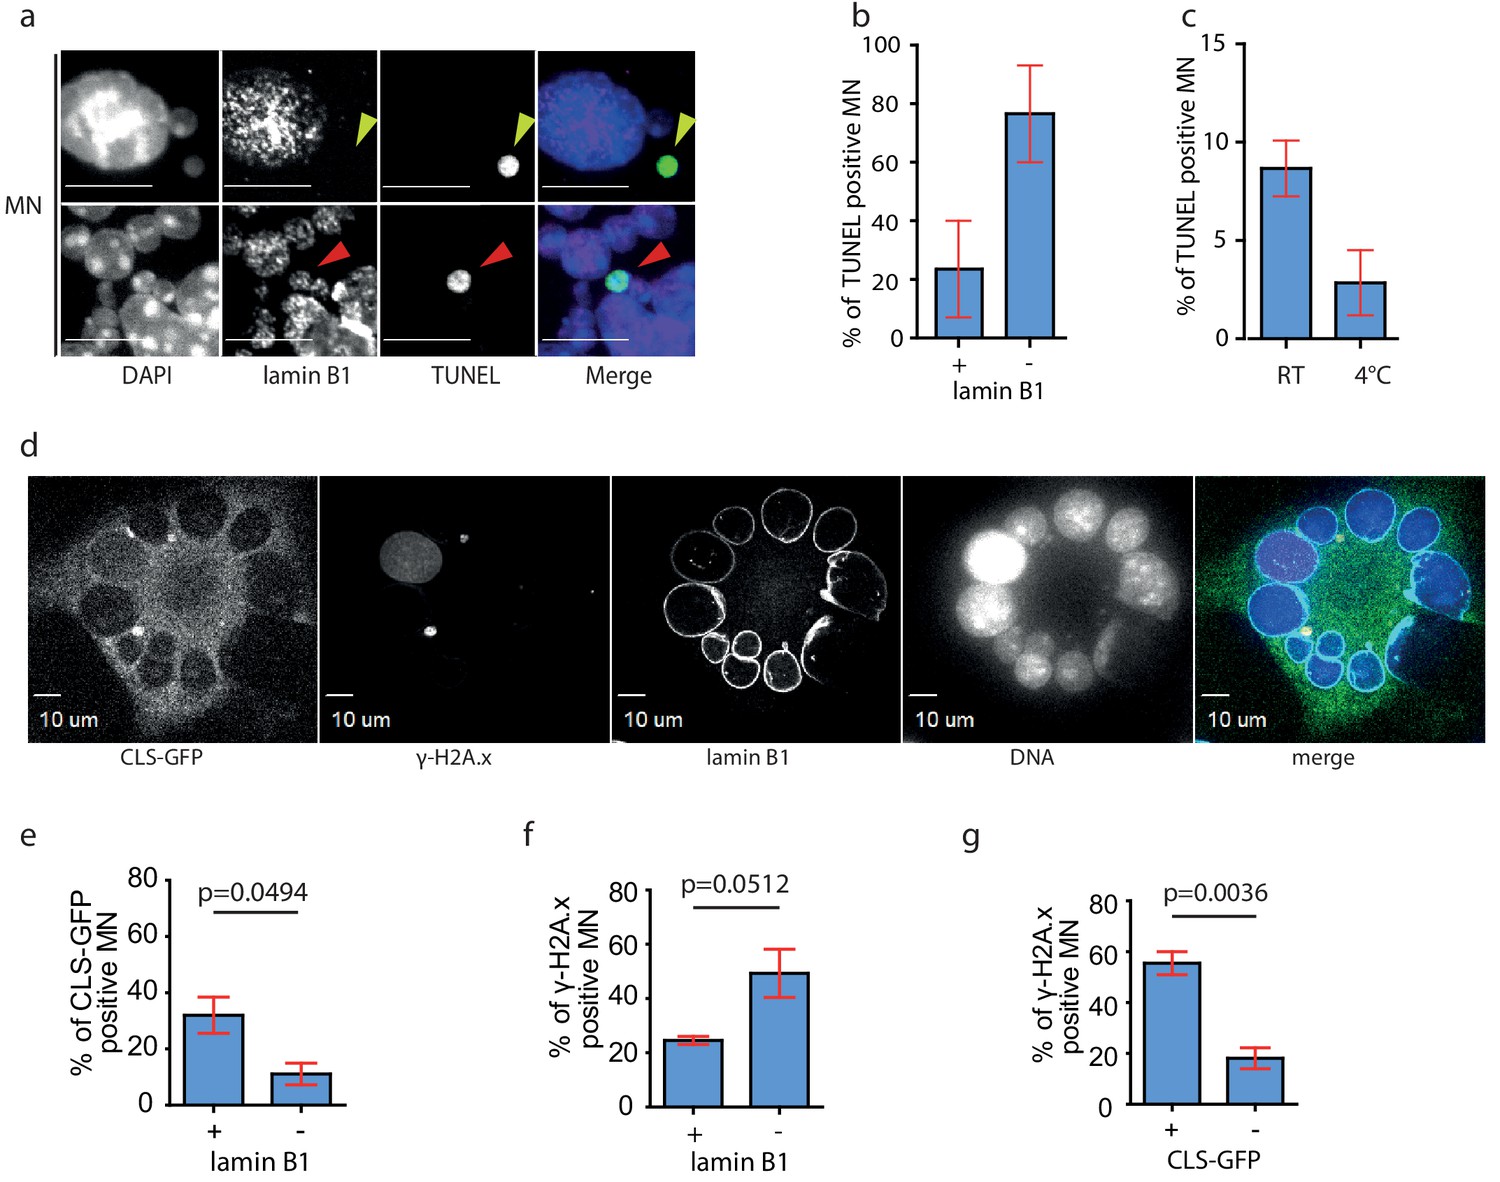
DNA damage occurs predominantly in lamin B1 negative MN.
(a) Immunofluorescence staining of isolated MN with lamin B1 antibody combined with TUNEL assay. The lamin B1 negative MN is highlighted by yellow arrowhead, the lamin B1 positive MN is indicated by red arrowhead. DNA was stained with DAPI. Scale bar: 10 μm. (b) Percentage of TUNEL in lamin B1 positive (+) and lamin B1 negative (-) MN. Plots show mean ± s.e.m. of two independent experiments. N = 58. (c) Distribution of TUNEL positive MNs after their isolation at RT and at 4°C. Plots show mean ± s.e.m. of three experiments in RT and two at 4°C. Total N: RT = 1292; 4°C = 1918. (d) Representative image of micronucleated A9 cell after transfection with CLS-GFP plasmid followed by colchicine treatment and immunouorescence staining of --H2A.x and lamin B1. DNA was stained with DAPI. Scale Bar: 10 μm. (e) Percentage of CLS-GFP positive MN in lamin B1 positive (+) or negative (-) MN. (f) Percentage of --H2A.x positive MN in lamin B1 positive (+) and negative (-) MN. (g) Percentage of --H2A.x positive MN in CLS-GFP positive (+) and negative (-) MN. (e)-(g): Unpaired t-test was performed, p-values are shown (p). Total N: 295 MN. Plots show mean ± s.e.m. of three independent experiments.
-
Figure 4—source data 1
Source data for Figure 4.
- https://cdn.elifesciences.org/articles/50292/elife-50292-fig4-data1-v2.xlsx
Figure 5 with 2 supplements
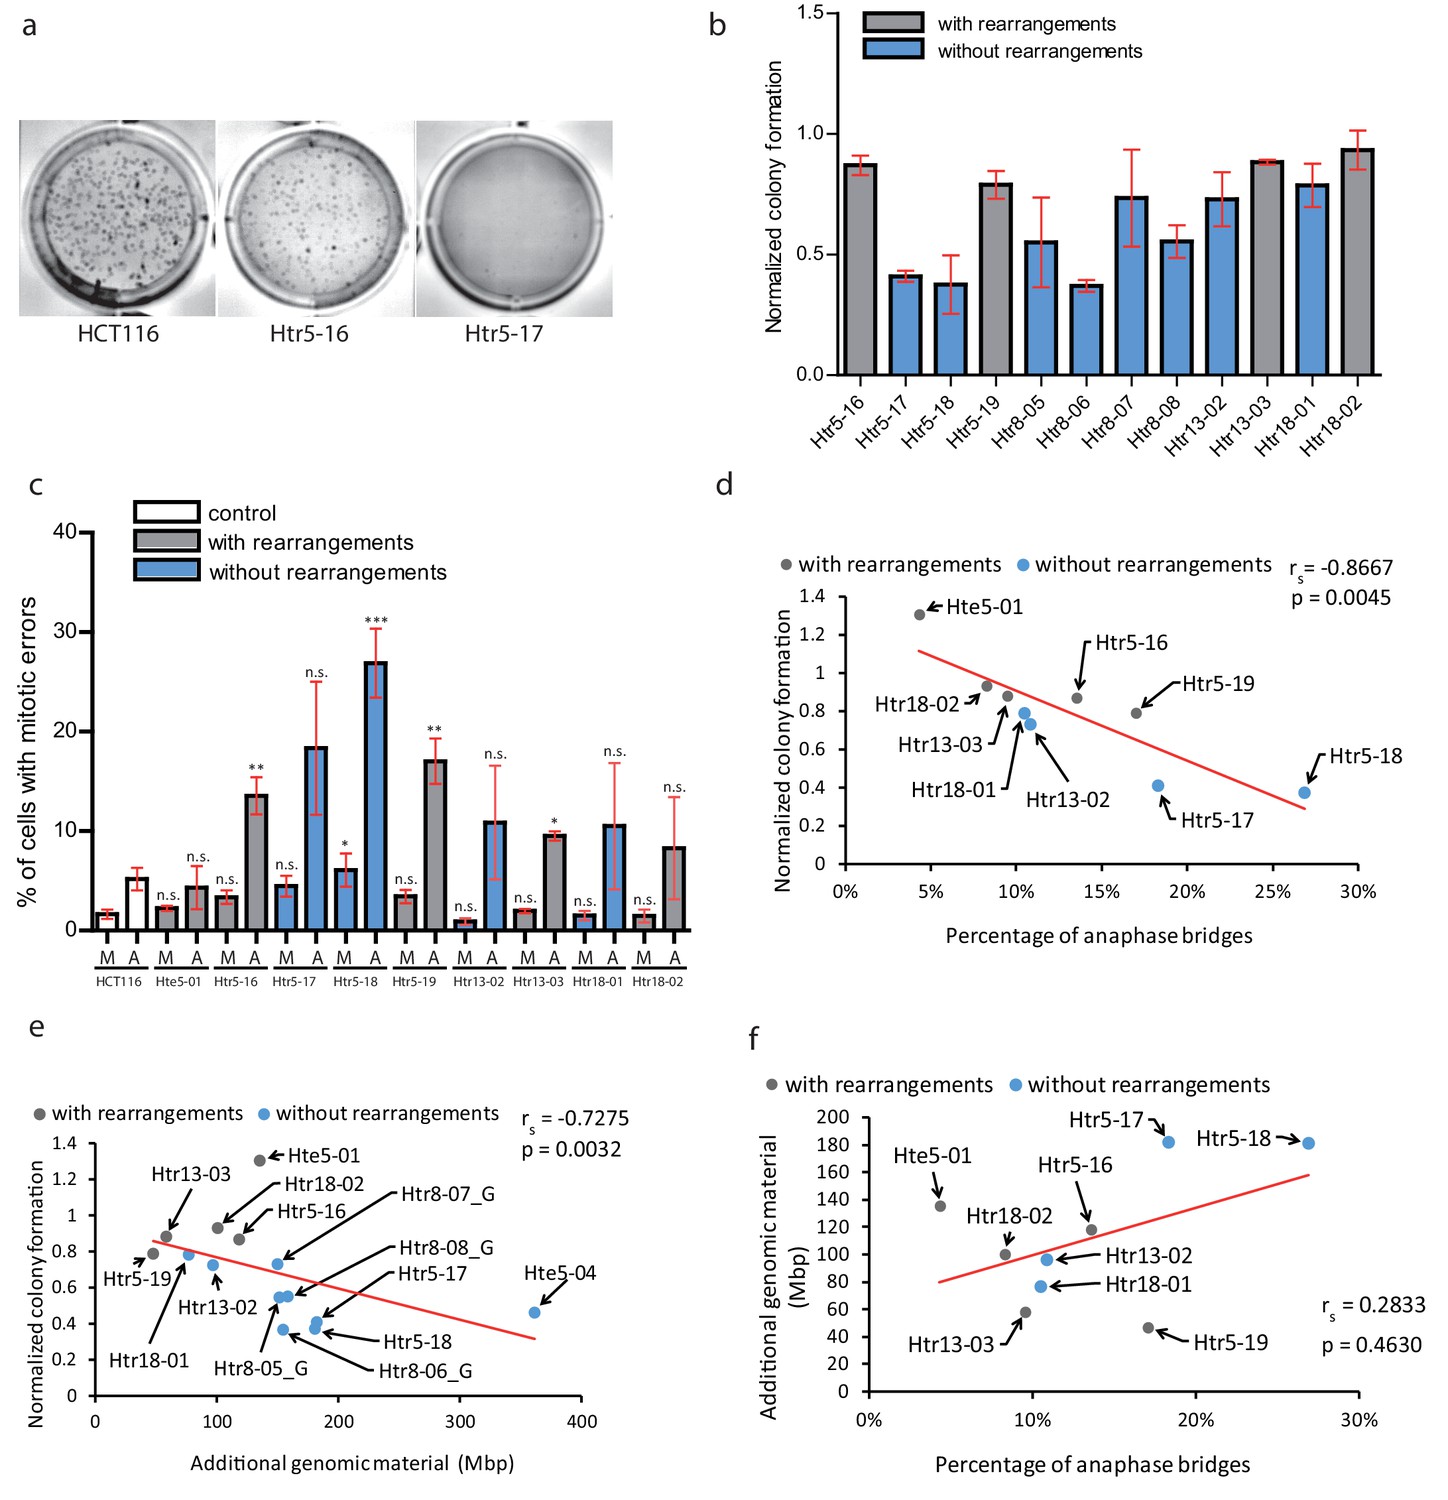
Chromothripsis provides functional advantages to the cells.
(a) Example of soft agar assay to determine colony formation ability in parental cell line HCT116, trisomy with a highly rearranged extra chromosome 5 (Htr5-16) and trisomy with a nearly intact extra chromosome 5 (Htr5-17). (b) Number of colonies in trisomic cell lines with (gray) and without (blue) rearrangements on the extra chromosome, normalized to the parental control. Each bar represents mean ± s.e.m. of four replicates. (c) Quantification of micronuclei (M) and anaphase bridges (A) in trisomic cell lines with (gray) and without (blue) rearrangements on the extra chromosome. Each bar represents mean ± s.e.m. of at least three independent experiments. (d) The normalized colony forming capacity of the cell lines correlates with the percentage of anaphase bridges in trisomic and tetrasomic samples. (e) The amount of additional genomic material in trisomic and tetrasomic samples correlates with the normalized colony forming capacity of the cell lines. (f) The amount of additional genomic material in trisomic and tetrasomic samples correlates with the percentage of anaphase bridges. The cell lines with rearrangements on the extra chromosome are marked in grey, the cell lines without rearrangements are in blue. Data in (c) were evaluated using unpaired T-test (compared to HCT116). P-value: *<=0.0154 **<=0.0017 ***<=0.0004. Data in (d) - (f) were evaluated using Spearman Rank Correlation. Correlation coefficient (rs) and two-tailed p-values (p) were calculated. Differences of the datasets in (d) and (e) are significant.
-
Figure 5—source data 1
Source data for Figure 5.
- https://cdn.elifesciences.org/articles/50292/elife-50292-fig5-data1-v2.xlsx
Figure 5—figure supplement 1
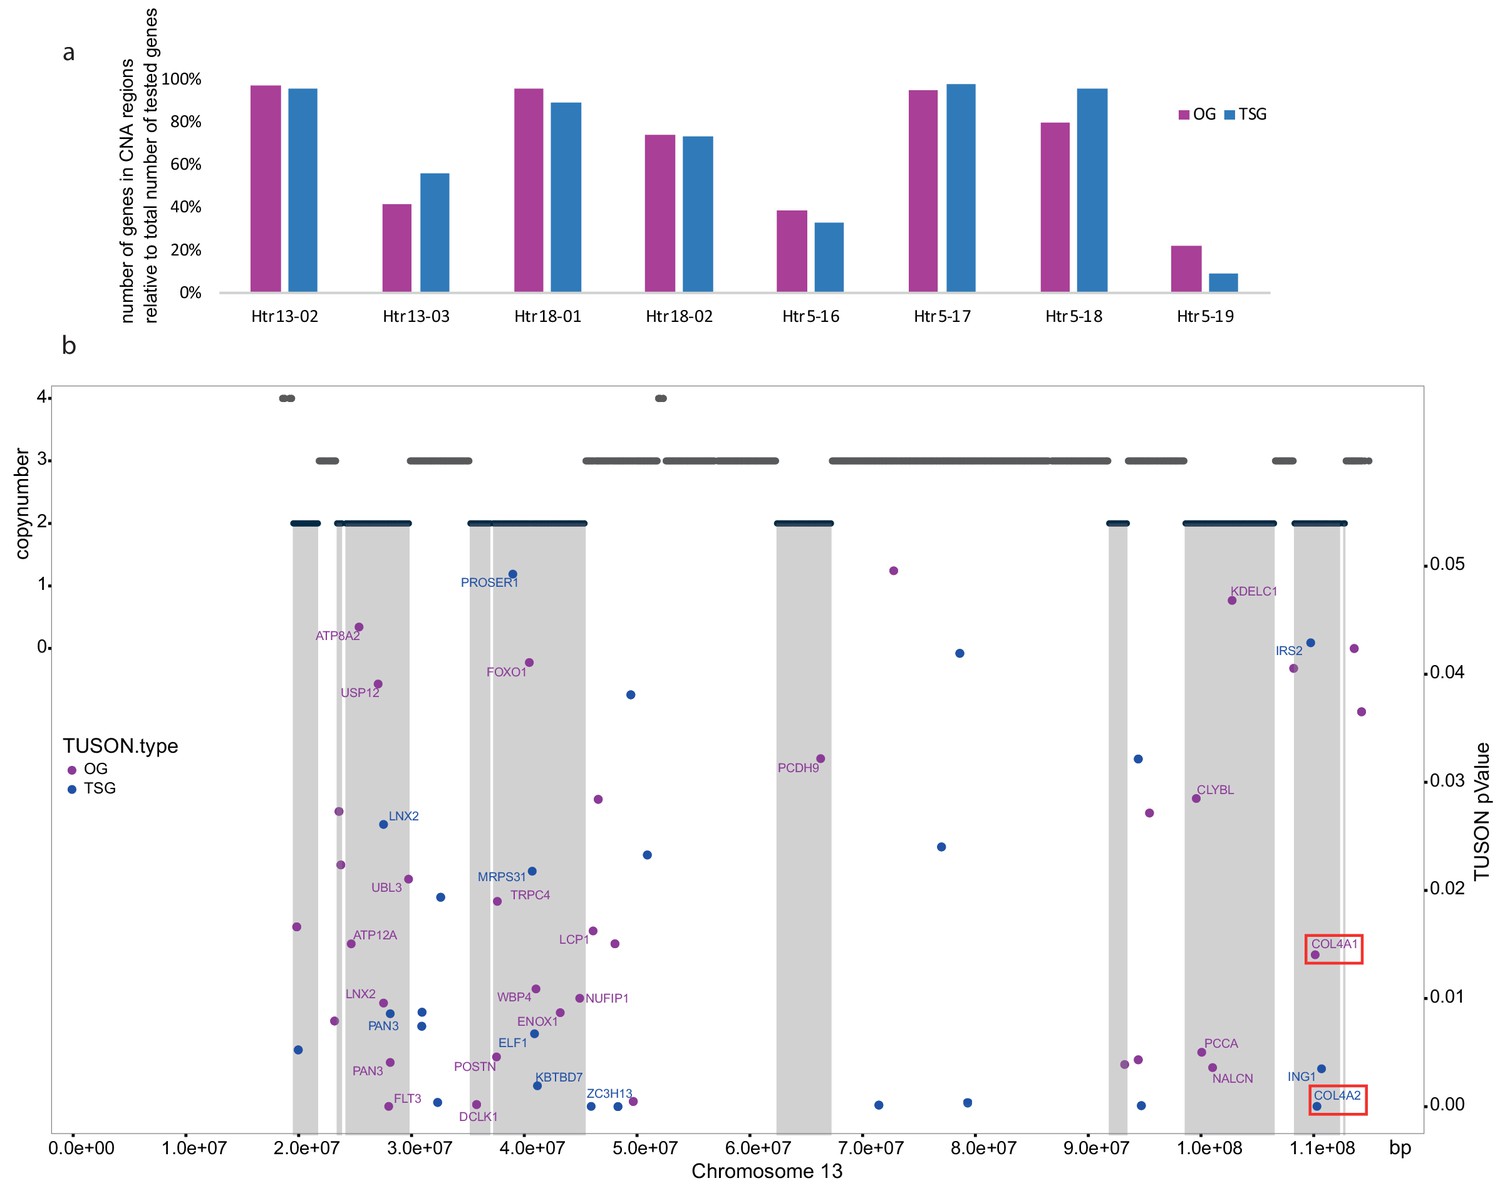
Gene-specific changes.
(a) Percentage of TSGs and OGs as defined by the TUSON explorer with a TUSON p value < 0.05 that overlap with the CAN regions on the transferred chromosome of the samples Htr13-02, Htr13-03, Htr18-01, Htr13-02, Htr5-16, Htr5-17, Htr5-18 and Htr5-19. Number of included genes: chr. 5 - TSG: 45, OG: 85; chr. 13 - OG: 36, TSG: 25; chr. 18 - OG: 23, TSG: 19. Reference genome: GRCh38. (b) CNA of the sample Htr13-03 (top, y-axis: left) and overlapping TUSON genes with TUSON p Value (bottom, y-axis: right). Gene names are added only for the genes with the CN state 2. TSGs and OGs are color-coded as defined in the legend. COL4A1 and COL4A2 are marked with a red rectangle.
Figure 5—figure supplement 2
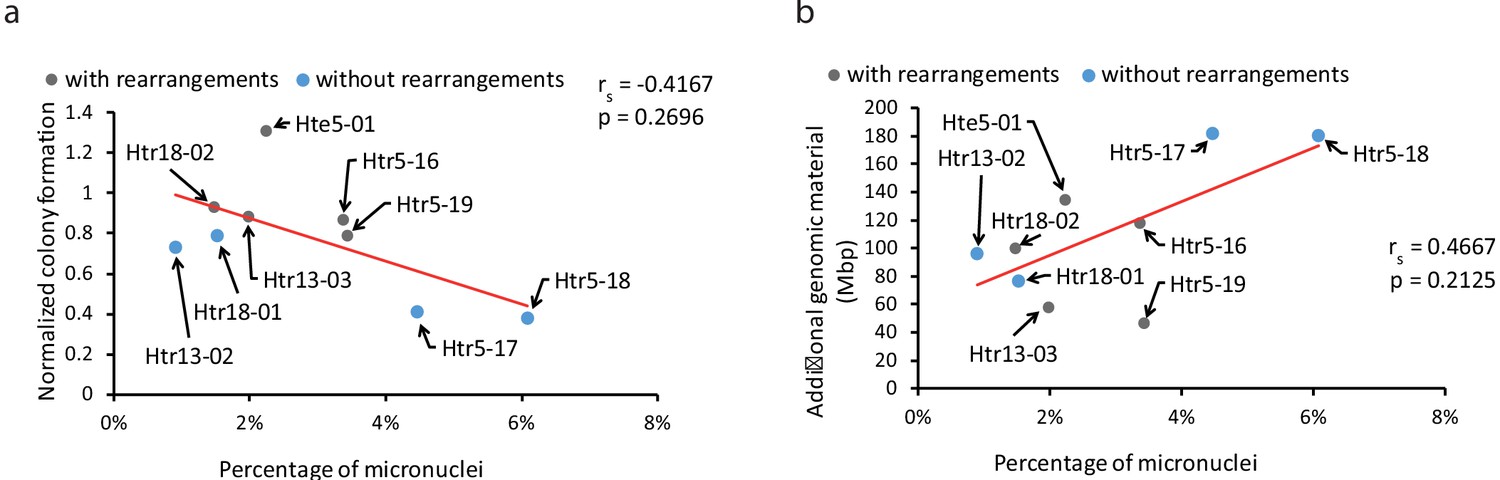
Correlation of colony forming capacity.
(a) The normalized colony forming capacity of the cell lines relative to the percentage of MN in trisomic and tetrasomic samples. (b) The amount of additional genomic material in trisomic and tetrasomic samples relative to with the percentage of MN. The cell lines with chromothripsis-like rearrangements on the extra chromosome are marked in grey, the cell lines without rearrangements are in blue. Data in (a) and (b) were evaluated using Spearman Rank Correlation. Correlation coefficient (rs) and two-tailed p-values (p) were calculated.
Additional files
-
Supplementary file 1
Cell lines used in the study.
The cell lines were created by microcell-mediated chromosome transfer. The % of cells with whole chromosome aneuploidy (WCA) shows the % of metaphase spreads that scored positive for the expected WCA.
- https://cdn.elifesciences.org/articles/50292/elife-50292-supp1-v2.docx
-
Supplementary file 2
List of all identified copy number aberrations.
- https://cdn.elifesciences.org/articles/50292/elife-50292-supp2-v2.xlsx
-
Supplementary file 3
The number and percentage of informative SNPs per chromosomal region used for determination of the chromosome affected by unique CNAs; regions are determined per clone, by copy number.
- https://cdn.elifesciences.org/articles/50292/elife-50292-supp3-v2.docx
-
Supplementary file 4
Breakpoint junctions detected by WGS that were selected for validation by PCR, Sanger sequencing and de novo assembly.
- https://cdn.elifesciences.org/articles/50292/elife-50292-supp4-v2.xlsx
-
Supplementary file 5
Overview of informative SNPs deduced from whole genome sequencing reads, allowing determination of the affected chromosome.
- https://cdn.elifesciences.org/articles/50292/elife-50292-supp5-v2.docx
-
Transparent reporting form
- https://cdn.elifesciences.org/articles/50292/elife-50292-transrepform-v2.docx
Download links
A two-part list of links to download the article, or parts of the article, in various formats.
Downloads (link to download the article as PDF)
Open citations (links to open the citations from this article in various online reference manager services)
Cite this article (links to download the citations from this article in formats compatible with various reference manager tools)
Micronuclei-based model system reveals functional consequences of chromothripsis in human cells
eLife 8:e50292.
https://doi.org/10.7554/eLife.50292


