Optimal searching behaviour generated intrinsically by the central pattern generator for locomotion
- The Marine Biological Association of the United Kingdom, United Kingdom
- University of Southampton, United Kingdom
- University of Cambridge, United Kingdom
- Facultad de Ciencias Exactas y Naturales, Universidad de Buenos Aires, Ciudad Universitaria, Argentina
- Instituto de Fisiología, Biología Molecular y Neurociencias (IFIBYNE-UBA-CONICET), Argentina
Figures
Figure 1
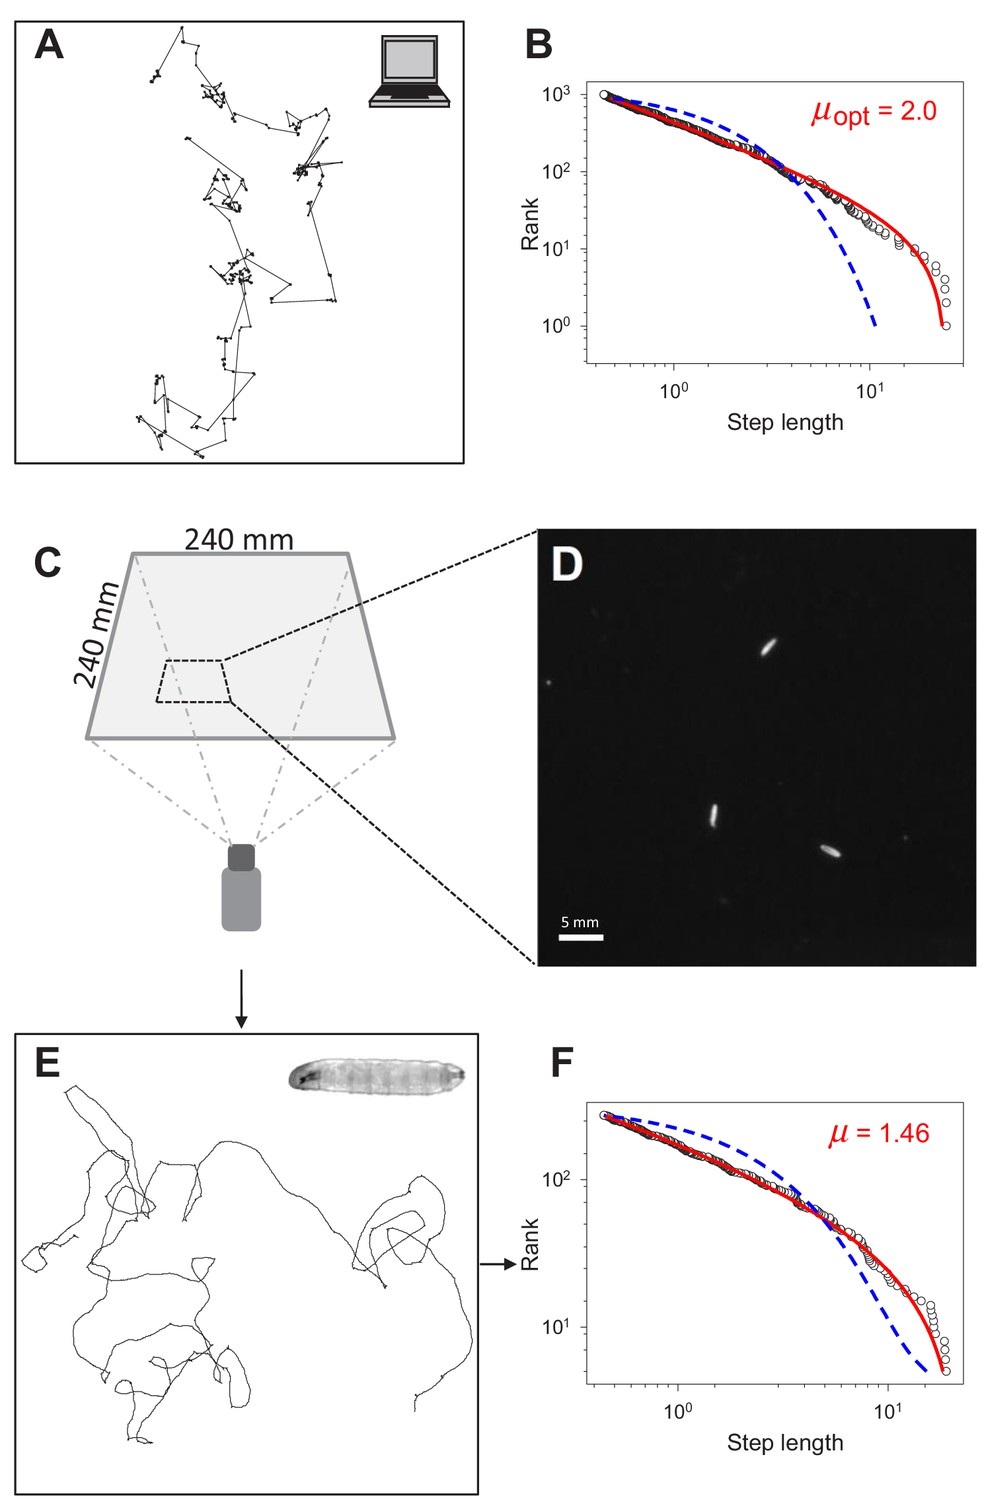
Testing for Lévy-like search patterns in Drosophila larva tracks.
(A) Computer simulated path with Lévy-distributed move step lengths (truncated power-law exponent, µ = 2.0) between turning points. (B) Rank step-length-frequency distribution of steps in (A) with Maximum Likelihood Estimation (MLE) fits of truncated power law (red line) and exponential (blue) model distributions. Recovered exponent (µ) of the truncated power law fit shown is 1.996. (C) Set-up and dimensions of the temperature-controlled, dark experimental arena (see Materials and methods) used to (D) record the positions of larvae to determine (E) the movement trajectories of individual larva (inset), prior to (F) path discretization and MLE model fitting and selection analysis.
Figure 2 with 3 supplements
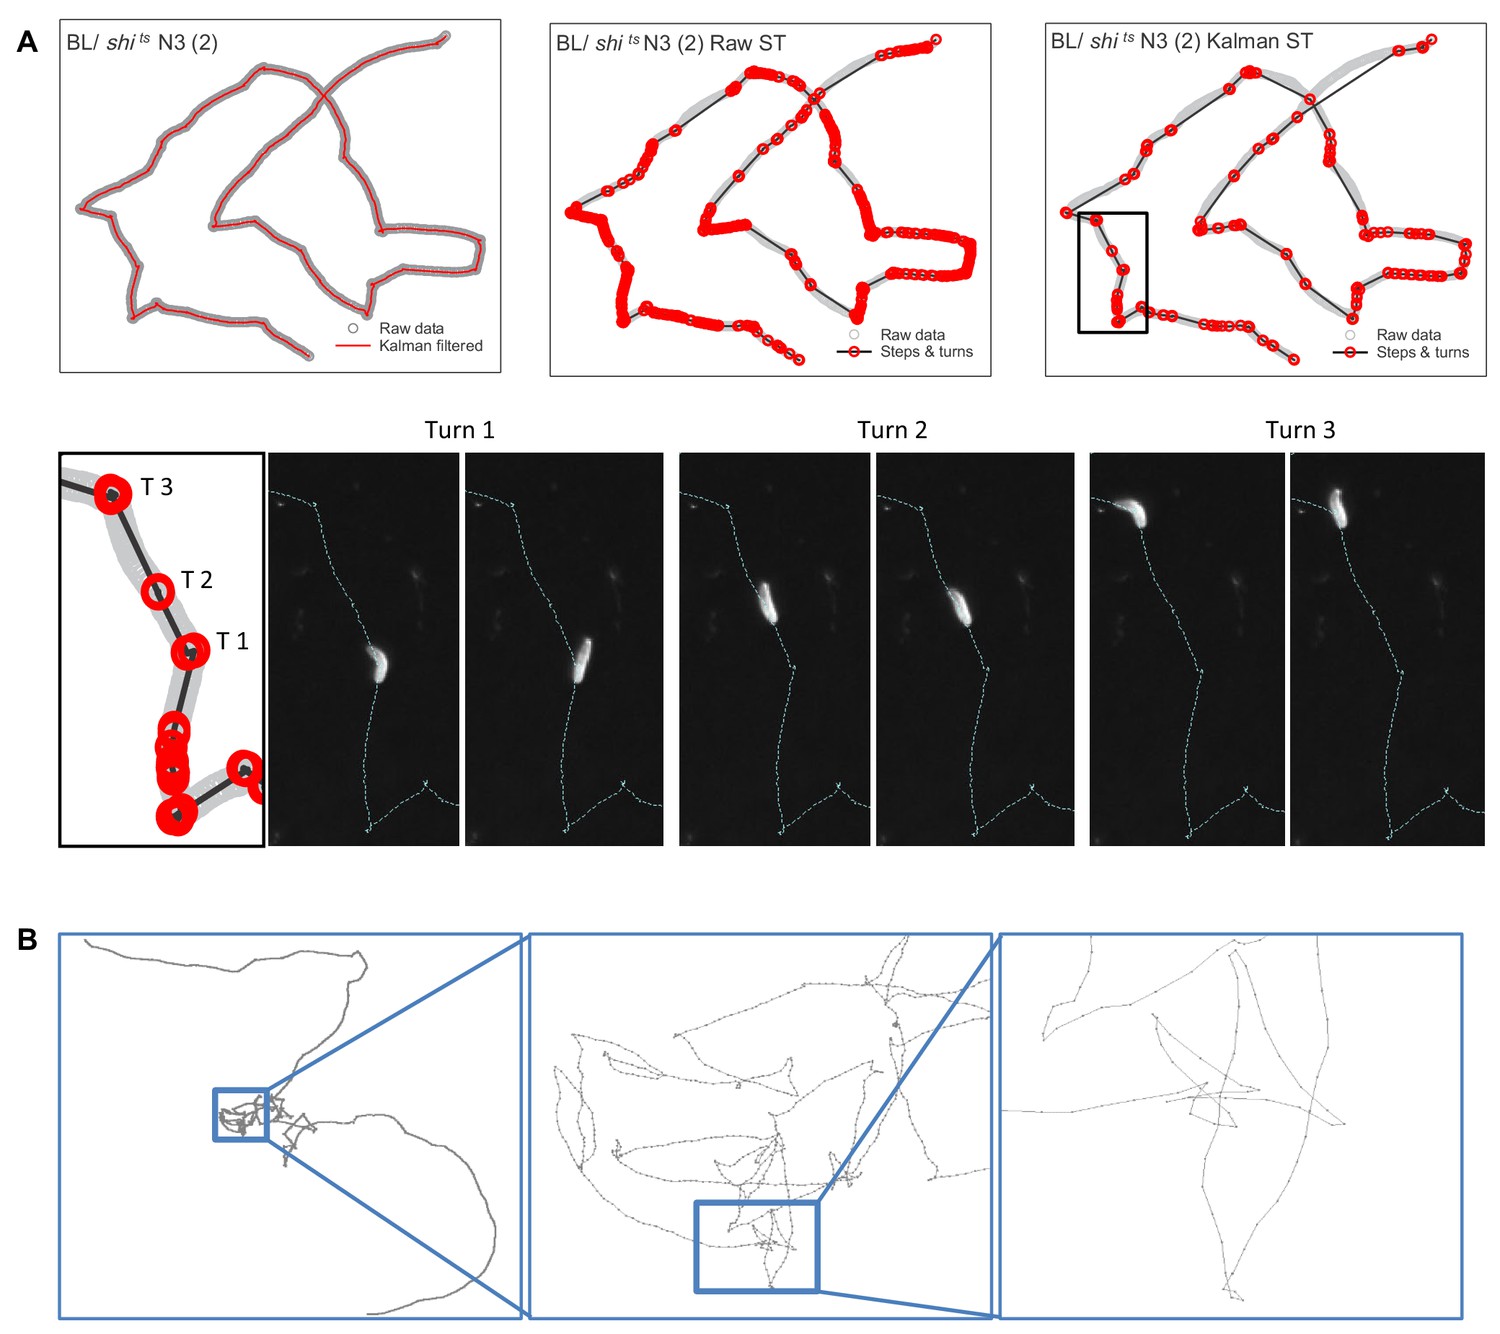
Estimating move step lengths in Drosophila larva tracks across broad scales.
(A) Examples of track processing and turn identification. Row 1, column one shows an example of the effect of the Kalman filter on raw track data; column two shows the steps and turns that would result if raw track data were analysed; column three shows the steps and turns identified following the Kalman smoothing of the raw data. Row two shows the turns executed by the larva for a short section of the track. Note that the method detects small (turn 2, (T2) and large turns (turn 1 and 3 (T1, T3)). (B) Example of normal substrate exploration (control BL / + larva) shows a similar pattern of complexity at all scales, characteristic of scale-invariant Lévy walk patterns.
Figure 2—figure supplement 1
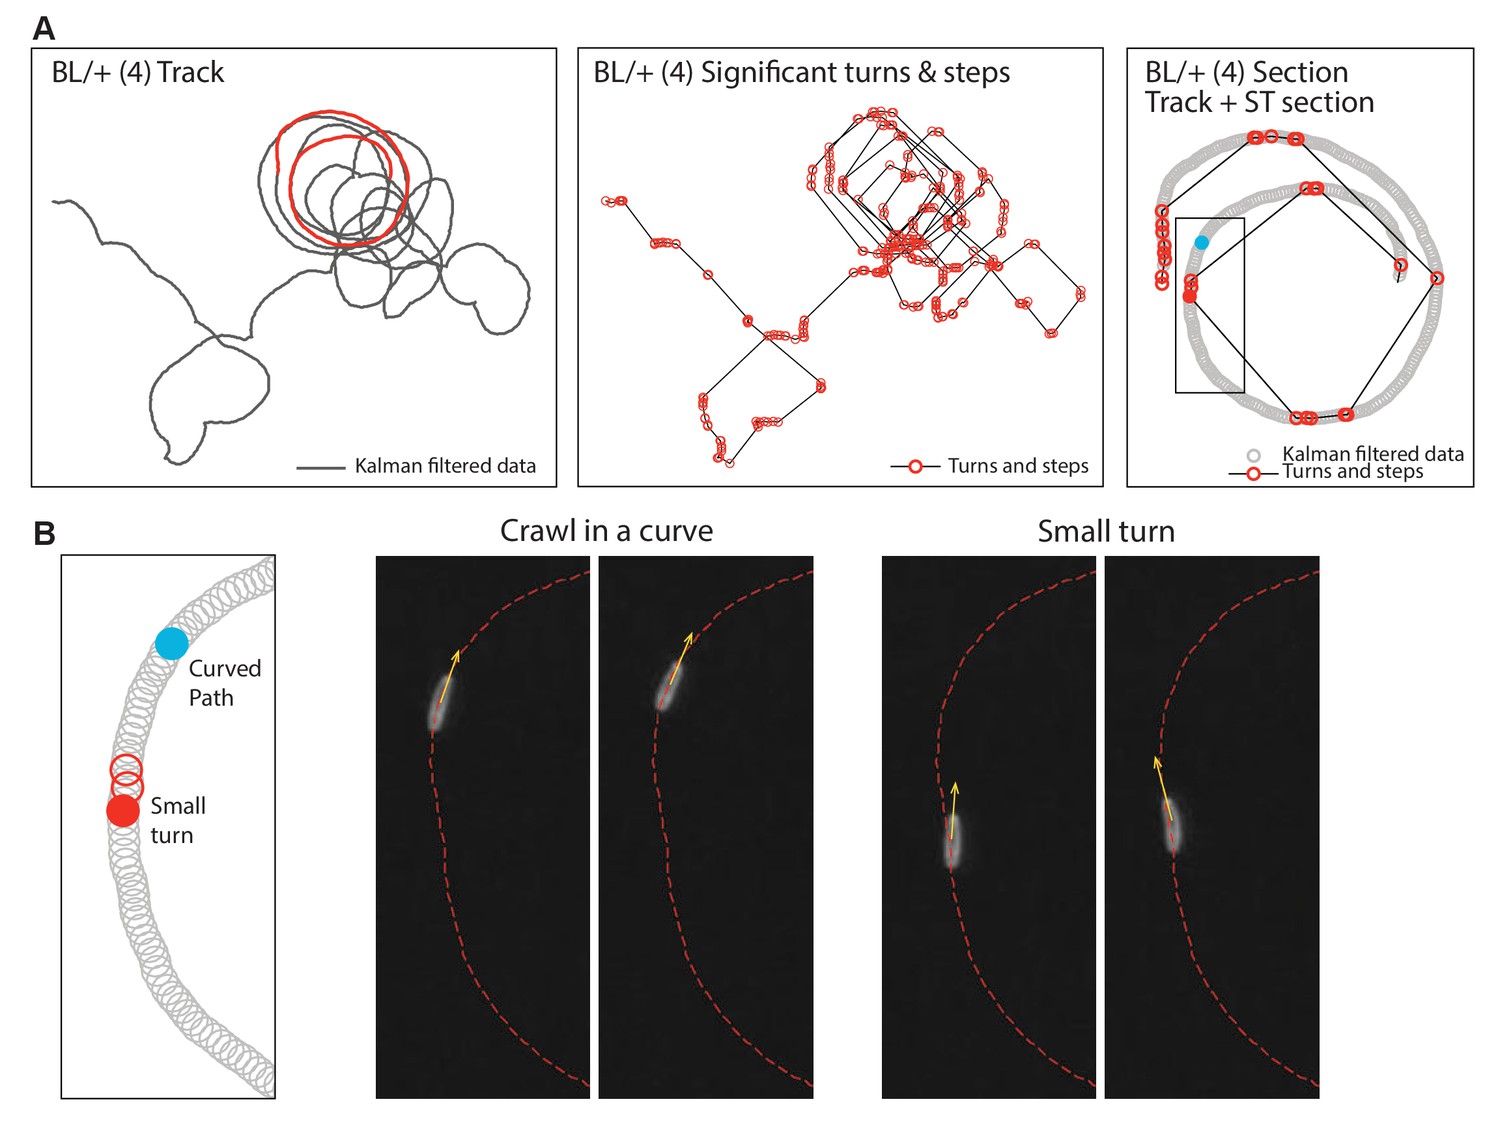
Analysis of curved paths.
Drosophila larva sometimes exhibit curved paths within movement trajectories. (A) This shows an example of a Kalman filtered track of a control larva (BL/+ at 33°C) executing a curved path. The section highlighted in red is shown in more detail in the third panel. The second panel shows the significant turns and steps for the same animal as determined using the objective move-step estimating method (Humphries et al., 2013; Tromer et al., 2015) (see Materials and methods). Without more detailed analysis, the path as plotted in is panel implies that the method identifies small steps where they appear not to occur. However, a detailed analysis of a panel 3 section is shown in (B). This demonstrates that curved tracks are indeed generated by larvae crawling in a curve (a consistent but minor deviation in heading), but that small turns do interrupt the curve and are correctly identified by the objective move-step estimation method used.
Figure 2—figure supplement 2

Effects of Kalman filter parameter changes on an example larva track.
(A) The first 10 min of a raw, unprocessed larva track compared with (B) the same track subjected to the Kalman filter (KF) parameters used for the main analysis presented in the main paper. Note the track is smoothed with no significant effect on the pattern of the principal movement path. Broad changes in the values of (C – E) the position and velocity parameters from 1.0 to 0.05, and (F – H) the minimum covariance parameter from 2.0 to 0.1, all show no significant effects on the path pattern resolution. This supports the conclusion that the finding of truncated power-law fits to larva tracks are not artefacts of track processing using a Kalman filter (see Supplementary file 2 for statistical comparisons).
Figure 2—figure supplement 3
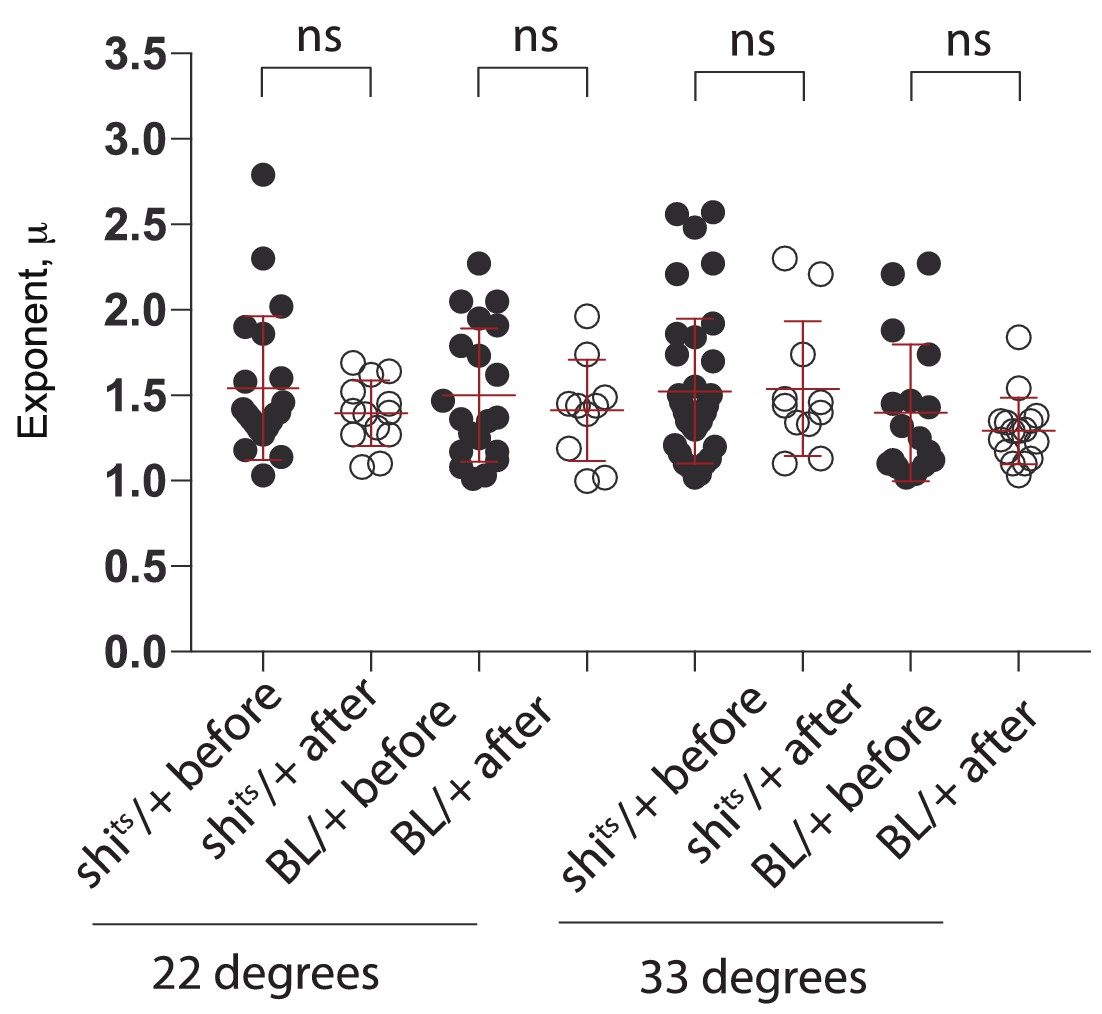
Effect of edge collision on search strategy.
Comparison of μ exponents of the truncated Lévy power-law best model fits to exploration patterns of control animals (BL/ + and shits/+ control larvae at 22°C and 33°C) before and after a collision with the edge of the arena. A Mann Whitney test comparing before and after collision for each genotype showed no significant difference in any case confirming that the search behaviour of the larvae remained unchanged.
Figure 3
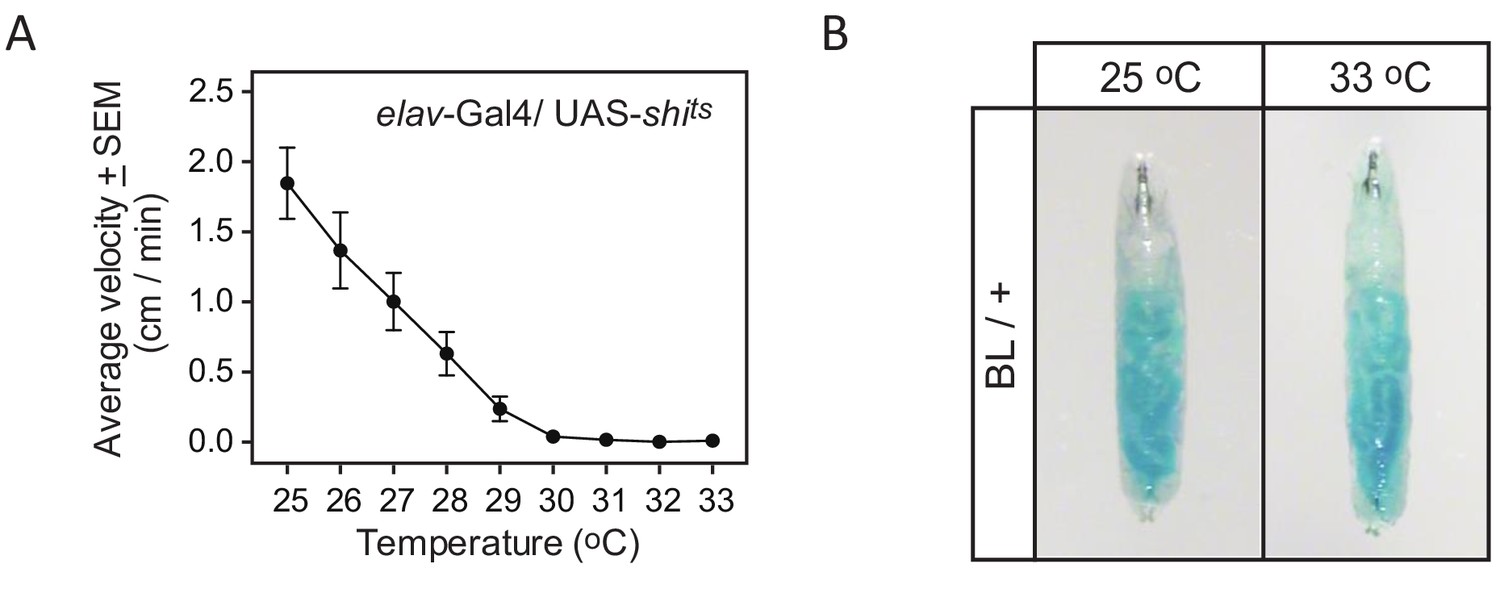
Effect of temperature on activity and feeding.
(A) The curve of inactivation of synaptic transmission with increasing temperature demonstrated by decrease in the average velocity of elav-Gal4/UAS shits third instar larvae as a function of temperature. Ten larvae were placed on the arena and their behaviour was evaluated as the temperature increased. At 30°C and above the larvae are paralysed indicating that synaptic transmission is blocked panneurally. (B) Effect of temperature on feeding behaviour. Larvae were placed on small patches of yeast (50% dry yeast in water with 0.1% brilliant blue) located on the arena for 30 min. A blue gut indicates that larvae have been feeding similarly at 25°C and 33°C. This shows that even if 33°C is above the described preferred temperature of the larvae (see Materials and methods), it is still within a range where feeding behaviour is not affected.
Figure 4
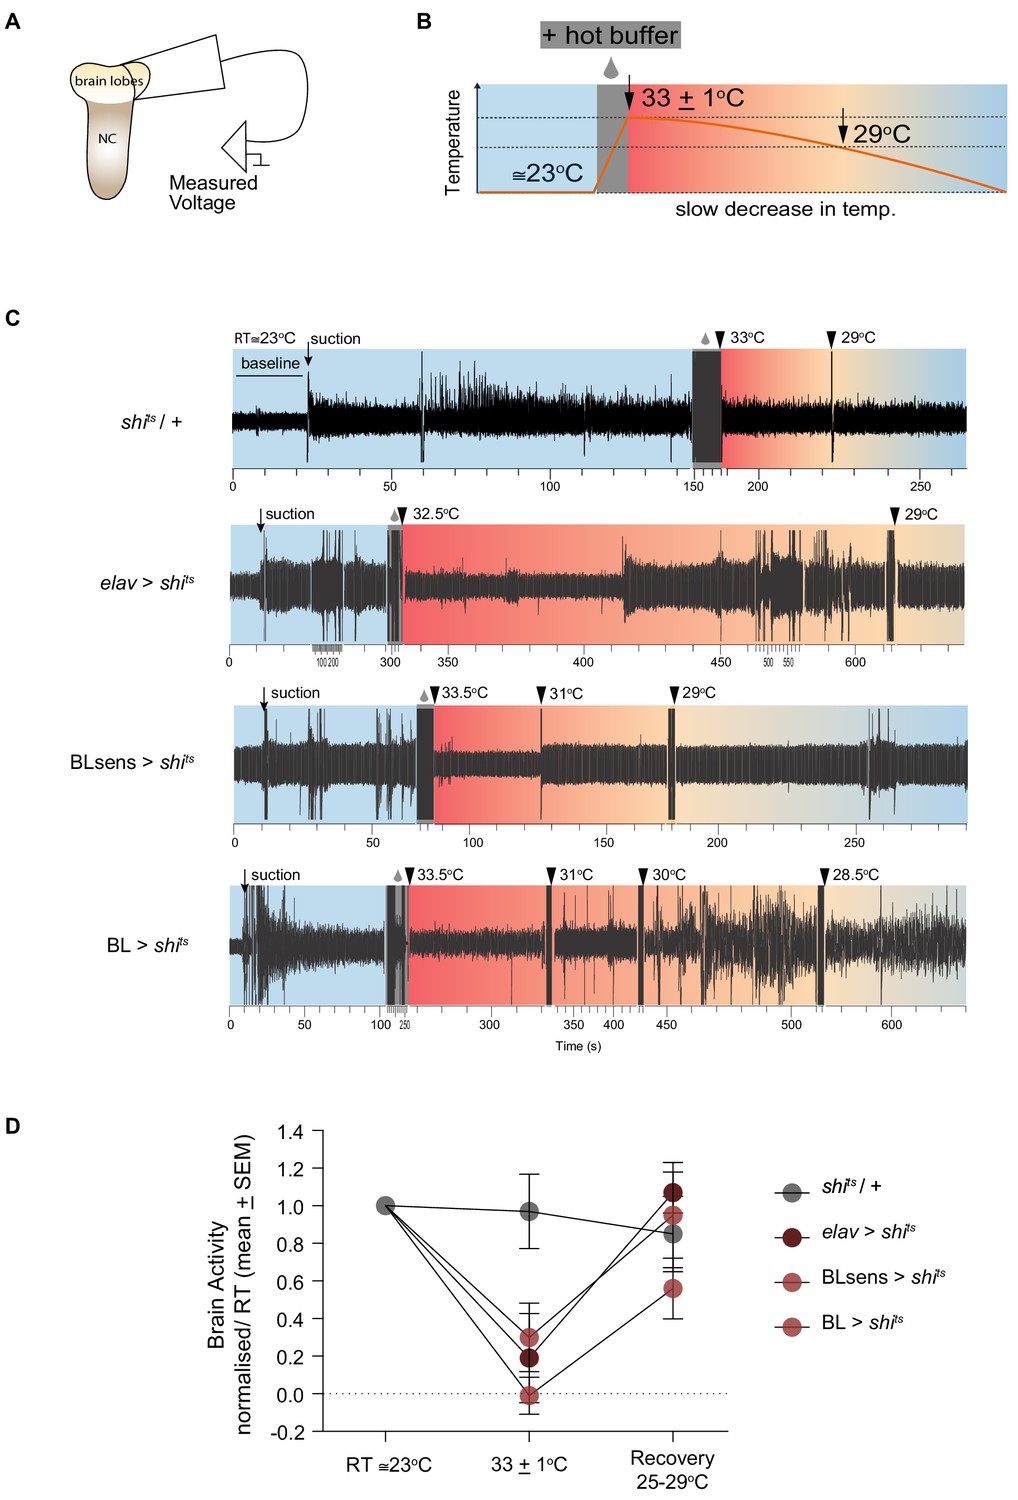
Shibirets mediated inhibition of brain activity.
(A–B) Schematic of the experimental design for extracellular recordings. (A) Early third instar larvae were dissected and a suction electrode was attached to one brain lobe. NC denotes the nerve cord (thoracic and abdominal segments). (B) Neuronal activity was measured at reference temperature (RT ≅23°C) shaded in light blue and during the hot temperature treatment (shaded red), which started with hot buffer superfusion (grey box) until the restrictive temperature was reached (33 ± 1°C) and continued until ≅29°C (recovery) where normal levels of activity were reached in shits expressing samples. (C) Representative traces of measured activity for each genotype. Baseline until suction and recording at RT are shaded light blue. The suction produced a mechanical artifact followed by an increase in the recording amplitude. Hot buffer superfusion and temperature probe (grey box) also produced an artifact. The increase in temperature did not change brain activity in shits/+ lobes. However, there was a sharp decrease for elav >shits, BLsens > shits and BL >shits. Brain activity gradually recovered until reaching levels that did not differ from RT activity. Note that the time scale has been adjusted to account for differences in recording period. (D) Normalised neuronal activity. Brain lobe response to temperature changes was quantified as the ratio between response recorded (minus the baseline) at (33 ± 1°C) and the RT. At restrictive temperature (33 ± 1°C), neuronal activity did not change in the negative control shits /+ animals (n = 6), while it was blocked in the positive control elav >shits (n = 5), and in the experimental treatments BL >shits (n = 7) and BLsens > shits (n = 5). A two way ANOVA for repeated measures showed differences within the temperature (F(2, 57)=13.84; p<0.0001) and the genotype groups (F (3, 57)=2.785; p=0.05) but no significant interaction. A post hoc Tukey's test comparing genotypes at each temperature showed significant differences only at (33 ± 1°C) between the control shits /+ and the treatments, elav >shits, BLsens > shits and BL >shits (p<0.0096, p<0.0007 and p<0.016, respectively).
Figure 5 with 1 supplement
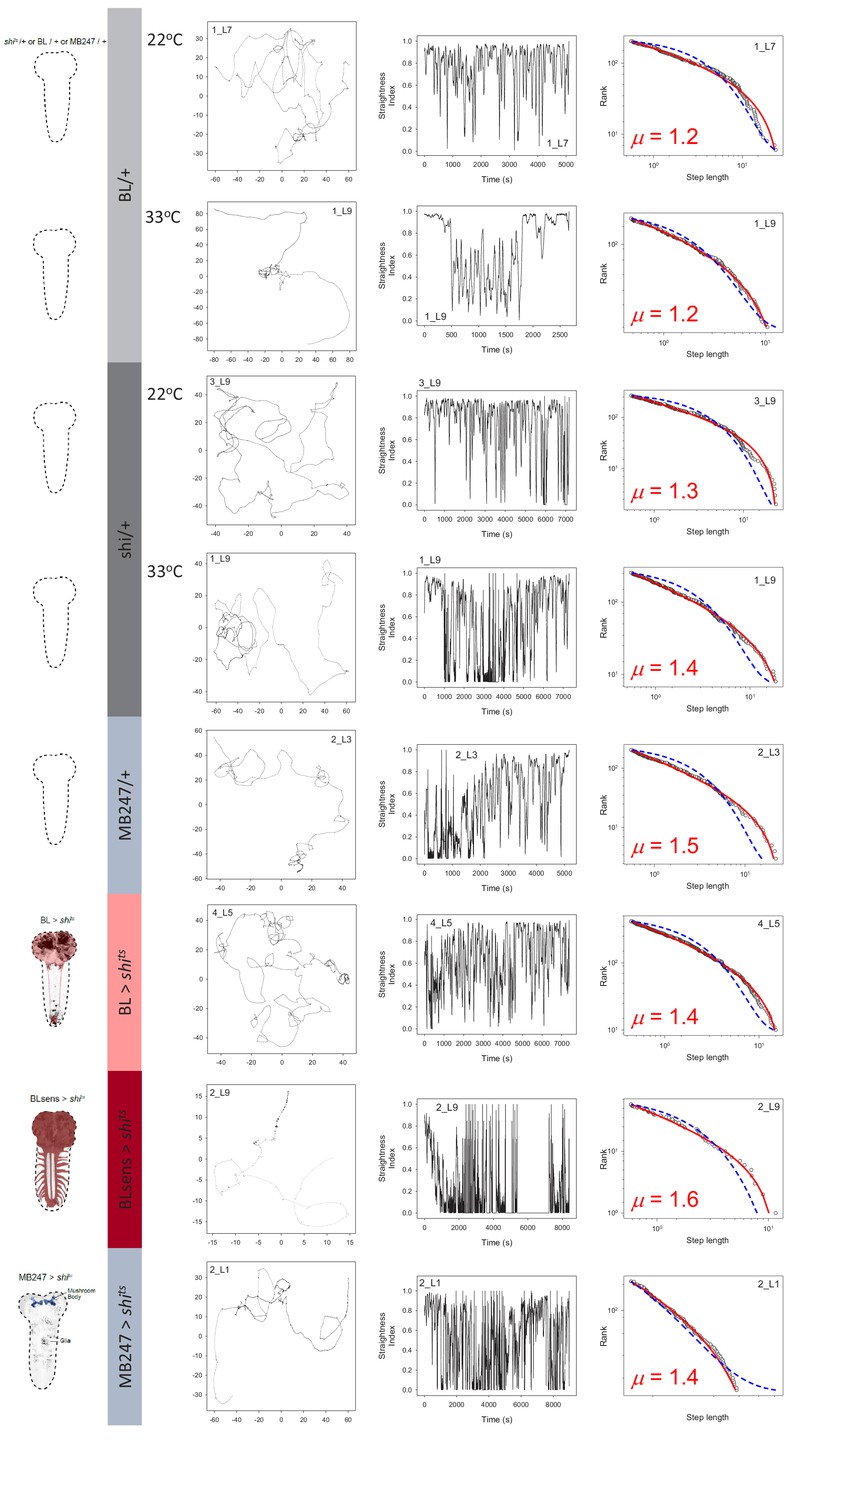
Control and brain blocked larvae movements.
Example of larva trajectories for each of 8 experimental treatments. Each treatment is signified by the Drosophila brain outlines and colour coding on the left of panels (A). BL/+ (light grey) and shits/+ (dark grey) treatments were conducted at normal (22°C) and restrictive temperatures (33°C) whereas MB247/+ and MB247 >shits (light blue), and BL >shits (pink) and BLsens > shits (red) were tested at 33°C. (B) For each treatment an example larva trajectory is given with paths showing complex patterns of movement. All trajectories showed similar complexity across scales but which are not possible to illustrate in a single panel as here, but which are evident from path tortuosity analysis. Scale of paths are denoted by the x,y coordinates in mm. (C) Tortuosity analysis shows complex alternations of long, straighter move steps (higher straightness index, S.I., values) with short, spatially intensive clusters of move steps of different size (lower values). Note the BL >shits larva with no function in the brain and a section of the suboesophageal ganglion (SOG), and BLsens > shits larva with blocked brain lobes, SOG and all somatosensation, both show complex exploration movements similar to controls. (D) MLE model fitting and selection demonstrates larvae move-step length rank frequency distributions best fit by truncated Lévy power laws for each experimental treatment (fitted red line) compared to a Brownian walk (exponential model; blue line). Move step length frequency distributions were well approximated by a truncated Lévy power law across all treatments, with exponents ranging from 1.3 to 2.0. It is striking that BLsens > shits larvae exponents were close to the theoretical optimum (µ ~2.0) indicating Lévy-like movements must be generated intrinsically within thoracic and abdominal neural circuitry.
Figure 5—figure supplement 1
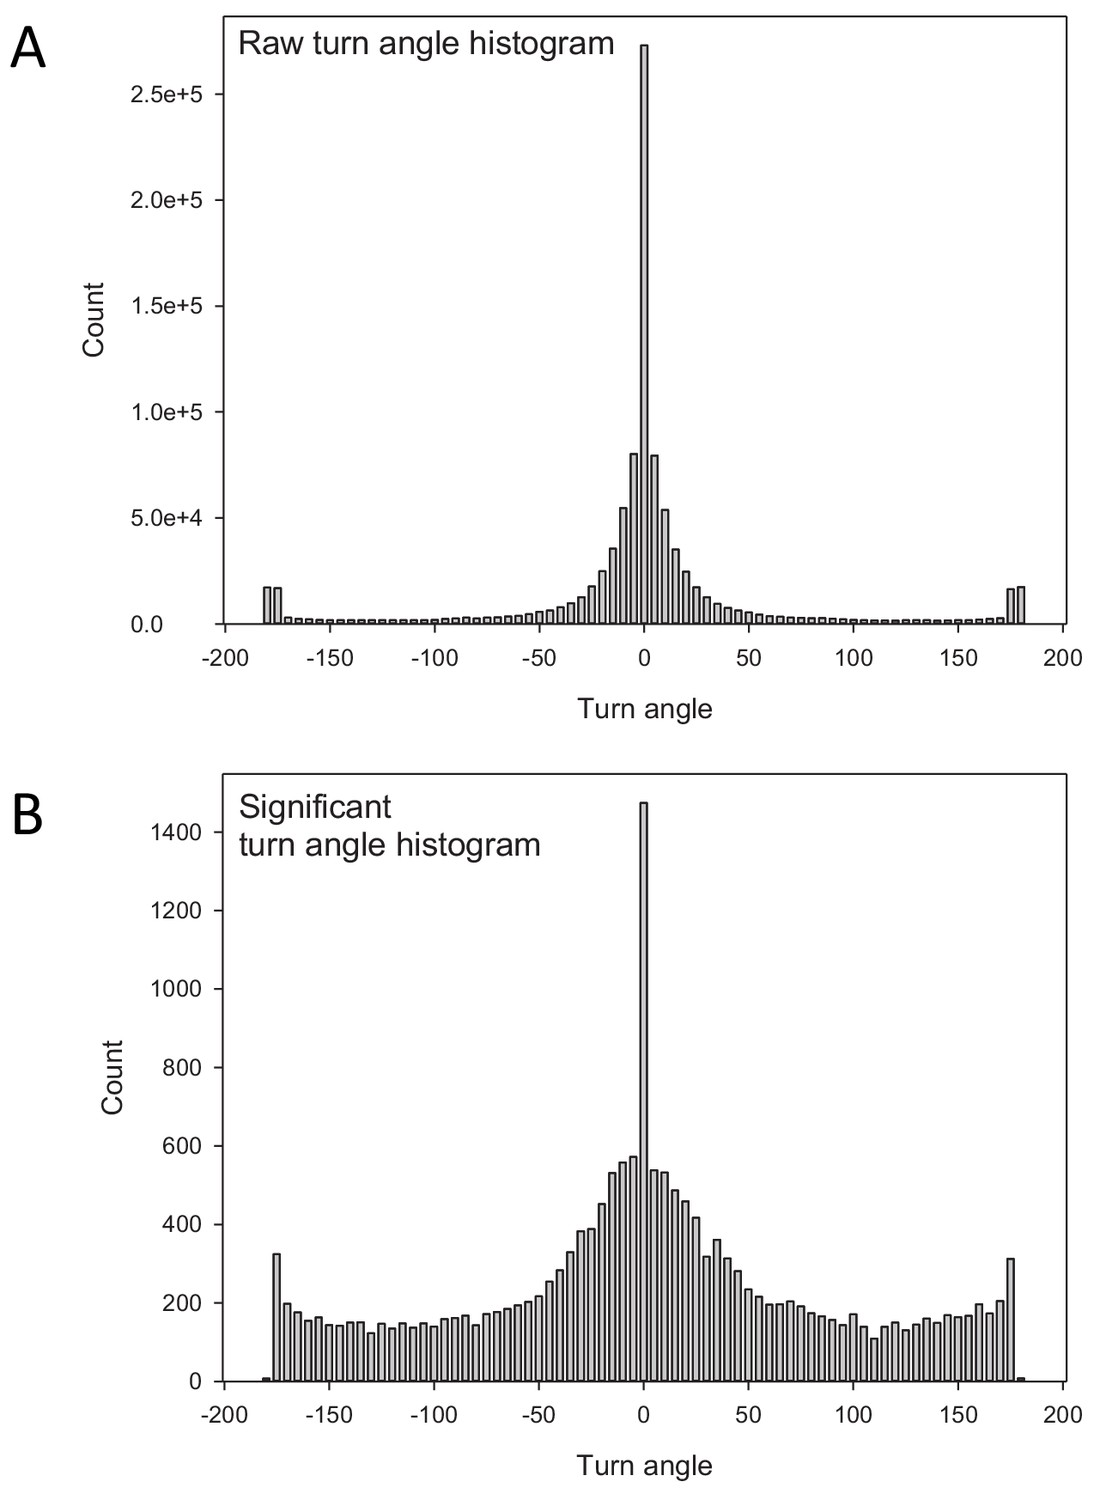
The distributions of turning angles along larva paths.
Comparison of (A) the raw distribution of turn angles with (B) the turn angle distribution after determining significant turns. The raw distribution in (A) is dominated by a very high frequency of small angle deviations around 0o that may be unrelated to actual turning behaviour (interruptions in the movement path). The high frequency of small deviations with relatively few larger angle turns does not fit the expectation of a uniform random turn-angle distribution of an uncorrelated random walk. The distribution of significant turns in (B) identifies a relatively higher frequency of larger angle turns that is more consistent with a uniform turn angle distribution of idealised random Lévy walks (note that there are far fewer significant turns than raw turns). The significant turns identified between 50 and −50o indicate the presence of short-range angle correlations, however, Lévy walks are independent of short-range correlations and the estimated value of µopt = 2 remains unchanged (see main text for details).
Figure 6

Summary data of truncated power law exponents across treatments.
(A) Images and diagrams of the pattern of expression targeted in each genotype. (B) Comparison of μ exponents of the truncated Lévy power-law best model fits to exploration patterns of BL/ + and shits/+ control larvae with intact nervous systems, BL >shits with blocked brain and a section of the SOG, and BLsens > shits with blocked brain, SOG and somatosensation, within the Lévy range (1 < µ ≤3; range bounds denoted by grey dotted lines). Scatter plot and mean (± SD) exponents: note the theoretically near-optimum search pattern (µoptopt2) of BLsens > shits larvae demonstrated by the mean exponent (µ) of 1.96. (C) Scatter plot and mean (± SD) of μ exponents of the truncated Levy power-law best model fits for the mushroom body experiment at 33°C. The data distribution was not normal using D'Agostino-Pearson normality test. A Kruskal-Wallis test showed significant differences between the genotypes p=0.0002, H(8)=28.27. Post doc Dunn's multiple comparisons relevant test results are shown on the graph.
Figure 7
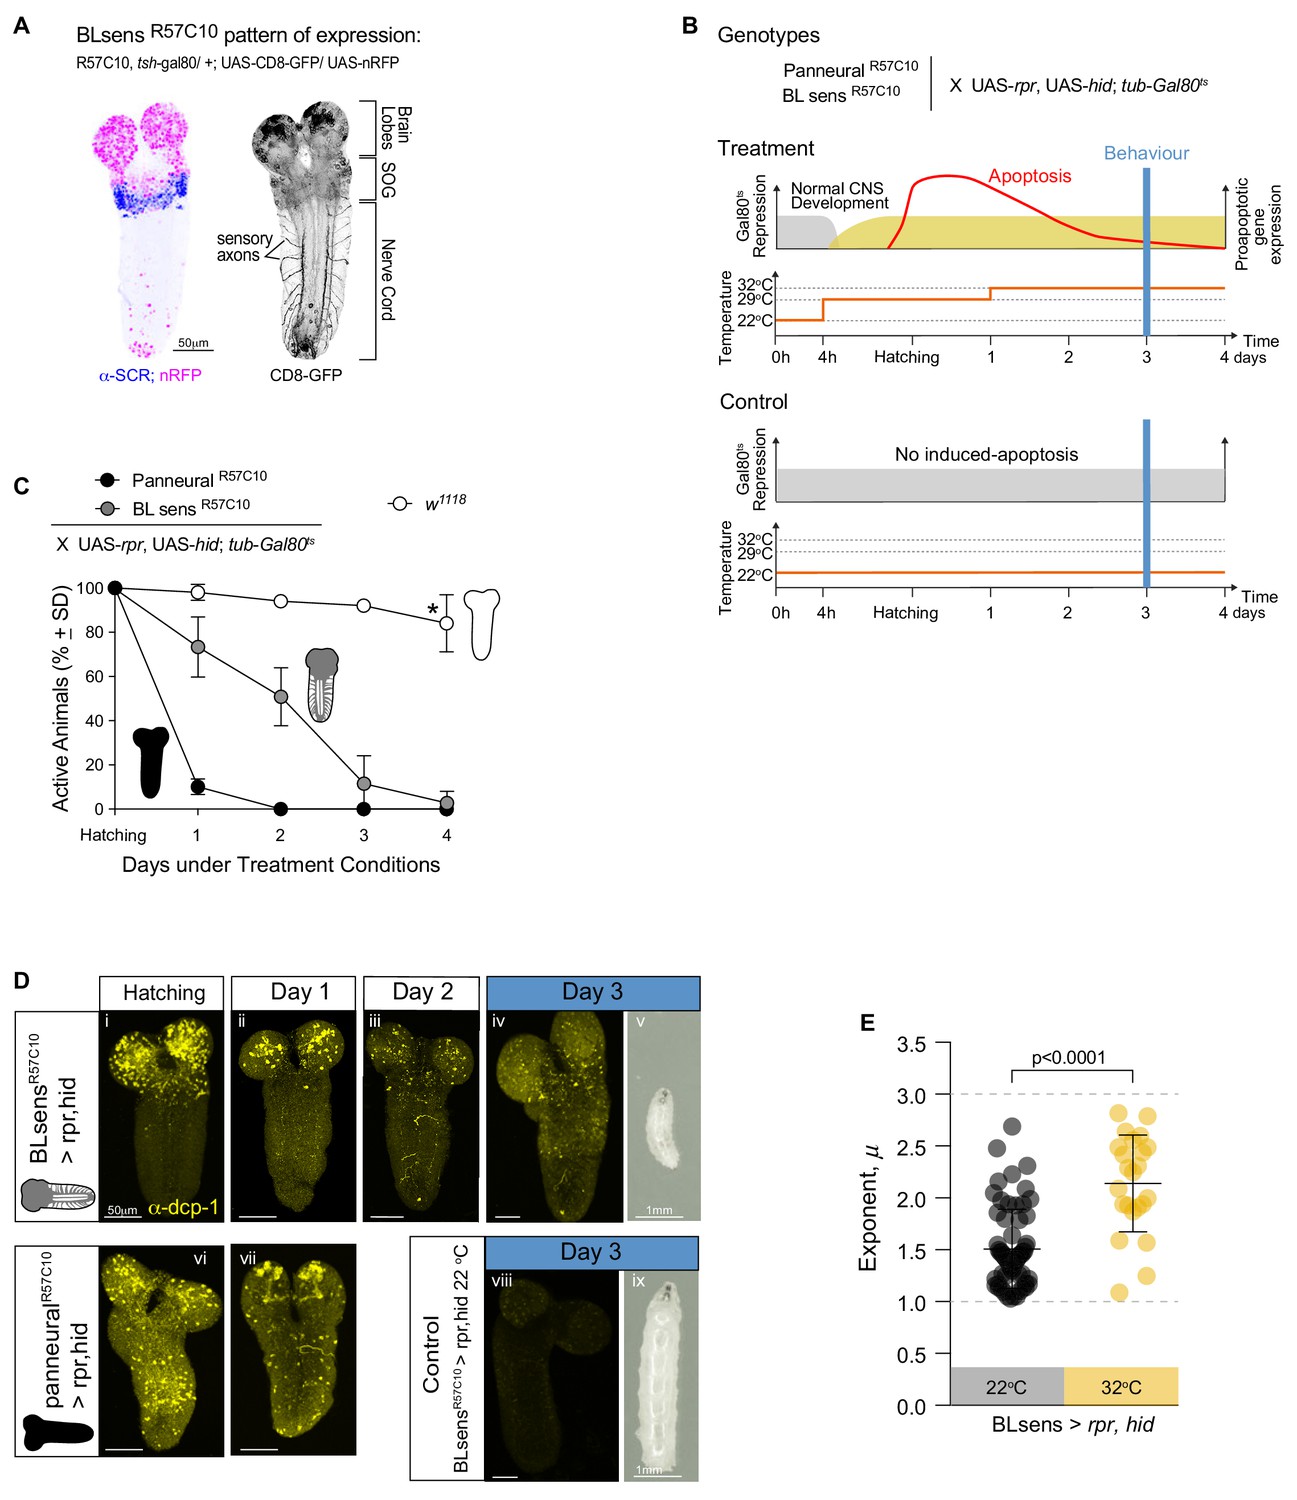
Near optimal Lévy search in larvae after apoptosis in the brain lobes.
(A) Expression pattern of the BLsensR57C10 line. Gal4 is highly expressed in the brain lobes and SOG until the anterior boundary of SCR expression. (B) Schematic of the experimental design. Each one of the genotypes was subjected to the treatment protocol, which induces the expression of proapoptotic genes (rpr and hid) in mid embryonic stages resulting in apoptosis when the larvae hatch. Higher levels of apoptosis were induced by increasing temperature to 33°C 24 hr after hatching. Control animals were kept under non-activating (22°C) conditions. The behavioural experiments were conducted at day 3. (C) Quantification of active larvae in the treatment conditions. w1118 was used as a control. Asterisk denotes that at day 4 a few larvae have moulted. (D) Apoptosis and larval size. The expression of Death Caspase-1 (anti-CPD-1 in yellow) was used as a readout of cell death. Nervous systems were evaluated at hatching (i, vi), at day 1 (ii, vii) and at day 2 (iii) and day 3 (iv,viii). Neuronal death is observed in the brain lobes of BLsensR57C10 > rpr,hid larvae and in the entire nervous system of R57C10 > rpr,hid animals at hatching and day 1. At day 2, R57C10 > rpr,hid were all dead indicating that a high level of apoptosis was reached. The number of neurons ongoing apoptosis started declining in BLsensR57C10 > rpr,hid larvae brains until day three when CPD-1 was only observed in granules. Larvae with brain lobes death (v) are smaller than control animals (viii) likely due to decrease food intake. (E) Scatter plot and average exponents (± SD) of the truncated Levy power-law best model fits to exploratory pattern. R57C10 > rpr,hid have a mean exponent (µ) of 2.1 close to the theoretically near-optimum search pattern (µoptopt2). The data distribution was not normal using D'Agostino-Pearson normality test. A Mann Whitney test showed significant differences between the BLsensR57C10 > rpr,hid control animals raised at 22°C and the treatment with induced apoptosis. U = 222.5, ncontrol = 62, ntreatment = 23, p<0.0001.
Figure 8
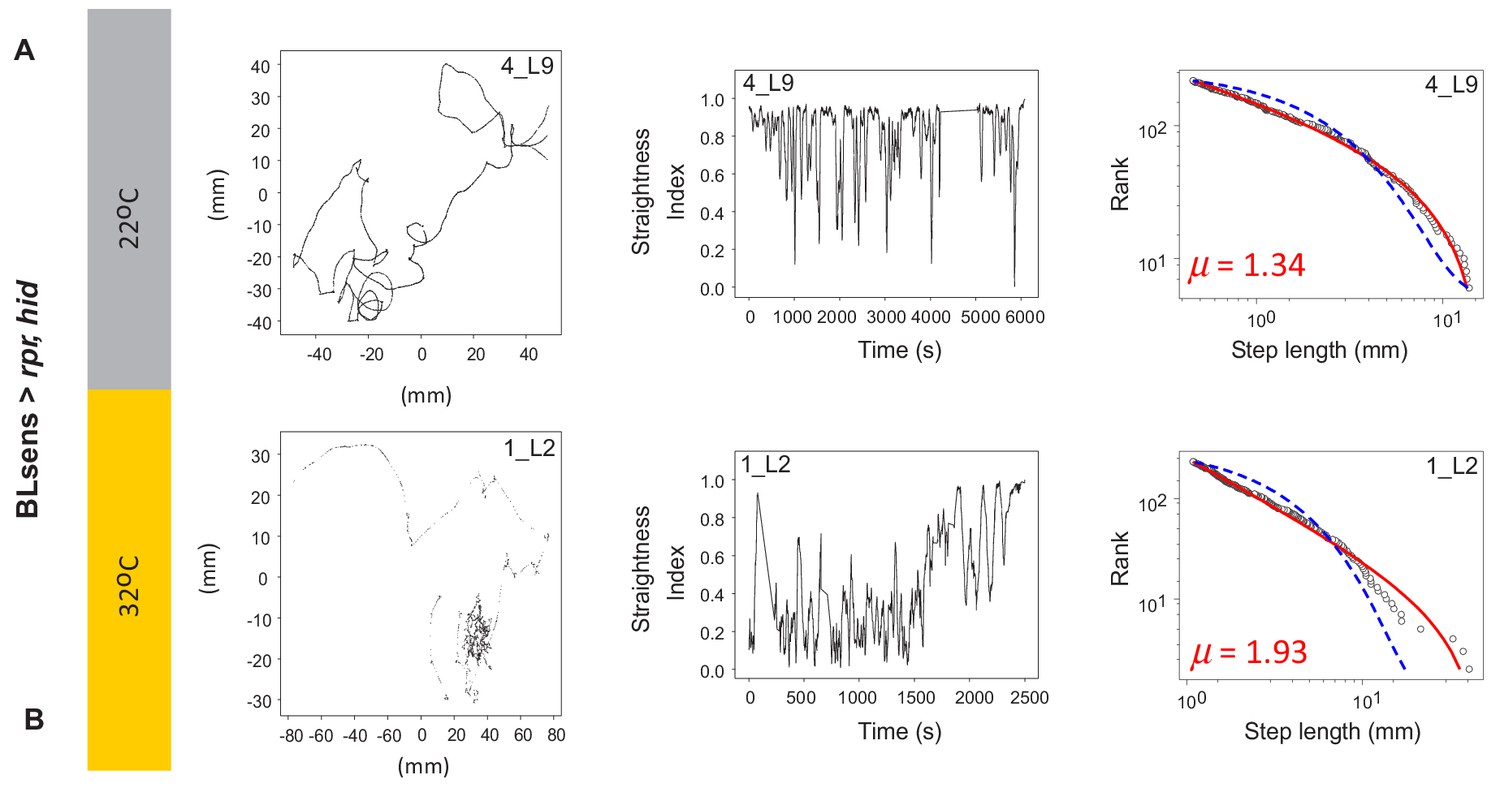
Example tracks in larva after apoptosis in the brain lobes.
(A) Control BLsens > rpr,hid larvae at 22°C show movement patterns, path complexity and truncated power law best fits that are similar to (B) BLsens > rpr,hid larvae at 32°C with apoptosis in the brain lobes. Note that the larva path in (B) has a μ exponent of 1.93 that lies closer to the theoretical optimum than the control, indicating an intrinsic neural origin of Lévy-like search patterns in Drosophila larvae. See Table 2 for mean exponents.
Tables
Table 1
Tortuosity (cluster) analysis MLE results.
Summary of mean μ exponents and orders of magnitude of the data range fitted by truncated power-law model fits from tortuosity analysis. T (°C) denotes different environmental temperature of treatment.
| T (°C) | Treatment | No. ofTracks | Mean µ | SD | Orders of Magnitude | SD |
|---|---|---|---|---|---|---|
| 22 | BL/+ | 29 | 1.70 | 0.34 | 1.98 | 0.41 |
| 33 | BL/+ | 31 | 1.54 | 0.38 | 1.99 | 0.62 |
| 22 | shits /+ | 33 | 1.85 | 0.44 | 1.89 | 0.39 |
| 33 | shits /+ | 34 | 1.61 | 0.40 | 2.04 | 0.40 |
| 33 | MB247/+ | 21 | 1.39 | 0.27 | 1.87 | 0.45 |
| 33 | BLsens > shits | 6 | 1.75 | 0.65 | 1.37 | 0.51 |
| 33 | BL > shits | 23 | 1.67 | 0.40 | 1.61 | 0.61 |
| 33 | MB247 > shits | 22 | 1.35 | 0.18 | 1.93 | 0.34 |
| 22 | New Blsens > rpr,hid_control | 61 | 1.74 | 0.33 | 2.11 | 0.37 |
| 32 | New BLsens > rpr, hid | 22 | 1.41 | 0.29 | 1.55 | 0.26 |
Table 2
MLE Analysis summary.
Summary of mean μ exponents and orders of magnitude of the data range fitted by truncated power-law model fits across experimental treatments. T (°C) denotes different environmental temperature of treatment. Means and standard deviations (SD) are given for exponents and data ranges of individual larva move-step length frequency distribution fits.
| T (°C) | Treatment | N tracks | Mu | SD | Orders of magnitude of the data | SD |
|---|---|---|---|---|---|---|
| 22 | BL/+ | 30 | 1.47 | 0.36 | 1.63 | 0.42 |
| 33 | BL/+ | 33 | 1.35 | 0.32 | 1.48 | 0.49 |
| 22 | shits/+ | 34 | 1.49 | 0.35 | 1.52 | 0.32 |
| 33 | shits /+ | 39 | 1.54 | 0.43 | 1.52 | 0.38 |
| 33 | MB247/+ | 23 | 1.74 | 0.48 | 1.33 | 0.44 |
| 33 | BL > shits | 26 | 1.66 | 0.50 | 1.15 | 0.40 |
| 33 | BLsens > shits | 11 | 1.96 | 0.39 | 1.20 | 0.23 |
| 33 | MB247 > shits | 23 | 1.56 | 0.35 | 1.39 | 0.46 |
| 22 | BLsens > rpr, hid_control | 62 | 1.51 | 0.38 | 1.71 | 0.40 |
| 32 | BLsens > rpr, hid | 23 | 2.14 | 0.47 | 0.93 | 0.52 |
Table 3
Cumulative probability distributions.
Cumulative probability distributions of truncated power law exponents calculated from individual larva move-step length distributions across experimental treatments. T (°C) denotes different environmental temperature of treatment. Note that µ exponents of shits/+ at 33 °C were not normally distributed and the treatment was not included in table (see Materials and methods).
| Cumulative Probability Distribution (%) | |||||
|---|---|---|---|---|---|
| T (°C) | Treatment | μ exponent range | |||
| 1–3 | 1.25–2.75 | 1.5–2.5 | 1.75–2.25 | ||
| 22 | BL/+ | 93.2 | 71.2 | 41.3 | 17.1 |
| 33 | BL/+ | 90.4 | 59.6 | 26.4 | 8.1 |
| 22 | shits /+ | 98.4 | 76.8 | 33.6 | 8.0 |
| 33 | MB247/+ | 96.2 | 83.9 | 60.2 | 30.6 |
| 33 | BL > shits | 92.5 | 76.0 | 51.6 | 25.3 |
| 33 | BLsens > shits | 98.7 | 95.1 | 80.6 | 47.3 |
| 33 | MB247 > shits | 96.6 | 79.9 | 50.6 | 22.4 |
| 22 | BLsens > rpr, hid_control | 94.8 | 75.0 | 45.2 | 19.3 |
| 32 | BLsens > rpr, hid | 92.9 | 85.1 | 67.9 | 38.4 |
Table 4
MSD analysis results.
Mean and standard deviations for the values of alpha and R2 from the mean squared displacement analysis. T (°C) denotes different environmental temperature of treatment.
| T (oC) | Treatment | No. of tracks | Mean α | SD | Mean R2 | SD |
|---|---|---|---|---|---|---|
| 22 | BL/+ | 30 | 1.34 | 0.51 | 0.88 | 0.10 |
| 33 | BL/+ | 33 | 1.41 | 0.53 | 0.90 | 0.10 |
| 22 | shits /+ | 34 | 1.26 | 0.45 | 0.88 | 0.16 |
| 33 | shits /+ | 39 | 1.37 | 0.73 | 0.83 | 0.21 |
| 33 | MB247/+ | 23 | 1.40 | 0.81 | 0.84 | 0.12 |
| 33 | BL> shits | 26 | 1.21 | 0.55 | 0.81 | 0.24 |
| 33 | BLsens> shits | 11 | 0.94 | 0.78 | 0.67 | 0.25 |
| 33 | MB247> shits | 23 | 1.03 | 0.42 | 0.80 | 0.18 |
| 22 | New BLsens> rpr,hid_control | 62 | 1.17 | 0.49 | 0.81 | 0.20 |
| 32 | New BLsens> rpr, hid | 23 | 1.30 | 0.53 | 0.80 | 0.14 |
Key resources table
| Reagent type (species) or resource | Designation | Source or reference | Identifiers | Additional information |
|---|---|---|---|---|
| Strain, strain background (Drosophila melanogaster) | w; elav-GAL4, tsh-GAL80/ +,+; cha3.3-GAL80, UAS-EGFP/ + | DOI: 10.1016/j.cub.2012.07.048 | NA | BL/+ |
| Strain, strain background (Drosophila melanogaster) | w; elav-GAL4, tsh-GAL80/ +,+; cha3.3-GAL80, UAS-EGFP / + | DOI:10.1016/j.cub.2012.07.048 | NA | BL > + |
| Strain, strain background (Drosophila melanogaster) | w; elav-GAL4, tsh-GAL80/ +,+; UAS-EGFP / + | DOI: 10.1016/j.cub.2012.07.048 | NA | BLsens > + |
| Strain, strain background (Drosophila melanogaster) | 20XUAS-IVS-Syn21-Shibire-ts1-GFP-p10 | Gift from G. Rubin | NA | |
| Strain, strain background (Drosophila melanogaster) | MB247-GAL4 | Gift form J. Ng | NA | |
| Strain, strain background (Drosophila melanogaster) | UAS-rpr, UAS-hid | Gift from from M. Landgraf | NA | |
| Strain, strain background (Drosophila melanogaster) | UAS-myrRFP | Gift from from M. Landgraf | NA | |
| Strain, strain background (Drosophila melanogaster) | P{GMR57C10-GAL4}attP2 | Bloomington Drosophila Stock Center | RRID:BDSC_39171 | In attp40 |
| Strain, strain background (Drosophila melanogaster) | P{tubP-GAL80[ts]}2 | Bloomington Drosophila Stock Center | RRID:BDSC_7017 | |
| Chemical | Poly-L-Lysine hydrobromide | Sigma | P2524 | |
| Antibody | Mouse monoclonal anti-SCR | Development Studies Hybridoma Bank (DSHB), IA, USA | RRID:AB_528462 | 1: 20 dilution |
| Antibody | Chicken polyclonal anti-GFP | abcam | ab13970 | 1/2000 dilution |
| Antibody | Rabbit polyclonal anti-Cleaved Drosophila Dcp-1(Asp216) | Cell Signaling Technology | #9578 | 1/100 |
| Antibody | Donkey polyclonal Alexa568 anti-mouse | Invitrogen | A10042 | 1/500 |
| Antibody | Donkey polyclonal CF633 anti-rabbit | Biotum | BT20125 | 1/500 dilution |
| Antibody | Goat polyclonal Alexa488 anti-chicken | Biotum | BT20020 | 1/500 |
| Software | FIMTrack | https://www.uni-muenster.de/PRIA/en/FIM/download.shtml | NA | FIMTrack_v2_X64_MacOS |
| Software | MBA MLE Analysis | http://dx.doi.org/10.1111/2041-210X.12096 | NA | |
| Software | clampfit | https://moleculardevices.app.box.com/s/l8h8odzbdikalbje1iwj85x88004f588 | NA |
Additional files
-
Supplementary file 1
Summary of larvae tracked and the model fits.
The number of trials and number of larvae tracked per trial is given along with the move-step frequency distribution model fitting and model selection results for all trials across experimental treatments. The number of larvae paths in TP denotes the number of individual path best fits to a truncated Pareto (power law) distribution; E, the number best fitting an exponential distribution; and U is unclassified where there was no clear best fit to either model. Tracks discarded prior to model fitting were those where larvae collided, the arena edge was encountered, or there were <50 fitted movement steps. Maximum Likelihood Estimation (MLE) was used for parameter fitting (exponent, xmax) and Akaike’s Information Criteria weights (wAIC) used for model selection. For full description of procedures used see Methods.
- https://cdn.elifesciences.org/articles/50316/elife-50316-supp1-v3.xlsx
-
Supplementary file 2
Sensitivity analyses for Kalman filter parameters and minimum step resolution values.
(A) Kalman filter (KF) parameters and (B) minimum step resolution values were altered to determine the effects of such changes on the consistency of treatment µ values. The values used for the results presented in the main paper were Position and Velocity minimum variances of 0.5 and a covariance of 1.0 for the KF, and a minimum step resolution of 0.44. The sensitivity analysis for the KF parameters considered values that differed significantly from those used, bracketing the analysis values. As can be seen in (A), differences in the µ values were generally small, confirming that the values chosen for the KF did not alter the finding of truncated power-laws in larva tracks. Rather, the average µ values from all KF sensitivity tests are close to those found in the analysis. The minimum step resolution value chosen for the analysis (0.44) was determined from the tracking resolution and larval movements (head sways and peristaltic contractions) and represents the lowest value above the track noise. All computed move steps lower than this value were excluded from the analysis. For the sensitivity test, values of 0.3, 0.5, 0.7 and 0.9 were used as this range covered viable alternative values. As with the KF tests, the finding of truncated power-laws and the resultant µ values differed very little from those presented in the original analysis. We conclude that significant changes in parameters associated with video track processing had no important effects on our finding of truncated power-laws in larva movement paths and the resultant µ values.
- https://cdn.elifesciences.org/articles/50316/elife-50316-supp2-v3.docx
-
Supplementary file 3
Summary of results for truncated Pareto model fits compared to exponential model distributions.
Full MLE results of truncated power law fits to larvae move step-length frequency distributions across trials and experimental treatments.
- https://cdn.elifesciences.org/articles/50316/elife-50316-supp3-v3.xlsx
-
Supplementary file 4
Summary of results for truncated Pareto model fits compared to other model distributions.
Model selection using Akaike’s Information Criteria weights (wAIC) from comparison of the log likelihoods (LLH). For full description of procedures see Materials and methods. TP, truncated Pareto distribution fit to larva move-step frequency distribution; P, power law; E, exponential; TE, truncated exponential; LN, log-normal; G, gamma distribution. Values in model columns denote best fit based on wAIC. Note the high number of larva best fit by TP model distributions when compared with other models.
- https://cdn.elifesciences.org/articles/50316/elife-50316-supp4-v3.xlsx
-
Supplementary file 5
Tests for stationarity in the larva movement pattern data within treatments.
Larva tracks with fitted move steps were separated at the midpoint and those for which each half was best fitted by a truncated power-law were retained for analysis. The average µ values for the first and second half of all tracks across trials within a treatment were compared to determine any significant differences, which would indicate changes in track statistics over time (i.e. non-stationarity). We found no significant differences between the first and second halves of the tracks and with no clear trend of increasing or decreasing µ values, as might be expected to occur if µ showed significant temporal dependence on changing satiety or other factors over the 1 hr trial period.
- https://cdn.elifesciences.org/articles/50316/elife-50316-supp5-v3.docx
-
Supplementary file 6
Summary of model comparisons.
Model comparisons for each larva path across trials and experimental treatments is given (wAIC) for the truncated Pareto (TP), exponential (Exp), power-law (P) and composite Brownian (CB) model distributions with proportions of two (CB2), three (CB3) and four exponentials (CB4). Bold wAIC values denote best fit. Note the high number of larva best fit by TP model distributions when compared with other models.
- https://cdn.elifesciences.org/articles/50316/elife-50316-supp6-v3.xlsx
-
Supplementary file 7
Video frame frequency test.
Ten shits/+ larvae at 33°C were tracked with a video frame capture rate set at 15 frames per second (fps; Hz). These data were then subsampled to 7.5, 5 and 3 Hz to test whether video frame frequency affected estimation of the μ exponent following MLE analysis and model selection. A Kruskal-Wallis test showed no differences between medians of truncated power law μ exponents across the four different frequencies (H(3)=3.9, p=0.271) indicating video frame rate did not contribute significantly to determination of μ exponent values.
- https://cdn.elifesciences.org/articles/50316/elife-50316-supp7-v3.xlsx
-
Transparent reporting form
- https://cdn.elifesciences.org/articles/50316/elife-50316-transrepform-v3.docx
Download links
A two-part list of links to download the article, or parts of the article, in various formats.
Downloads (link to download the article as PDF)
Open citations (links to open the citations from this article in various online reference manager services)
Cite this article (links to download the citations from this article in formats compatible with various reference manager tools)
Optimal searching behaviour generated intrinsically by the central pattern generator for locomotion
eLife 8:e50316.
https://doi.org/10.7554/eLife.50316


