Disruption of entire Cables2 locus leads to embryonic lethality by diminished Rps21 gene expression and enhanced p53 pathway
- Laboratory Animal Resource Center, Faculty of Medicine, University of Tsukuba, Japan
- Ph.D. Program in Human Biology, School of Integrative and Global Majors (SIGMA), University of Tsukuba, Japan
- Department of Traditional Medicine, University of Medicine and Pharmacy, Viet Nam
- Transborder Medical Research Center, Faculty of Medicine, University of Tsukuba, Japan
- International Institute for Integrative Sleep Medicine (WPI-IIIS), University of Tsukuba, Japan
- Experimental Animal Division, RIKEN BioResource Research Center, Japan
- Doctor’s Program in Biomedical Sciences, Graduate School of Comprehensive Human Science, University of Tsukuba, Japan
- Department of Genome Biology, Faculty of Medicine, University of Tsukuba, Japan
- Department of Stem Cells and Human Disease Models, Research Center for Animal Life Science, Shiga University of Medical Science, Japan
- Institute for the Advanced Study of Human Biology (WPI-ASHBi), Kyoto University, Japan
- Life Science Center for Survival Dynamics, Tsukuba Advanced Research Alliance (TARA), University of Tsukuba, Japan
- Division of Complex Bioscience Research, Department of Research and Development, Institute of National Medicine, University of Toyama, Japan
- Department of Experimental Pathology, Faculty of. Medicine, University of Tsukuba, Japan
- MRC Centre for Regenerative Medicine, School of Biological Sciences, SCRM Building, The University of Edinburgh, United Kingdom
- John Curtin School of Medical Research, The Australian National University, Australia
Figures
Figure 1
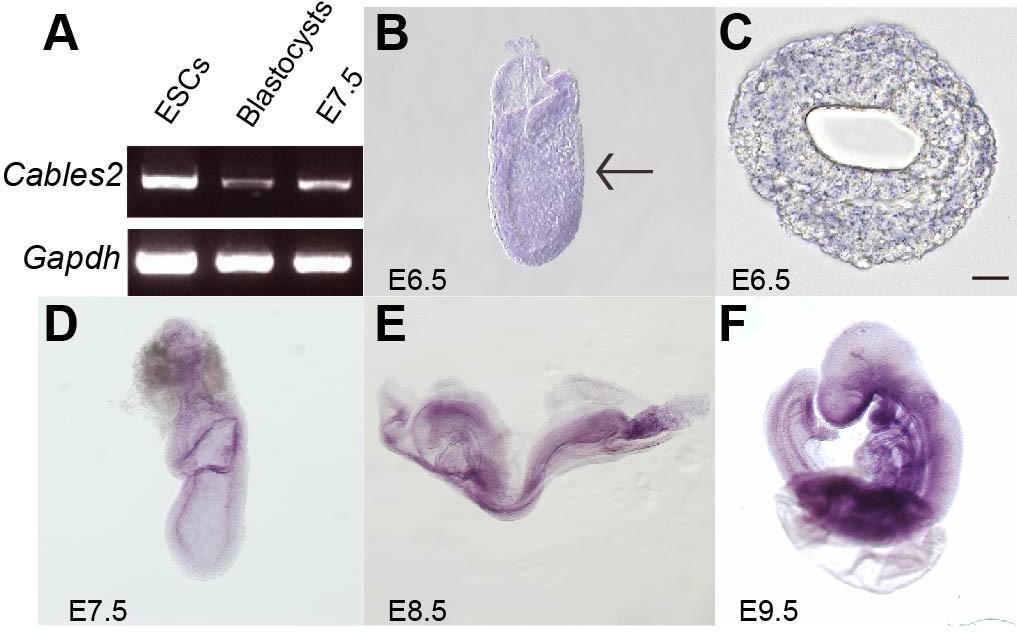
Cables2 expression during early mouse embryo development.
(A) Cables2 gene expression was examined by RT-PCR with ESCs, blastocyst, and E7.5 embryo samples. Gapdh was used as an internal positive control. (B–F) Wild-type embryos from E6.5 to E9.5 were examined by in situ hybridization with a Cables2 probe. The whole embryo expressed Cables2 at E6.5 (B). The black arrow indicates the position of the transverse section shown in (C). Scale bars, 20 μm.
Figure 2 with 1 supplement
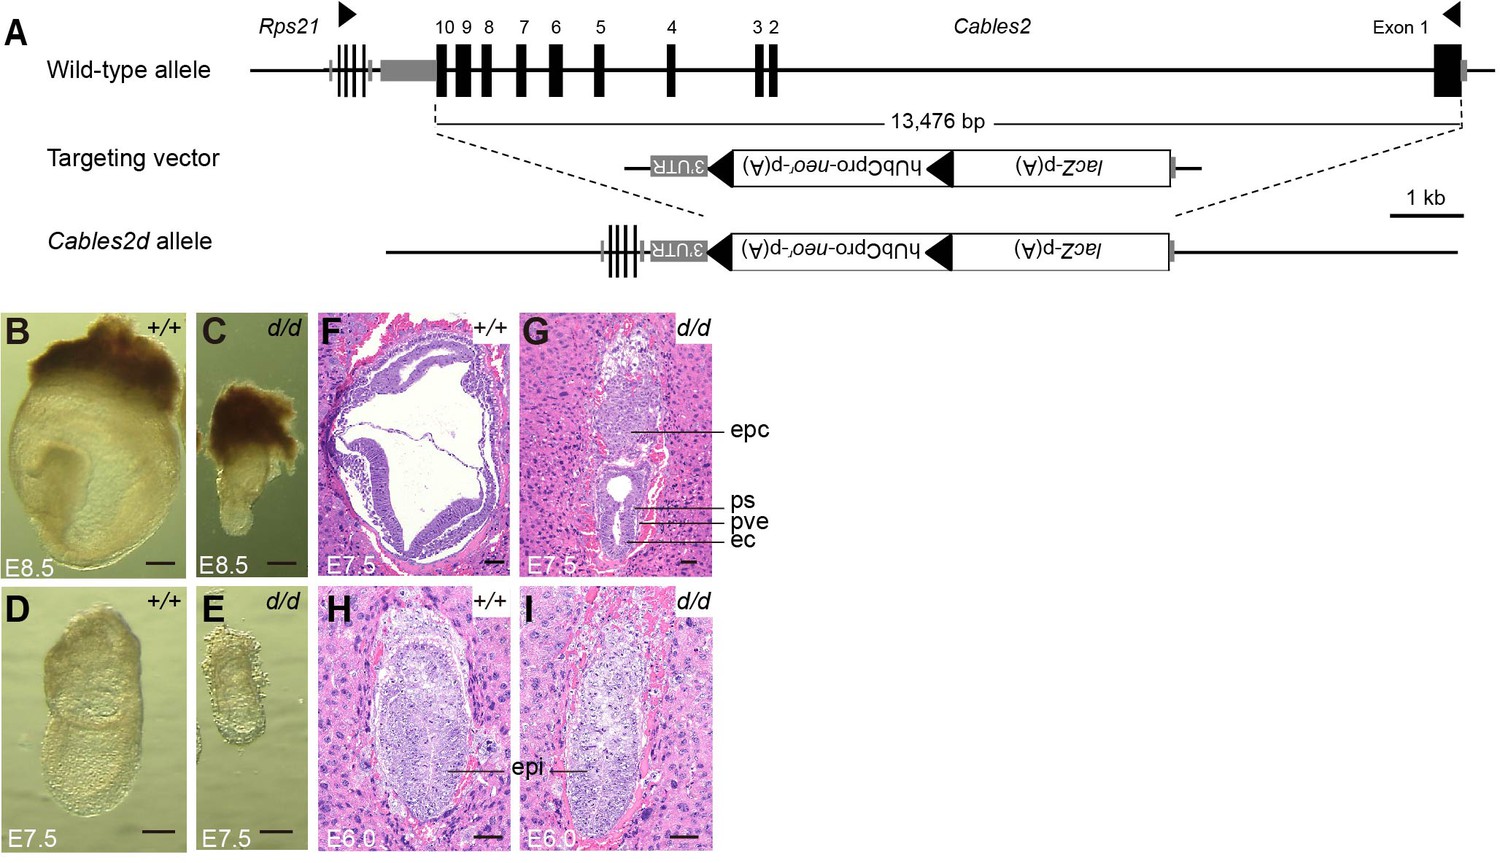
Morphological and histological analyses of Cables2d embryos at early stages of development.
(A) Following VelociGene’s KOMP design, the entire protein coding sequence of the target gene was deleted by homologous recombination in C57BL/6N ESCs, therefore, the full Cables2 allele was null (Cables2d allele). Embryos were collected and genotyped at E8.5 (B, C) and E7.5 (D, E). Histological analysis was on HE-stained sections. Wild-type and Cables2d mutant embryos were embedded in paraffin and stained at E7.5 (F, G) and E6.0 (H, I). Epc: ectoplacental cone, ps: primitive streak; pve: posterior visceral endoderm; ec: ectoderm; epi: epiblast. Scale bars, 100 μm (B–E), 50 μm (F–I).
Figure 2—figure supplement 1
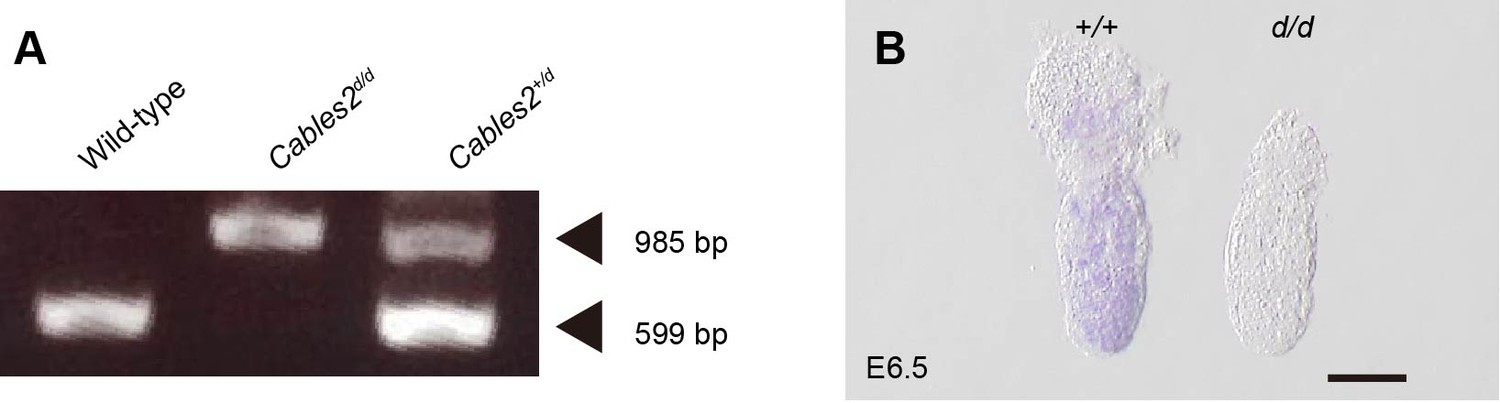
Genotyping of Cables2d and expression of wild-type Cables2.
(A) Genotyping by PCR analysis from whole embryo samples using three primers. Bands at 985 bp and 599 bp represent mutant and wild-type Cables2d alleles, respectively. (B) At E6.5, Cables2 was expressed widely in both extra- and embryonic parts in wild-type (left), in comparison with homozygous mutants (right). Antisense Cables2 probe was used for WISH to confirm that Cables2d embryos lacked expression. Scale bar, 100 μm.
Figure 3
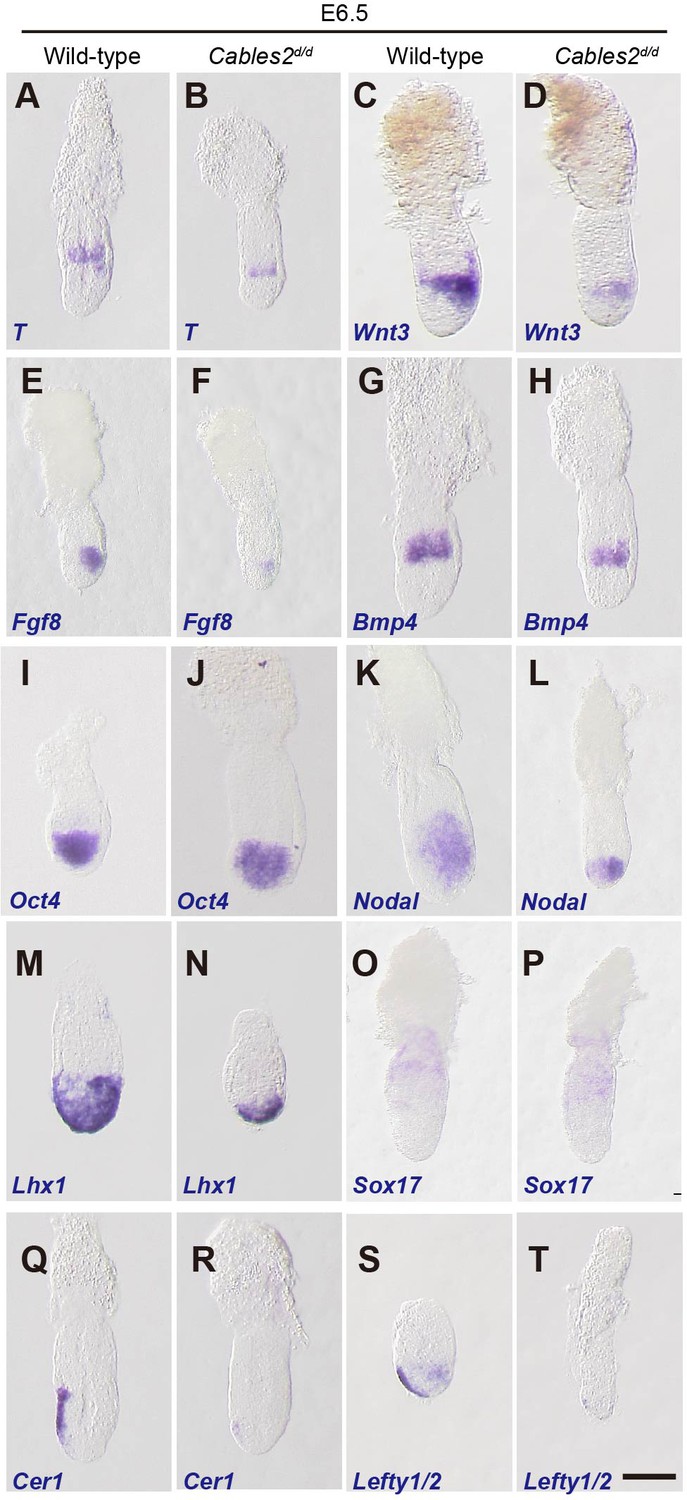
Expression of gastrulation markers in Cables2d embryos.
(A–T) All embryos were collected, genotyped, and used for WISH at E6.5. Several key gastrulation markers were examined using both wild-type and Cables2d embryos: T (n = 5), Wnt3 (n = 5), Fgf8 (n = 3), Bmp4 (n = 3), Oct4 (n = 4), Nodal (n = 4), Lhx1 (n = 3), Sox17 (n = 3), Cer1 (n = 3), and Lefty1/2 (n = 3). Scale bars, 100 μm.
Figure 4 with 1 supplement
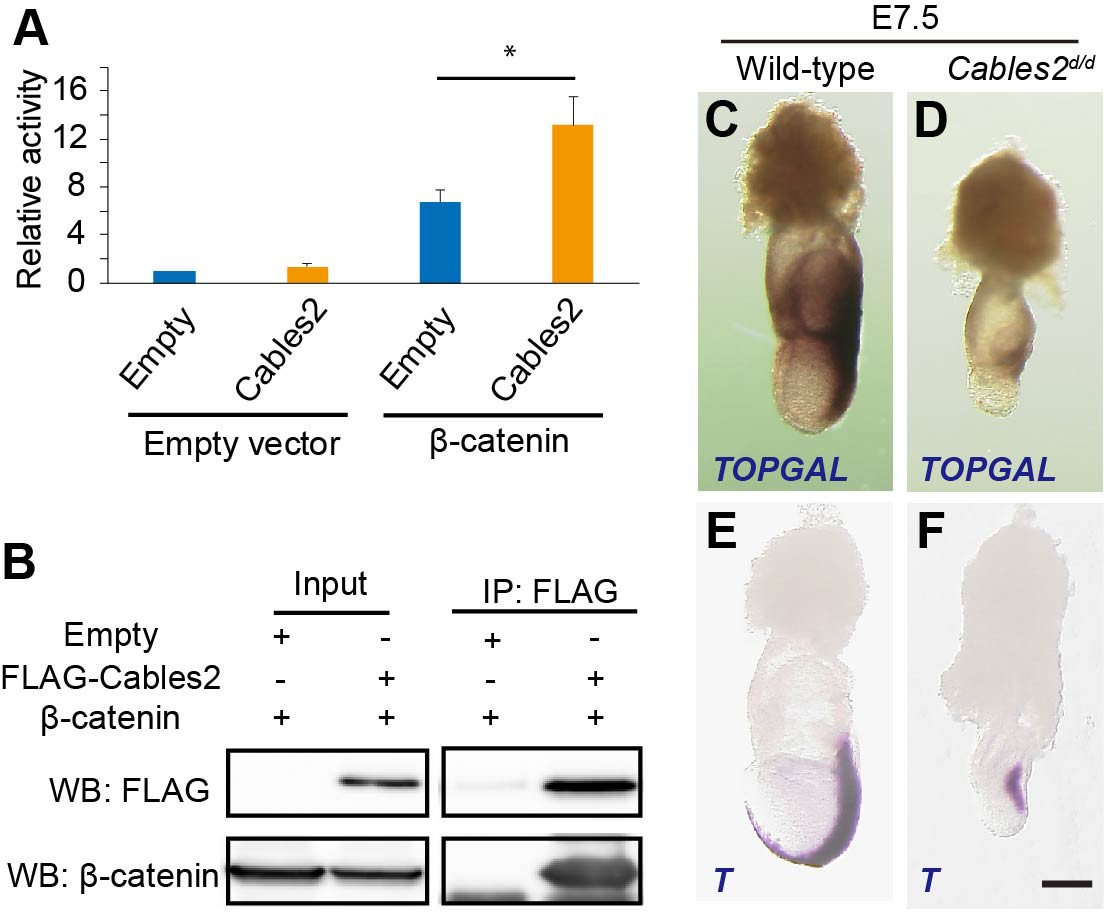
Enhancement of β-catenin activity by Cables2.
(A) Relative luciferase activities in 293T cells transfected with an empty control or Cables2 expression vectors together with an empty control or β-catenin expression vectors. Relative luciferase activity is expressed as the ratio of TOP/FOPflash reporter activity relative to the activity in cells transfected with an empty vector alone. Columns: Averages of at least three independent experiments performed in triplicate. Error bars, Standard deviation (SD). Statistical significance was determined using Student’s t test (*, p<0.05). (B) Co-IP was performed with FLAG-Cables2 and β-catenin expression vectors. The results obtained using anti-FLAG and anti-β-catenin antibodies showed the appearance of β-catenin in the precipitated complexes with Cables2. (C, D) β-Galactosidase staining demonstrating the restricted activation of Wnt/β-catenin signaling in Cables2d homozygous embryo carrying the TOPGAL reporter (n = 6). (E, F) WISH analysis showing the expression of T in wild-type and Cables2d embryos at E7.5 (n = 5). Scale bars, 100 μm.
Figure 4—figure supplement 1
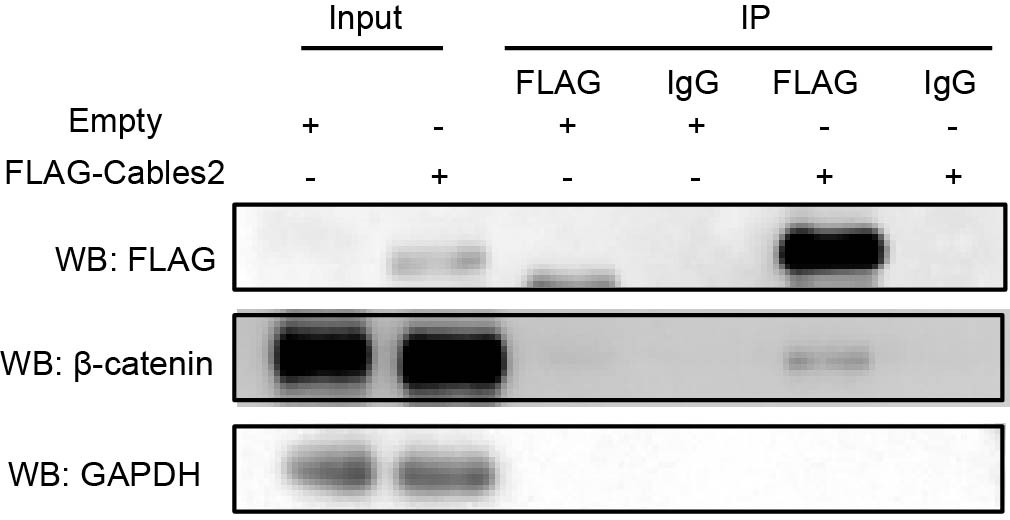
Interaction of Cables2 with endogenous β-catenin in 293T cells.
Co-IP showing the physical interaction of FLAG-Cables2 with endogenous β-catenin in 293T cells. Anti-GAPDH antibody was used as a negative control for evaluating specific interaction. Each experiments were repeated at least twice and reliably reproduced.
Figure 5
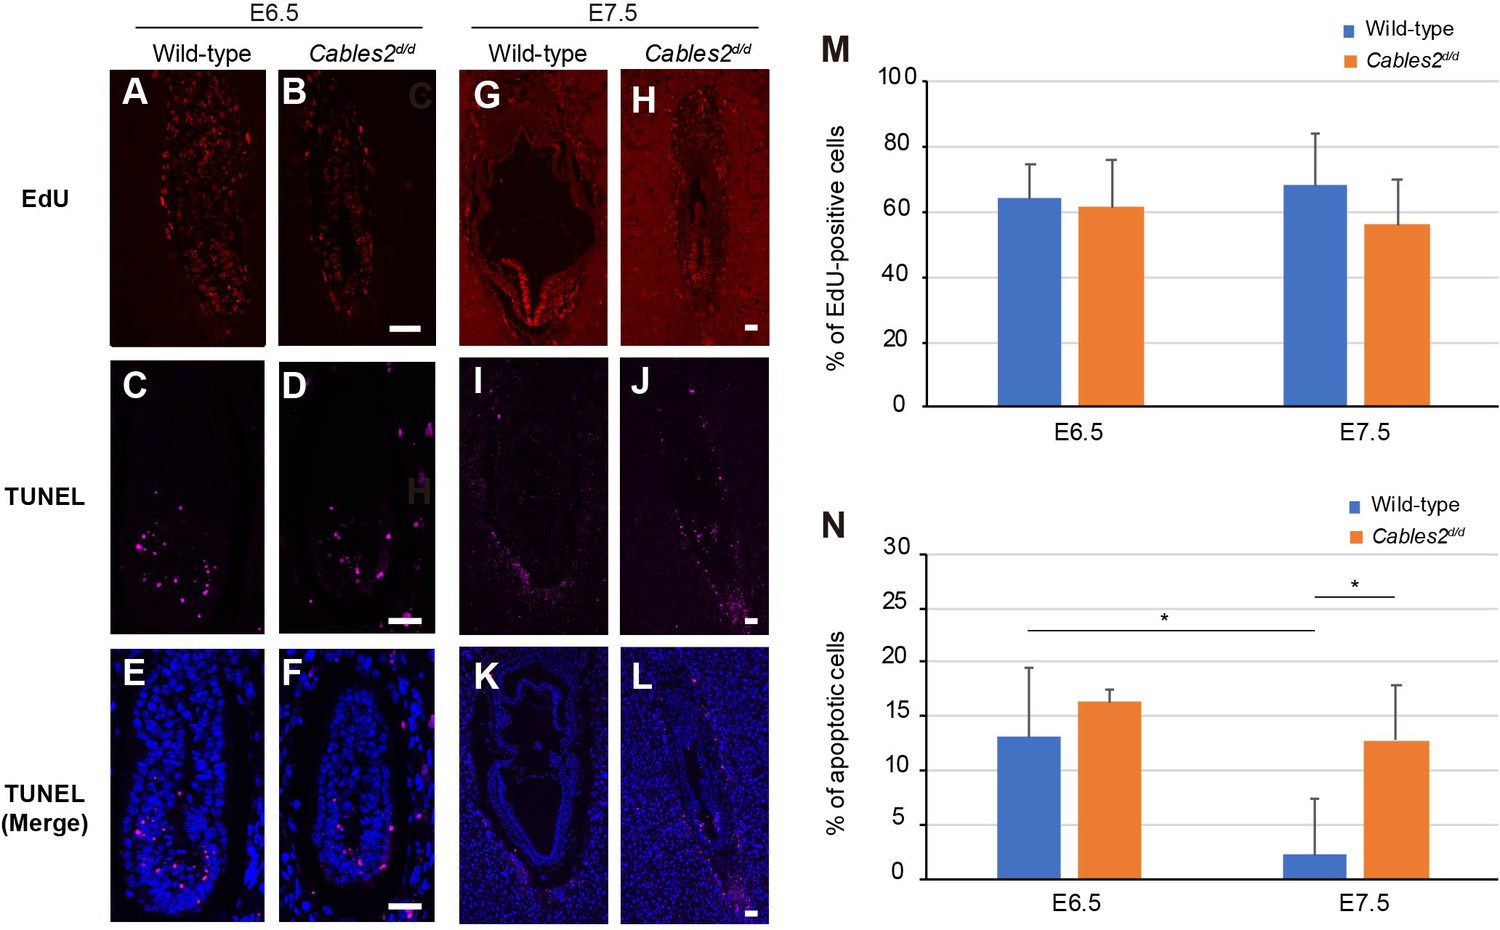
Proliferating and apoptotic cells in Cables2d embryos.
(A–B) The EdU-incorporating cells represented the proliferation of cells in both wild-type and Cables2d/d embryos at E6.5 (n = 6). (C–F) Apoptotic cells were detected in both embryonic and extraembryonic parts of wild-type and Cables2d/d embryos (n = 6). (G–N) The proliferative and apoptotic cells at E7.5 were examined and showed the percentage in both wild-type and Cables2d/d embryos (M, N). The average percentage was calculated by number of counted cells normalized to total number of cells within the embryo. Statistical significance was determined using two-way ANOVA (*, p<0.05). Error bars, Standard deviation (SD). Scale bars, 50 μm.
Figure 6
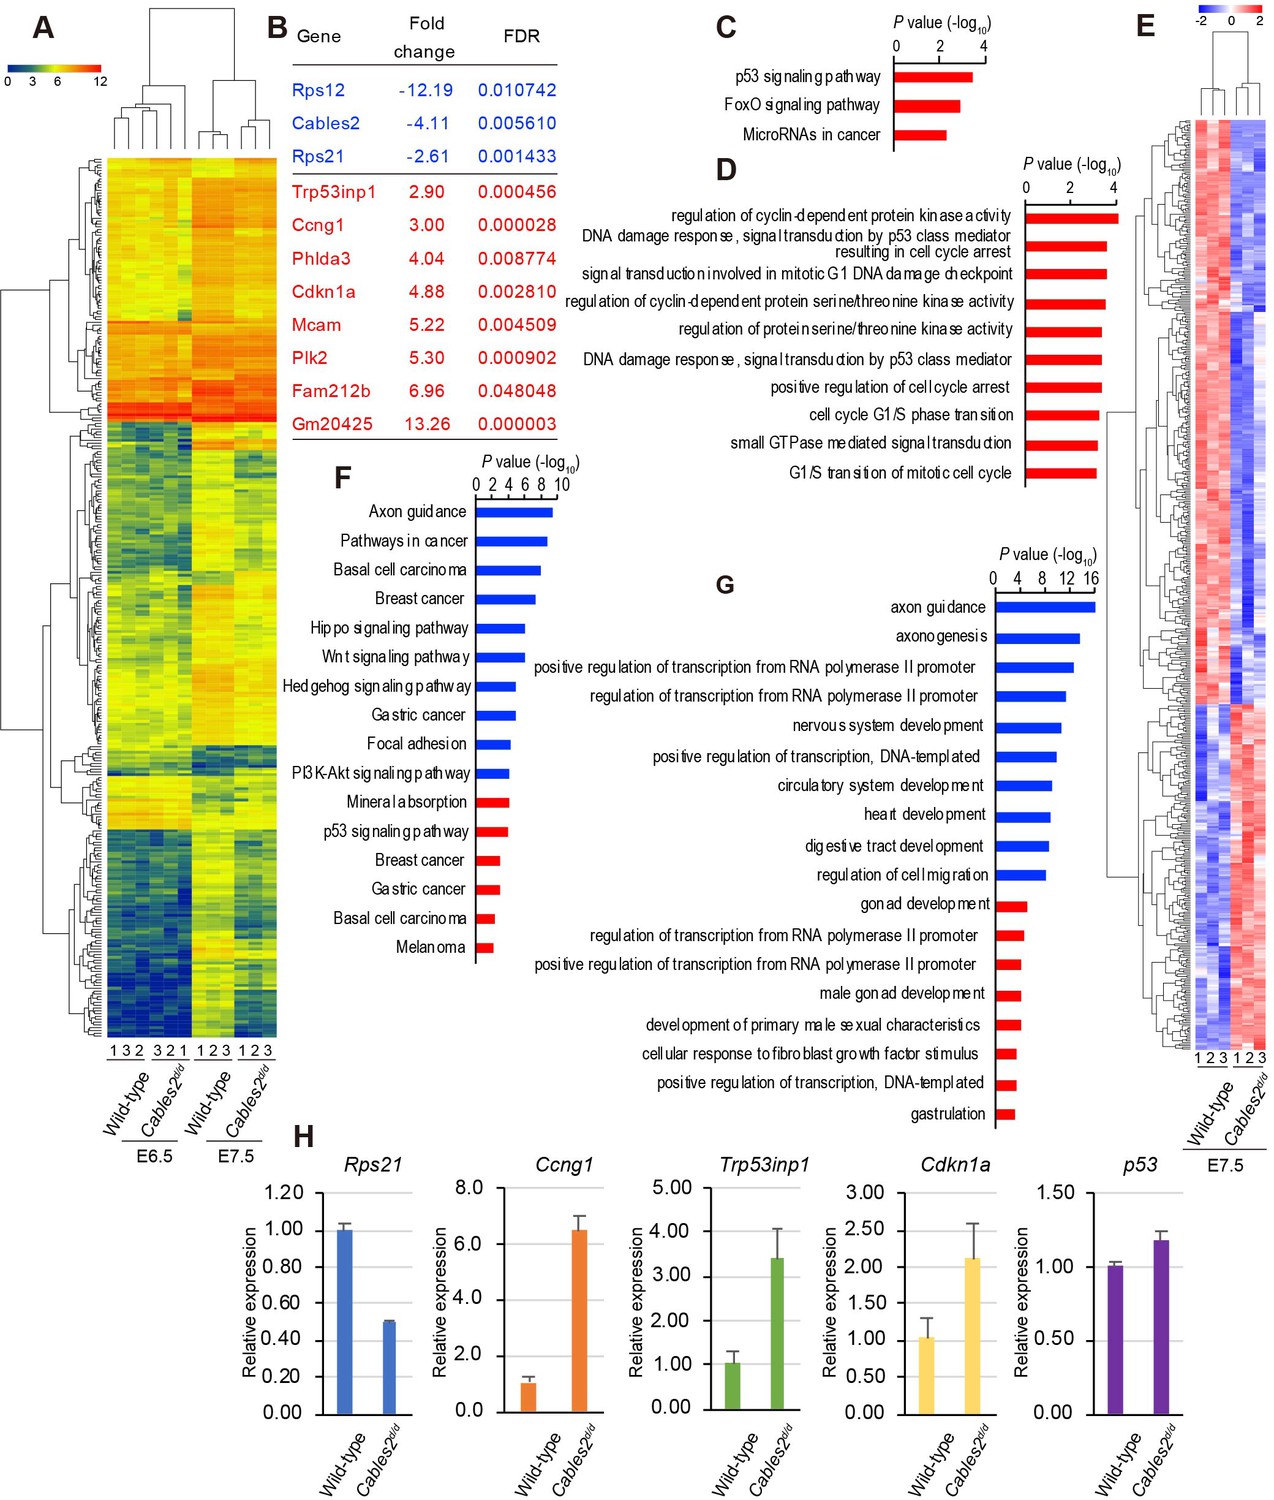
Transcriptome profiling analysis of Cables2d/d embryos.
(A) Heatmap representation of 288 genes significantly different between wild-type and Cables2d/d embryo samples (fold change >= 2, FDR < 0.05). (B) List of all downregulated (blue) and upregulated (red) genes expressing in Cables2d embryos at E6.5. (C) KEGG pathway (p<0.01) and (D) GO Biological process (p<0.001) were identified among up-regulated genes at E6.5. (E) Heatmap (Z score) for the expression of 350 downregulated and 207 upregulated genes in Cables2d/d embryos at E7.5. Different expression genes at E7.5 enriched in KEGG pathway (F) and GO Biological process (G) (p<0.001) with downregulation in blue bars and upregulation in red bars. (H) RT-qPCR validated the expression levels of representative upregulation genes at E6.5 using Cables2d/d embryos E7.5 (n = 5). Averages of three independent experiments performed in duplicated and normalized against the expression levels of Gapdh. Error bars, Standard deviation (SD).
Figure 7 with 1 supplement

Gene construction and expression in Cables2e1 mutant mouse.
(A) The Cables2e1 mice was generated using CRISPR/Cas9 system. Blue marks indicate the target sites on the left and right of exon1 of Cables2. (B) RT-qPCR using adult brain samples showed the quantitation of Cables2 expression in wild-type, heterozygous Cables2+/d and homozygous Cables2e1/e1 mice. The expression levels were validated in different exons of Cables2. Averages of three independent experiments performed in duplicated and normalized against the expression levels of Gapdh. Error bars, Standard deviation (SD).
Figure 7—figure supplement 1
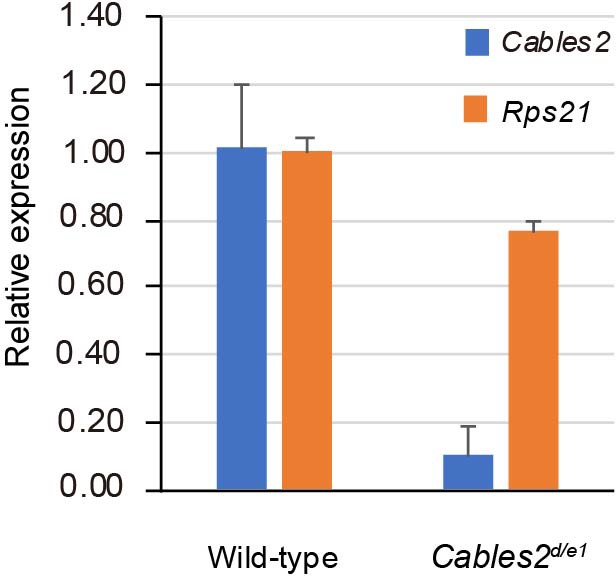
Expression of compound embryos from Cables2d and Cables2e1 intercrossing.
Expression levels of Cables2 and Rps21 in compound mutant Cables2d/e1 embryo at E9.5. Averages of three independent experiments performed in duplicated and normalized against the expression levels of Gapdh. Error bars, Standard deviation (SD).
Figure 8

Gene construction of Rps21d and Rps21-indel mutant mice.
Rps21d and Rps21-indel mutant mice were generated using CRISPR/Cas9 system. One-cut target site was designed to induce the mutation in Rps21-indel. Left and right target sites were introduce (red marks) to delete exon 2 to exon 6 of Rps21 in Rps21d mouse. Schematic showed the full-length of Rps21 including six exons and abutting to 3’UTR of Cables2 gene.
Figure 9
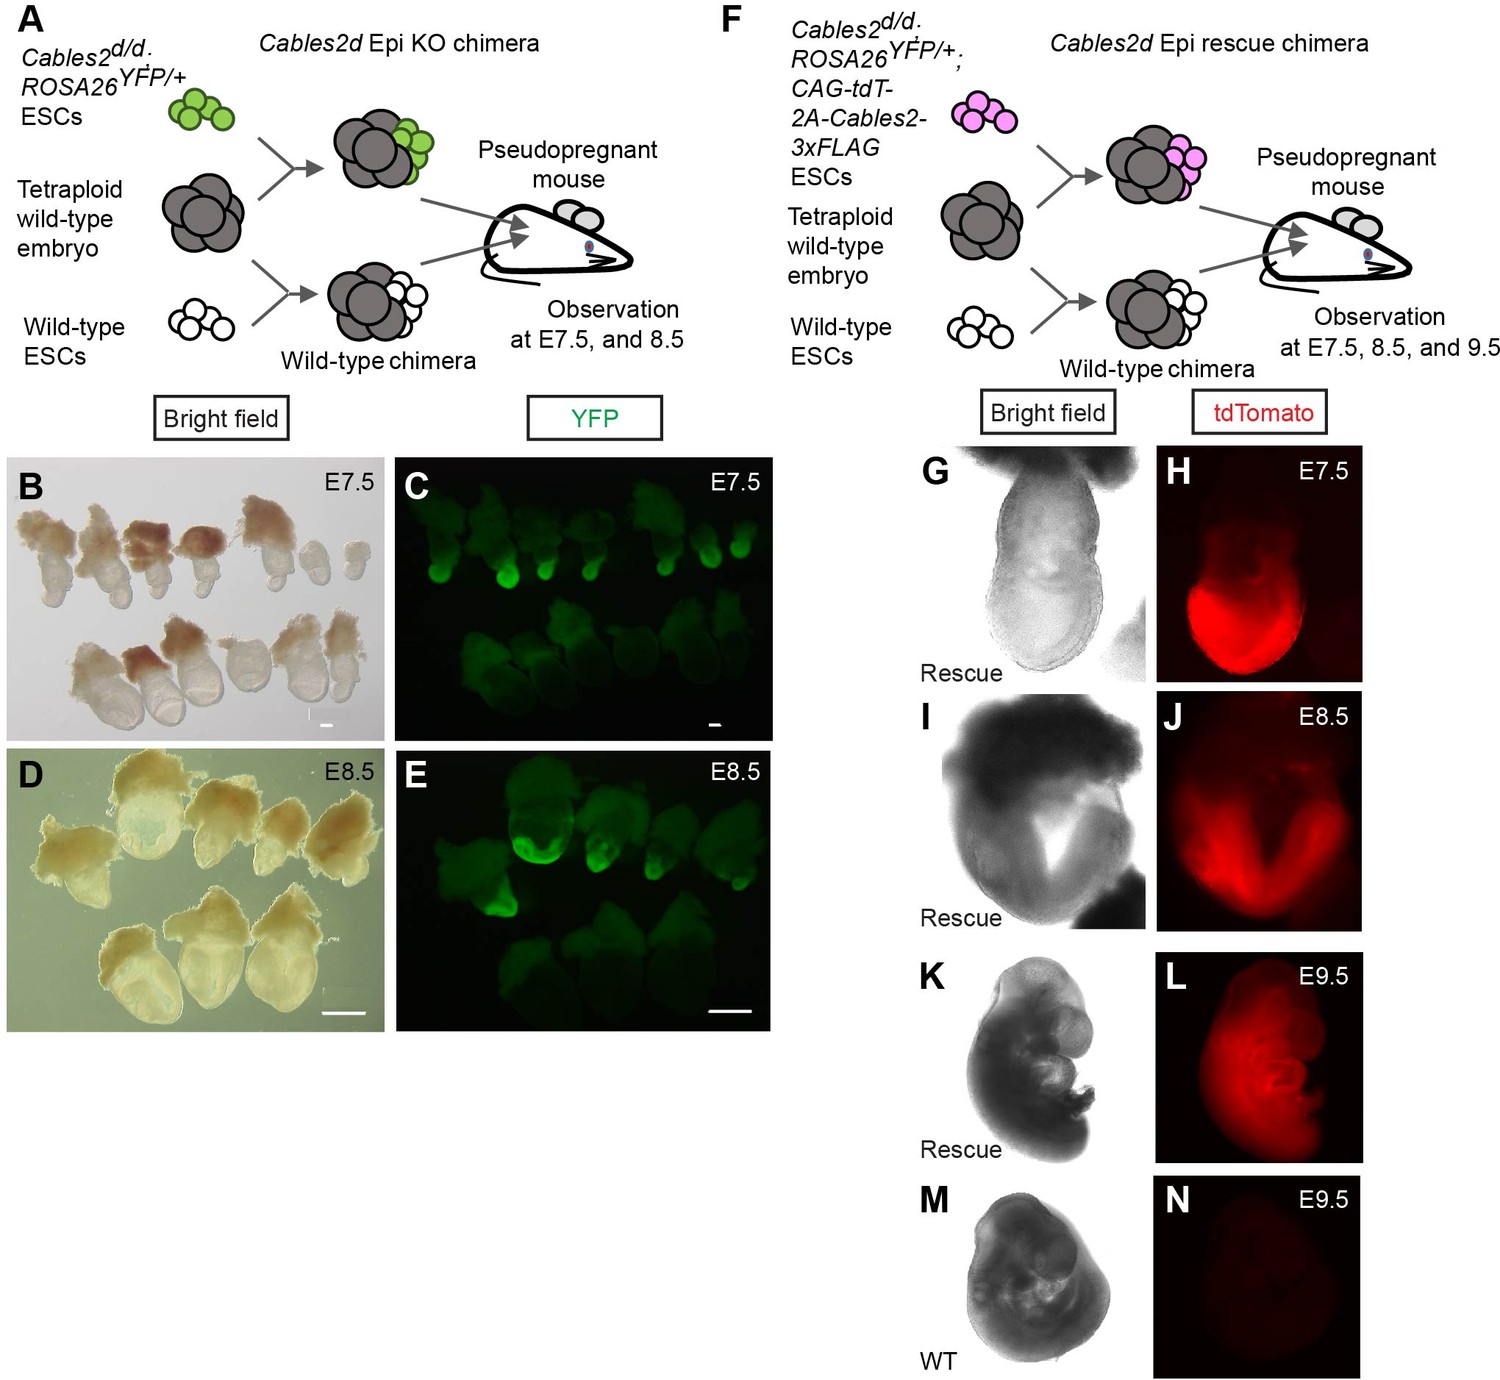
Defective and normal gastrulation development in Cables2d Epi KO and Cables2d Epi rescue chimeras, respectively.
(A) Schematic diagram of tetraploid complementation experiment for Cables2d Epi KO chimera. (B–E) Bright field (B, D) and YFP fluorescent (C, E) images of wild-type and Cables2d Epi KO chimeric embryos at E7.5 or E8.5. (F) Schematic diagram of tetraploid complementation experiment for Cables2d Epi rescue chimeras. Bright field (G, I, K, M) and tdTomato fluorescent (H, J, L, N) images of wild-type and Cables2d Epi rescue chimeric embryos at E7.5, E8.5, or E9.5. The Cables2d Epi rescue chimeric embryos developed normally until E9.5. Scale bars, 100 μm (B, C); 500 μm (D, E).
Tables
Table 1
Survival rate and Mendelian ratio of Cables2-mutant embryos.
| Embryonic days (E) | Total number of embryos | Genotypes | ||
|---|---|---|---|---|
| +/+ | +/- | -/- | ||
| E6.5 | 437 | 132 (30.2)* | 221 (50.6) | 80 (18.3) |
| E7.5 | 70 | 18 (25.7) | 32 (45.7) | 20† (28.6) |
| E8.5 | 21 | 9 (42.9) | 9 (42.9) | 3† (14.3) |
| E9.5 | 18 | 7 (38.9) | 7 (38.9) | 4† (22.2) |
| E12.5 | 6 | 2 (33.3) | 4 (66.7) | 0 (0) |
| Adult | 90 | 24 (26.7) | 66 (73.3) | 0 (0) |
-
* Number of embryos (percentage), † Abnormal phenotype.
Table 2
Generation of Rps21 mutant mice.
| Strain | Electroporated embryos | Transfer embryos | Total number of mice | ||
|---|---|---|---|---|---|
| Newborn | Founder | ||||
| Male | Female | ||||
| Rps21d | 207 | 199 | 38 | 7 | 4 |
| Rps21-indel | 274 | 200 | 0* | - | - |
-
* At E16.5, there were eight implanted sites.
Table 3
Phenotypes in Cables2d Epi KO and Cables2d Epi rescue chimeras.
| Tetraploid embryo + Cables2d/d; ROSA26YFP/+ ESC (Epi KO chimera) | Wild-type chimera | |||||
|---|---|---|---|---|---|---|
| Embryonic days (E) | Total number of embryos | Phenotype | Total number of embryos | Phenotype | ||
| Normal | Abnormal | Normal | Abnormal | |||
| E6.5 | 2 | 1 | 1 | 4 | 3 | 1 |
| E7.5 | 15 | 4 | 11 | 14 | 11 | 3 |
| E8.5 | 13 | 0 | 13* | 7 | 6 | 1 |
| Tetraploid embryo + Cables2d/d; ROSA26YFP/+; CAG-tdTomato-2A-Cables2-3xFLAG ESC (Epi rescue chimera) | Wild-type chimera | |||||
| Embryonic days (E) | Total number of embryos | Phenotype | Total number of embryos | Phenotype | ||
| Normal | Abnormal | Normal | Abnormal | |||
| E7.5 | 5 | 4 | 1 | 2 | 1 | 1 |
| E8.5 | 4 | 3 | 1 | 5 | 4 | 1 |
| E9.5 | 2 | 2 | 0 | 3 | 2 | 1 |
-
* All embryos had A-P axis specification.
Key resources table
| Reagent type (species) or resource | Designation | Source or reference | Identifiers | Additional information |
|---|---|---|---|---|
| Gene (M. musculus) | Cables2 | PMID:11955625 | MGI:2182335 | |
| Gene (M. musculus) | Rps21 | PMID:10022917 | MGI:1913731 | |
| Strain, strain background (M. musculus) | B6.Cg-Tg(TOPGAL) | Riken BRC | RBRC05918 | |
| Cell line (M. musculus) | Cables2tm1(KOMP)Vlcg | KOMP | ID: VG16085, clone: 16085A-D3 RRID:MMRRC_052978-UCD | ESC line |
| Cell line (Homo-sapiens) | 293T | ATCC | CRL-3216 RRID:CVCL_0063 | embryonic kidney |
| Antibody | Anti-FLAG (M2) (mouse monoclonal) | Sigma-Aldrich | Cat# F1804, RRID:AB_262044 | WB(1:1000), IP (1:650) |
| Antibody | Anti-β-catenin (D10A8) (rabbit monoclonal) | Cell Signaling Technology | Cat# 8480, RRID:AB_11127855 | WB(1:1000) |
| Antibody | Anti-GAPDH (rabbit polyclonal) | Santa Cruz Biotechnology | Cat# sc-25778, RRID:AB_10167668 | WB(1:1000) |
| Antibody | Normal mouse IgG (mouse isotype control) | Santa Cruz Biotechnology | Cat# sc-2025, RRID:AB_737182 | IP(1:250) |
| Antibody | Anti-Mouse IgG-HRP (secondary antibody) | GE healthcare | Cat# NA931, RRID:AB_772210 | WB(5000) |
| Antibody | Anti-Rabbit IgG-HRP (secondary antibody) | GE healthcare | Cat# NA934, RRID:AB_772206 | WB(5000) |
| Peptide, recombinant protein | TrueCut Cas9 Protein | Thermo Fisher Scientific | Cat# A36498 | |
| Peptide, recombinant protein | Dynabeads Protein G | Thermo Fisher Scientific | Cat# 10003D | |
| Commercial assay or kit | GeneArt Precision gRNA Systhesis Kit | Thermo Fisher Scientific | Cat# A29377 | |
| Commercial assay or kit | Lipofectamine 3000 Reagent | Thermo Fisher Scientific | Cat# L3000015 | |
| Commercial assay or kit | AmpliTag Gold 360 Master Mix | Thermo Fisher Scientific | Cat# 4398886 | |
| Commercial assay or kit | RNeasy Mini Kit | Qiagen | Cat# 74104 | |
| Commercial assay or kit | TB Green Premix Ex Taq II | Takara | Cat# RR820B | |
| Commercial assay or kit | Dual-Glo Luciferase assay system | Promega | Cat# E2920 | |
| Commercial assay or kit | Click-iT Plus EdU Imaging Kit | Thermo Fisher Scientific | Cat# C10638 | |
| Commercial assay or kit | Click-iT Plus TUNEL Assay for In situ Apoptosis Detection kit | Thermo Fisher Scientific | Cat# C10619 | |
| Software | CLC Genomics Workbench | Qiagen | RRID:SCR_011853 |
Additional files
-
Supplementary file 1
Differential gene expression in wild-type and Cables2d embryos.
Statistical significance was determined using ANOVA test (FDR < 0.05). This gene list is related to heatmap in Figure 6A.
- https://cdn.elifesciences.org/articles/50346/elife-50346-supp1-v1.xlsx
-
Supplementary file 2
Differential gene expression in wild-type and Cables2d embryos at E6.5 and KEGG pathway, GO term enrichments in upregulated genes.
Statistical significance was determined using EDGE test (FDR < 0.05). This gene list is related to Figure 6B–D.
- https://cdn.elifesciences.org/articles/50346/elife-50346-supp2-v1.xlsx
-
Supplementary file 3
Differential gene expression in wild-type and Cables2d embryos at E7.5 and KEGG pathway, GO term enrichments.
Statistical significance was determined using EDGE test (FDR < 0.05). This gene list is related to Figure 6E–G.
- https://cdn.elifesciences.org/articles/50346/elife-50346-supp3-v1.xlsx
-
Supplementary file 4
CRISPR target sites for gene-modified mice generation.
- https://cdn.elifesciences.org/articles/50346/elife-50346-supp4-v1.xlsx
-
Supplementary file 5
Primers for genotyping, RT-PCR and RT-qPCR.
- https://cdn.elifesciences.org/articles/50346/elife-50346-supp5-v1.xlsx
-
Supplementary file 6
Mendelian ratio of Cables2d and Cables2e1 intercross at E9.5.
- https://cdn.elifesciences.org/articles/50346/elife-50346-supp6-v1.xlsx
Download links
A two-part list of links to download the article, or parts of the article, in various formats.
Downloads (link to download the article as PDF)
Open citations (links to open the citations from this article in various online reference manager services)
Cite this article (links to download the citations from this article in formats compatible with various reference manager tools)
Disruption of entire Cables2 locus leads to embryonic lethality by diminished Rps21 gene expression and enhanced p53 pathway
eLife 10:e50346.
https://doi.org/10.7554/eLife.50346


