Temporal cascade of frontal, motor and muscle processes underlying human action-stopping
- Department of Psychology, University of California, United States
Figures
Figure 1 with 1 supplement
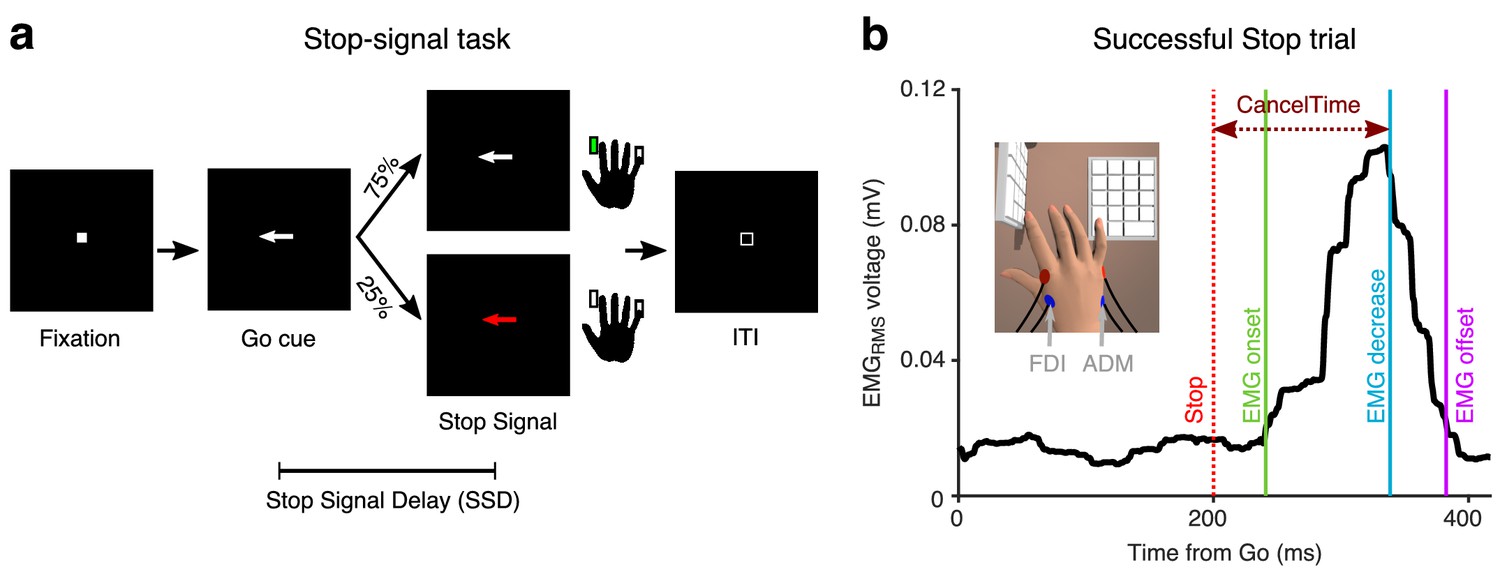
Behavioral task and EMG recording.
(a) Stop-signal task. (b) EMGRMS on a Successful Stop trial (Partial EMG) in an exemplar participant. Data are aligned to the Go cue. CancelTime refers to the time from the Stop signal (dotted red line) to when the EMGRMS starts decreasing (blue line). The green and purple line represent the detected onset and offset of the EMG response. (Inset) Recording set-up with a vertical and a horizontal keypad to record keypresses from the FDI and ADM muscles.
Figure 1—figure supplement 1
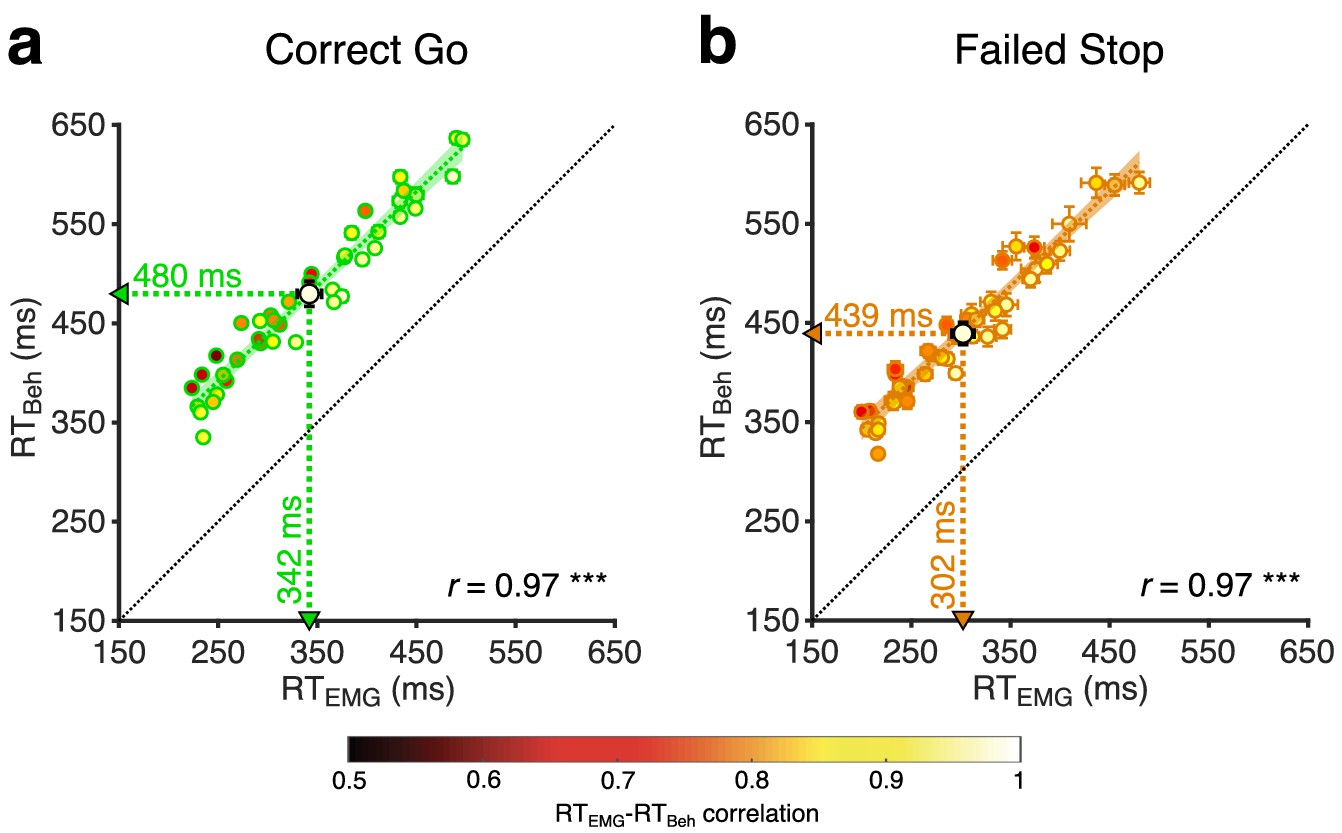
EMG responses in study 1 and 2.
(a) RTEMG-RTBeh correlation in the Correct Go trials. Each small dot represents the mean in a participant, color coded by the RTEMG-RTBeh correlation in that participant, while the cross-hairs represent the s.e.m. in that participant. The large dot and cross-hairs represent the mean and s.e.m. across all the participants, again color coded by the mean RTEMG-RTBeh correlation (r = 0.97, p<0.001, BF10 >100; RTEMG = 342 ± 13 ms, RTBeh = 480 ± 12 ms) across all participants. The linear regression fit and its 95% confidence interval is shown as a green line and shaded region respectively. The unity line is represented as a black dotted line. (b) Same as (a) but for the Failed Stop trials (r = 0.97, p<0.001, BF10 >100; RTEMG = 302 ± 11 ms, RTBeh = 439 ± 11 ms).
-
Figure 1—figure supplement 1—source data 1
Mean RTEMG and RTBeh in the Correct Go and Failed Stop trials for study 1 and 2.
- https://cdn.elifesciences.org/articles/50371/elife-50371-fig1-figsupp1-data1-v2.xlsx
Figure 2
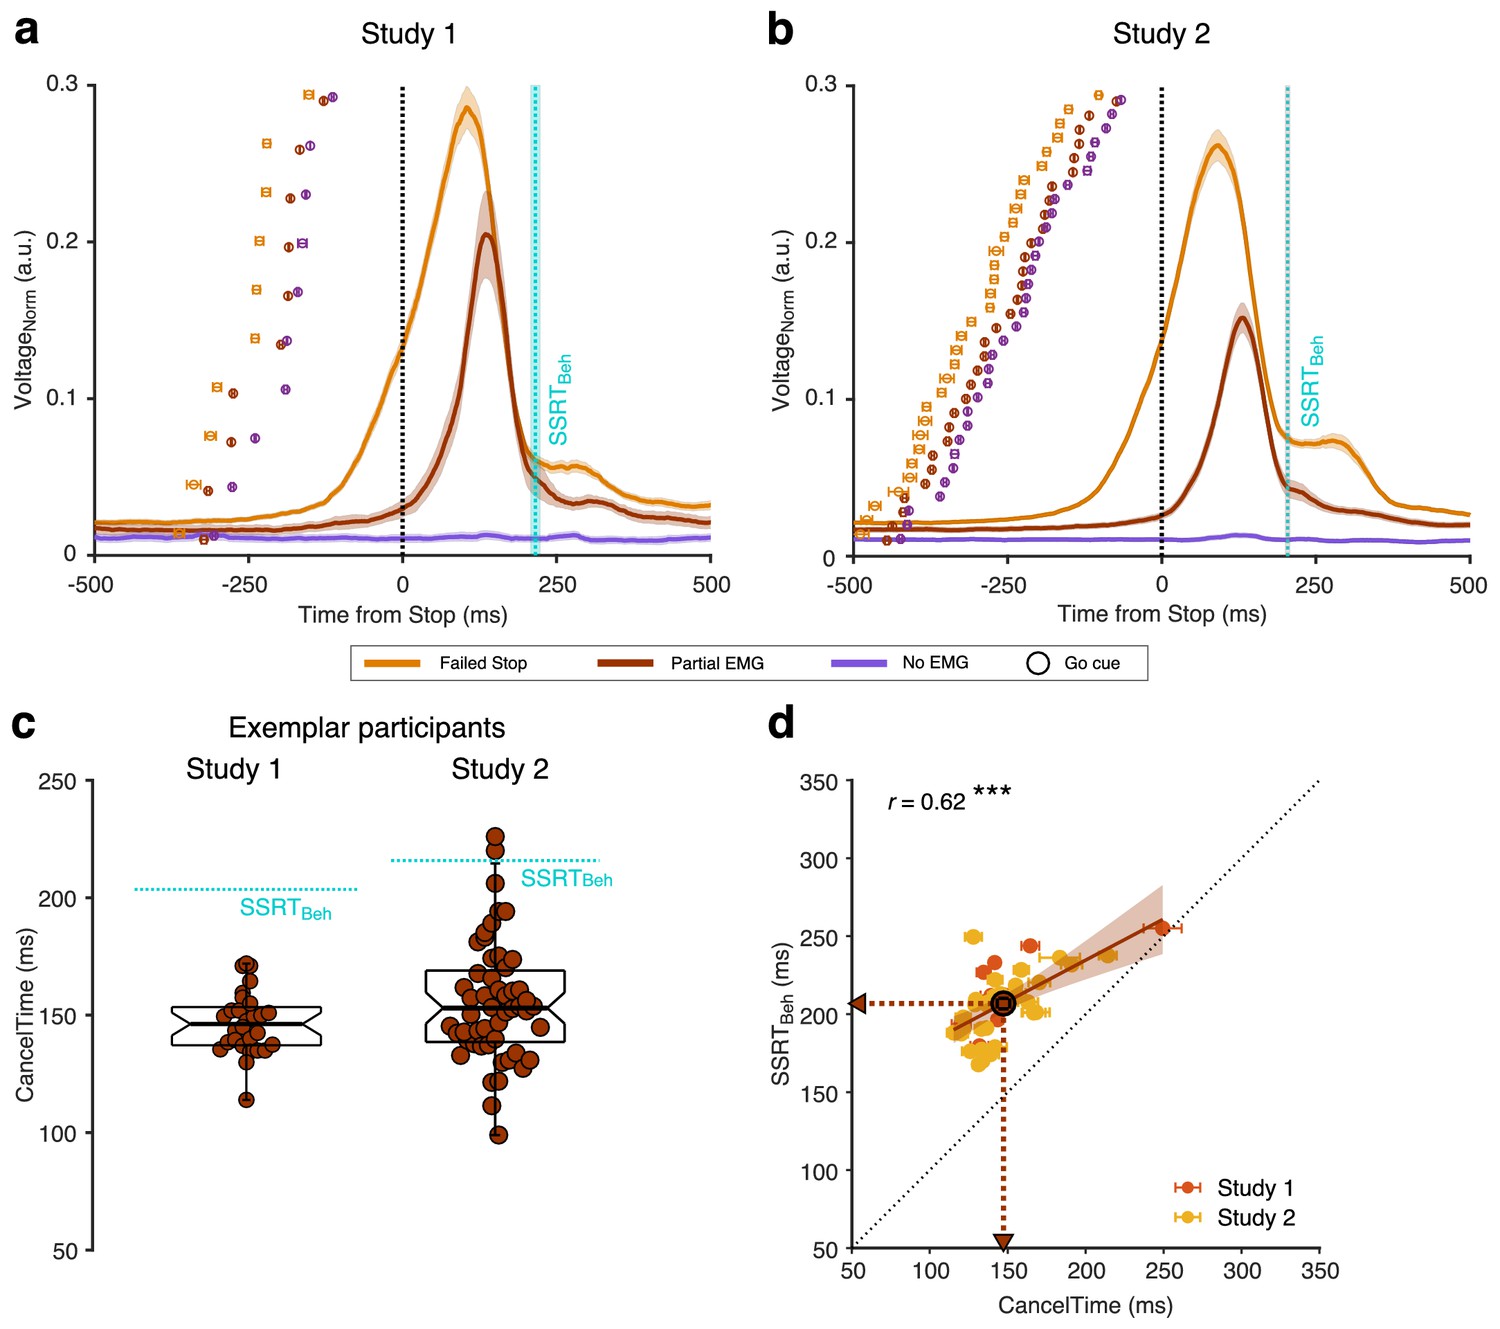
EMG responses in Successful (Partial and No EMG) and Failed Stop trials in study 1 and 2.
(a) Normalized EMGRMS voltage in Failed Stop (orange), Partial EMG (brown), and No EMG trials (purple), aligned to the Stop signal. The lines and the shaded area represent the mean ± s.e.m. across participants. The dotted cyan line and shaded area represent the mean ± s.e.m of SSRTBeh across participants. The dots and cross-hairs represent the mean ± s.e.m. of the Go cue in a participant. Note that the time between the Go cue and the Stop signal (i.e. the SSD) is shortest for the No EMG (purple), then the Partial EMG (brown), and then the Failed Stop trials (orange). (b) Same as (a) but for study 2. (c) (Left) Beeswarm plot of the CancelTime in an exemplar participant from study 1. Each dot represents a trial. The dotted cyan line represents the SSRTBeh. (Right) Same as left but for study 2. (d) Correlation between CancelTime and SSRTBeh in study 1 (light red) and study 2 (yellow). The brown dot, lines and arrows represent the means, while the black dotted line represents the unity line. The linear regression fit and its 95% confidence interval (pooled study 1 and 2) is shown as a brown line and shaded region respectively.
-
Figure 2—source data 1
Correlation between CancelTime and SSRTBeh for study 1 and 2.
- https://cdn.elifesciences.org/articles/50371/elife-50371-fig2-data1-v2.xlsx
Figure 3 with 2 supplements
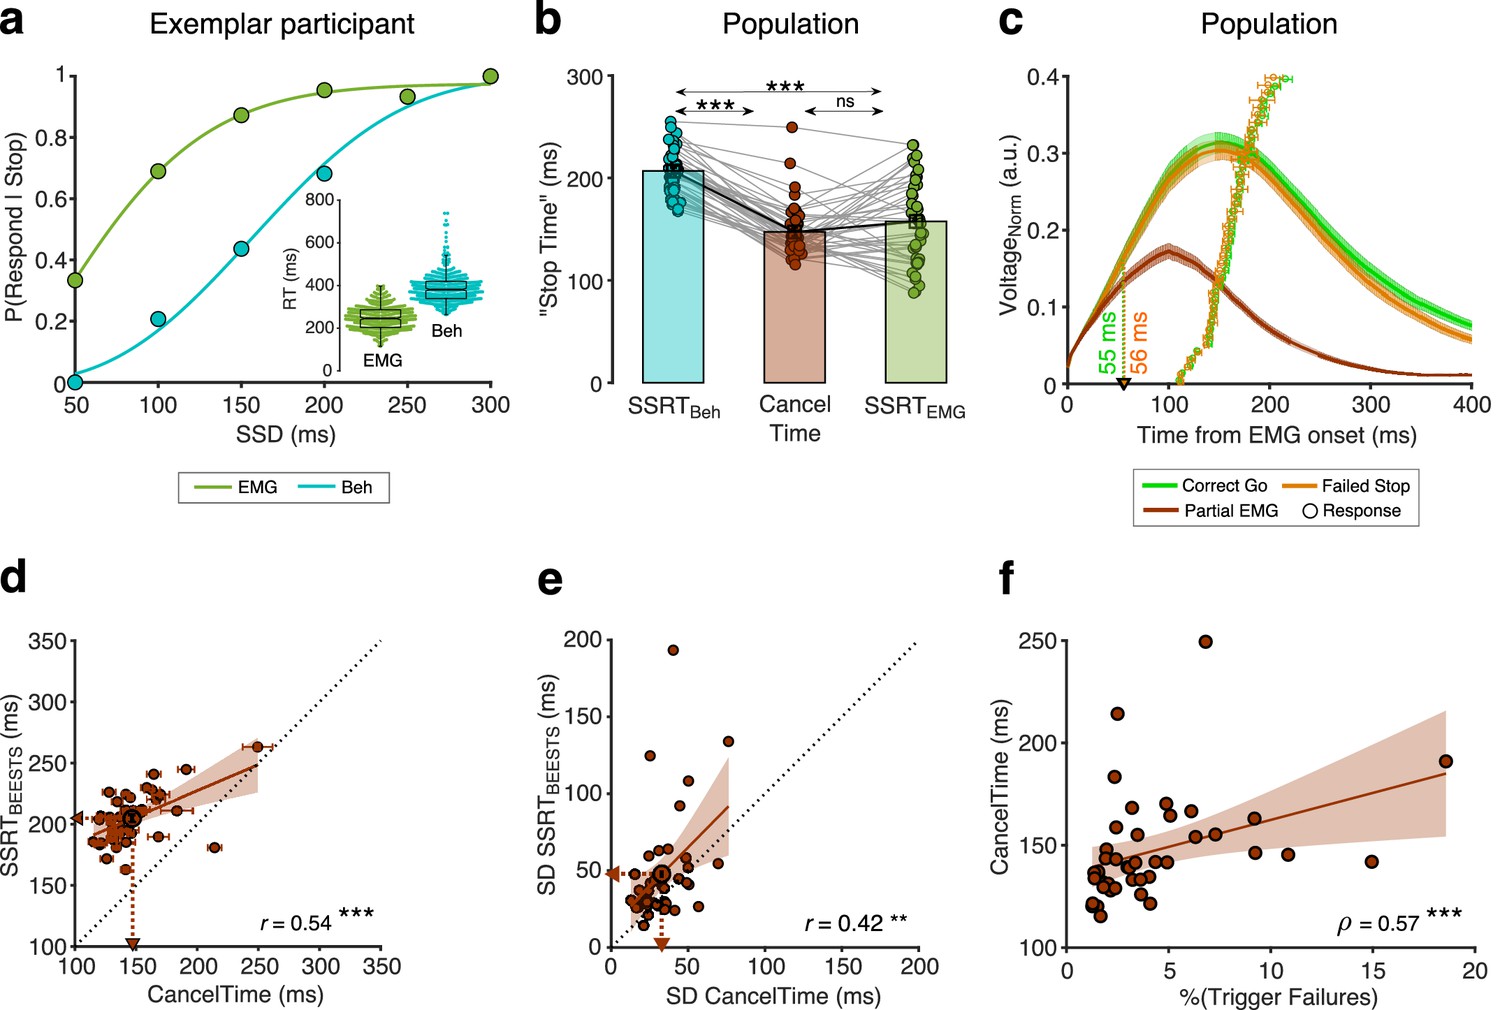
Peripheral delay associated with SSRTBeh and the relationship between CancelTime and BEESTS parameters.
(a) P(Respond|Stop) in an exemplar participant calculated using the behavioral response (dark green dots) and the EMG response (cyan dots). The lines represent the cumulative Weibull fit as where t is the SSD, α is the time at which the function reaches 64% of its full growth, β is the slope, δ is the minimum value of the function, and γ is maximum value of the function. The difference between δ and γ marks the range of the function. (Inset) Beeswarm plot of the EMG onset (dark green) and the behavioral responses (cyan) used to calculate SSRTEMG and SSRTBeh respectively. (b) Comparison of SSRTBeh (cyan), CancelTime (brown), and SSRTEMG (dark green) across all participants. Each dot represents a participant, while the bar and cross-hair represents the mean ± s.e.m. in a group. (c) The normalized EMG responses aligned to the detected EMG onsets in the Correct Go (green), Failed Stop (orange), and Partial EMG (brown) trials. The line and shaded region represent the mean ± s.e.m. in a group. The dots and cross hairs represent the mean ± s.e.m. of the keypress in a participant. (d) Correlation between CancelTime and mean SSRTBEESTS estimate. Each dot and cross-hair represent the mean ± s.e.m. in a participant. The brown line and the shaded area represent the linear regression fit and its 95% confidence interval. The unity line is represented as a dotted black line. (e) Correlation between SD of CancelTime and SD of the SSRTBEESTS estimate. Other details same as (d). (f) Correlation between percentage Trigger Failures estimated from BEESTS and CancelTime. Other details same as (d).
-
Figure 3—source data 1
Peripheral delay associated with SSRTBeh and relationship between CancelTime and BEESTS parameters.
- https://cdn.elifesciences.org/articles/50371/elife-50371-fig3-data1-v2.xlsx
Figure 3—figure supplement 1

Simulation results.
(a) Cumulative Weibull fit of the empirical (solid blue line) and simulated (dotted gray line) behavioral (Beh) inhibition function in an exemplar participant. The dots represent the P(Respond|Stop) data. (Inset) The Stop distribution estimated using the behavioral (Beh) inhibition function and (μSTOP-Beh,σSTOP-Beh) with the black triangle representing the mean. (b) The estimated Stop distribution poorly fits the EMG inhibition function in the exemplar participant (solid green line – empirical, dotted gray - simulated). Other details same as (a). (c) Comparison of the squared error between the simulated and empirical inhibition function when the Stop distribution is estimated from the Beh inhibition function and RTBeh (Beh inhibition function: squared error = 0.10 ± 0.01; EMG inhibition function: squared error = 0.21 ± 0.02; t(41) = 4.8, p<0.001, d = 0.7, BF10 > 100). Each dot represents a participant, and the bar and cross-hairs represent the mean ± s.e.m. (d) Same as (a) but now the Stop distribution (inset) has been estimated from the EMG inhibition function and the (μGO-EMG, σGO-EMG). (e) Similar to (b). The Stop distribution estimated from EMG inhibition function poorly fits the Beh inhibition function (solid cyan line – empirical, dotted gray - simulated). (f) Same as (c) but when the Stop distribution is estimated from the EMG inhibition function (EMG inhibition function: squared error = 0.12 ± 0.02; RT inhibition function: squared error = 0.23 ± 0.02; t(41) = 4.7, p<0.001, d = 0.9, BF10 > 100). (g) Schematic of the architecture underlying a Correct Stop trial. The green accumulator represents the Go process, while the red accumulator, starting at the SSD, represents the Stop process. Both race towards the threshold (orange line at the top), but as the Stop hits the threshold first, no response is elicited. There is a delay at the periphery (EMG onset to keypress) which is partitioned into a non-ballistic and ballistic stage. (h) Same as (g) but for a Partial EMG trial. Here the Go process reaches the threshold first and EMG response is elicited, but the Stop process intervenes during the non-ballistic stage and cancels the drive, thereby preventing a keypress. (i) Same as (g) but for a Failed Stop trial. Here the Stop process is unable to cancel the response as the ballistic stage is impervious to the Stop process. (j) Same as (b) but here the Stop distribution has been estimated using the EMG inhibition function and the model has a ballistic stage (solid cyan line – empirical, dotted cyan line – model with ballistic stage, dotted gray line – model without a ballistic stage). (k) Comparison of the squared error between the simulated and empirical inhibition function for Stop estimated from the EMG inhibition function, with (cyan) and without a ballistic stage (blue-green) (With ballistic stage: squared error = 0.14 ± 0.02; Without ballistic stage: squared error = 0.23 ± 0.02; t(41) = 4.2, p<0.001, d = 0.7, BF10 > 100).
-
Figure 3—figure supplement 1—source data 1
Simulation results.
- https://cdn.elifesciences.org/articles/50371/elife-50371-fig3-figsupp1-data1-v2.xlsx
Figure 3—figure supplement 2

Partial EMG voltage across SSDs in study 1 and 2.
The normalized EMG voltage in the partial EMG trials for the first 5 SSDs (SSD no.) in each participant (SSD1 = 0.206±0.012, SSD2 = 0.212±0.012, SSD3 = 0.237±0.017, SSD4 = 0.234±0.015, SSD5 = 0.260±0.020; rmANOVA: F(4,24) = 3.7, p = 0.018, = 0.4). Each dot represents a participant, while the bar and cross-hairs represent the mean and s.e.m. across all the participants.
-
Figure 3—figure supplement 2—source data 1
Partial EMG voltage across SSDs for study 1 and 2.
- https://cdn.elifesciences.org/articles/50371/elife-50371-fig3-figsupp2-data1-v2.xlsx
Figure 4 with 1 supplement
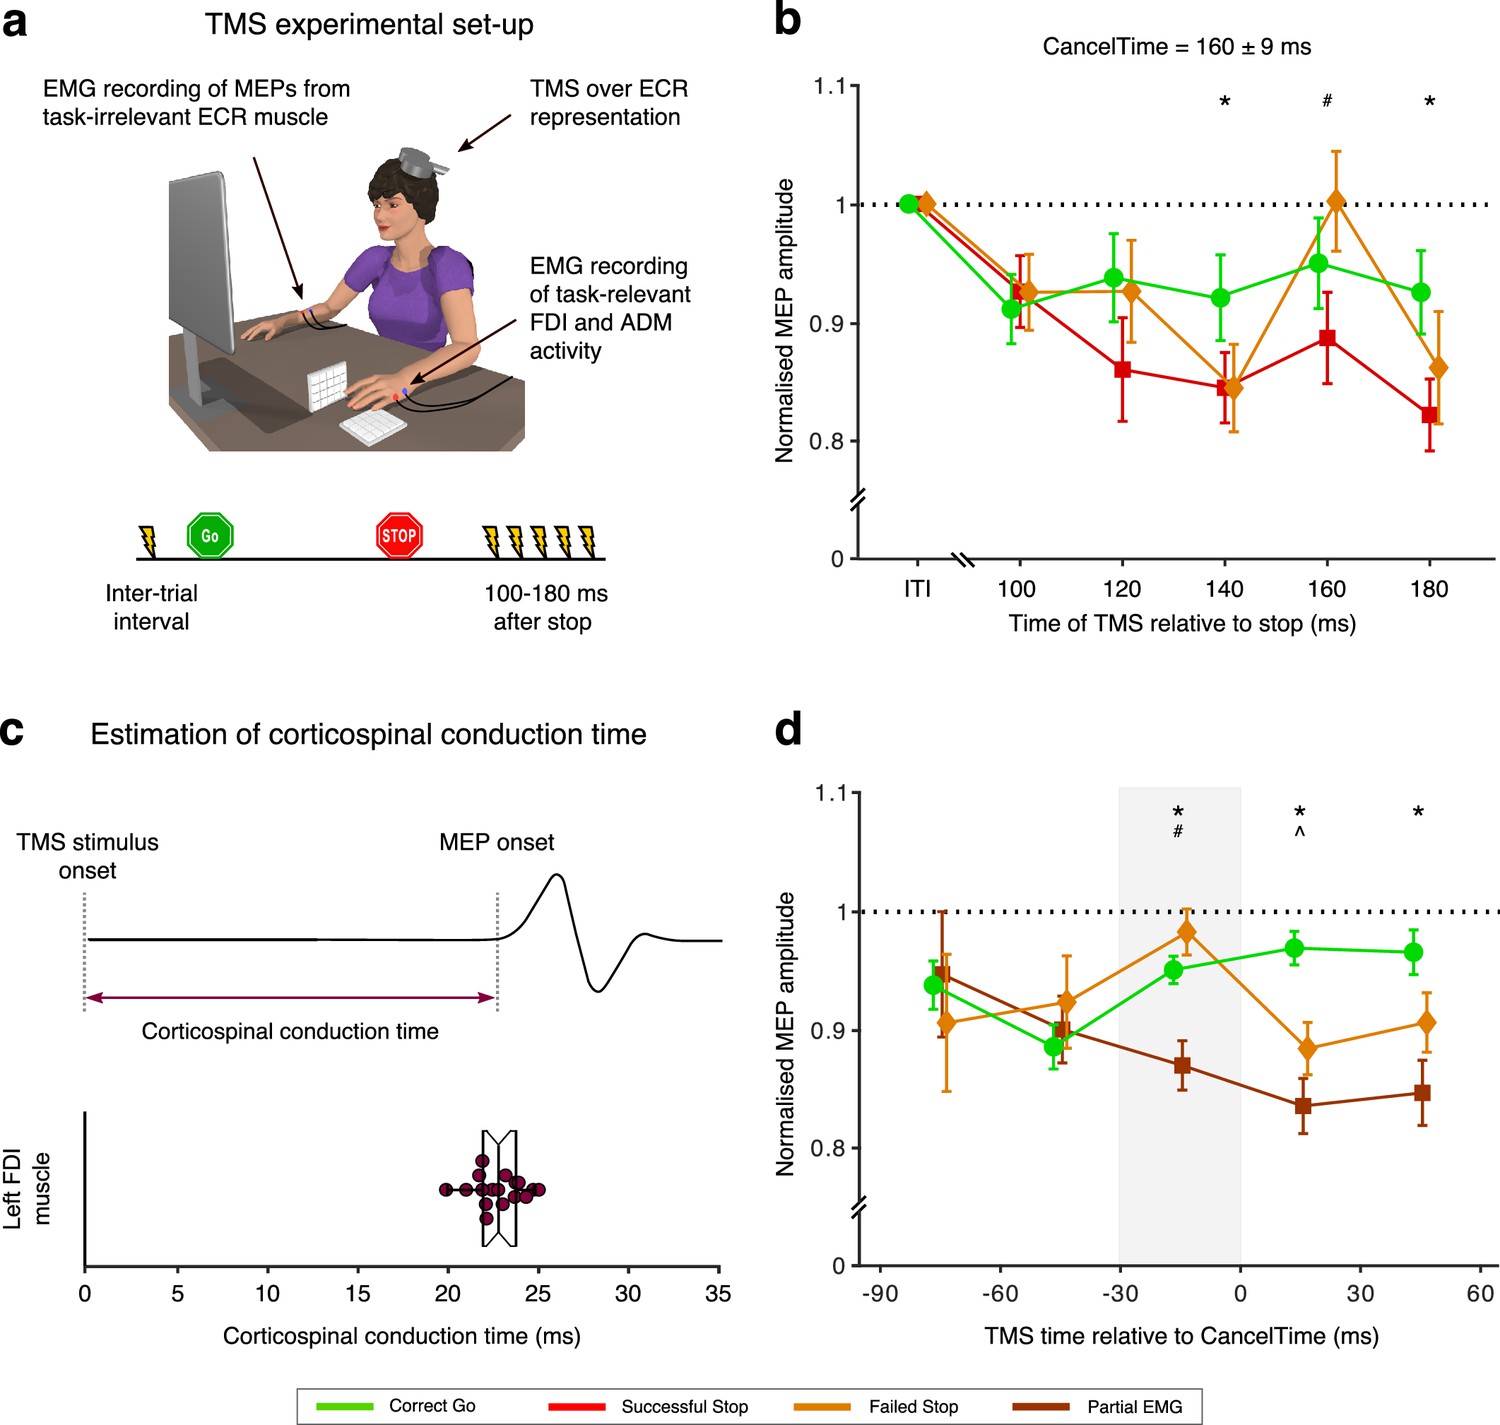
Relationship between global motor system suppression and CancelTime.
(a) Experimental set up and TMS stimulus timings for study 3. Participants performed the Stop signal task with the left hand with concurrent EMG measurement of CancelTime from task-relevant FDI and ADM muscles. On a given trial, a single TMS stimulus over left M1 was delivered at one of 6 possible times to elicit a motor evoked potential (MEP) in the task-irrelevant extensor carpi radialis (ECR) muscle of the right forearm. (b) Global motor system suppression begins at 140 ms after the Stop-signal, and thus ~20 ms prior to the mean CancelTime. Paired t-tests: *, pBon < 0.05 Successful Stop (red; combined Partial and No EMG trials) vs. Correct Go (green); #, pBon < 0.05 Successful Stop vs. Failed Stop (orange). Each dot and cross-hairs represent the mean ± s.e.m. across the population. The black dotted line shows amplitude of MEPs normalized to those at the inter-trial interval. (c) (Top) Schematic representation of an MEP. (Bottom) Beeswarm plot of the mean corticospinal conduction time to a hand muscle, which was established by measuring the onset latency of MEPs in the hand (~23 ms on average). Each dot represents a participant. This conduction time is included in CancelTime. (d) Trial-by-trial analysis of MEP amplitudes organized into 30 ms time bins reflecting the time of TMS expressed relative to CancelTime. Global motor system suppression begins in a window 30-0 ms prior to the CancelTime (gray shaded region). Wilcoxon rank sum test: *, pBon < 0.05 Partial EMG (brown) vs. Correct Go (green); #, pBon < 0.05 Partial EMG vs. Failed Stop (orange); ^, pBon < 0.05 Failed Stop vs. Correct Go. The black dotted line shows amplitude of MEPs normalized to those at the inter-trial interval.
-
Figure 4—source data 1
Relationship between global motor system suppression and CancelTime.
- https://cdn.elifesciences.org/articles/50371/elife-50371-fig4-data1-v2.xlsx
Figure 4—figure supplement 1
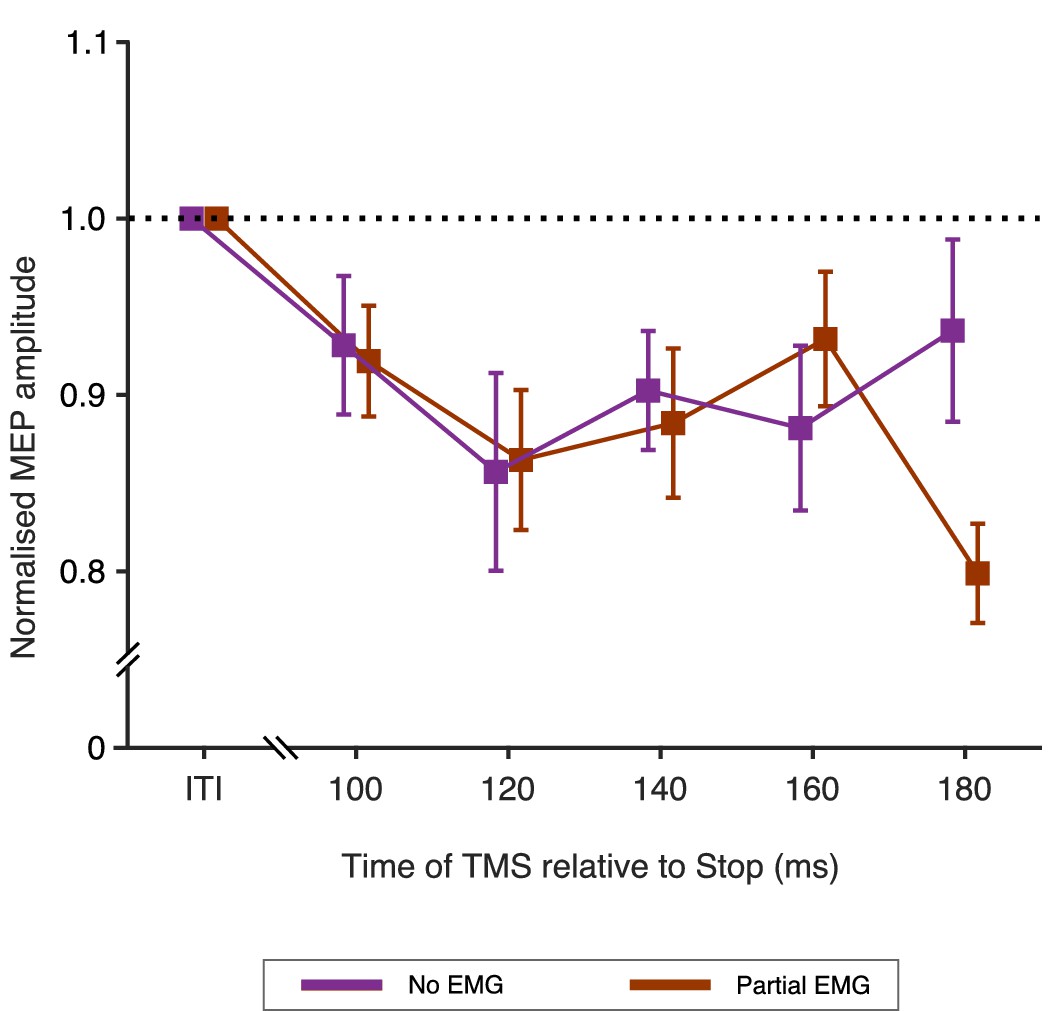
MEPs in study 3.
Normalised MEP amplitudes in Successful Stop trials divided according to the presence, or not, of a Partial EMG burst. There was no difference in amplitude of MEPs for trials with (Partial EMG, brown) and without (No EMG, purple) EMG bursts. The squares and cross-hairs represent the mean ± s.e.m. across the population. rmANOVA showed no main effect of trial type (F(1,16) = 1.2, p = 0.288, = 0.1) or time (F(4, 64) = 1.1, p = 0.356, = 0.1), nor any interaction of trial-type by time (F(4, 64) = 2.3, p = 0.066, = 0.1). Therefore, the timing and extent of the global motor system suppression on Successful Stop trials was not influenced by whether or not a partial EMG burst was detected.
Figure 5 with 5 supplements
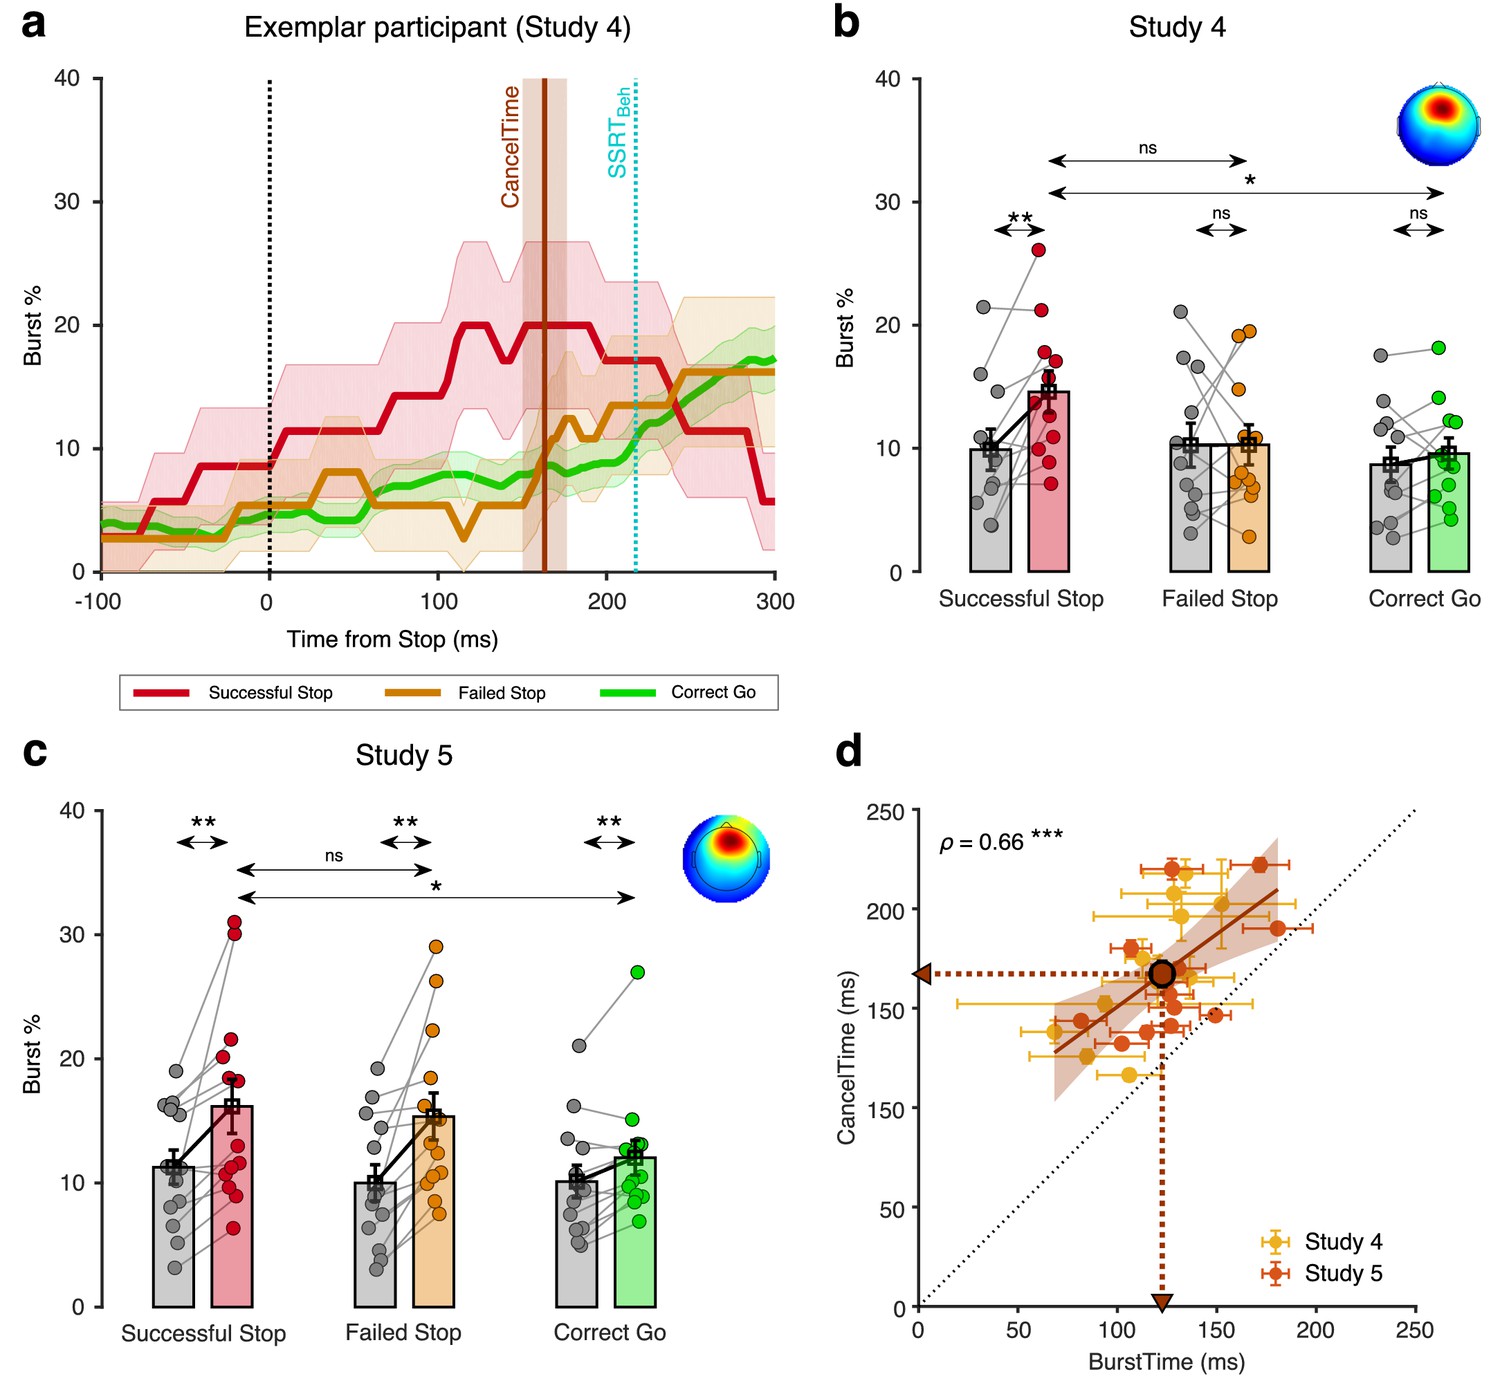
Relationship between scalp EEG beta bursts and CancelTime (study 4 and 5).
(a) Burst % across time for Successful Stop (red), Failed Stop (orange), and Correct Go (green) trials for an exemplar participant in study 4 from the right frontal spatial filter. The shaded region represents mean ± s.e.m. The CancelTime is shown in brown and the SSRTBeh as a cyan line. (b) The mean burst probability across all participants for Successful Stop (red), Failed Stop (orange), and Correct Go (green) trials and their respective baselines (gray). The bars and cross-hairs represent the mean and s.e.m across participants, while the dots represent individual participants. (Inset top right) The average scalp topography of all the right frontal ICs across all participants. (c) Same as (b) but for study 5. (d) Correlation between mean BurstTime and mean CancelTime. The yellow dots and cross-hairs represent the participants in study 4, while the light red ones represent participants in study 5. The brown line and the shaded area represent the linear regression fit and its 95% confidence interval (pooled study 4 and 5). Other details same as Figure 2d.
-
Figure 5—source data 1
Relationship between scalp EEG beta bursts and CancelTime for study 4 and 5.
- https://cdn.elifesciences.org/articles/50371/elife-50371-fig5-data1-v2.xlsx
Figure 5—figure supplement 1
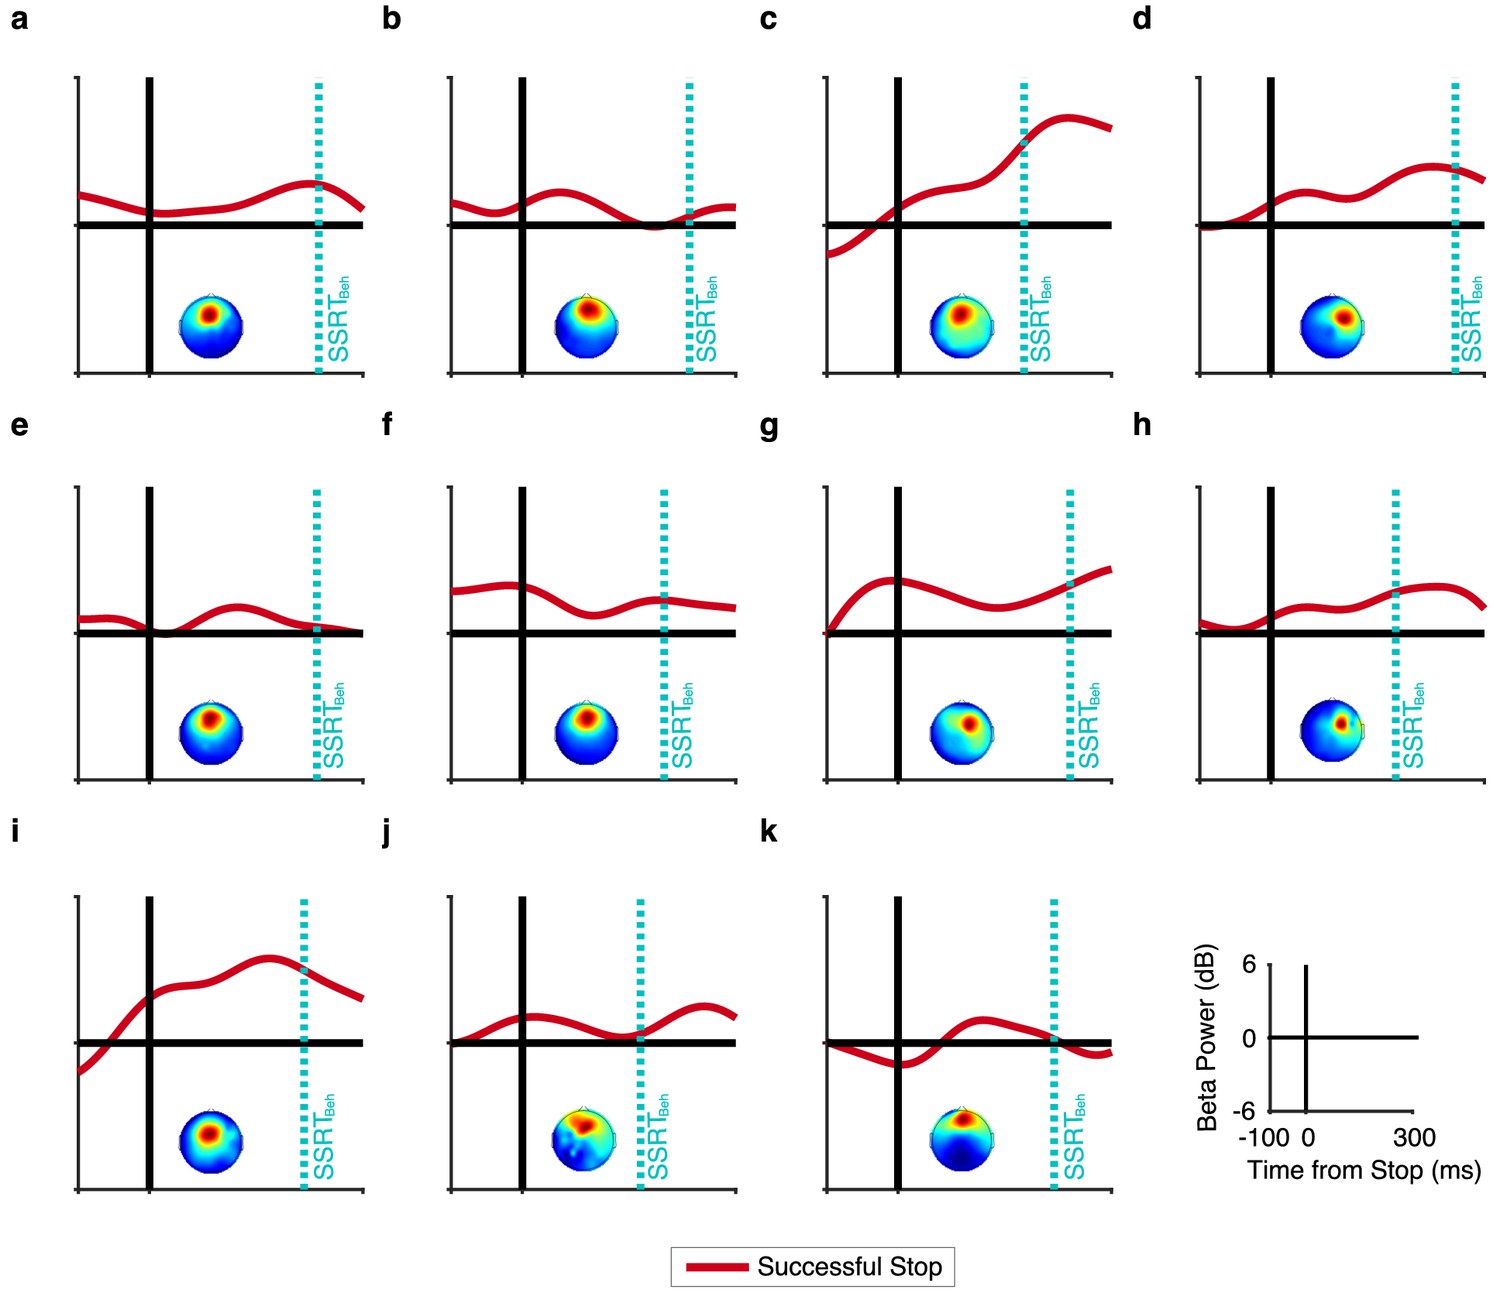
Beta power in Successful Stop trials for study 4.
(a–k) shows the time course of the peak beta power (solid red line) in the selected IC for each participant. The dotted cyan line represents each participant's SSRTBeh. The inset in each panel shows the scalp topography for the selected IC.
Figure 5—figure supplement 2

Average dipole location of the ICs selected in study 4 and 5.
(a), (b), and (c) The sagittal, top, and coronal view of the brain respectively, showing the average dipole location. The purple dot represents the mean location and the orange bubble represents the SD.
Figure 5—figure supplement 3
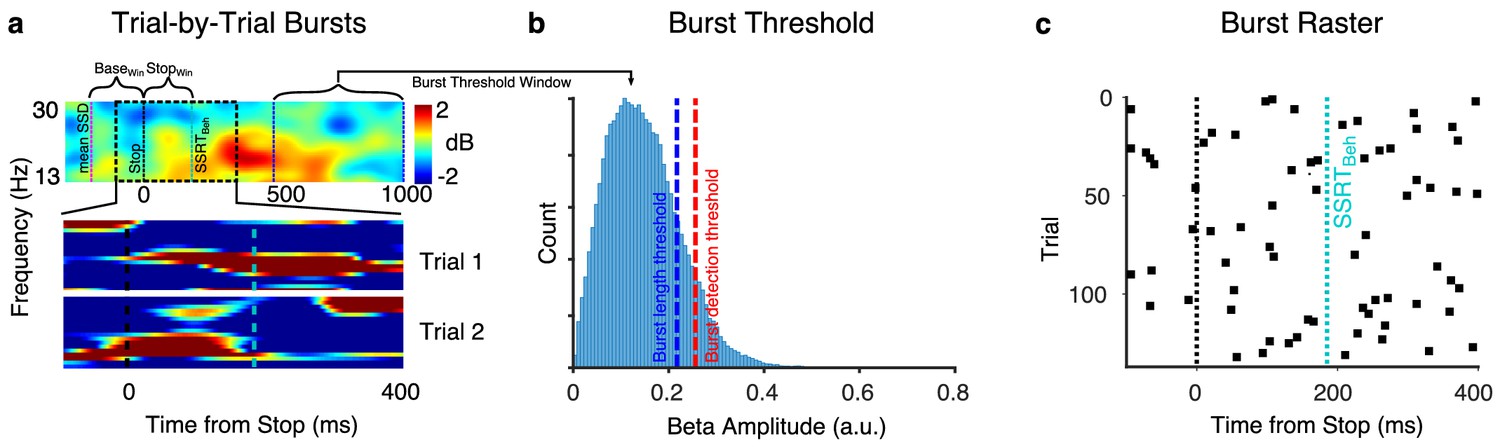
Illustration of beta burst computation.
(a) The average beta power (13–30 Hz) between the Stop signal and SSRTBeh (top panel) for a participant. The window between mean SSD (dotted pink line) and Stop (dotted black line at 0) represents the baseline time window (BaseWin). The time from Stop signal to SSRTBeh (dotted cyan line) represents the stop time window (StopWin). The burst threshold window is the time period from 500 to 1000 ms after the Stop signal. The bottom two panels show single trial examples of brief bursts of activity with the dotted black and cyan lines represent the Stop signal and SSRTBeh respectively. (b) The histogram of beta amplitude for all trials in a participant i(500 to 1000 ms after the Stop signal in the Stop trials; 500 to 1000 ms after mean SSD in the Go trials). The dotted red line represents the threshold for defining a burst which is estimated as median + 1.5 SD of the beta amplitude. The BurstTime and burst height are the time and amplitude of the peak within a burst respectively. Once a burst is identified using this threshold, the burst % and burst length are estimated using a lower threshold which is median + SD (dotted blue line) (c) The burst raster for all trials in a participant across time. Each black dot represents a burst in that trial. To compute BurstTime we consider the burst times between the Stop signal and SSRTBeh (dotted cyan line).
Figure 5—figure supplement 4
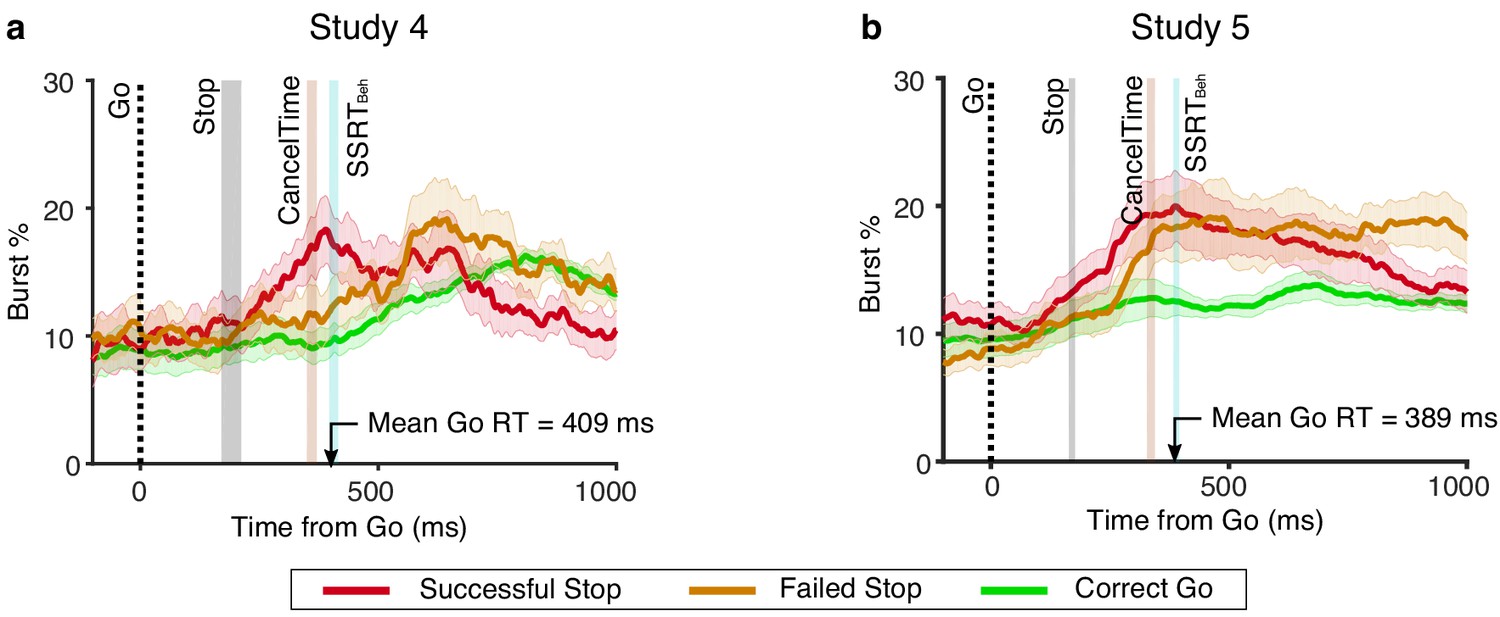
Dynamics of burst% aligned to the Go cue.
(a) Burst% for the Correct Go (green), Successful Stop (red), and Failed Stop (orange), aligned to the Go cue in Study 4. The bold traces represent the mean across the population, while the shaded region represents the s.e.m. The grey, brown, and cyan shaded regions represent the mean ± s.e.m. of the time of presentation of the Stop signal, CancelTime, SSRTBeh across the population. (b) Same as (a) but for Study 5.
Figure 5—figure supplement 5
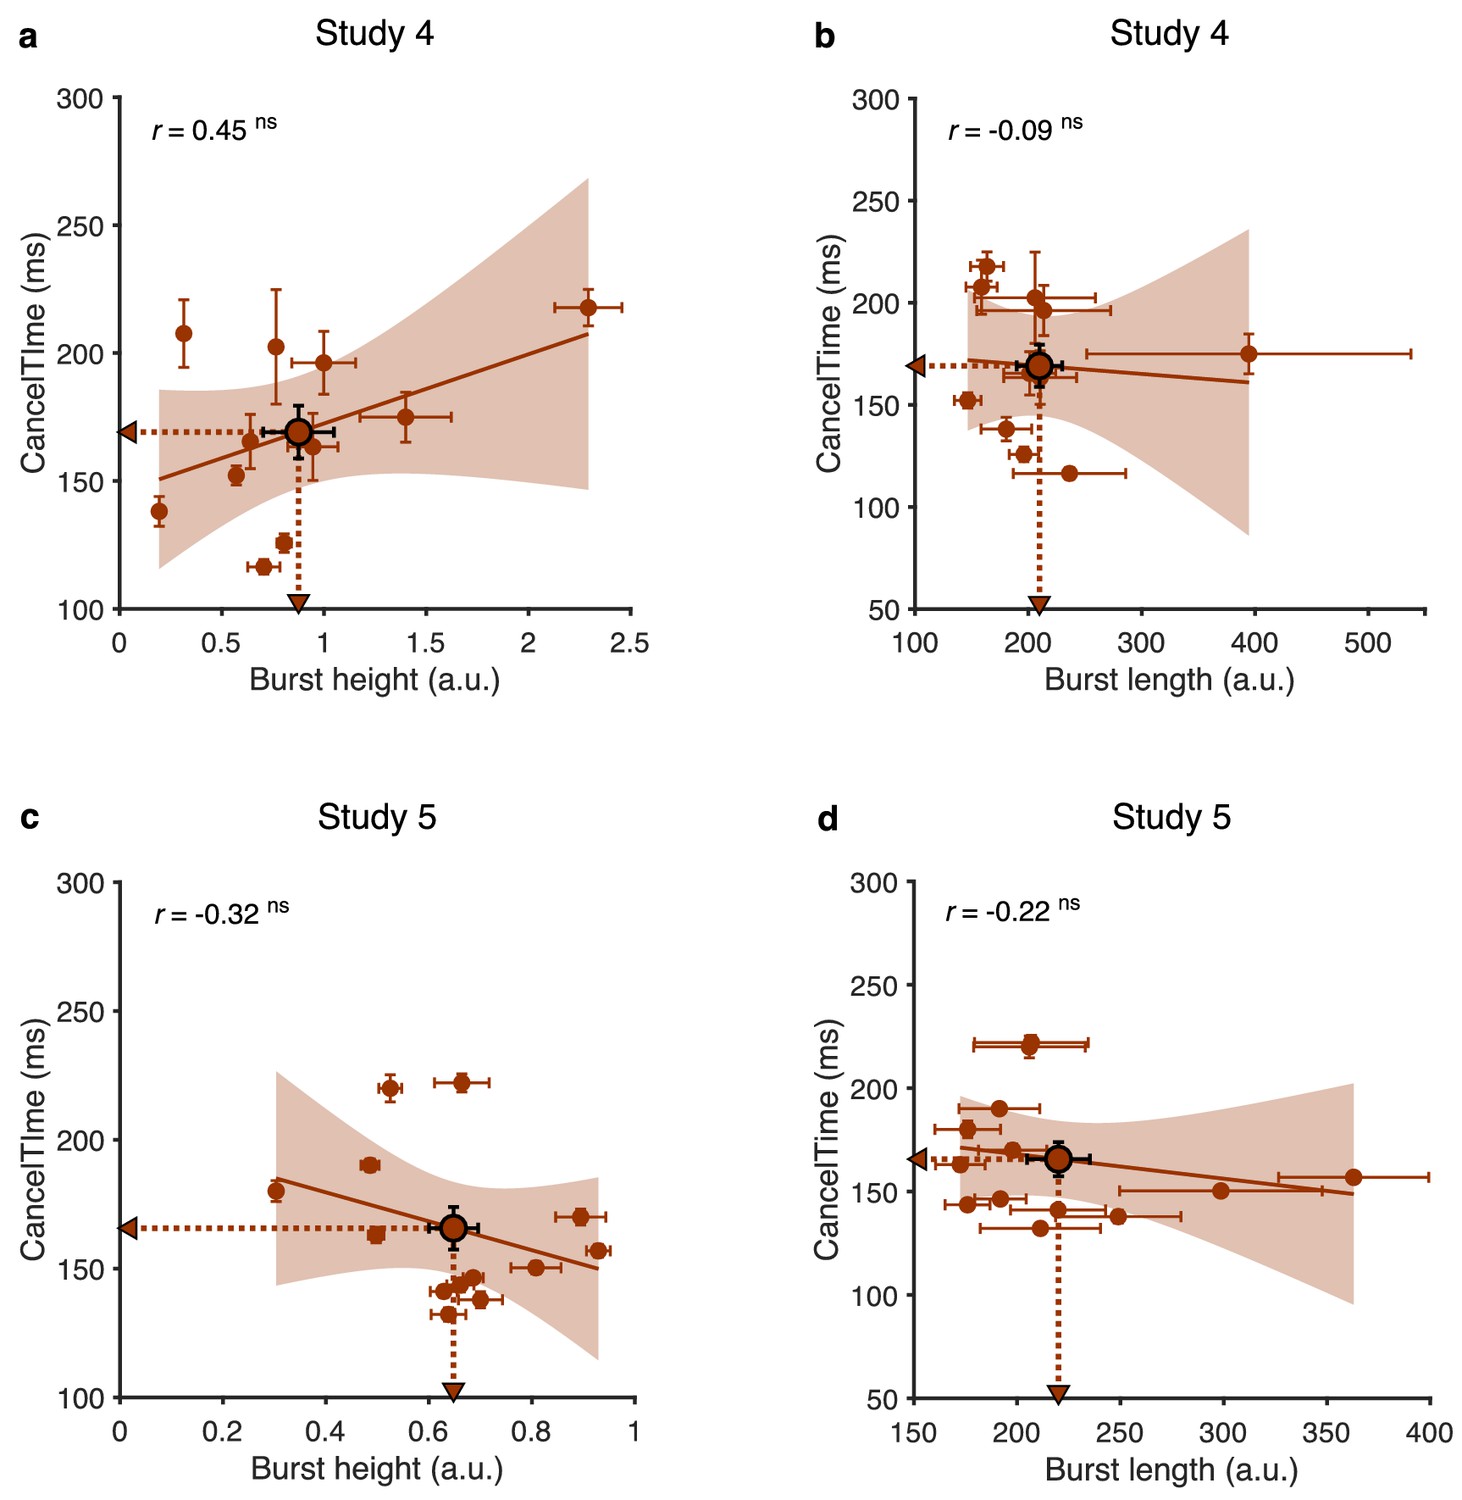
Relationship of CancelTime with other burst parameters.
(a) Correlation between mean burst height (0.9 ± 0.2) and mean CancelTime across participants in study 4 (r = 0.5, p=0.161, BF10 = 0.7). The brown dots and cross-hairs represent the mean ± s.e.m. for individual participants. The brown line and the shaded area represent the linear regression fit and its 95% confidence interval respectively. (b) Across participants correlation between mean burst length (210 ± 20 ms) and mean CancelTime in study 4 (r = −0.1, p=0.801, BF10 = 0.3). Other details are same as in (a). (c) Same as (a) but for study 5. Mean burst height is 0.65 ± 0.05 (r = −0.3, p=0.281, BF10 = 0.5). (d) Same as (b) but for study 5. Mean burst length is 220 ± 15 ms (r = −0.22, p=0.475, BF10 = 0.4).
-
Figure 5—figure supplement 5—source data 1
Relationship between CancelTime and other burst parameters in study 4 and 5.
- https://cdn.elifesciences.org/articles/50371/elife-50371-fig5-figsupp5-data1-v2.xlsx
Figure 6

Hypothetical model of the temporal cascade of processes underlying human action-stopping.
Following the Stop signal, the right PFC including the rIFC and the preSMA gets activated at ~120 ms. These region/s activate (green connections) the STN of the basal ganglia. This in turn activates the globus pallidus interna which, via its inhibition (red connection) on the motor regions of the thalamus, cuts down the ‘drive’ to the motor cortex. Theoutcome is a global motor suppression at ~140 ms after the Stop signal. This suppression is reflected in the hand muscle at ~160 ms which is measured as the CancelTime. There is a delay of ~60 ms at the muscle level which gets added to the behavioral estimate of SSRT.
Author response image 1
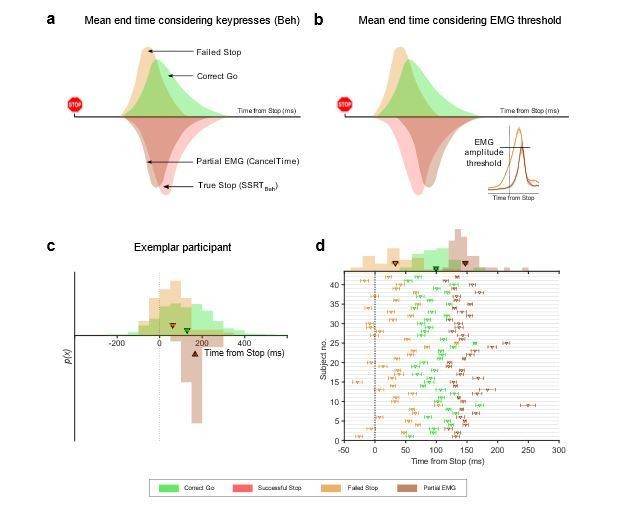
End time of the Stop process using keypress and EMG amplitude.
(a) Schematic of the distributions of the mean end time of the Go and Stop process in the Correct Go (green), Failed Stop (orange), and the Successful Stop (red) trials, while considering the keypress as the response. The CancelTime distribution is represented in brown. Note that CancelTime is an EMG measure and preceded SSRTBeh calculated using keypresses. (b) Same as (a) but here the response is considered as the time when the EMG reaches the mean amplitude of that in the partial EMG trials. Note that the all distributions other than CancelTime shift to the left. (Inset) Mean EMG amplitude in the Failed Stop (orange) and partial EMG (brown) trials in Study 1. (c) Histogram showing the distribution of the Failed Stop and Correct Go responses when considering response as the time when the EMG in these trials cross the mean amplitude of that in the partial EMG amplitude. Histogram of CancelTime is shown on the inverted y-axis for better visualization. The triangle and cross-hairs represent the mean ± s.e.m. Colors are the same as in (a). (d) Same as (c) but for all participants in Study 1 and 2. The histogram of the population is shown at the top. Note that CancelTime probably overestimates the mean of the true Stop distribution.
Author response image 2
Beta burst analysis in the channel space.
Please note that the SNR is far worse than that observed using a spatial filter.
Videos
Video 1
Hypothetical model of the temporal cascade of processes underlying human action-stopping.
Following the Go signal, after a delay, the thalamocortical drive starts building up. After a while this drive is sufficient to activate muscles via the corticospinal pathways. Following the Stop signal, the right PFC including the rIFC and the preSMA gets activated at ~ 120 ms. These region/s activate (green connections) the STN of the basal ganglia which in turn activates the globus pallidus interna which via its inhibition (red connection) on the motor regions of the thalamus cuts down the ‘drive’ of the motor cortex. This results in a global motor suppression at ~ 140 ms after the Stop signal. This suppression is reflected in the hand muscle at ~ 160 ms which is measured as the CancelTime. There is a delay of ~ 60 ms at the muscle level which gets added to the behavioral estimate of SSRT.
Tables
Table 1
Behavior (mean ± s.e.m.; All values in ms).
| Study 1 (EMG) | Study 2 (EMG) | Study 3 (TMS) | Study 4 (EEG) | Study 5 (EEG) | |
|---|---|---|---|---|---|
| Go RTBeh | 470 (15) | 493 (15) | 430 (17) | 427 (15) | 405 (6) |
| Failed Stop RTBeh | 416 (11) | 447 (14) | 391 (12) | 384 (12) | 370 (5) |
| Correct Go % | 97 (1) | 98 (0) | 99 (0) | 99 (0) | 99 (0) |
| Correct Stop % | 51 (1) | 52 (1) | 49 (1) | 48 (1) | 50 (0) |
| Mean SSD | 237 (20) | 280 (17) | 194 (18) | 191 (21) | 170 (7) |
| SSRTBeh | 216 (8) | 204 (4) | 219 (6) | 214 (9) | 219 (6) |
-
Table 1—source data 1
Behavior in the Stop-signal task in all five studies.
- https://cdn.elifesciences.org/articles/50371/elife-50371-table1-data1-v2.xlsx
Table 2
BEESTS estimates (mean ± s.e.m.; All values in ms)
| Estimated parameters | Pooled study 1 and 2 |
|---|---|
| Mean Go RTBeh | 483 (13) |
| SD Go RTBeh | 94 (5) |
| Mean SSRTBEESTS | 205 (3) |
| SD SSRTBEESTS | 48 (5) |
| %Trigger Failures | 4 (1) |
-
Table 2—source data 1
BEESTS estimates for study 1 and 2.
- https://cdn.elifesciences.org/articles/50371/elife-50371-table2-data1-v2.xlsx
Additional files
Download links
A two-part list of links to download the article, or parts of the article, in various formats.
Downloads (link to download the article as PDF)
Open citations (links to open the citations from this article in various online reference manager services)
Cite this article (links to download the citations from this article in formats compatible with various reference manager tools)
Temporal cascade of frontal, motor and muscle processes underlying human action-stopping
eLife 9:e50371.
https://doi.org/10.7554/eLife.50371


