The mechanosensitive ion channel TRAAK is localized to the mammalian node of Ranvier
- Howard Hughes Medical Institute, The Rockefeller University, United States
- University Medical Center Hamburg-Eppendorf, Germany
Figures
Figure 1 with 2 supplements
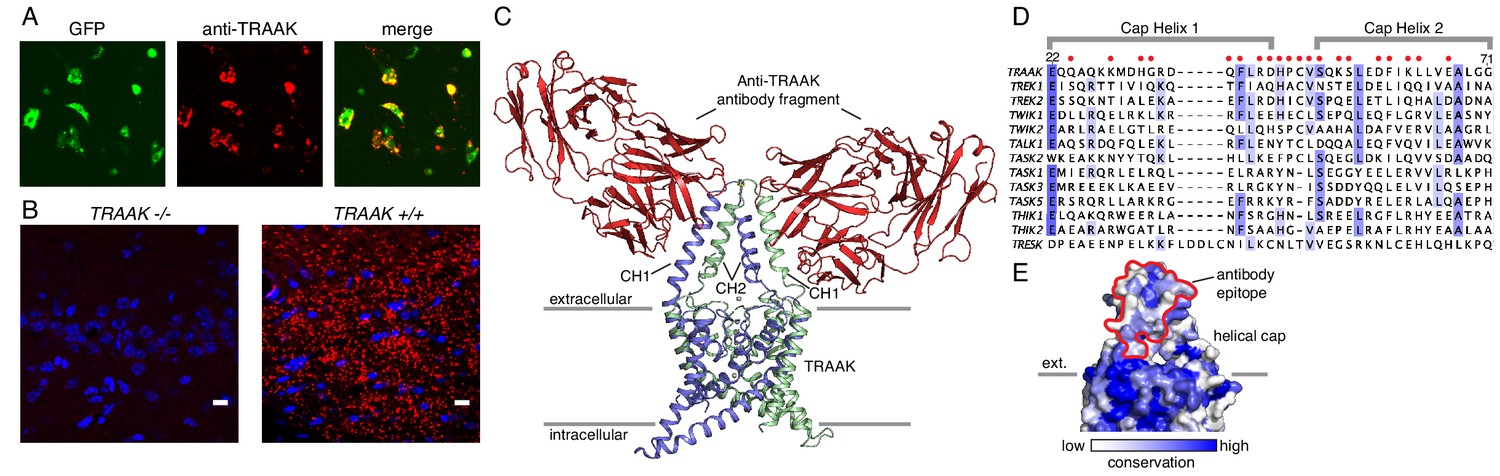
A specific anti-mouse TRAAK antibody targets the channel extracellular cap.
(A) GFP fluorescence (left, green), anti-TRAAK antibody labeling (center, red), and merged image (right) from a field of live CHO-K1 cells expressing mouse TRAAK-EGFP. The anti-TRAAK antibody labels live cells expressing TRAAK indicative of extracellular epitope recognition. (B) Anti-TRAAK antibody labeling (red) and DAPI (blue) in brain sections from TRAAK-/- and TRAAK+/+ animals. Scale bar = 10 μm. (C) TRAAK-Fab complex structure viewed from the membrane plane with extracellular solution above. Antibody Fab fragments (red) bind the extracellular cap of TRAAK (shown with one chain of the dimeric channel colored blue and the second green). Potassium ions are shown as gray spheres. Approximate boundaries of the membrane bilayer are indicated with gray bars. Cap helices 1 and 2 are indicated (CH1, CH2). (D) Sequence alignment of the helical cap region of mouse K2P channels (amino acid numbers correspond to mouse TRAAK). Residues of mouse TRAAK that form the antibody binding epitope are indicated with red circles above the sequence. (E) Surface view of the helical cap from the membrane plane colored according to conservation among mouse K2Ps as in (D). Antibody binding surface is outlined in red.
Figure 1—figure supplement 1
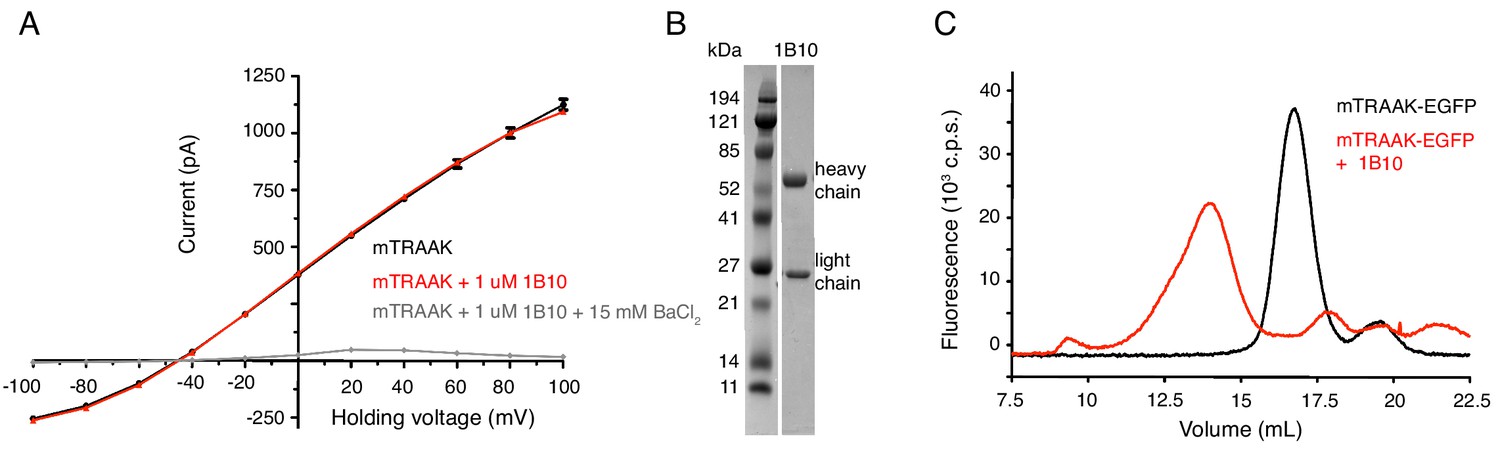
Anti-TRAAK antibodies form biochemically stable channel complexes without impacting channel function.
(A) Current-voltage relationship from mouse TRAAK reconstituted into planar lipid bilayers before (black) and after (red) the addition of 1 uM purified 1B10 antibody (to both cis and trans sides) and after the addition of 15 mM BaCl2. Current was recorded during voltage steps from −100 to 100 mV from a holding potential of −50 mV with internal 150 mM K+, 0 mM Na+ and external 15 mM K+, 135 mM Na+. Data are shown in physiological convention. Antibody 1B10 has no functional effect on mouse TRAAK currents. (B) Coomassie-stained SDS-PAGE gel of purified 1B10 antibody. (C) Elution profile of TRAAK-EGFP alone (black) and after incubation with anti-TRAAK antibody (red) from a Superose six size exclusion column monitored by EGFP fluorescence. Antibody-TRAAK complex formation generates and earlier-eluting peak than TRAAK alone.
Figure 1—figure supplement 2
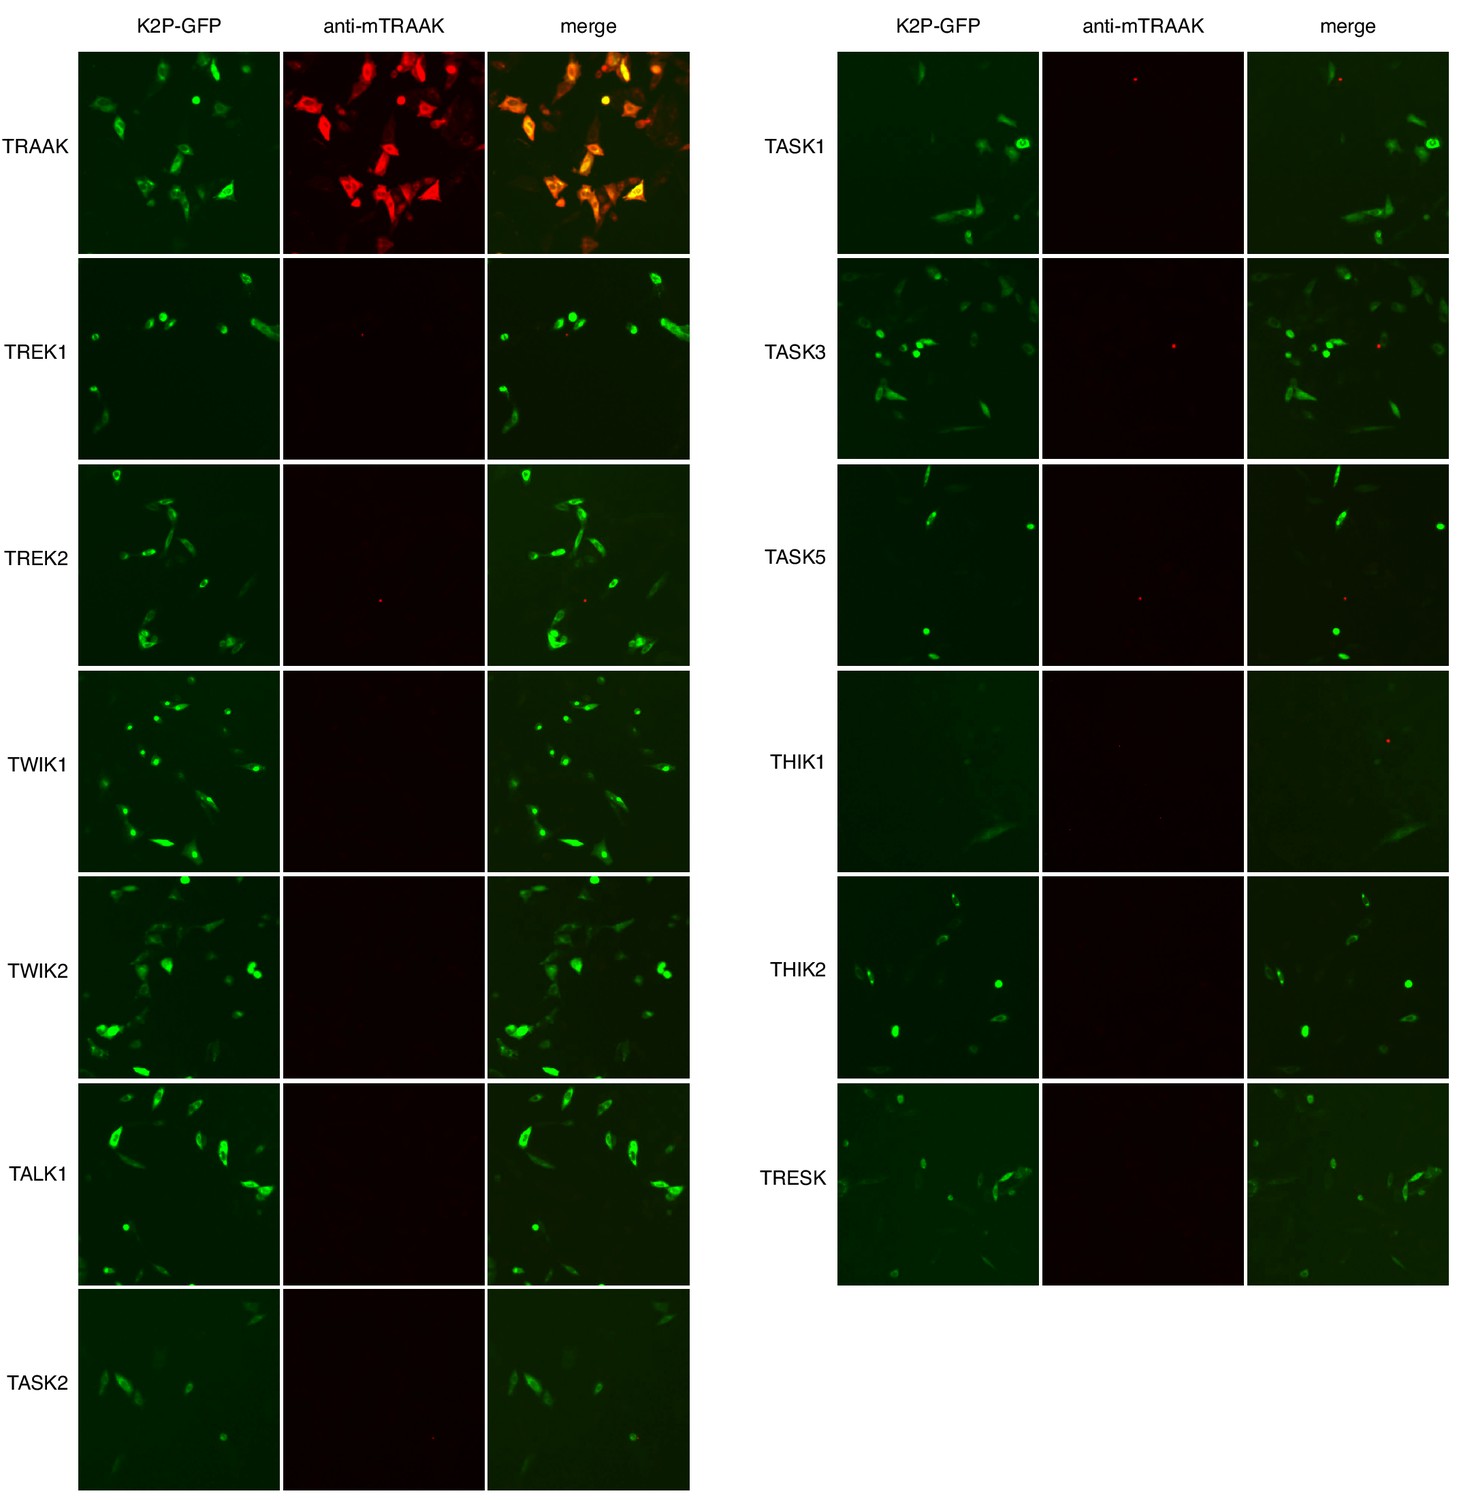
Anti-TRAAK monoclonal antibody selectively labels TRAAK among all functionally expressed mouse K2P channels.
GFP fluorescence (left), anti-mTRAAK antibody fluorescence (center), and merged image (right) of a field of fixed and permeabilized CHO-K1 cells expressing the mouse K2P-EGFP fusion indicated to the left of the images and labeled with hamster anti-TRAAK 1B10 antibody and Alexa-568 conjugated anti-hamster secondary antibody.
Figure 2 with 1 supplement
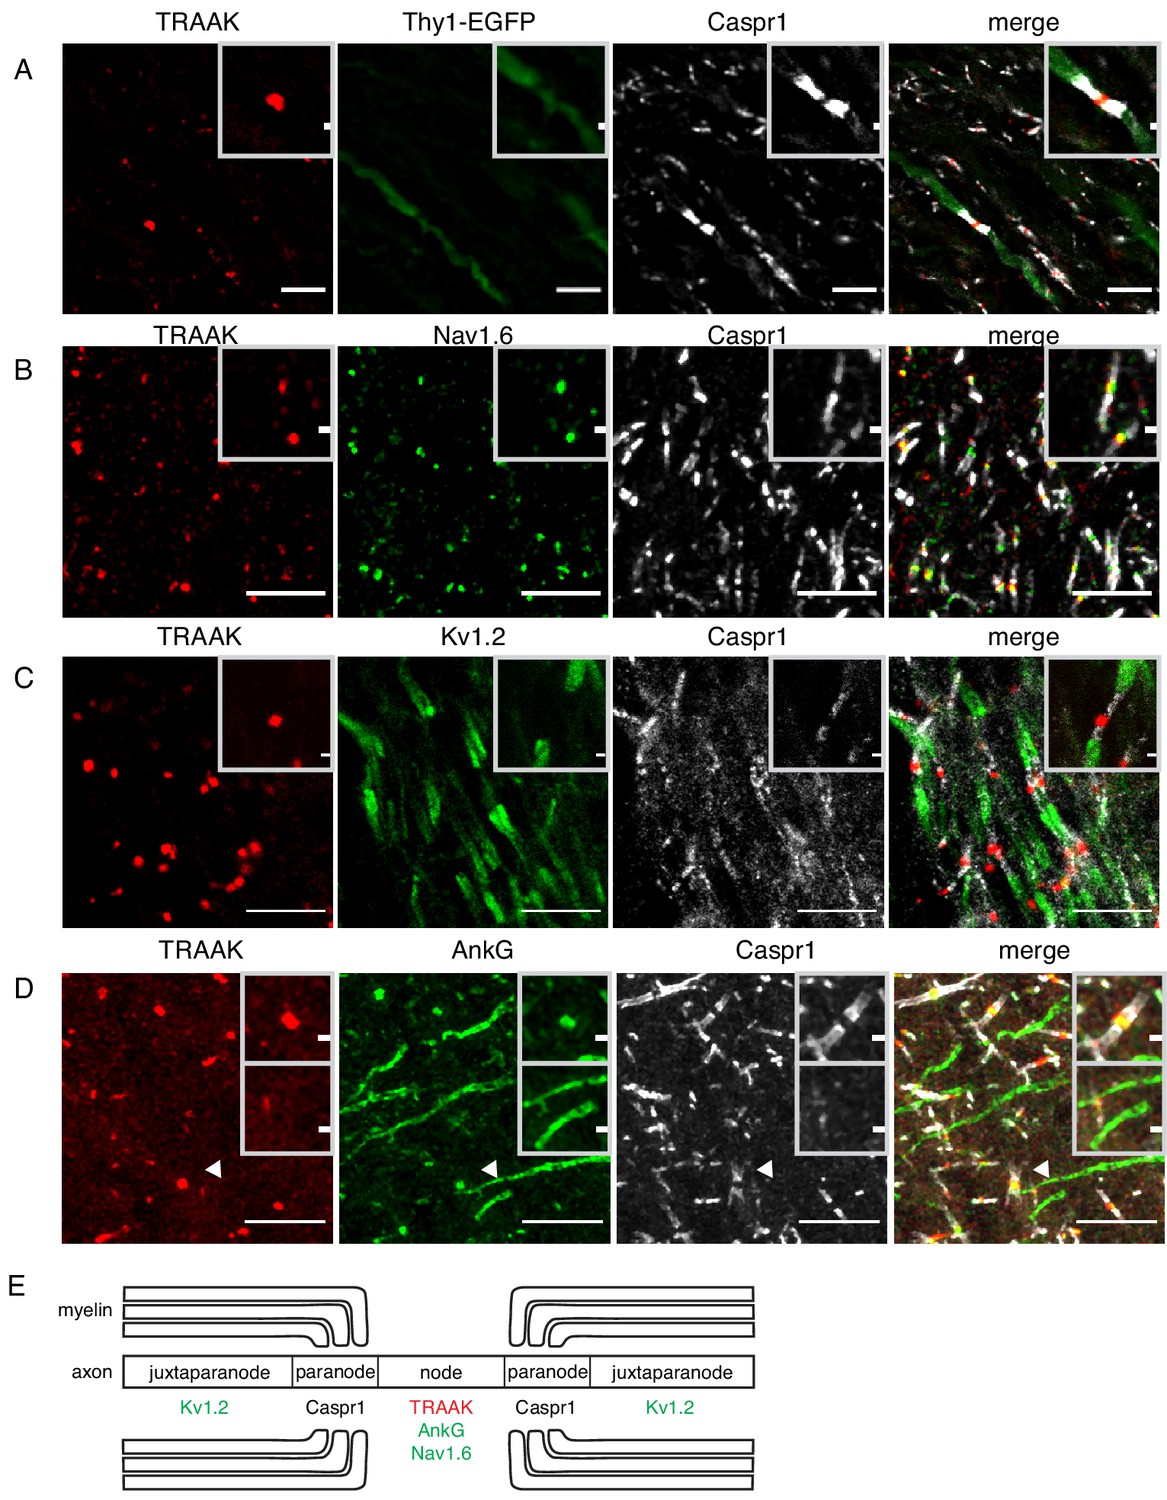
TRAAK is localized to nodes of Ranvier in the central nervous system.
(A) Immunostaining of TRAAK (red), Thy1-EGFP (sparsely labeled neurons, green) and Caspr1 (present in paranodes, white) in a hindbrain section. (B–D) Immunostaining of TRAAK (red), Caspr1 (white) and (B) Nav1.6 (present in nodes of Ranvier), (C) Kv1.2 (present in juxtaparanodes), and (D) AnkG (present in nodes of Ranvier and axon initial segments, one of which is labeled with an arrowhead) in the (A–C) hippocampal-proximal fiber tracts of the fornix or (D) cortex. Scale bars = 10 μm. Insets show a magnified view of (A–D) a single node or (D, lower inset) an axon intial segment. Inset scale bars = 1 μm. (E) Cartoon representation of immunolocalization data. TRAAK, Nav1.6, and AnkG are localized to nodes of Ranvier in myelinated axons which are flanked by Caspr1 in paranodes and Kv1.2 in juxtaparanodes.
Figure 2—figure supplement 1
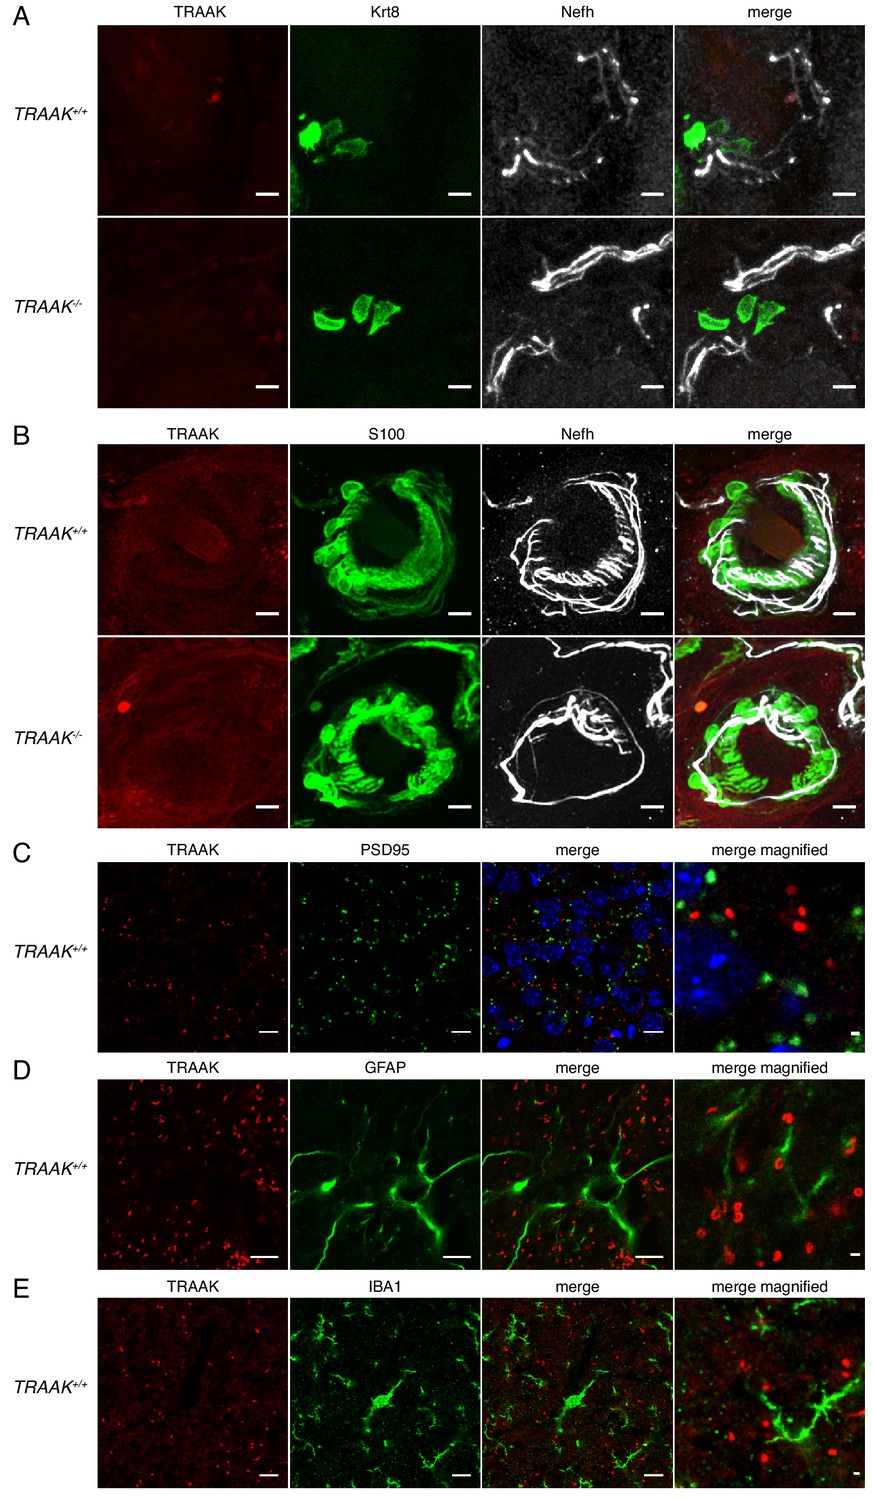
TRAAK is not found in sensory endings, synapses, astrocytes or microglia.
(A) TRAAK, Krt8 and Nefh staining of Merkel cells from a touch dome in hind paw glabrous skin from TRAAK+/+ (upper row) and TRAAK-/- (lower row) mice. TRAAK is not co-localized with Krt8-labeled Merkel cells or nearby regions of Nefh-labeled sensory neurons. (B) TRAAK, S100 and Nefh staining of lanceolate endings in back hairy skin from TRAAK+/+ and TRAAK-/- mice. TRAAK is not co-localized with Nefh-labeled sensory neurons in the region surrounding hair follicles or S100-labeled terminal Schwann cells. (C) TRAAK and PSD95 staining in hippocampus. TRAAK is not co-localized with PSD95-labeled synapses. (D) TRAAK and GFAP staining in hippocampus. TRAAK is not co-localized with GFAP-labeled astrocytes. (E) TRAAK and Iba1 staining in hippocampus. TRAAK is not co-localized with Iba1-labeled microglia. Scale bars = 10 μm except in magnified rightmost image in (D–E) where scale bars = 1 μm.
Figure 3 with 1 supplement
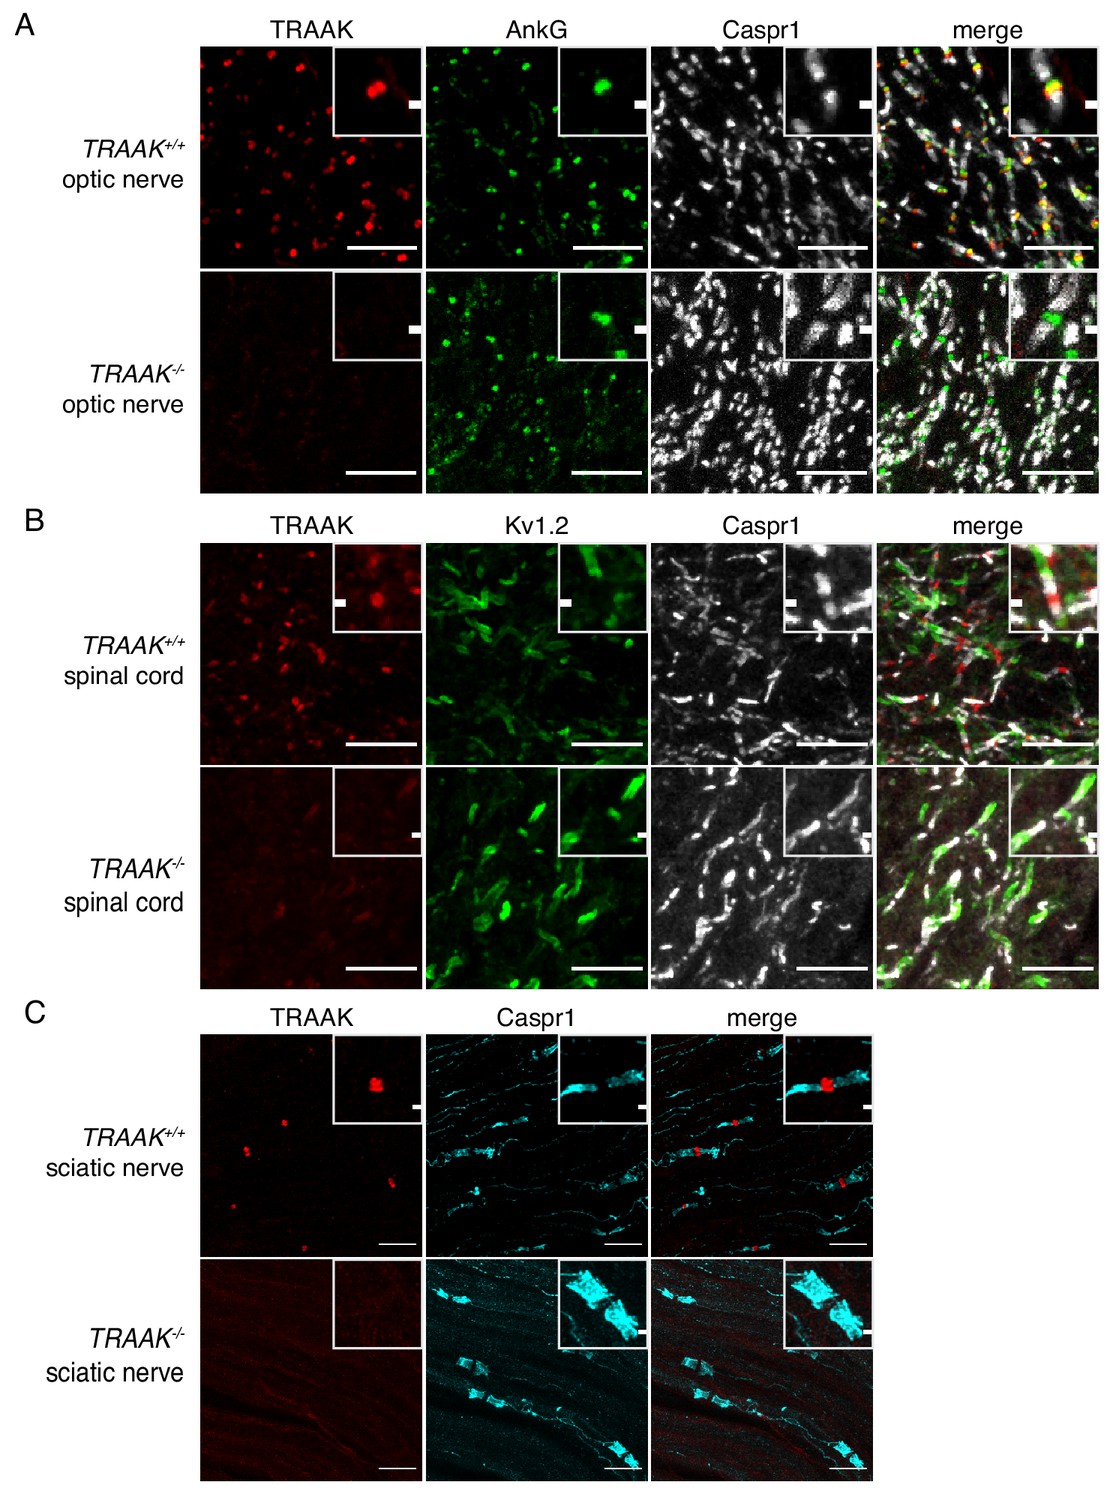
TRAAK is localized to nodes of Ranvier in the peripheral nervous system.
(A) Immunostaining of TRAAK (red), AnkG (green) and Caspr1 (white) in optic nerve from TRAAK+/+ (upper row) and TRAAK-/- (lower row) animals. (B) Immunostaining of TRAAK (red), Kv1.2 (green) and Caspr1 (white) in spinal cord from TRAAK+/+ and TRAAK-/- animals. (C) Immunostaining of TRAAK (red) and Caspr1 (cyan) in sciatic nerve from TRAAK+/+ and TRAAK-/- animals. Scale bars = 10 μm. Insets show a magnified view of a single node. Inset scale bars = 1 μm.
Figure 3—figure supplement 1
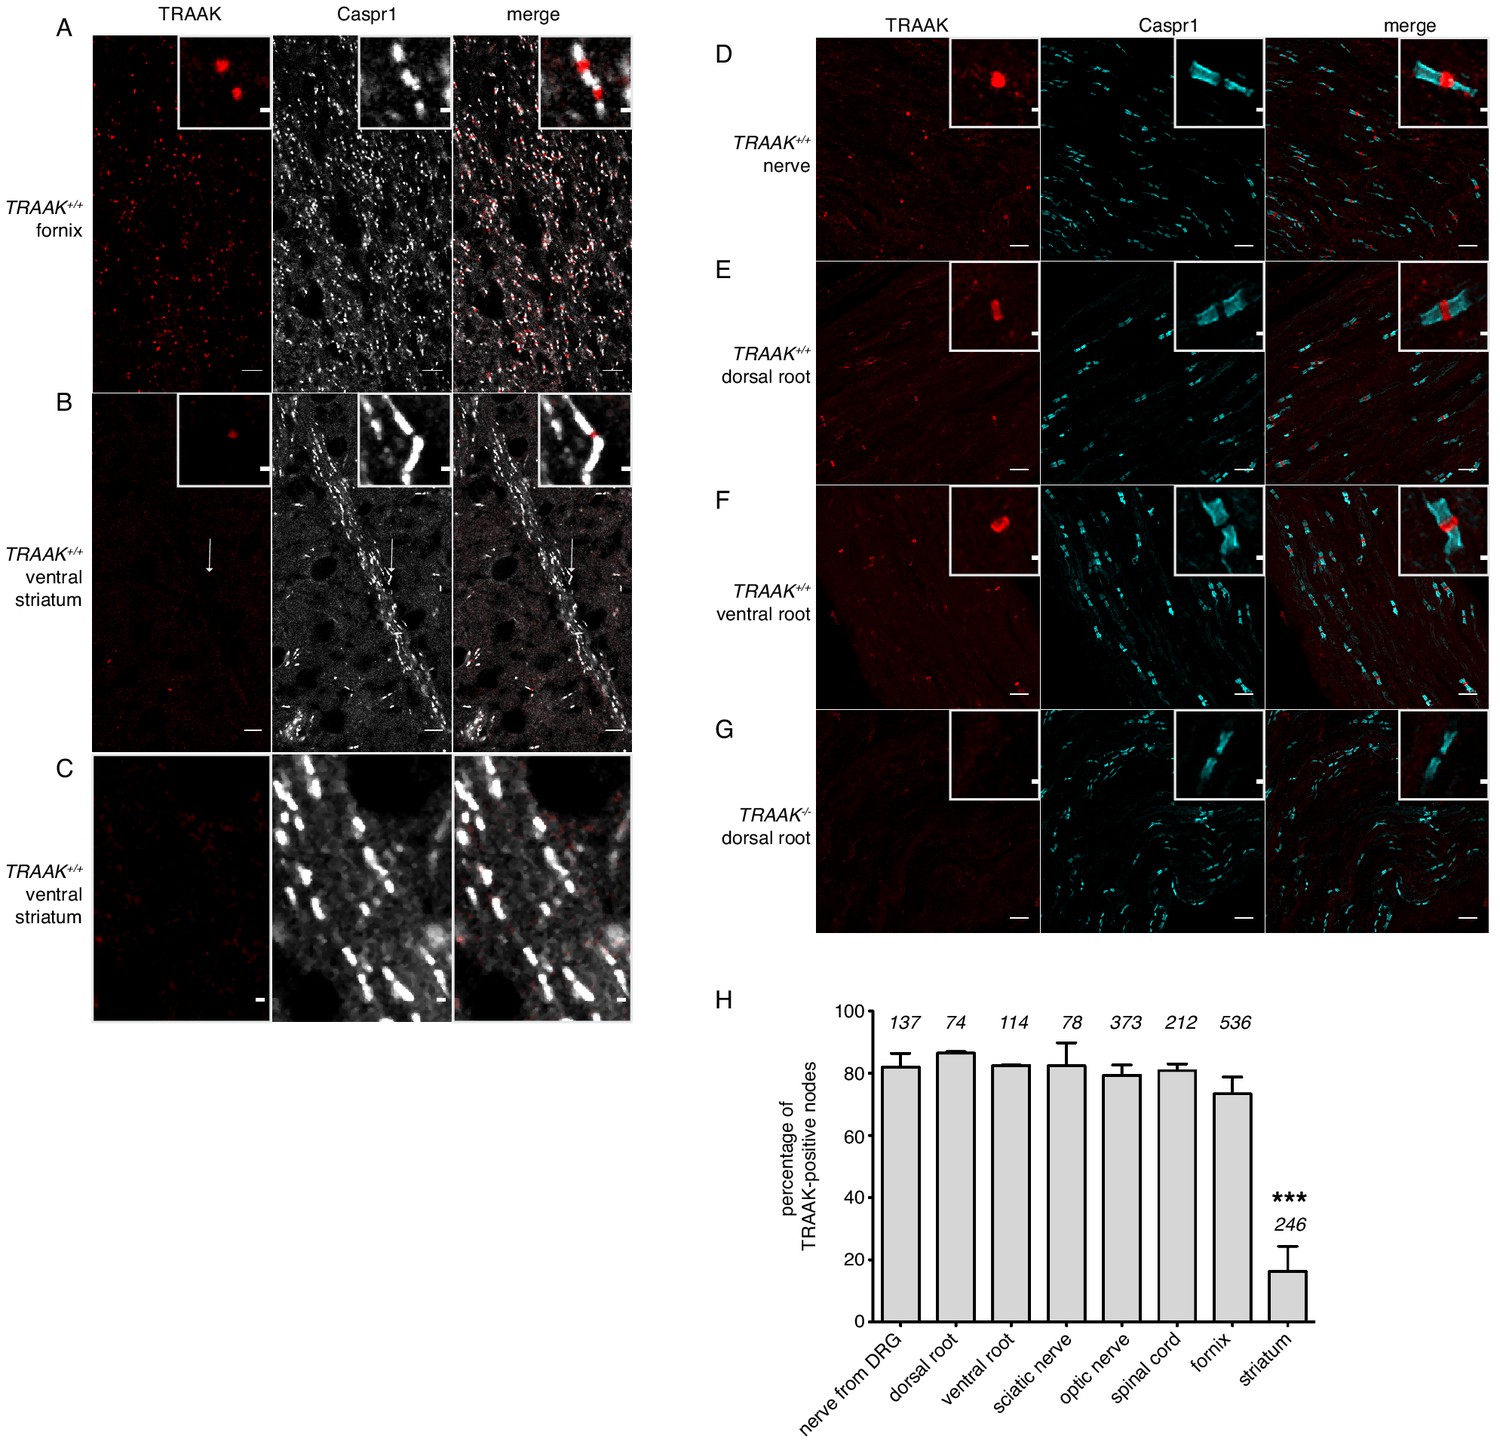
Quantification of TRAAK nodal localization.
(A,B) Immunostaining of TRAAK (red) and Caspr1 (white) in brain sections from (A) a hippocampal-proximal fiber tract in the fornix with a high percentage of TRAAK-positive nodes and (B) a fiber tract from the ventral striatum with few TRAAK-positive nodes (arrow in (B) points to a TRAAK-positive node magnified in the inset). (C) Is a magnified view of a portion of the fiber tract in B showing absence of TRAAK-immunostaining. (D–G) Immunostaining of TRAAK (red) and Caspr1 (cyan) in (D) a nerve projected from a dorsal root ganglion containing a mixed population of motor and sensory neurons, (E) a dorsal root enriched for sensory neurons and (F,G) a ventral root enriched for motor neurons from a (D–F) TRAAK+/+ and (G) a TRAAK-/- animal. Motor and sensory neurons have a similarly high percentage of TRAAK-positive nodes. Scale bars in (A,B,D–G)=10 μm. Insets show a magnified view of a single node. Scale bars in insets and (C) = 1 μm. (G) Percentage of TRAAK-positive nodes in different regions of the nervous system: nerve from DRG 82 ± 4%, dorsal root 86 ± 0.5%, ventral root 82 ± 0.2%, sciatic nerve 82 ± 7%, optic nerve 79 ± 4%, spinal cord 81 ± 2%, fornix 73 ± 5% and internal capsule/striatum 16 ± 8%. Number of nodes counted in each region is indicated above each bar. Data are mean ± standard deviation from n ≥ 3 separate images. ***p<0.0001, one-way ANOVA.
Figure 4
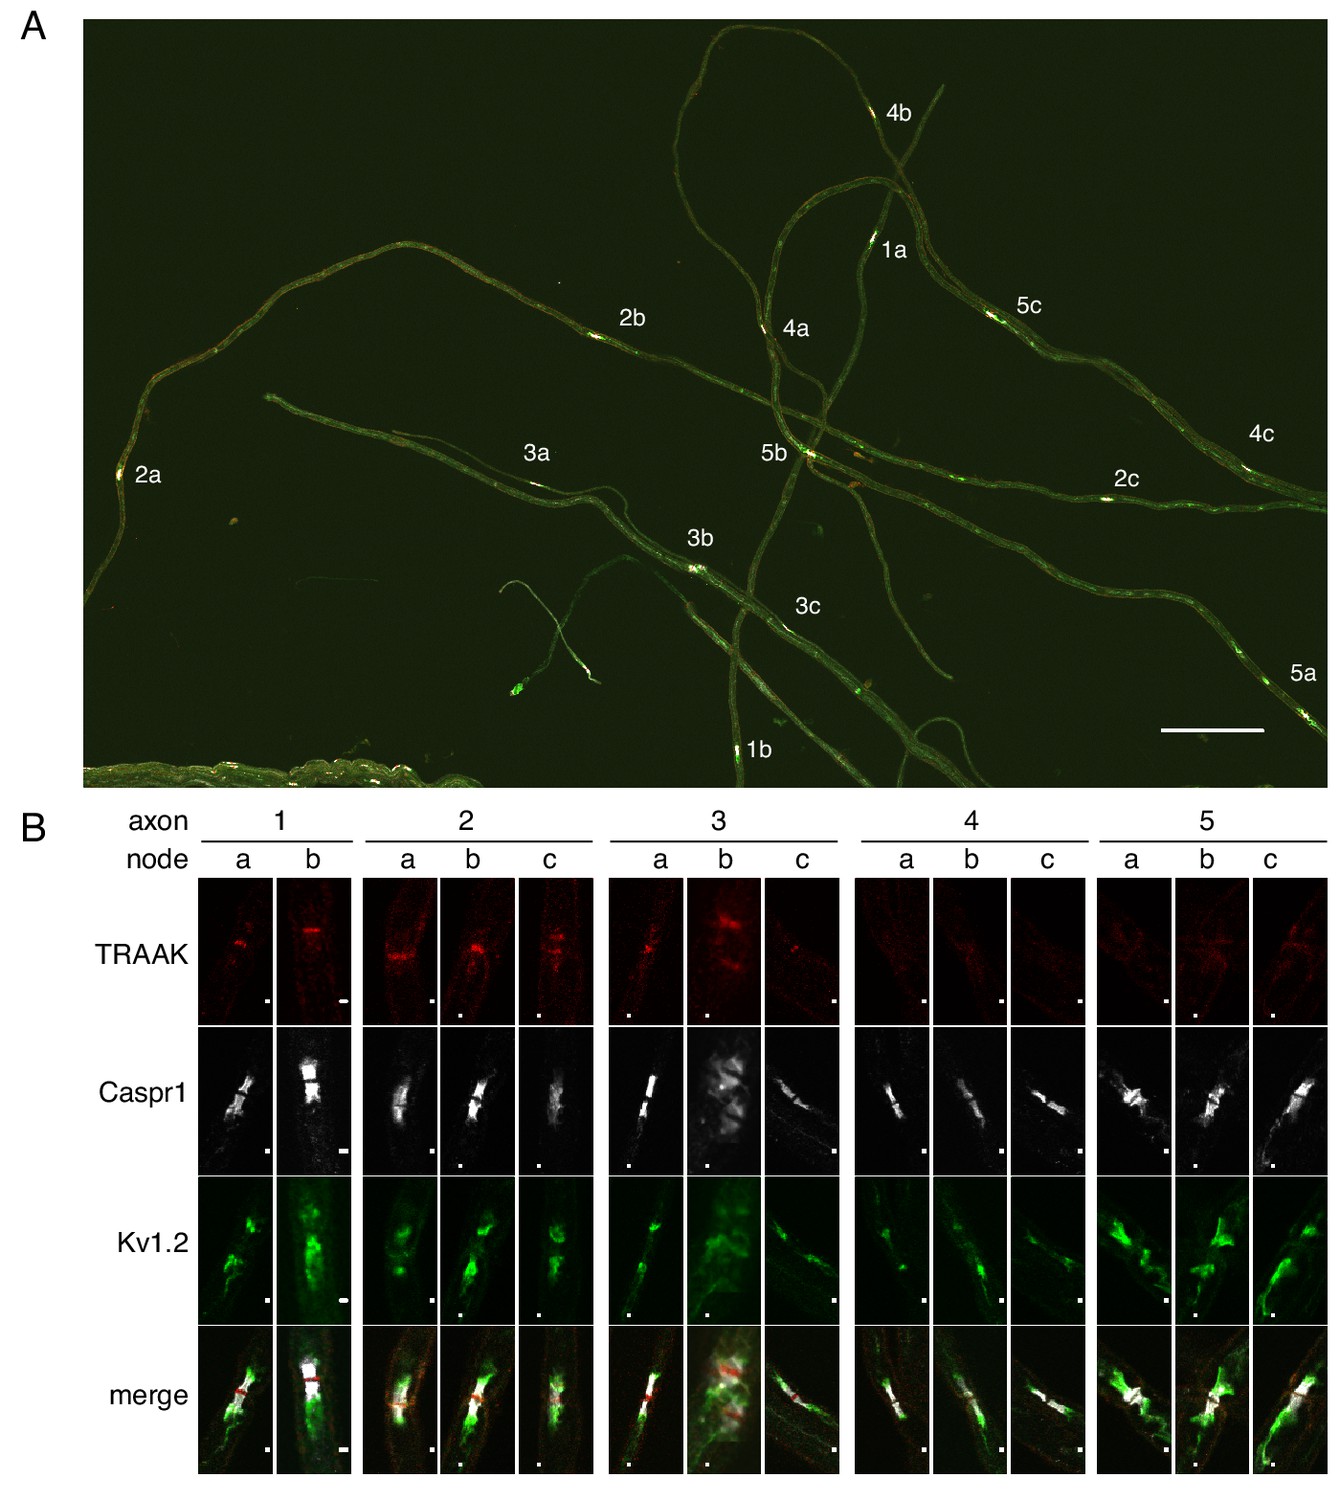
All or none distribution of TRAAK in nodes within single axons.
(A) Immunostaining of TRAAK (red), Caspr1 (white) and Kv1.2 (green) in a field of teased axons from sciatic nerve. Scale bar = 10 μm. Individual axons with multiple node-internode segments in the field are numbered (1-5) with corresponding nodes denoted by letters (a–c). (B) Magnified view of each node marked (A). Scale bar = 1 μm. Each axon has either all TRAAK-positive or all TRAAK-negative nodes.
Figure 5 with 3 supplements
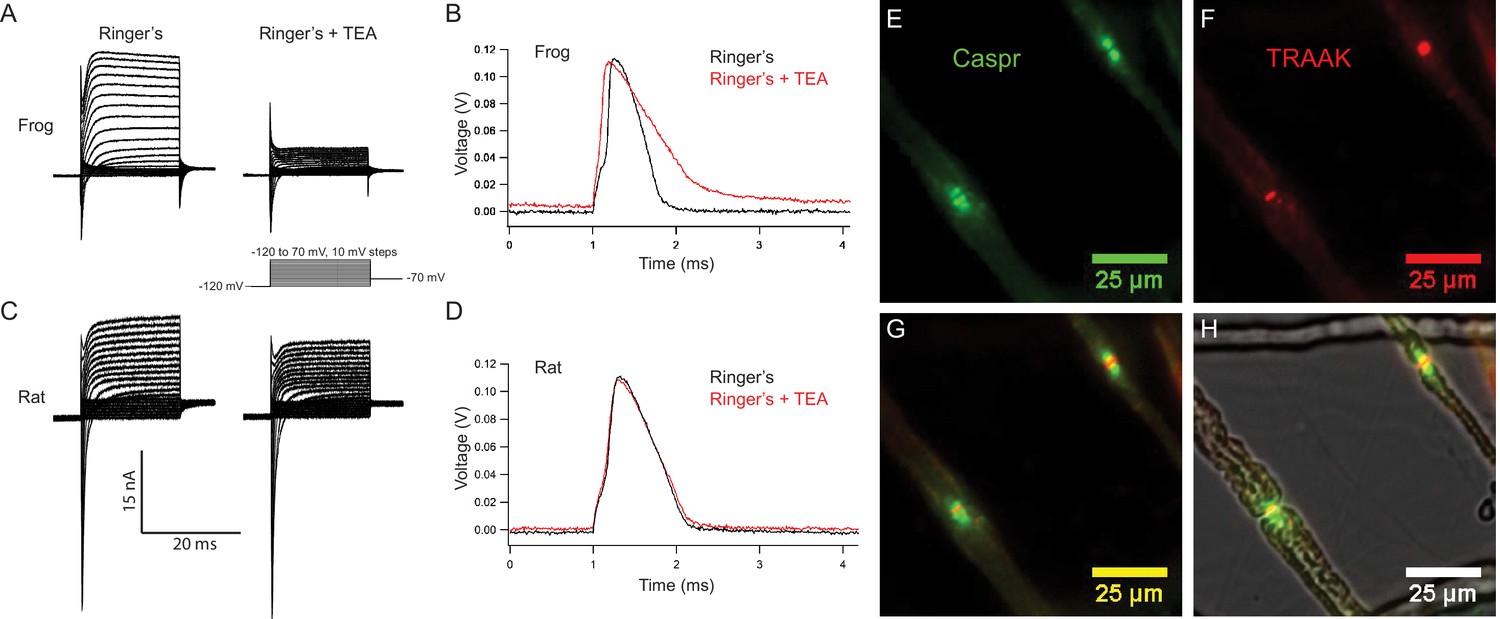
Rat nodes of Ranvier express TRAAK and are insensitive to the voltage-gated K+ channel blocker TEA.
(A–D) Representative voltage clamp and current clamp recordings from isolated single frog and rat nodes of Ranvier. (A) Voltage steps recorded in a typical frog node without (left) and with (right) 10 mM TEA. (B) Action potentials in a frog node elicited by current injection in the absence (black) and the presence (red) of TEA. Note that the duration of action potential became longer in the presence of TEA (Frog Ringer’s amplitude = 114.5 ± 1.2 mV, duration = 0.45 ± 0.006 ms (at 50% amplitude); Frog Ringers + TEA depolarization = 4.1 ± 1.7 mV, amplitude = 110.3 ± 1.3 mV, duration = 0.75 ± 0.06 ms; amplitude reduction with TEA = 4.2 ± 1.8 mV; n = 4). (C) Voltage steps recorded in a typical rat node without (left) and with (right) 10 mM TEA. (D) Action potentials in a rat node elicited by current injection in the absence (black) and the presence (red) of TEA. The duration of action potential did not change by the application of TEA. (Rat Ringer’s amplitude = 108.4 ± 2.5 mV, duration = 0.55 ± 0.02 ms (at 50% amplitude); Rat Ringers + TEA depolarization = 3.7 ± 1.0 mV, amplitude = 103.7 ± 1.6, duration = 0.61 ± 0.02 ms; amplitude reduction with TEA = 4.7 ± 3.0 mV; n = 7). Recordings were performed at room temperature. (E) Immunofluorescence of the paranodal protein CASPR (green) in dissected rat sciatic nerve fibers. (F) Immunofluorescence of TRAAK (red) in the same nerve fibers. (G) Overlay of (E) and (F). (H) Overlay of the fluorescence image in (G) with bright-field image.
Figure 5—figure supplement 1
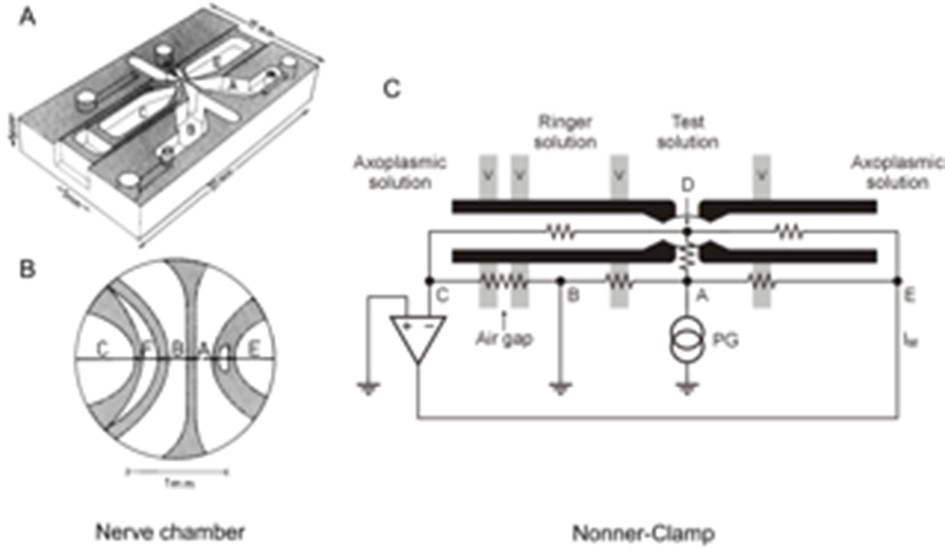
Nerve chamber and schematic of voltage clamping the node of Ranvier.
(A) Nerve chamber for recording of action potentials and membrane currents of an isolated node of Ranvier. The nerve chamber is made of transparent plastic and consists of four compartments separated by thin walls. (B) Higher magnification of the central part of the nerve chamber. A single nerve fiber is drawn as a line with the node of Ranvier indicated by a gap located in the middle of compartment A. (C) Single nerve fiber placed on top of the compartment ridges with cut internodes. The diagram demonstrates the principle of voltage clamping the node of Ranvier (Nonner, 1969). Points E, A, B and C denote electrodes dipping into the fluid of the compartments. Point D represents the axoplasm at the node. Vaseline seals (v) are placed on top of the ridges to increase the electrical resistance between the chamber compartments and to stabilize the fiber. Chamber F (shown in (B)) denotes an air gap to further increase the external resistance of the nerve fiber. PG, pulse generator. Input of the feedback amplifier is connected to electrode C and its output is connected to electrode E. For recording action potentials (current-clamp mode), the output of the amplifier was connected with electrode A and the pulse generator with electrode E.
© 2006 John Wiley and Sons. All Rights Reserved. modifed from Schwarz et al. (2006) with permission. Original image modified from Stämpfli and Hille (1976).
Figure 5—figure supplement 2
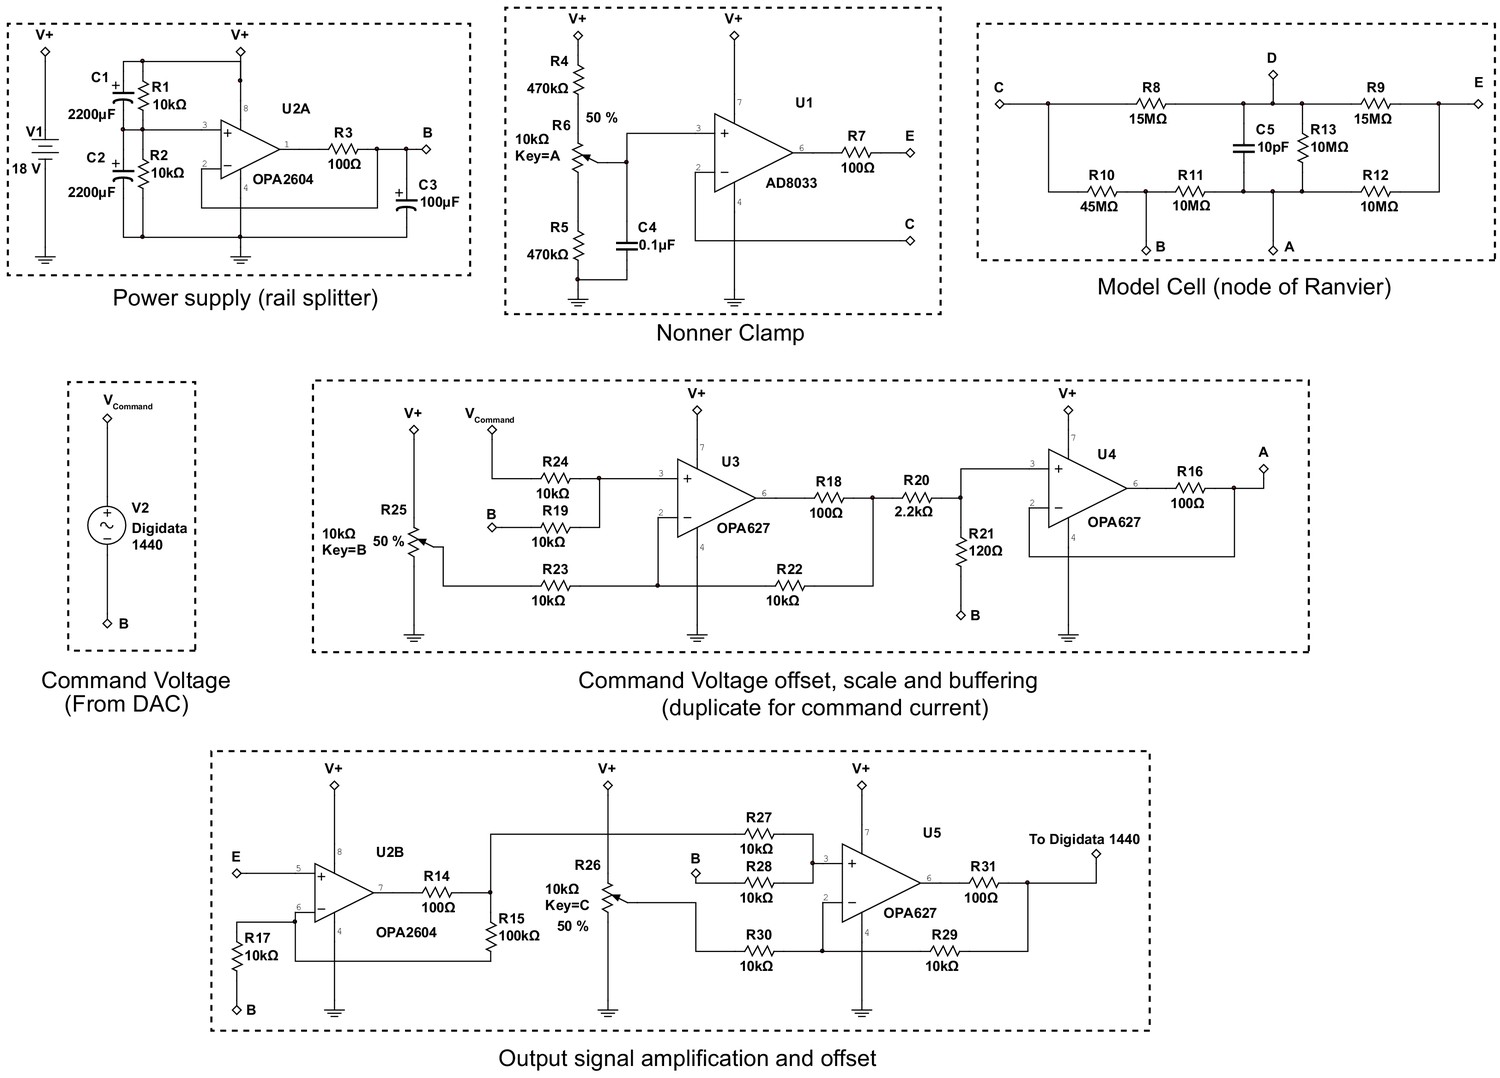
Schematic of the Node clamp based on operational amplifiers.
Batteries were used as the power supply to this amplifier. A ‘rail splitter’ circuit was used to stabilize the signal ground potential, denoted as 0 (point B, see Figure 5—figure supplement 1 and Nonner, 1969 for definition of the points A, B, C, D and E), at the half value of the battery voltage. The Nonner clamp utilized a high-speed (80 MHz) field effect transistor (FET) input operational amplifier AD8033 to provide 1012 Ω input resistance to point C. The output of the amplifier is connected to point E. The model cell emulates the passive conductance and capacitance of the isolated fiber containing a single node after mounted on the recording chamber (Figure S7). The command voltage was generated using the pClamp software through the Digidata 1440 digitizer (Molecular Devices). An offset was added to the command signal in order to allow for adjustment of the holding potential. The command is then scaled down ~19.3 fold and buffered with an operational amplifier capable of handling over 40 mA of current and connected to point A. The electrical potential of point E was buffered, summed with an offset voltage to ensure utilization of the full dynamic range of the Digidata 1440 digitizer and recorded using pClamp software on a computer disk. In the current clamp configuration, connections to points A and E were swapped.
Figure 5—figure supplement 3
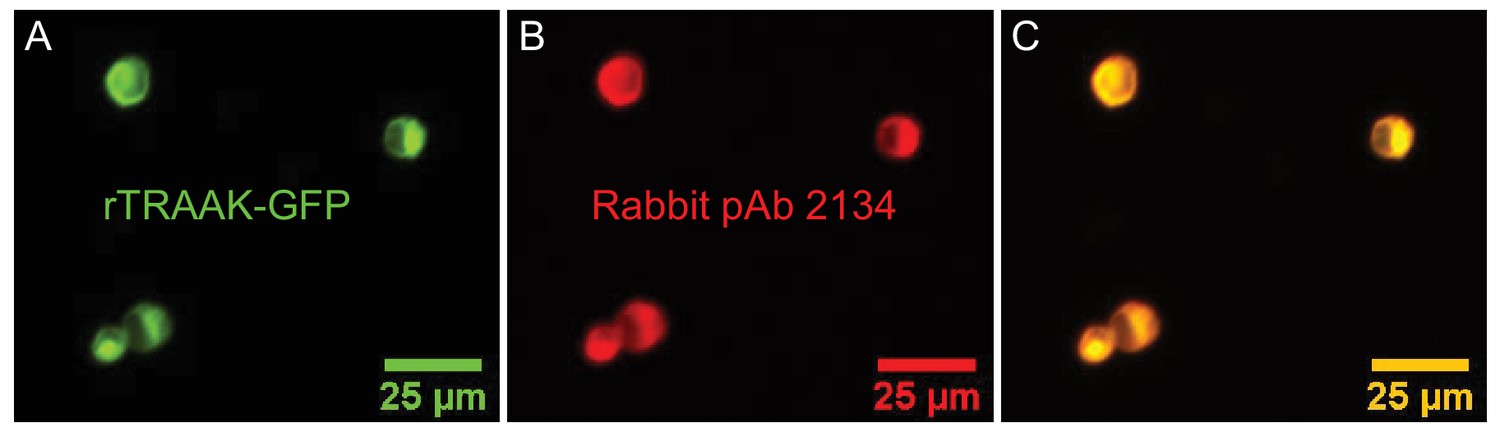
Rabbit polyclonal antibody 2134 cross-reacts with rat TRAAK.
(A) Fluorescence micrograph of HEK293T cells transfected with a rat TRAAK – GFP fusion protein. (B) Immunofluorescence of the rat TRAAK – GFP fusion protein using the Rabbit-anti TRAAK poly-clonal antibody 2134. (C) Overlay of (A) and (B).
Figure 6 with 1 supplement
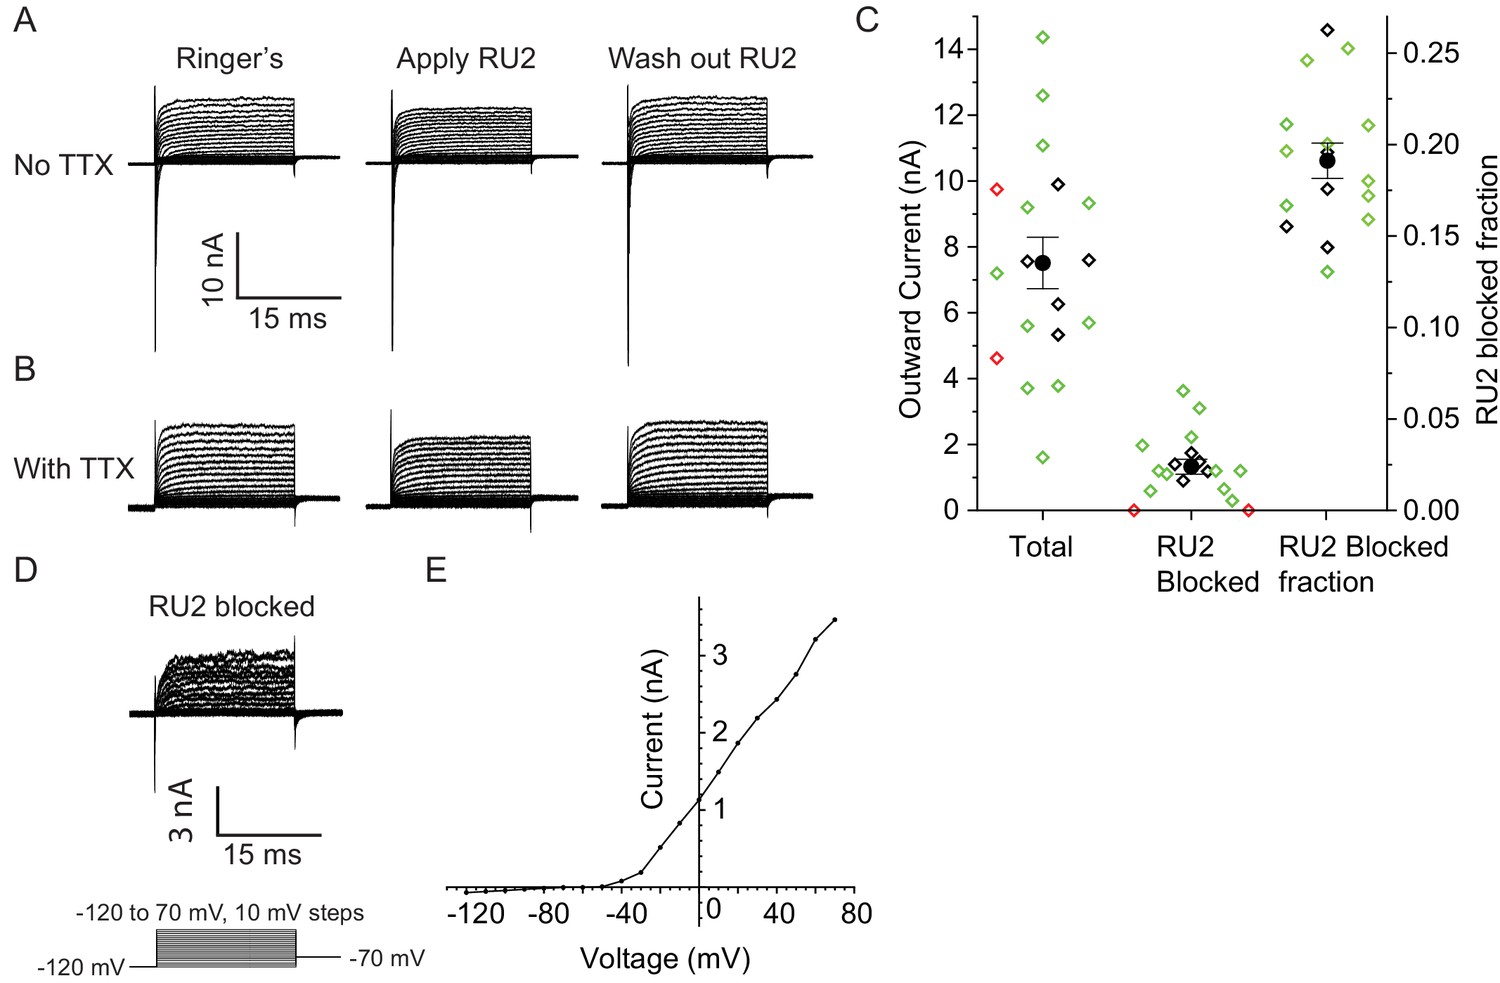
RU2 blocked current in the nodes of Ranvier in rat sciatic nerve.
Recordings were performed at 32–37°C. (A) Currents recorded during voltage steps applied to a rat nodal membrane in the absence of RU2 (left), in the presence of 20 µM RU2 (middle) and after RU2 wash out (right). (B) Same experiments as in panel A but performed in the presence of the Na+ channel blocker TTX. (C) Quantification of the total and RU2-sensitive nodal current at 50 mV from 18 nodes recorded at 32–37°C (green: no TTX, black: with TTX). 2 out of the 18 nodes did not have RU2-sensitive current (red) and were not included in the statistics. The total outward current was 8 ± 1 nA, the RU2 sensitive current was 1.5 ± 0.3 nA and the fraction of RU2 sensitive current in the total current was 0.19 ± 0.01 (mean ± S.E.M.). (D) RU2 blocked current calculated from subtracting voltage steps in the presence of RU2 (panel B middle) from that in the absence of RU2 (panel B left). (E) I-V curve of the RU2 blocked current. Data points are represented as filled circles and connected with straight line segments.
Figure 6—figure supplement 1
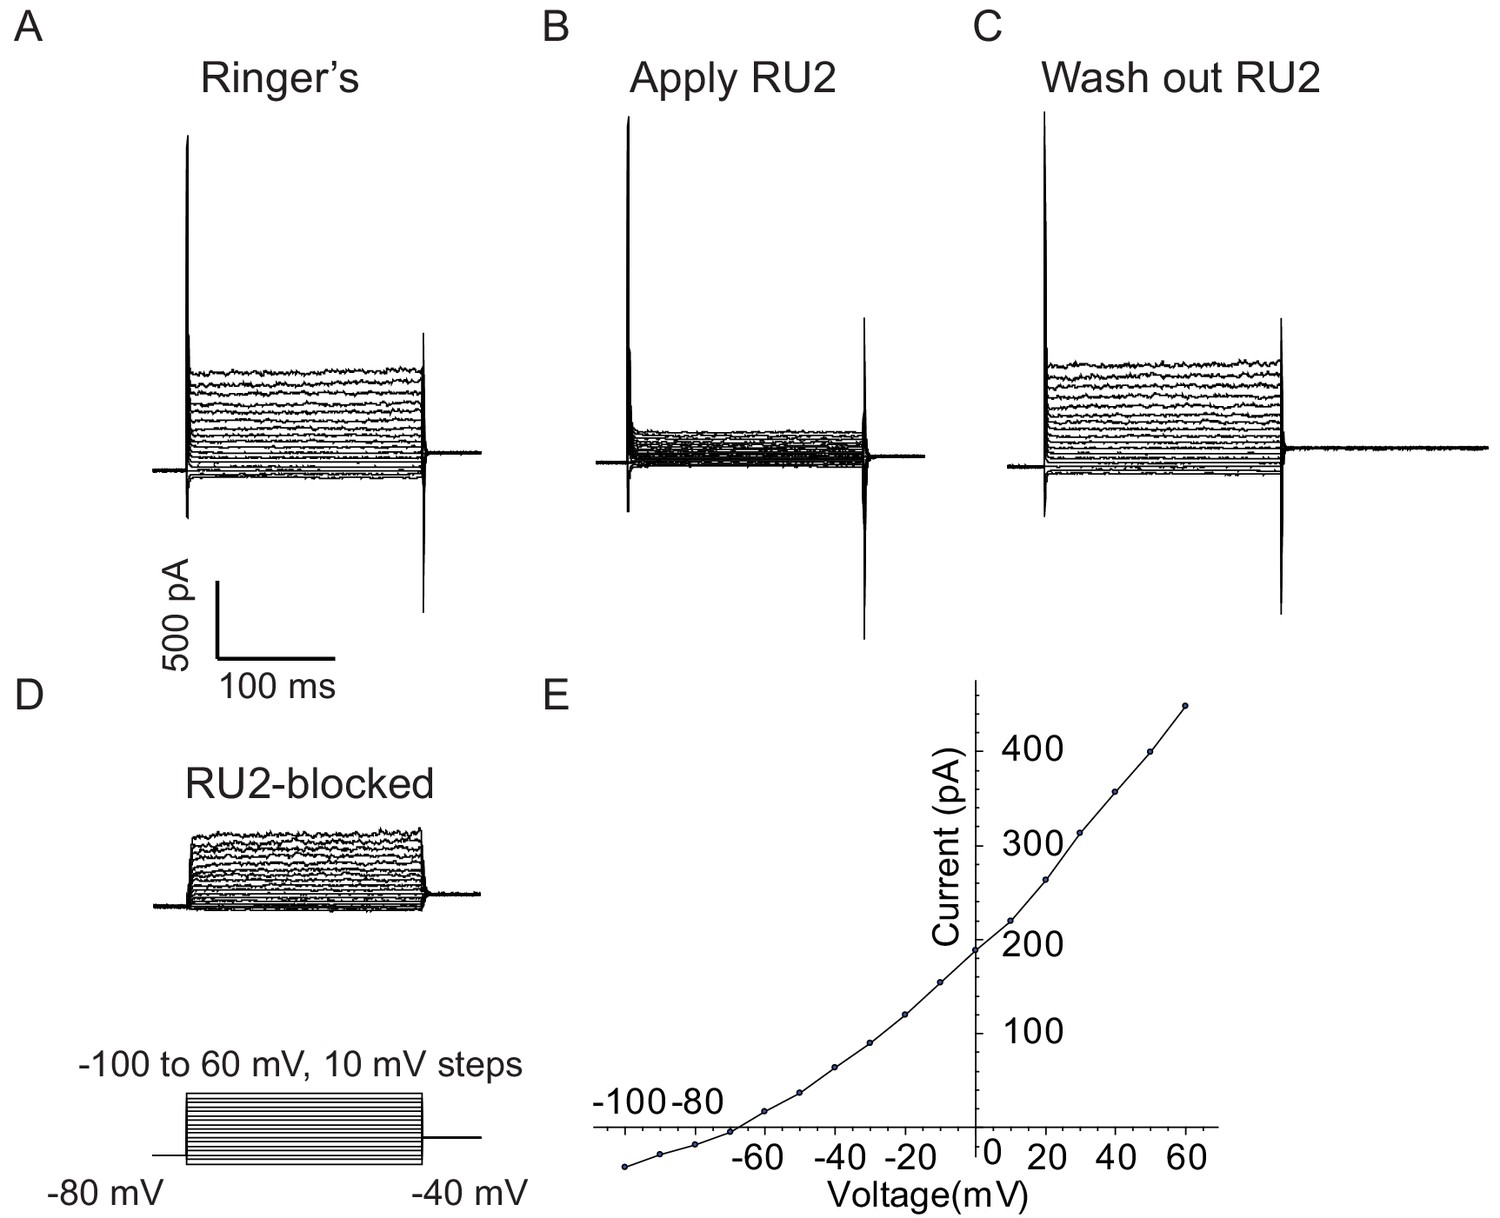
RU2 blocked current in CHO cells heterologously expressing rat TRAAK.
Experiments were performed in the whole-cell configuration at room temperature. Rat axoplasmic solution and rat Ringer’s solution (see Materials and methods) were used as internal (pipette) and external (bath) solutions, respectively. Voltage steps were recorded in the absence of RU2 (A), in the presence of 20 µM RU2 (B) and after RU2 wash out (C). (D) RU2-blocked current calculated from subtracting (B) from (A). (E) I-V curve of the RU2-blocked current. Data points are represented as filled circles and connected with straight line segments.
Figure 7
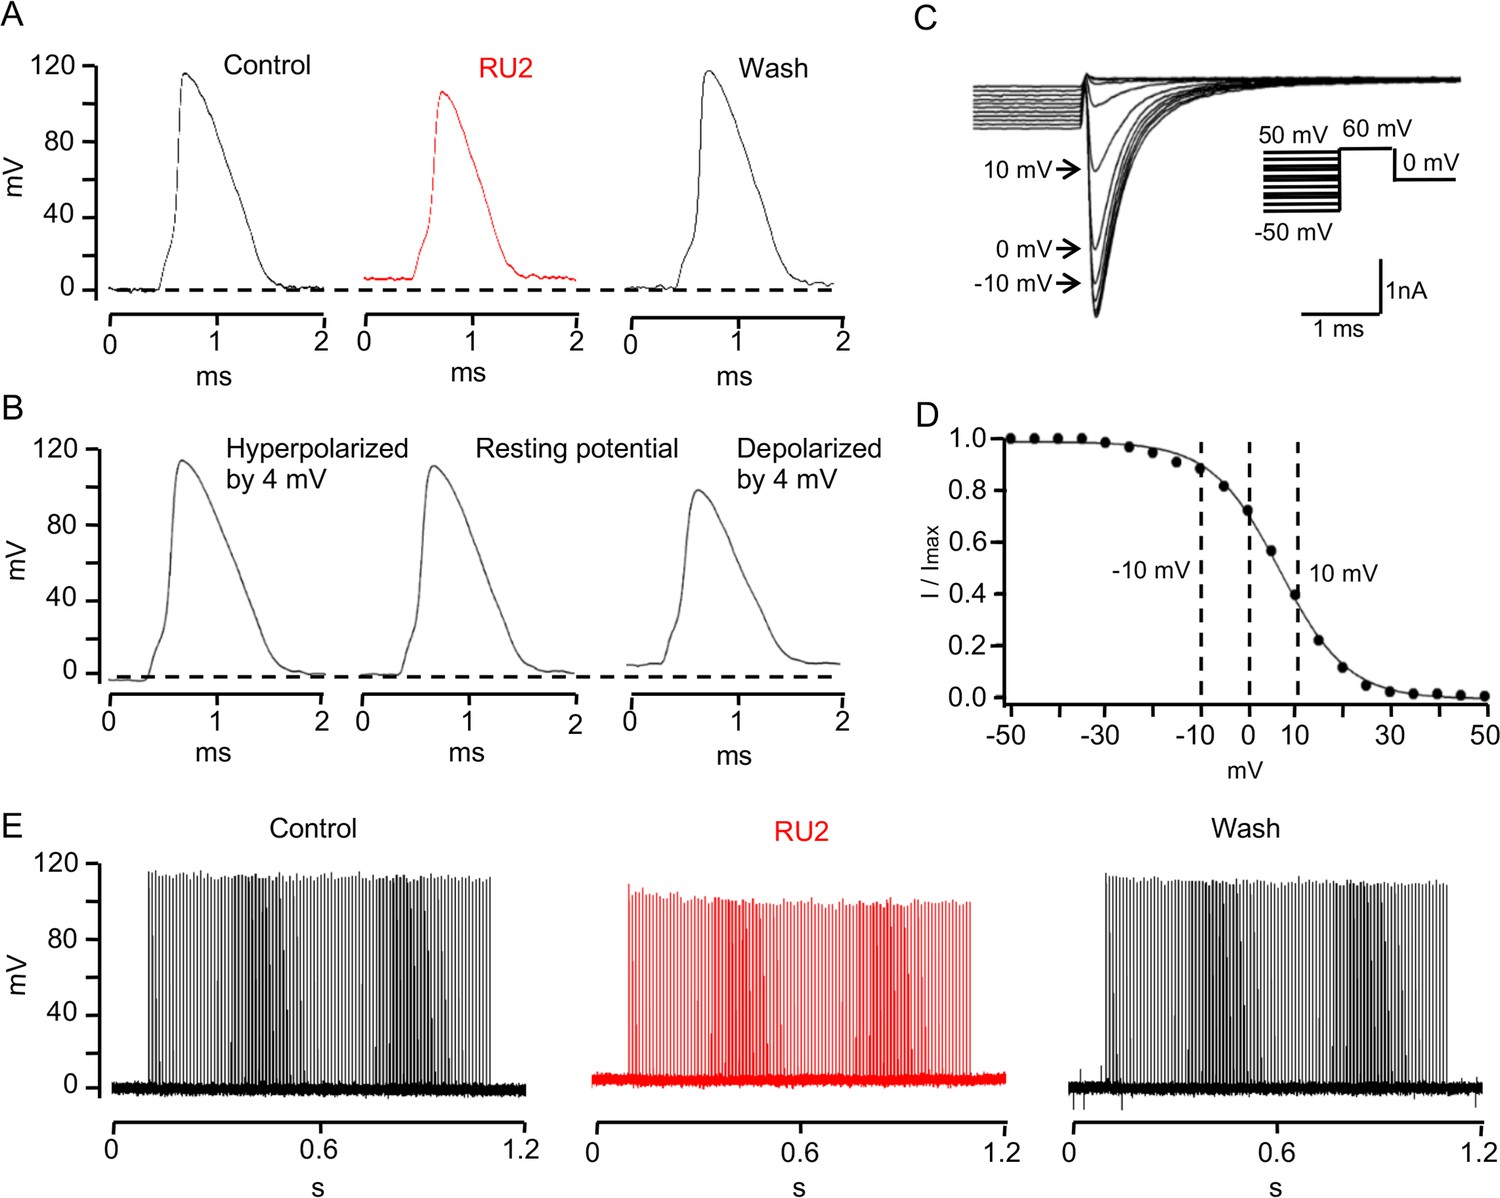
TRAAK stabilizes the resting potential of the rat node of Ranvier.
(A) Representative action potential recorded from a rat node of Ranvier before drug application (left), during application of 10 uM RU2 (red, center), and after drug wash out (right). Application of RU2 depolarized the resting potential by 4 mV and reduced the action potential amplitude. These effects could be washed out. Averaged results: control action potential amplitude = 112.1 ± 5.2 mV (n = 7); with RU2 depolarization of resting potential = 3.8 ± 0.2 mV, action potential amplitude = 98.3 ± 6.7 mV (n = 7); wash-out: repolarization of resting potential = 5.3 ± 1.0 mV, action potential amplitude = 118.3 ± 3.7 mV (n = 3). (B) Action potential recorded from a rat node of Ranvier with the resting potential hyperpolarized by 4 mV (left), at the resting potential (center) and depolarized by 4 mV (right). Hyperpolarization increased and depolarization reduced the action potential amplitude. (C) Membrane currents used to measure steady-state NaV inactivation. A 60 mV test pulse elicited a transient inward Na current (inset: pulse protocol). 50 ms depolarizing prepulses of increasing amplitude decreased the peak Na current amplitudes, hyperpolarizing prepulses of increasing amplitudes increased the Na current amplitude until a steady amplitude was obtained. (D) Normalized peak Na current amplitudes of the experiment shown in (C) plotted versus prepulse potential. (E) Repetitive stimulation (100 Hz for 1 s, 0.2 ms just suprathreshold current stimuli) of rat node of Ranvier in Ringer´s solution (control), in the presence of RU2 and after wash-out of RU2.
Additional files
-
Supplementary file 1
Data collection and refinement statistics.
- https://cdn.elifesciences.org/articles/50403/elife-50403-supp1-v1.pdf
-
Supplementary file 2
Antibodies used in this study.
- https://cdn.elifesciences.org/articles/50403/elife-50403-supp2-v1.pdf
-
Transparent reporting form
- https://doi.org/10.7554/eLife.50403.017
Download links
A two-part list of links to download the article, or parts of the article, in various formats.
Downloads (link to download the article as PDF)
Open citations (links to open the citations from this article in various online reference manager services)
Cite this article (links to download the citations from this article in formats compatible with various reference manager tools)
The mechanosensitive ion channel TRAAK is localized to the mammalian node of Ranvier
eLife 8:e50403.
https://doi.org/10.7554/eLife.50403


