Temporal chunking as a mechanism for unsupervised learning of task-sets
- Laboratoire de Neurosciences Cognitives et Computationnelles, Institut National de la Sante et de la Recherche Medicale, France
- Departement d’Etudes Cognitives, Ecole Normale Superieure, France
- Institut d’Etudes de la Cognition, Universite de Recherche Paris Sciences et Lettres, France
Figures
Figure 1
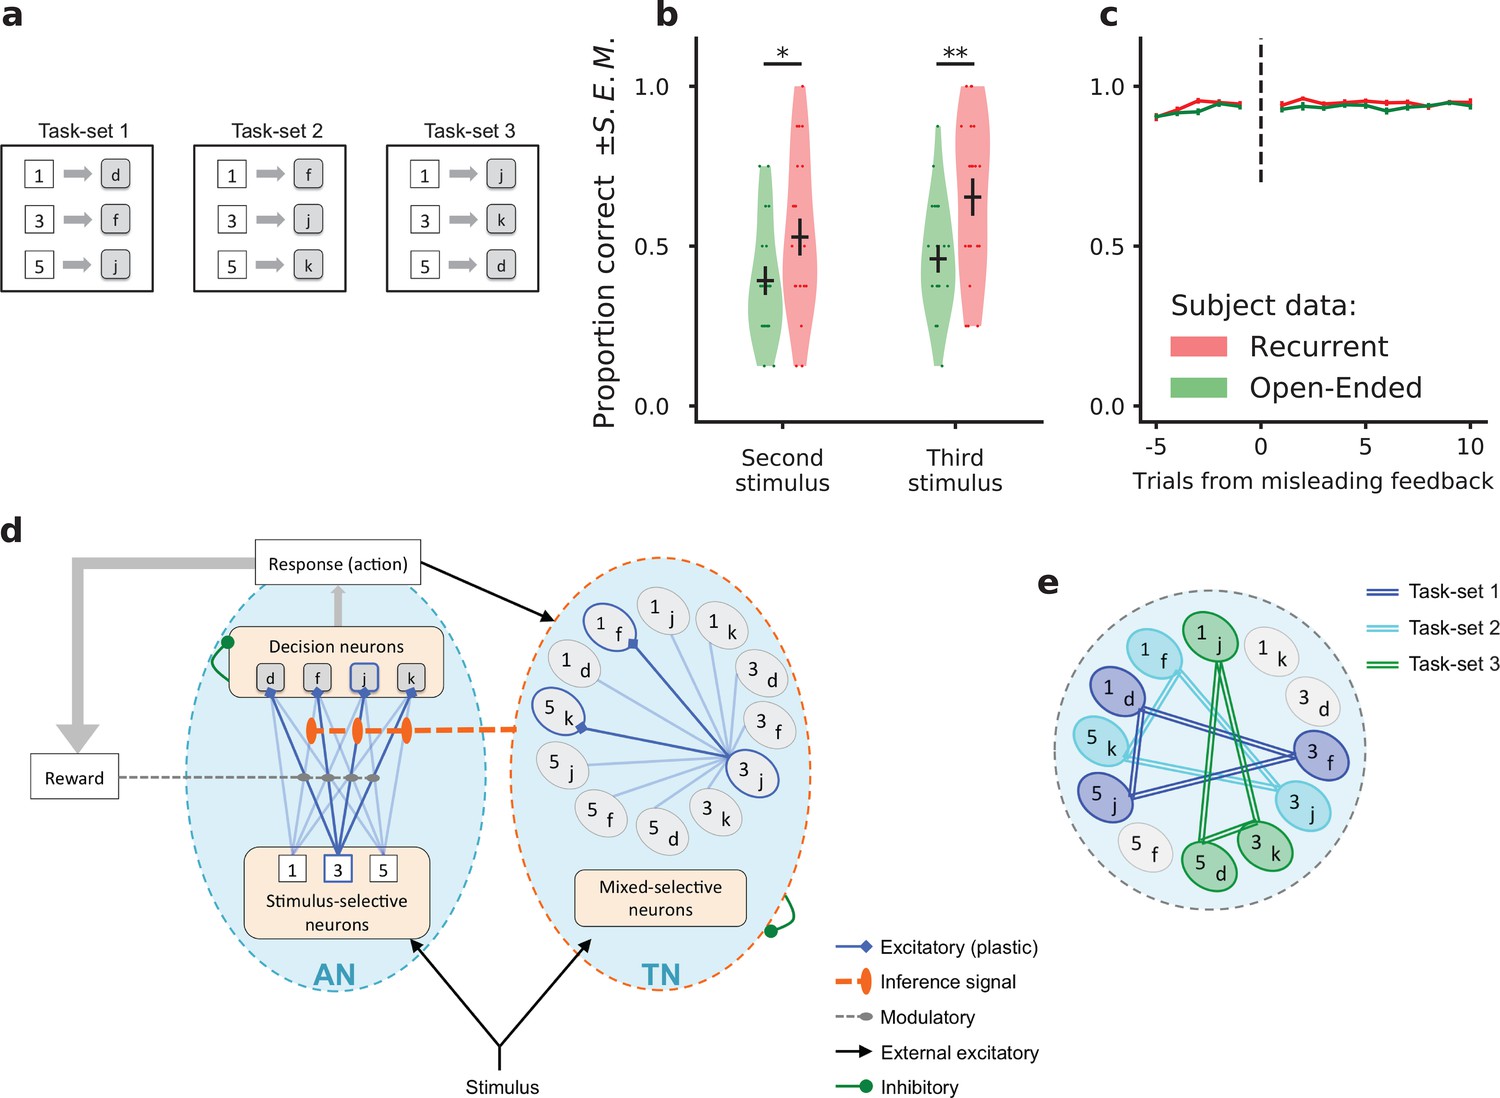
Task-set learning experiment and subject behavior.
(a) Schematic of the behavioral task. Subjects had to learn associations between visual stimuli (represented here as {1, 3, 5}) and motor responses (represented here as {d, f, j, k}). The set of correct stimulus-response associations, denoted as task-set, was fixed during a block of trials of random length. The schematic shows the three task-sets used in the recurrent session. The task-sets are non-overlapping from one episode to another in both the recurrent and the open-ended session, meaning that an episode switch produces a change of correct responses for all stimuli. (b) Proportion of correct responses to stimuli seen for the first time after the first correct response in an episode, during the last third of each experimental session. These newly seen stimuli are labeled second or third according to their order of appearance. Dots display the average for each subject. Violin plots display the shape of each distribution over subjects (Scott’s rule). The black lines outline the mean ± s.e.m. (c) Performance preceding and following a trial with misleading feedback (non-rewarded correct response), at the end of episodes, averaged over all subjects (± s.e.m.). The subjects’ performance did not change after a misleading feedback if it occured at the end of an episode, after being trained on the current task-set. (d) Illustration of the network model. The associative network (AN) is composed of a set of stimulus-selective populations and a set of action-selective populations. The synaptic weights between the two sets of populations are modified through a reward-modulated, activity-dependent Hebbian plasticity rule. At each trial, an action is selected via a soft and noisy winner-take-all mechanism with respect to the current set of synaptic weights. The task-set network (TN) is composed of neural populations selective to conjunctions of one stimulus and one action. Its activity is driven by the associative network’s activity. The sequential activation of neural populations in the task-set network induces the potentiation of the synapses between them. An inference signal from the task-set network to the associative network biases the response to the stimulus on the next trial. (e) Illustration of the perfect, fully chunked encoding in the task-set network of the three non-overlapping task-sets from the recurrent session.
Figure 2
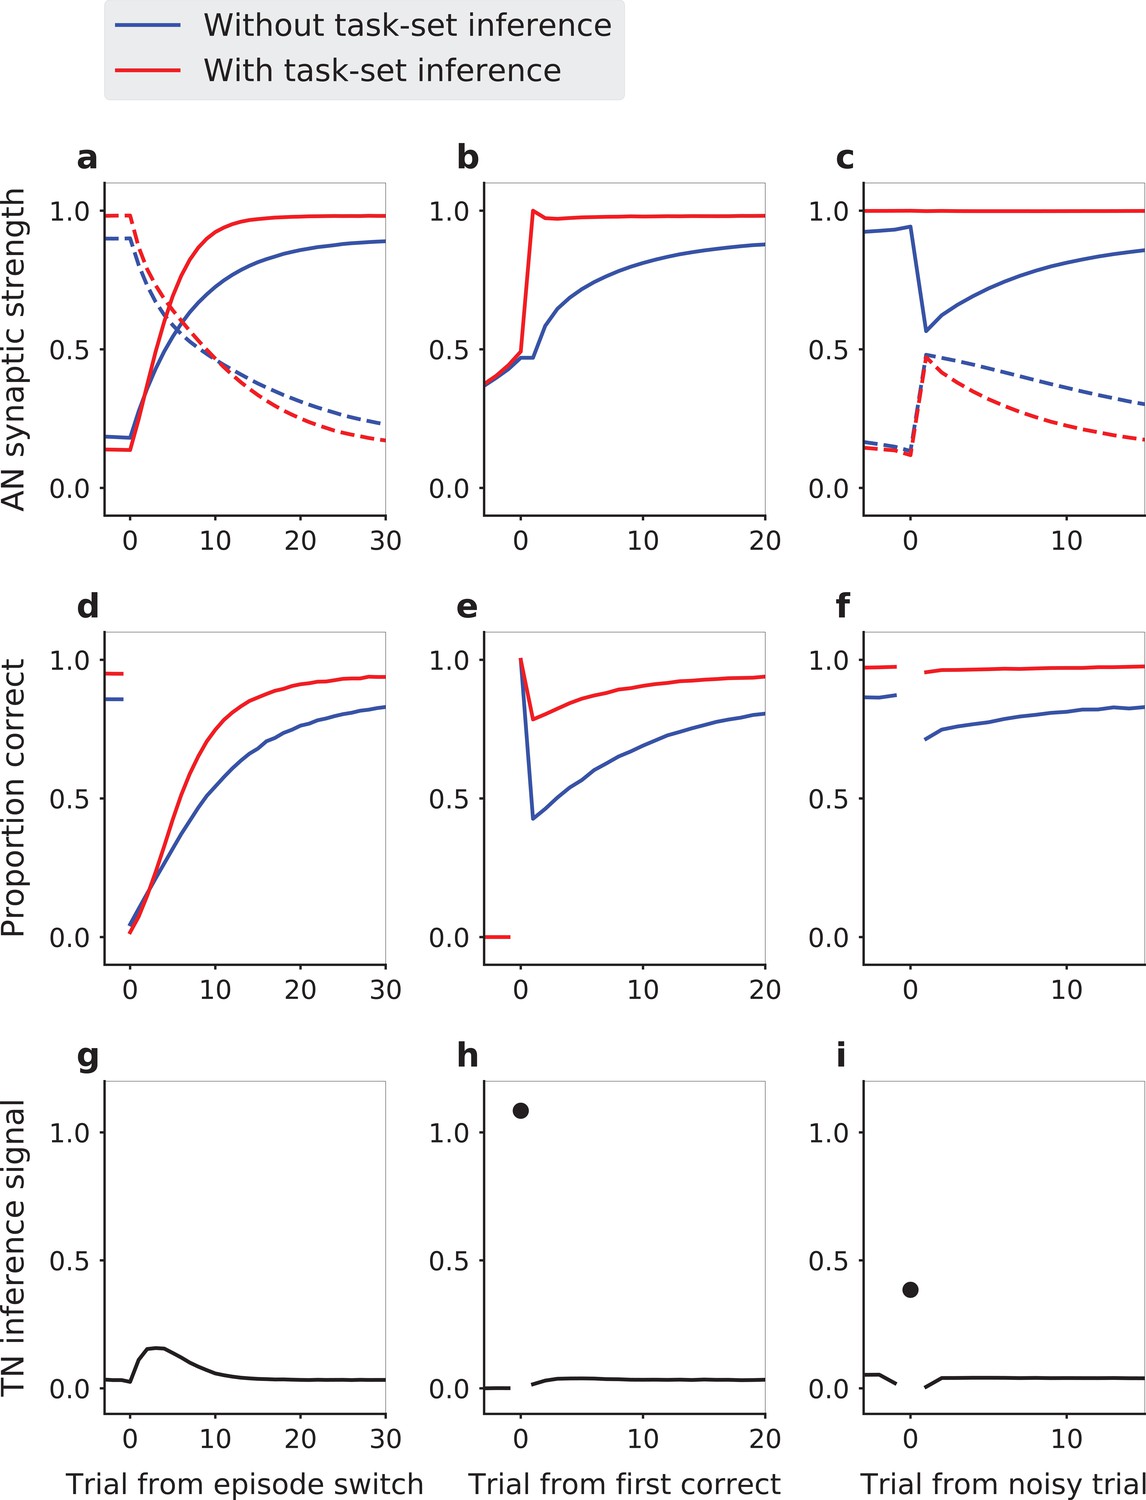
Task-set driven behavior in the network model with an idealized, perfect encoding of task-sets.
The behavior of the model is compared in presence (red lines) and in absence (blue lines) of the inference signal from the task-set network, that allows task-set retrieval. (a,d,g) Model dynamics following an episode switch (at trial zero, the correct task-set shifts without explicit indication). (a) Strengths of synapses in the associative network between neural populations representing the new task-set (solid lines) and the previous task-set (dashed lines). (d) Performance (proportion of correct responses). (g) Mean change in the AN synaptic weights due to the inference signal from the TN. Here the inference strength is one, so that the weights in the AN reach their maximal values as soon as the network makes a first correct choice, and do not change afterwards. The first correct choice takes place randomly on different trials in different episodes leading to a spread over the first trials in the episodes and vanishing changes towards the end of the episode. (b,e,h) Task-set retrieval: same quantities as in (a,d,g), but aligned at the time of the first correct response. (c,f,i) Effect of misleading feedback: same quantities as in (a,d,g), aligned on a misleadingly non-rewarded correct trial at the end of episodes. Average of 5000 sessions of 25 episodes, with 10% of noisy trials. Network parameter values: , , , .
Figure 3 with 2 supplements
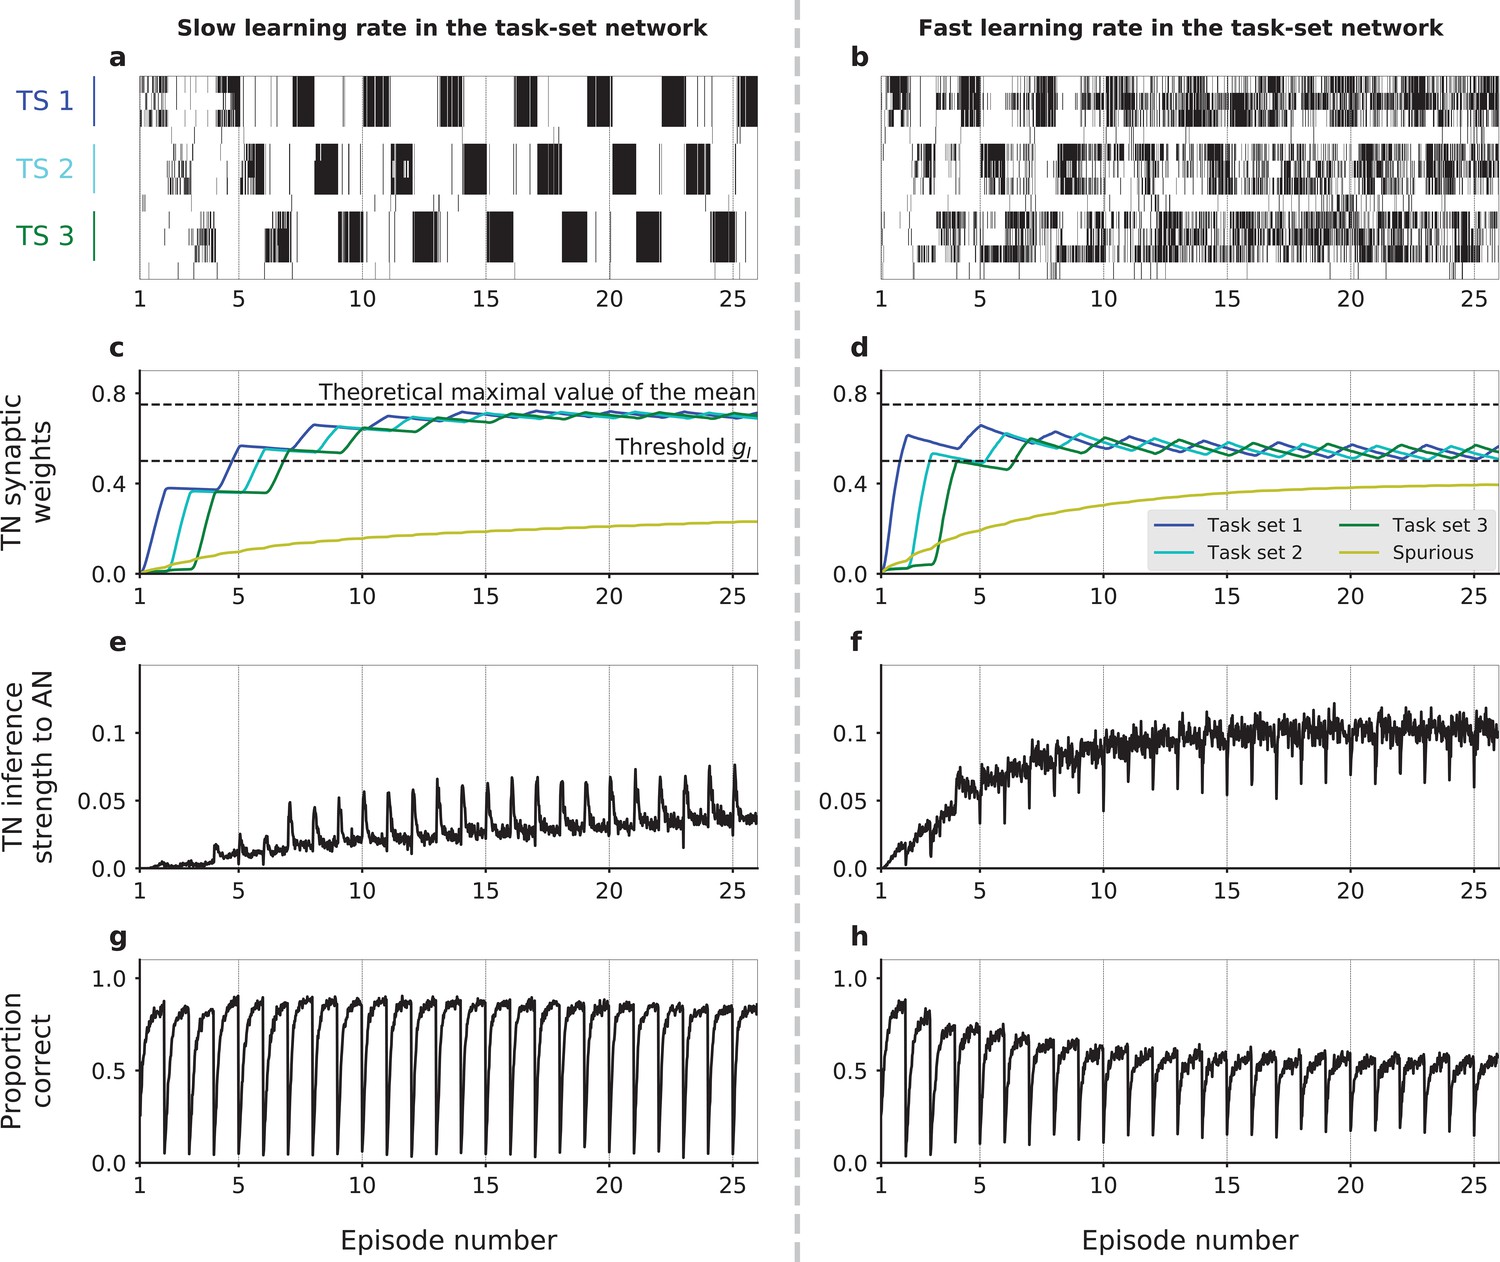
Dynamics of task-set learning.
Left column: slow learning rate in the task-set network (TN) (); right column: fast learning rate in the task-set network (). (a,b) Activation of neural populations in the task-set network as a function of time during one session. In (a), learning dynamics proceed correctly and lead to the chunking of populations that correspond to the same task-set. As a result, the activation of one stimulus-response association causes the co-activation of the other two in the same task-set. In contrast, in (b) learning does not proceed correctly and chunking does not take place. (c,d) Average values of task-set network synaptic strengths between neural populations corresponding to each of the three correct task-sets, as well as ‘spurious’ synaptic strengths between neural populations from different task-sets or that do not correspond to any task-set at all. (e,f) Average value of the inference signal from the task-set network to the associative network connectivity. (g,h) Performance of the network. Task-sets presentation is periodic for illustration purposes. (a,b) corresponds to 1 run of the recurrent session. (c,d,e,f,g,h) corresponds to the average over 500 runs of the recurrent session. The values of parameters other than were , , , and . .
Figure 3—figure supplement 1
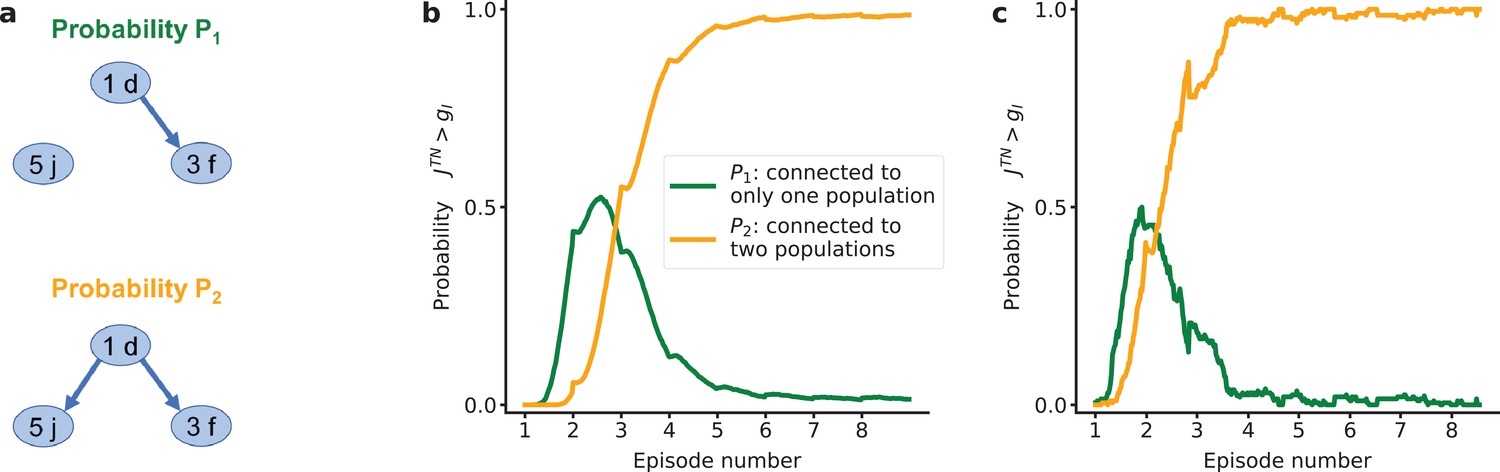
The chunking of 3 stimulus-action associations into a single task-set is gradual.
(a) For the recurrent session, we study the probability that a neural population is connected (synaptic weight above the inhibition threshold ) to only one neural population of the task-set and the probability that a neural population is connected to the two other neural populations of the recurrent task-set. (b) This is first plotted using the same simulated data as Figure 3a,c,e,g. Parameters values are , , , and . Note the slight unlearning of task-sets at the beginning of each episode, because of unlearning due to errors following the switch encoded in an unsupervised way in the task-set network. (c) This is plotted when the model is ran of subjects’ behavior with fitted parameters.
Figure 3—figure supplement 2
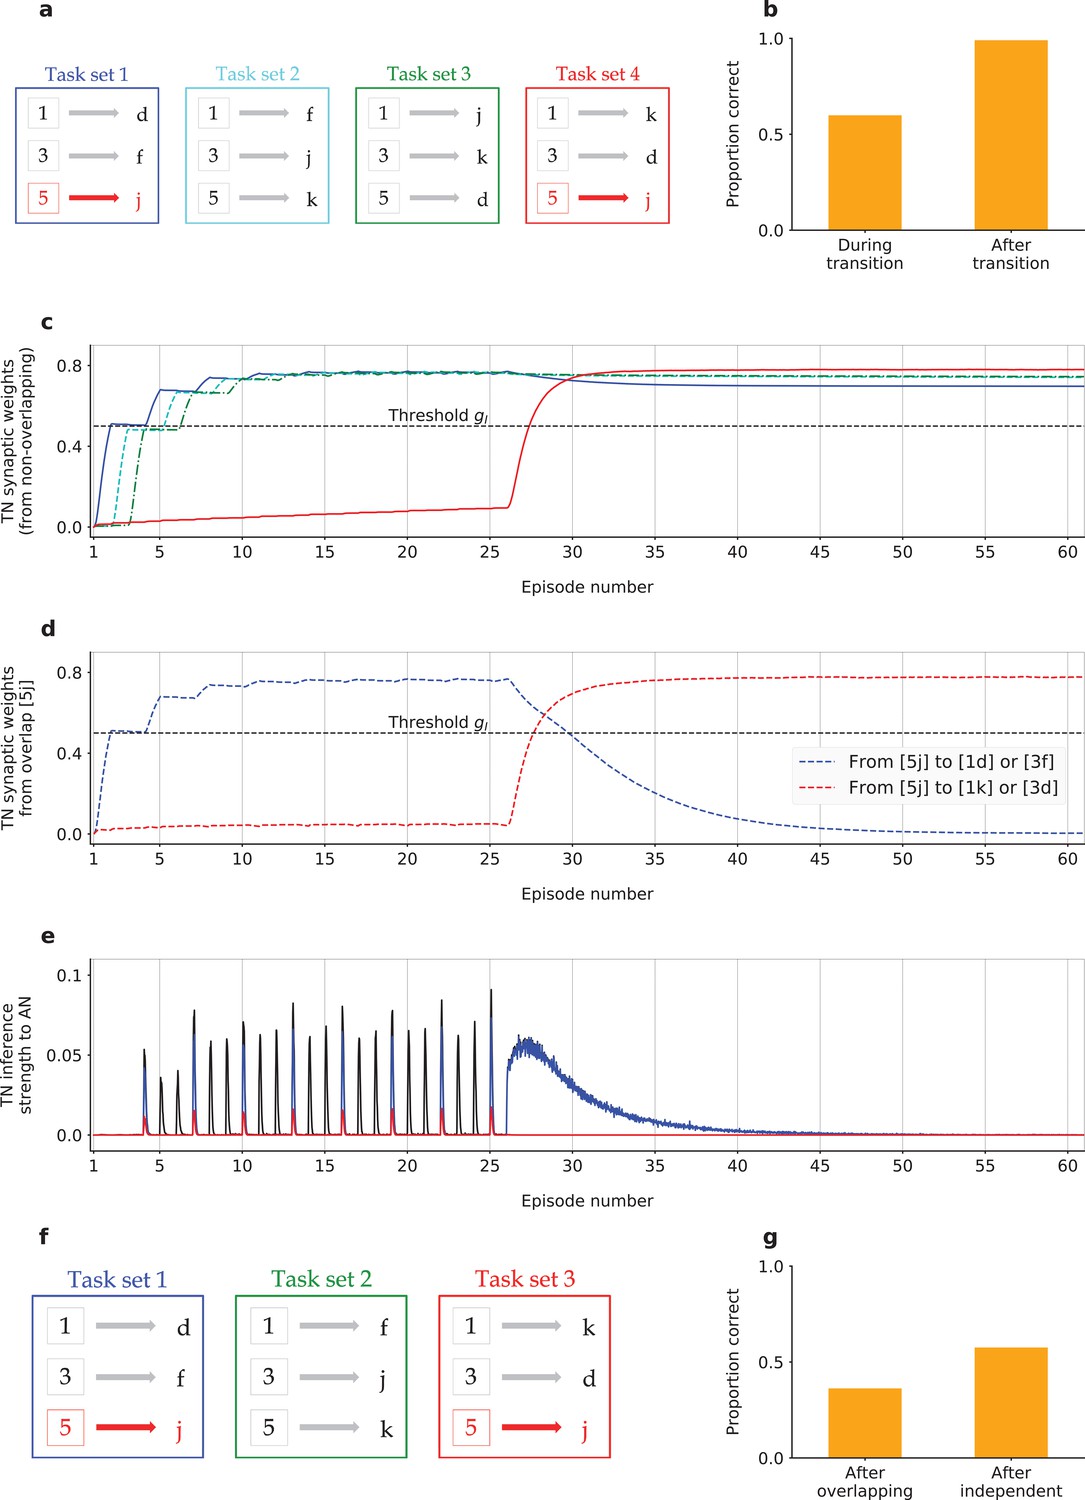
Learning overlapping task-sets.
(a-e) Learning a new task-set that partially overlaps a previously learned one. (a) The model is simulated for the three non-overlapping task-sets of the recurrent session for episode 1 to 25, as in Figure 3a,c,e,g. After episode 25, we introduce a fourth task-set that has one overlapping stimulus-action association with task-set 1 (association [5 j]). (b) Performance after the first correct trial for association [5 j] of each episode. Trials were classified depending on whether the episode was between number 25 and 30 (‘during transition’), or after 35 (‘after transition’). As expected, the model predicts a lower performance during the transition, because of incorrect inference of task-set one from the TN to the AN. (c) Average values of task-set network synaptic strengths between neural populations corresponding to each of the three correct task-sets, excluding the strengths from the neural population selective to the overlapping association [5 j]. Task-set four is learned in the task-set network from episode 26. (d) Average value of the task-set network synaptic weights from the neural population selective to the overlapping association [5 j], to neural populations selective to non-overlapping associations, for task-set 1 (in blue) and task-set 3 (in red). Pre-activated depression from the overlapping association [5 j] implicated in the learning of task-set four produces unlearning of connexions between [5 j] and correct associations of task-set 1 ([1d] and [3 f]), thus unlearning of task-set 1. (e) Average value of the inference signal from the task-set network to the associative network connectivity. This inference signal is represented in blue for task-set 1, and in red for task-set 4. At episode 26, the inference is initially incorrect (inference towards task-set one each time the overlapping association [5 j] is activated in the task-set network). As weights for task-set one go below the threshold , this incorrect inference goes to zero. (f,g) Learning three task-sets when two overlap from the beginning. (f) Task-set one and task-set three are overlapping (association [5 j]). (g) Performance after the first correct trial of each episode, in all episodes where either task-set one or task-set three were correct. Trials were classified depending on whether the correct association made was the overlapping [5 j] or a non-overlapping one (‘independent’). As expected, the model predicts a lower performance after the overlapping association, because of incorrect inference of both task-sets from the TN to the AN. Task-sets presentation is periodic for illustration purposes. The simulation corresponds to the average over 500 runs of the recurrent session. Parameters values are , , , and . For clarity, we did not introduce tricky trials in these simulations.
Figure 4
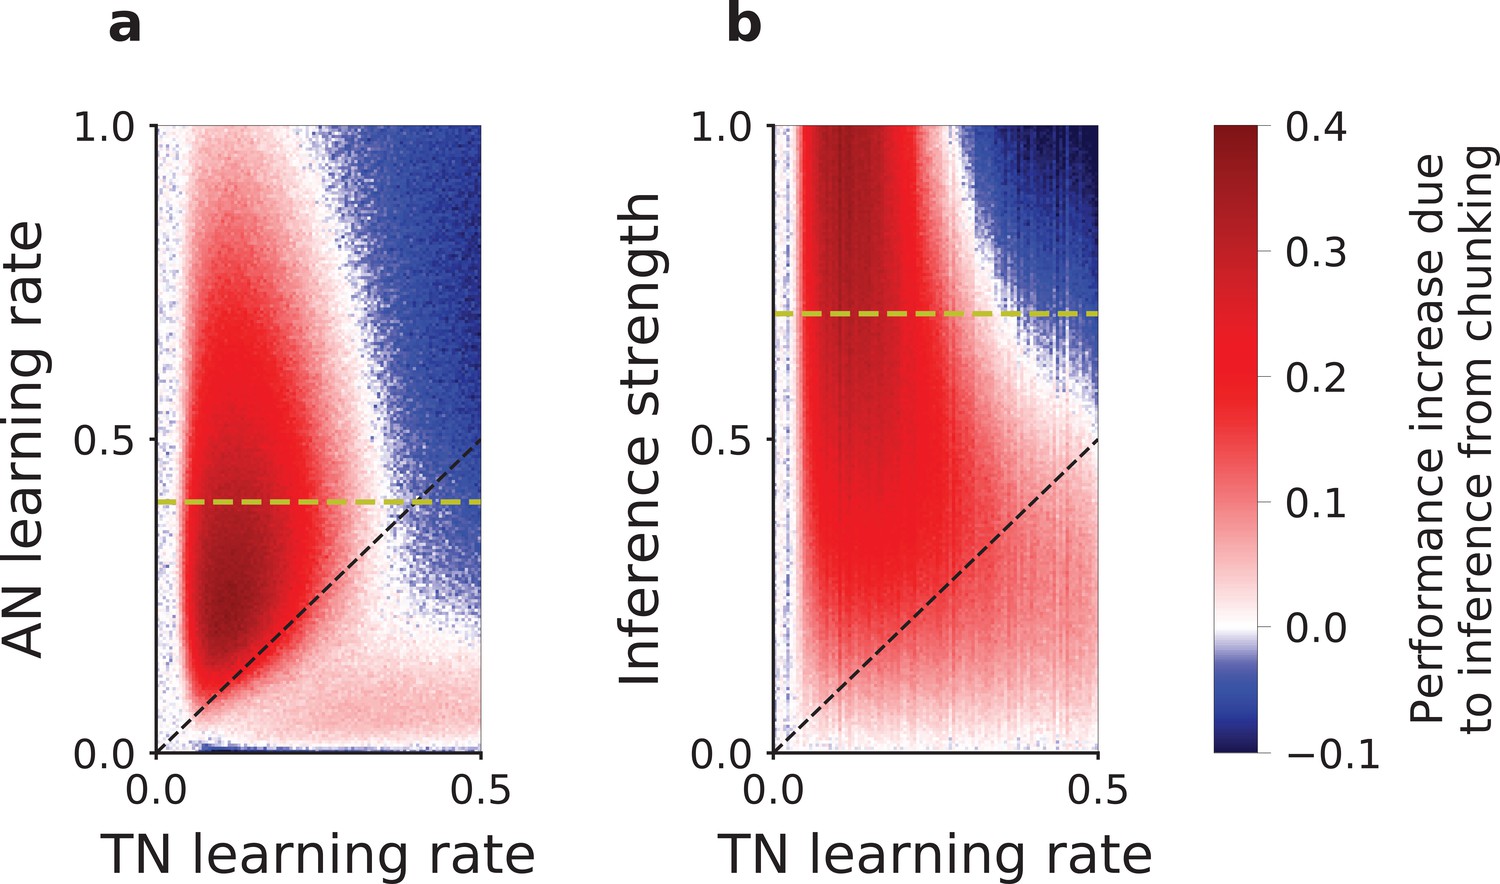
Slow versus fast learning: conditions for correct encoding of task-sets in the network model.
(a) Difference in the performance of the network model with or without task-set inference, plotted as a function of the associative network learning rate and the task-set network learning rate , (with and inference strength ). (b) Same difference in performance but plotted as a function of the inference strength and the task-set network learning rate , (with and associative network learning rate ). We computed the performance averaged over the five first correct responses for a stimulus, in the last third of the session, on an average of 200 runs of the recurrent session and with 10% noisy trials. The dashed black lines mark the diagonal. The dashed yellow lines correspond to and respectively, and relate (a) to (b).
Figure 5 with 3 supplements
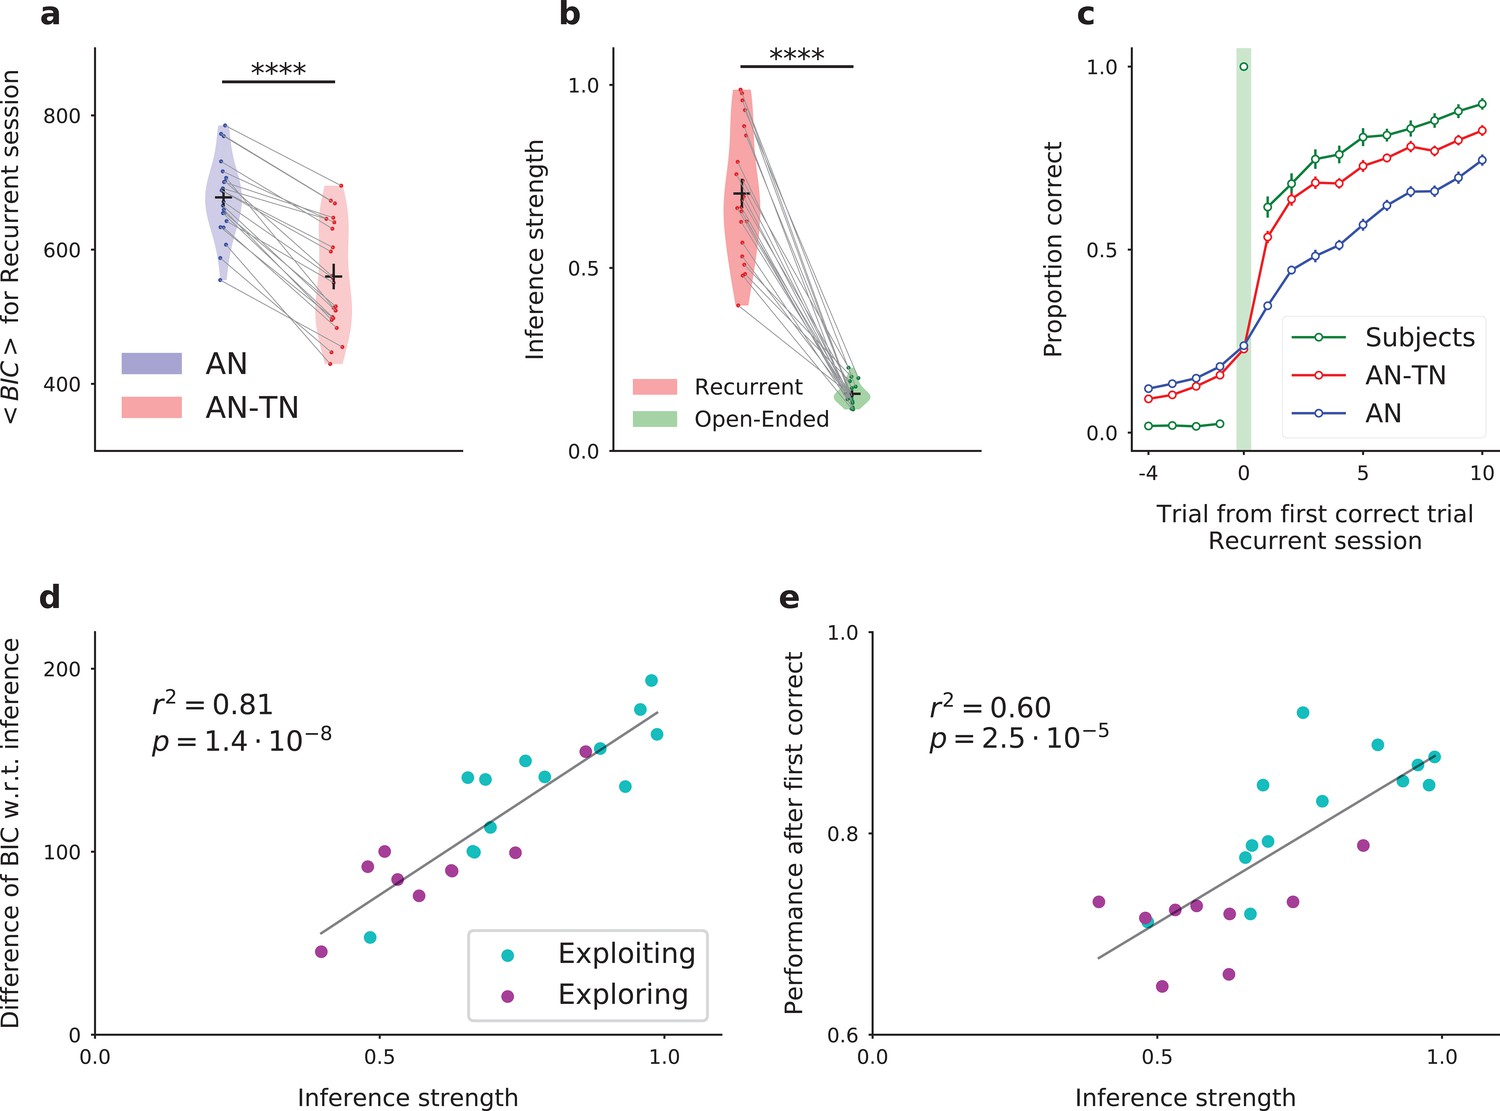
Fitting the model to experimental data: the model with inference (AN-TN) captures the statistical structure of the data, and accounts for the variability between subjects.
(a) Model comparison for the recurrent session. Bayesian Information Criterion (see Materials and methods) for the models with and without task-set inference. The model provides a significantly better fit with inference than without. (b) Estimate of the inference strength from the task-set network to the associative network connectivity in the model with task-set inference, for both sessions. (c) Proportion correct around the first correct trial, averaged over episodes and over subjects, for the recurrent session. (d) Subject by subject difference between BIC values obtained for models with and without task-set inference, as a function of the inference strength parameter, for the recurrent session. Subjects are classified as ‘exploiting’ or ‘exploring’ from a post-test debriefing. The grey line displays a least-squares regression. (e) Subject by subject performance following the first correct trial in an episode, as a function of the inference strength parameter, for the recurrent session. The performance was computed by considering the 10 trials following the first correct trial of each episode. The grey line displays a least-squares regression. .
-
Figure 5—source data 1
The table summarizes the full network (AN-TN, with inference) and the associative network alone (AN, without inference) models fitting performances and average parameters.
DF, degrees of freedom; AIC, Akaike information criterion; BIC, Bayesian information criterion; , learning rate in the AN; , decision noise; , uncertainty; , learning rate in the TN; , inference strength. All are expressed as mean ± s.e.m.
- https://cdn.elifesciences.org/articles/50469/elife-50469-fig5-data1-v2.xlsx
Figure 5—figure supplement 1

Model comparison for the recurrent session.
(a) Bayesian Information Criterion (see Materials and methods) for the models with and without task-set inference, for Experiment 2. The model provides a significantly better fit with inference than without (, ). (b) Proportion correct after an episode switch, averaged over episodes and over subjects, for Experiment 1. (c,d) Opposite of model log-likelihood averaged per trial for the models with and without task-set inference, for Experiment 1 (d) and Experiment 2 (e). The model provides a significantly better fit with inference than without (respectively , and , ).
Figure 5—figure supplement 2
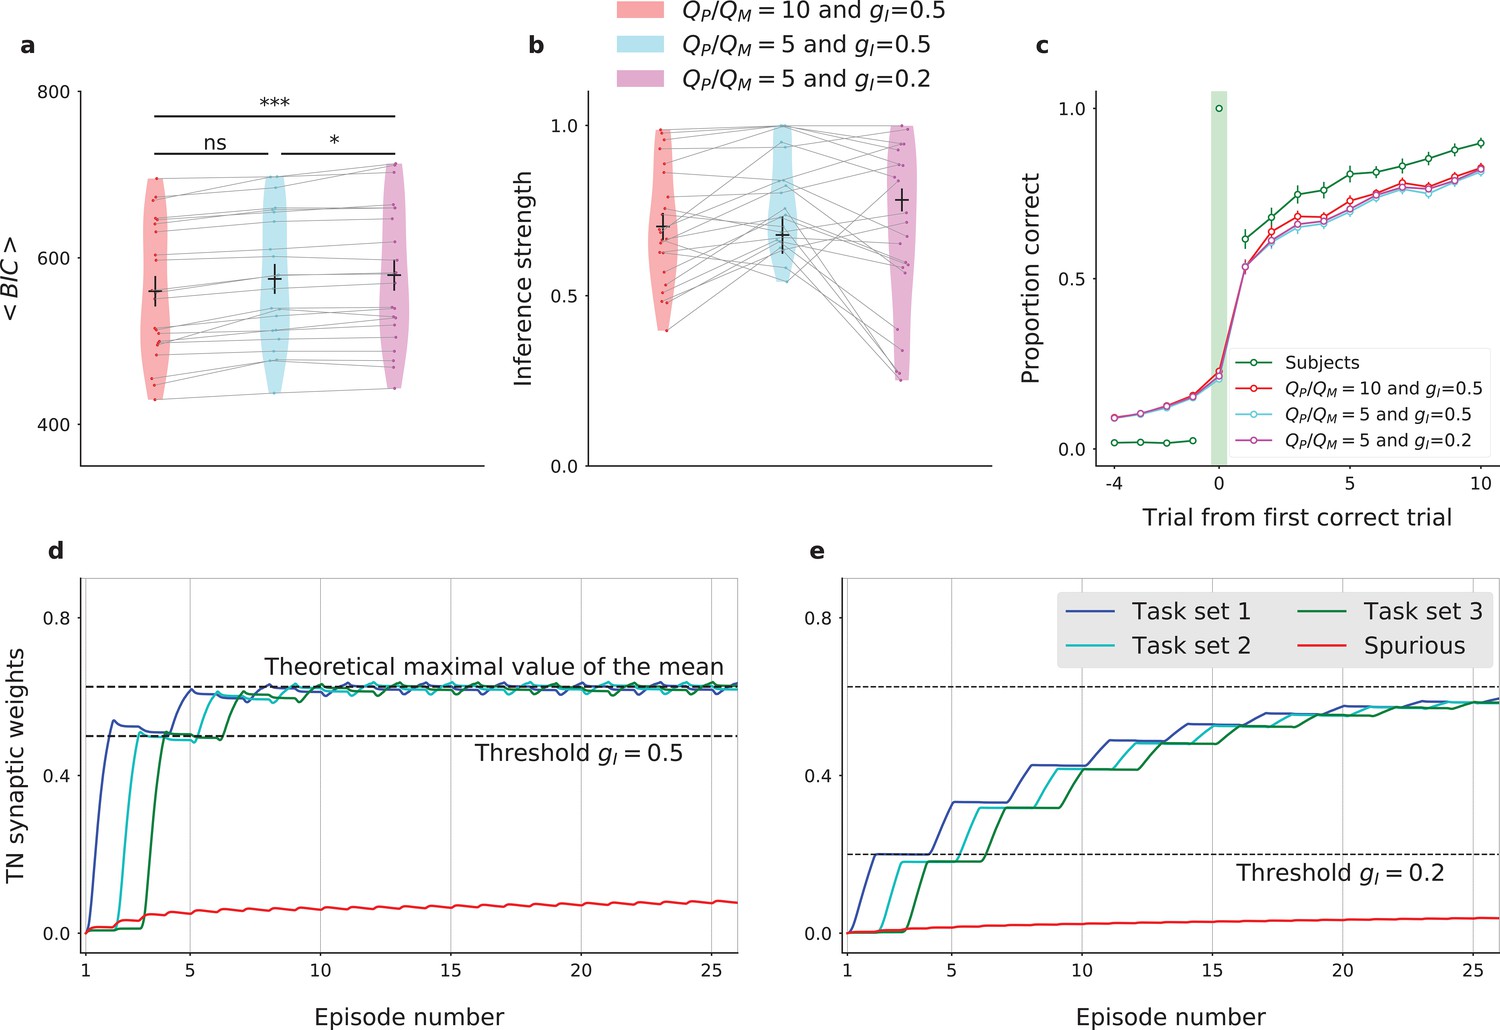
Learning task-sets with a lower ratio of potentiation versus depression in the task-set network () by refitting the model, while either fixing or .
Mean parameter values over subjects for and are : , , , , and . Mean parameter values over subjects for and are : , , , , and . This can be compared with Figure 5—source data 1 of the model with and . (a) Comparison of BIC for the fit with and used in the main paper, the fit with and , and the fit with and . A T-test on related samples gives respectively , and . (b) Comparison of the inference strength parameter values. (c) Proportion correct around the first correct trial, averaged over episodes and over subjects, for Experiment 1. (d,e) Simulation of the model, respectively for (left) or (right). Task-sets presentation is periodic for illustration purposes. The simulation corresponds to the average over 500 runs of the recurrent session. For clarity, we did not introduce tricky trials in these simulations. The plots display the average values of task-set network synaptic strengths between neural populations corresponding to each of the three correct task-sets, and spurious connexions.
Figure 5—figure supplement 3
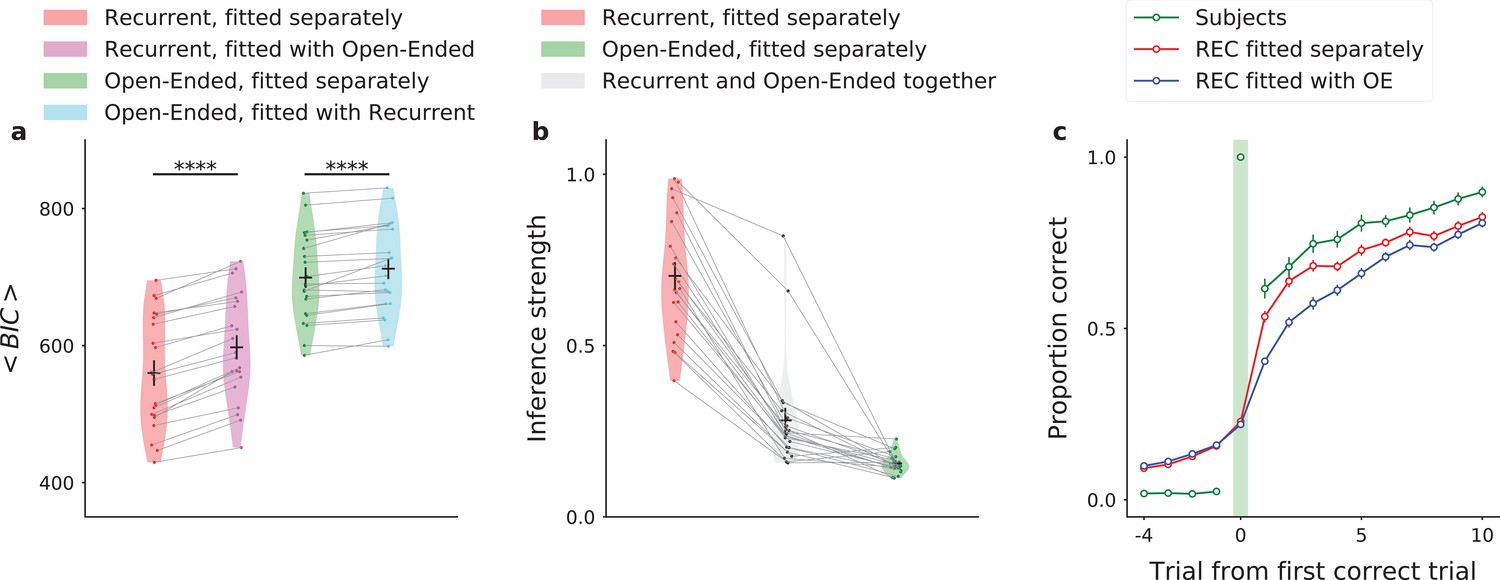
Model fit for both sessions together.
Related to Figure 5. Mean parameter values over subjects for sessions fitted together are : , , , , and to be compared with Figure 5—source data 1. (a) Comparison of BIC for the recurrent session fitted separately, the recurrent session when both sessions are fitted together, the open-ended session fitted separately, and the open-ended session when both sessions are fitted together. The model provides a significantly better fit when sessions are fitted separately (T-test on related samples, and respectively for recurrent and open-ended sessions). (b) Comparison of the inference strength parameter values when sessions are fitted separately or together. (c) Proportion correct around the first correct trial, averaged over episodes and over subjects, for Experiment 1.
Figure 6 with 3 supplements

Testing the predictions of the temporal chunking mechanism on specific trials.
(a) Schematic of the prediction for correct task-set retrieval. For each episode switch, and subject by subject, we compute the probability of making a correct choice after the first correct trial, for a different stimulus. Trials are classified from a model-based criterium as ‘chunked’ or ‘independent’, respectively depending on the presence or absence of an inference from the task-set network to the associative network. (b) Because of task-set inference, the model predicts a significant increase of performance on chunked trials compared to independent trials. This is not predicted by the associative network alone (‘Model without inference’). Subjects’ performance on these trials matches the model with inference. The error bars are larger for the independent trials because this category contains half the amount of data, as shown in Figure 6—figure supplement 1. (c) Log of subjects’ reaction times in seconds, for trials classified as chunked or independent. (d) Schematic of the prediction for task-set retrieval following misleading rewarded trials. After each episode switch, the subject makes incorrect choices. On 10% of these trials the feedback is misleadingly rewarded (e.g. , which corresponds to a correct association for the previous task-set, but not for the current task-set). Because of the inference from the task-set network, the previous task-set can be incorrectly inferred by the model from the misleading reward. (e) Probability of a correct association after a misleadingly rewarded noisy trial classified as a chunked trial by the model. The model with inference predicts an incorrect association at the next trial, producing a decrease in performance. This decrease is not predicted by the associative network alone (‘Model without inference’). Subject’s performance on these trials matches the model with inference. Violin plots display the shape of each distribution (Scott’s rule). Dots display the average for each subject. The black lines outline the mean ± s.e.m. .
Figure 6—figure supplement 1
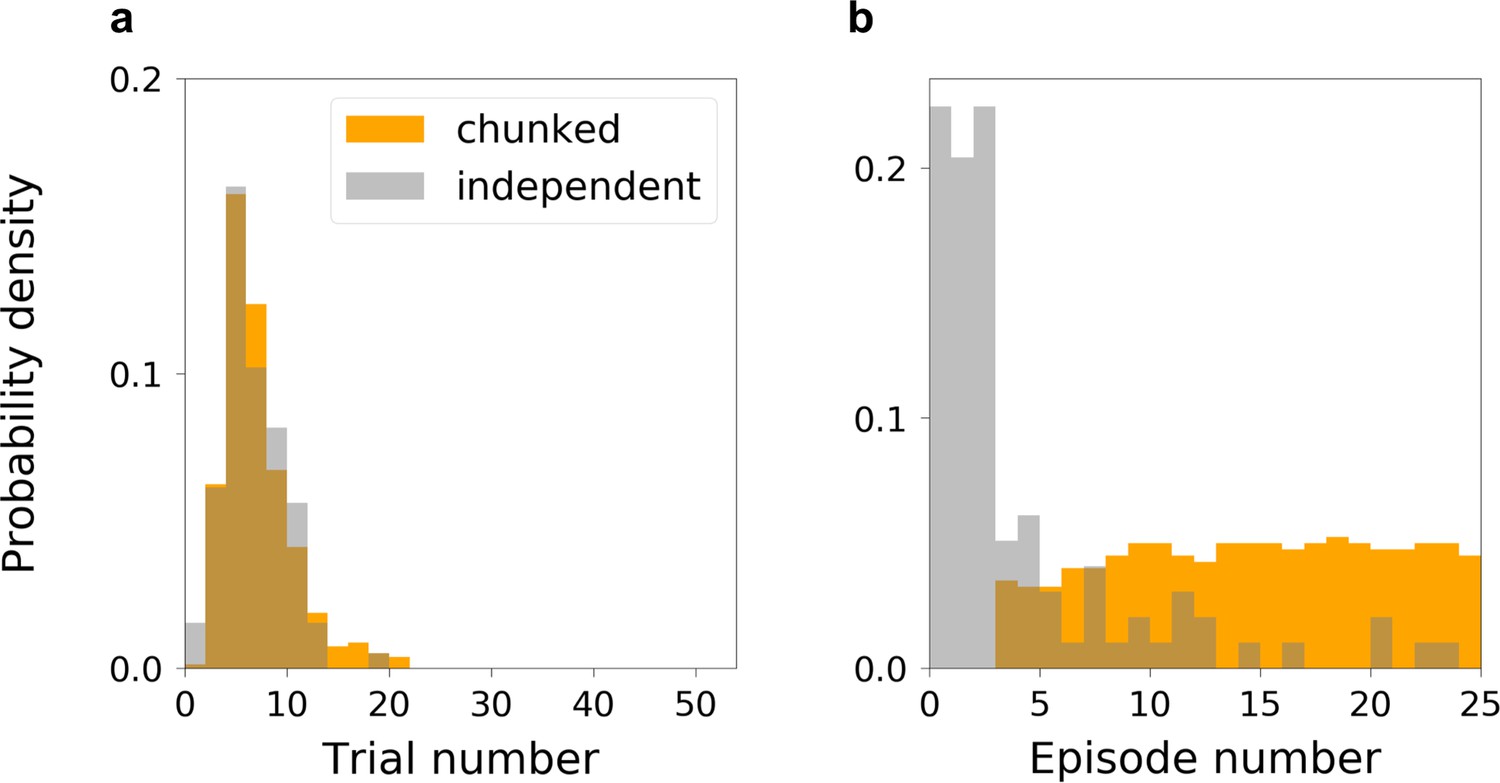
Task-set retrieval prediction.
(a) Distributions of trial numbering for the two categories of trials, chunked and independent. The distributions are not significantly different (a Kolmogorov-Smirnov test gives , ). (b) Distributions of episode numbering for the two categories of trials, chunked and independent. We consider only one trial per episode. Generally, independent trials are from early episodes, and chunked trials are from late episodes, consistently with the expected learning progress.
Figure 6—figure supplement 2
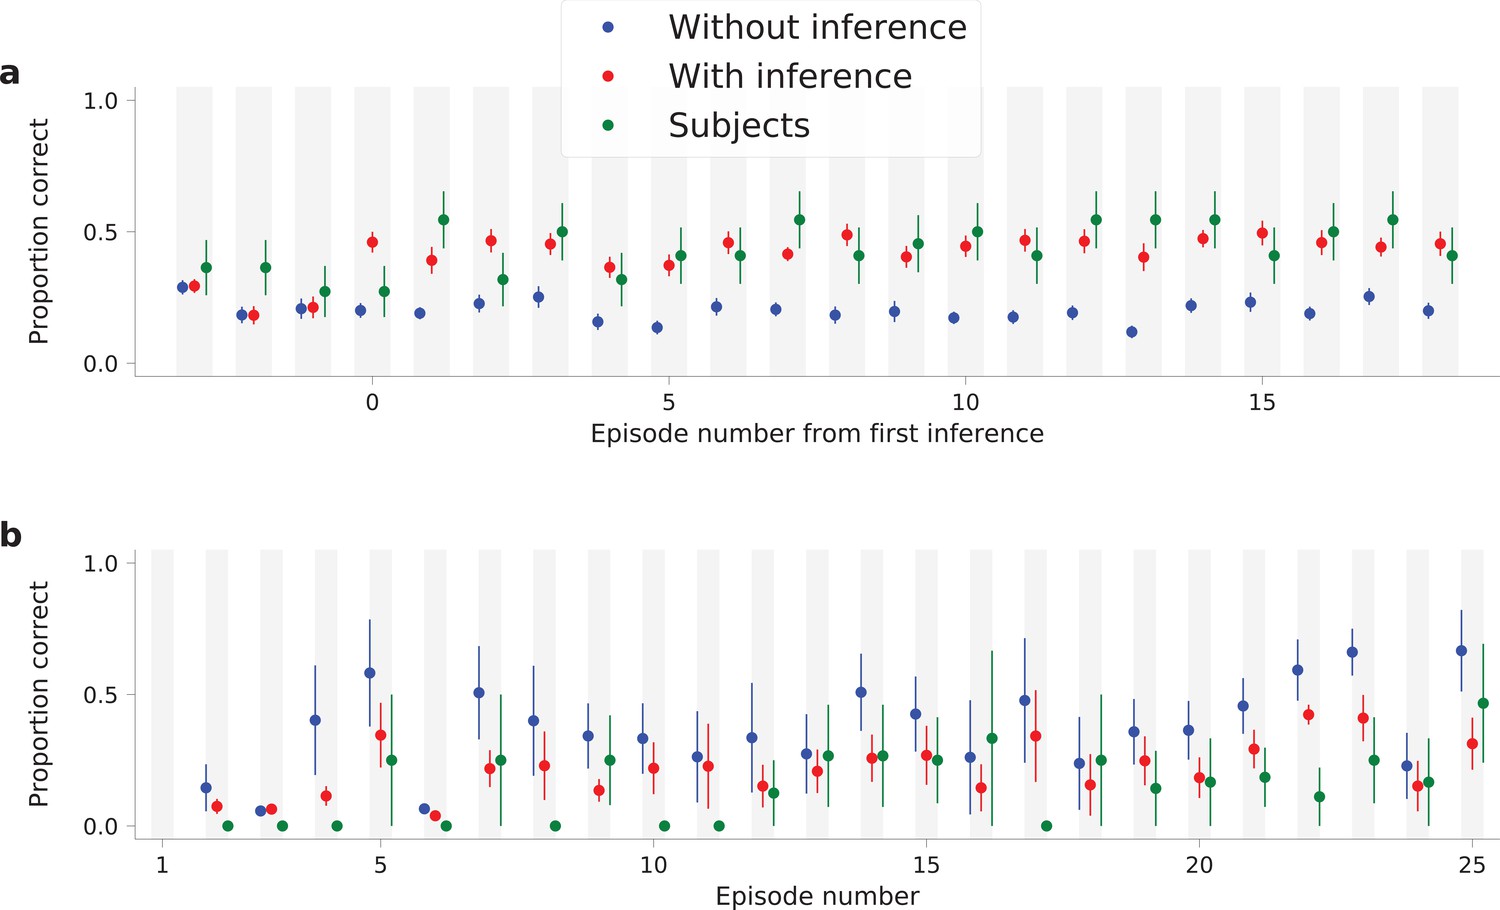
Testing the predictions of the temporal chunking mechanism as learning evolves.
The mean over subjects is represented as a colored dot, for the AN (‘Without inference’, in blue), the ANTN (‘With inference’, in red), and subjects’ data (in green). (a) Data of Figure 6b splitted according to episode number from the first episode where the model predicted an inference signal at the first correct trial, on a subject-by-subject basis. This panel shows that even at the end of the session, the retrieval of a task-set is not complete and instantaneous, so that a mixture of gating and gradual update is present. (b) Data of Figure 6e splitted according to episode number, so as learning evolves. This panel shows that the subjects’ probability of making a correct association after a misleadingly rewarded noisy trial is not null, even for the last episodes, after extensive learning of the three task-sets, and argues again for a combination of gradual and sudden updates as implemented in the present model. All are expressed as mean ± s.e.m.
Figure 6—figure supplement 3

Histograms over subjects of the difference of performance after five first consecutive correct trials, between the recurrent session and the open-ended session.
The classification of subjects is based on the model prediction (for Experiment 1). The difference between the two distributions is statistically significant (a Kolmogorov-Smirnov test gives ).
Figure 7 with 2 supplements
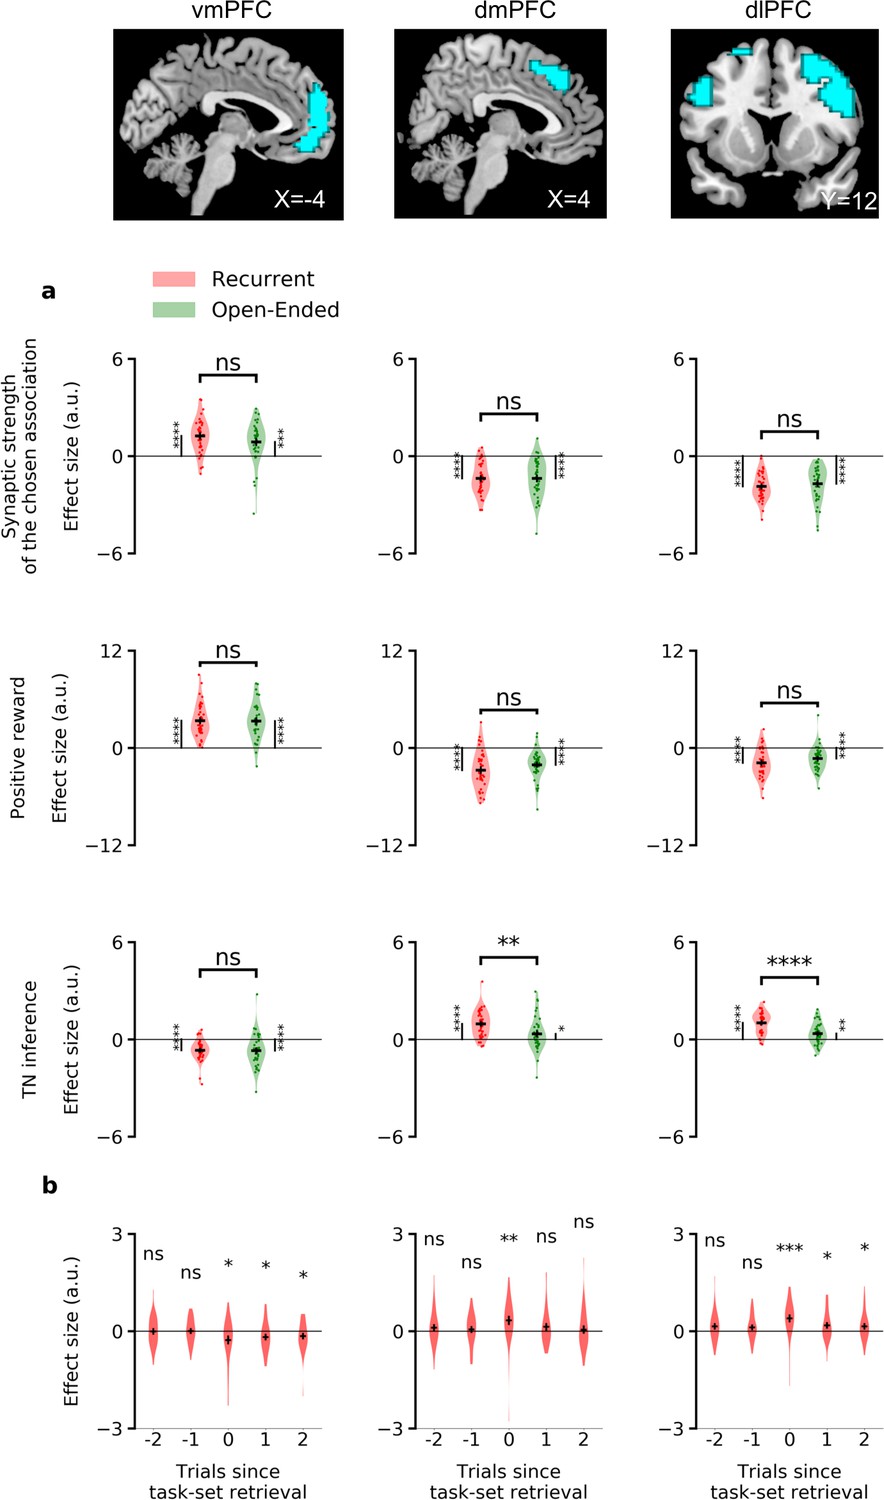
ROI analyses of the neural correlates of task-set inference.
The areas in blue represent the regions of interest identified in the previous analysis (Table 1) using a significant threshold of FWE . (a) Correlations between the BOLD signal at the onset feedback and the parametric modulators of the time series of , positive rewards, and the inference signal. (b) Comparison of BOLD activity on the first chunked trial of the model behavioral predictions (per episode, if it existed from sufficient learning, Figure 6a,b,c) with two trials immediately before and after it (see Materials and methods). Effect sizes in arbitrary units for the recurrent and the open-ended session. Error bars correspond to the standard error of the mean over the 40 subjects. dlPFC: dorsolateral prefrontal cortex; dmPFC: dorsomedial prefrontal cortex; vmPFC: ventromedial prefrontal cortex .
-
Figure 7—source data 1
Neural correlates of the synaptic strength in the associative network, and of the inference from the task-set network to the associative network.
top, Activations (FWE ) from the parametric modulator corresponding to the synaptic strength of the chosen association in the associative network, , at the onset decision. bottom, Activations (FWE ) from the parametric modulator corresponding to the inference from the task-set network to the associative network, at the onset feedback. No activation (FWE ) was found in the open-ended session. dlPFC: dorsolateral prefrontal cortex; dmPFC: dorsomedial prefrontal cortex; vmPFC: ventromedial prefrontal cortex; [x y z] are MNI coordinates; REC: Recurrent session; OE: Open-Ended session.
- https://cdn.elifesciences.org/articles/50469/elife-50469-fig7-data1-v2.xlsx
-
Figure 7—source data 2
Control independent ROI analysis: neural correlates of the inference signal from the task-set network to the associative network, at the onset feedback.
top, Statistical difference between activations in the recurrent session and in the open-ended session, in independent ROIs for dorsolateral prefrontal cortex. bottom, Statistical difference between activations in the recurrent session and in the open-ended session, in independent ROIs for dorsomedial prefrontal cortex. dlPFC: dorsolateral prefrontal cortex; dmPFC: dorsomedial prefrontal cortex; vmPFC: ventromedial prefrontal cortex; [x y z] are MNI coordinates.
- https://cdn.elifesciences.org/articles/50469/elife-50469-fig7-data2-v2.xlsx
Figure 7—figure supplement 1
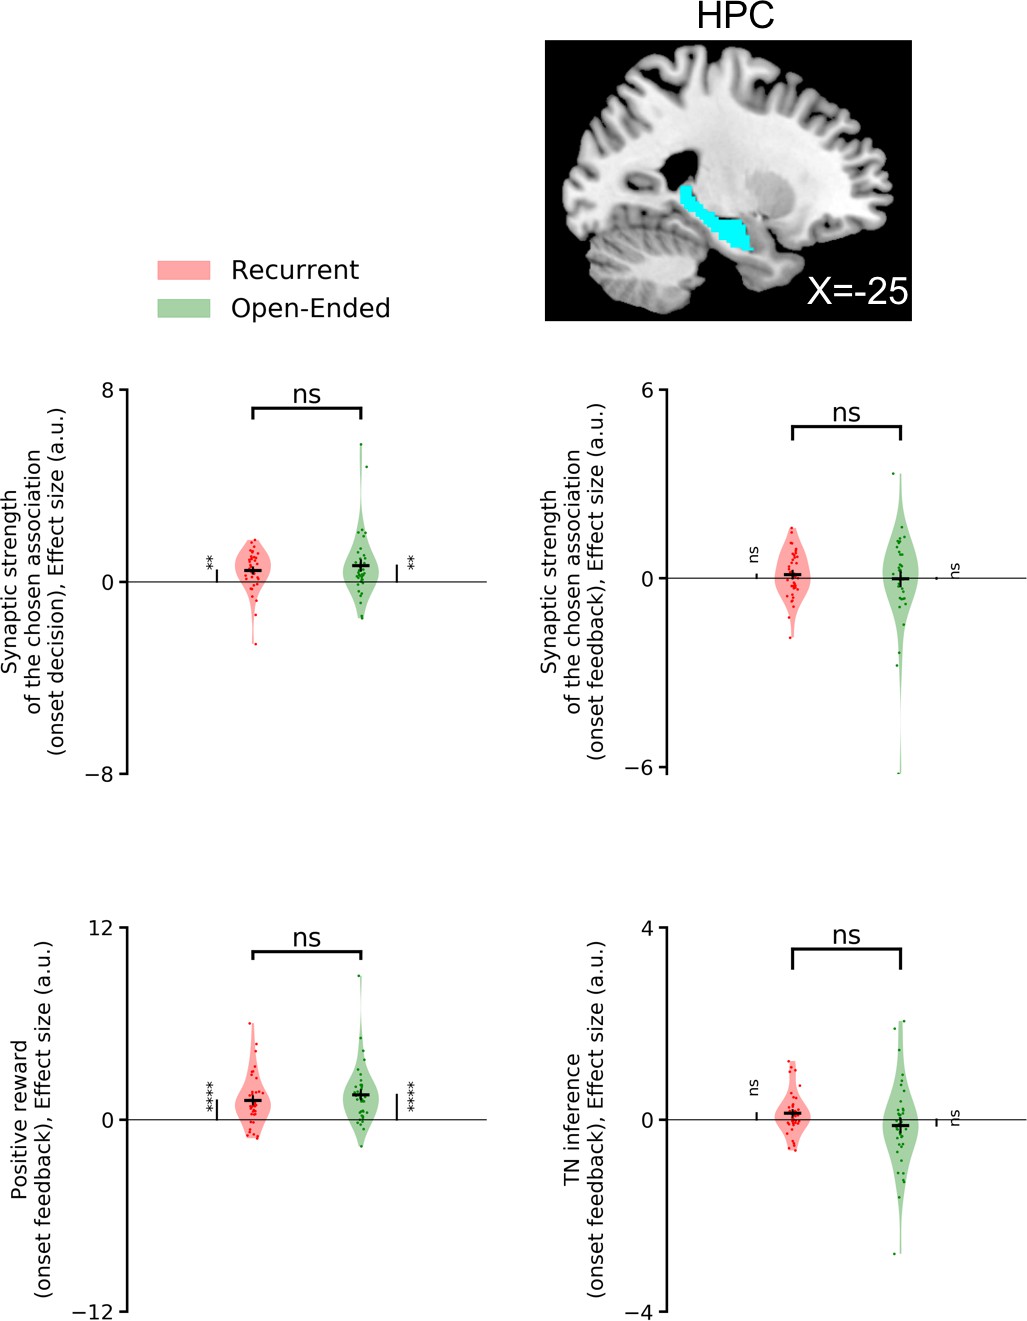
ROI analysis in the hippocampus.
The area in blue represents the ROI of hippocampus from WFU PickAtlas (Lancaster et al., 2000). It is tested for the parametric modulators of the time series of at the onset decision and , positive rewards, and the inference signal at the onset feedback. Effect sizes in arbitrary units for the recurrent and the open-ended session. Error bars correspond to the standard error of the mean over the 40 subjects. HPC: hippocampus; [x y z] are MNI coordinates.
Figure 7—figure supplement 2
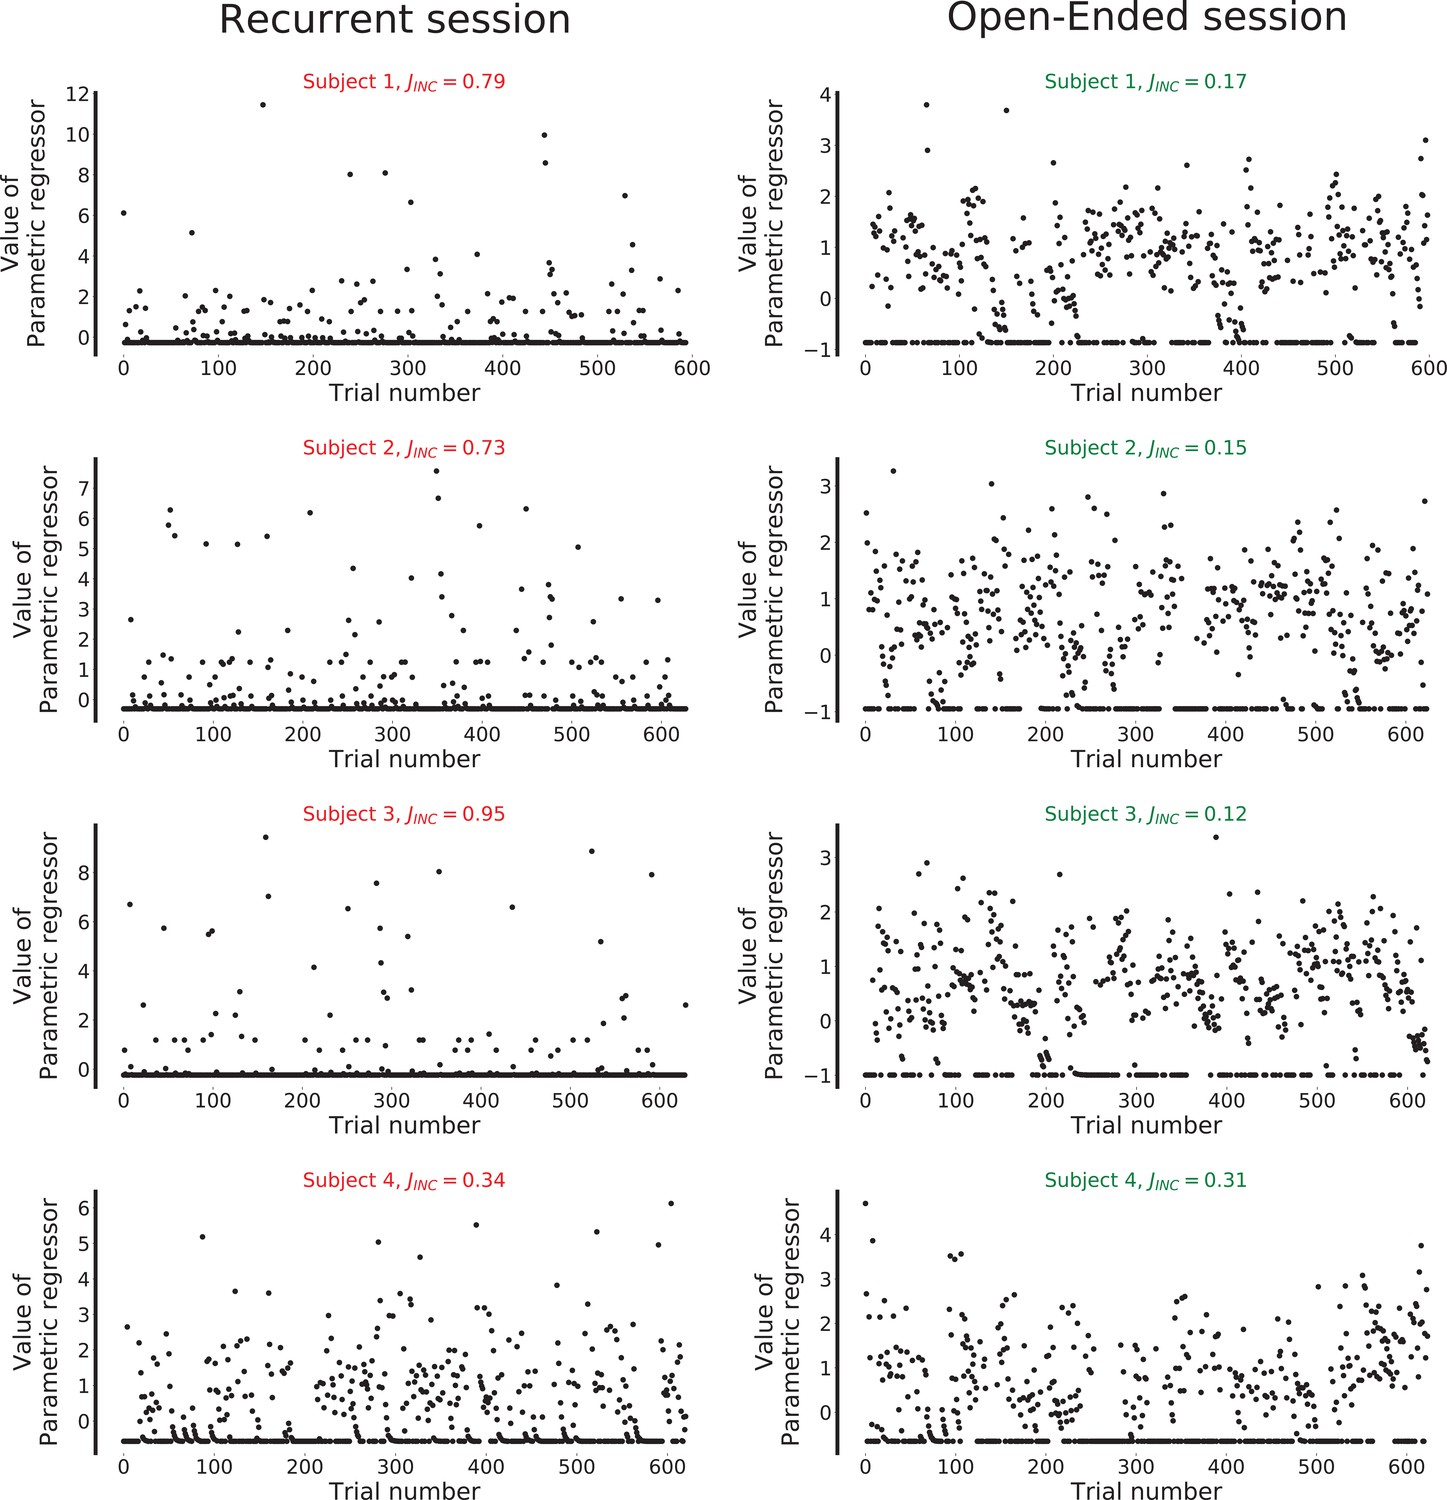
TN inference parametric regressor for four selected subjects, for the recurrent session (left) and the open-ended session (right).
For each subject, the value of the parameter specifying the strength of the inference signal is indicated. Parametric regressors were z-scored (Lebreton et al., 2019).
Tables
Table 1
One-way ANOVA defining the regions of interest used for the analysis of BOLD correlates of the task-set inference signal.
The ROIs are defined from activations from the parametric modulator corresponding to the TN inference signal, in both sessions (contrasts REC+OE and -REC-OE, FWE ). dlPFC: dorsolateral prefrontal cortex; dmPFC: dorsomedial prefrontal cortex; vmPFC: ventromedial prefrontal cortex; [x y z] are MNI coordinates; REC: Recurrent session; OE: Open-Ended session.
| Contrast | Label | [x y z] | Brodmann areas | Glasser parcellation | t-value | Cluster size |
|---|---|---|---|---|---|---|
| REC+OE | right dlPFC | [32 12 60] | 6,8,9,10,11,44,45,46 | 6sma, 8av, 8C, p9-46v, 46, a9-56v, 9-46d, 9a, i6-8, s6-8 | 9.25 | 519 |
| left dlPFC | [−48 4 36] | 6,8,9 | 8Av, 8 c | 6.27 | 25 | |
| dmPFC | [4 24 48] | 6,8,9,32 | SFL, SCEF, p32pr, d32, 8BM, 8BL, a32pr | 7.86 | 73 | |
| Negative(REC+OE) | vmPFC | [−12 48–4] | 9,10,11,32 | a24, d32, p32, 10 r, 9 m, 9 p, 9a, 10 v, 25, s32, p24 | 7.64 | 225 |
Additional files
Download links
A two-part list of links to download the article, or parts of the article, in various formats.
Downloads (link to download the article as PDF)
Open citations (links to open the citations from this article in various online reference manager services)
Cite this article (links to download the citations from this article in formats compatible with various reference manager tools)
Temporal chunking as a mechanism for unsupervised learning of task-sets
eLife 9:e50469.
https://doi.org/10.7554/eLife.50469


