Molecular basis of force-from-lipids gating in the mechanosensitive channel MscS
- The University of Chicago, United States
Figures
Figure 1 with 5 supplements
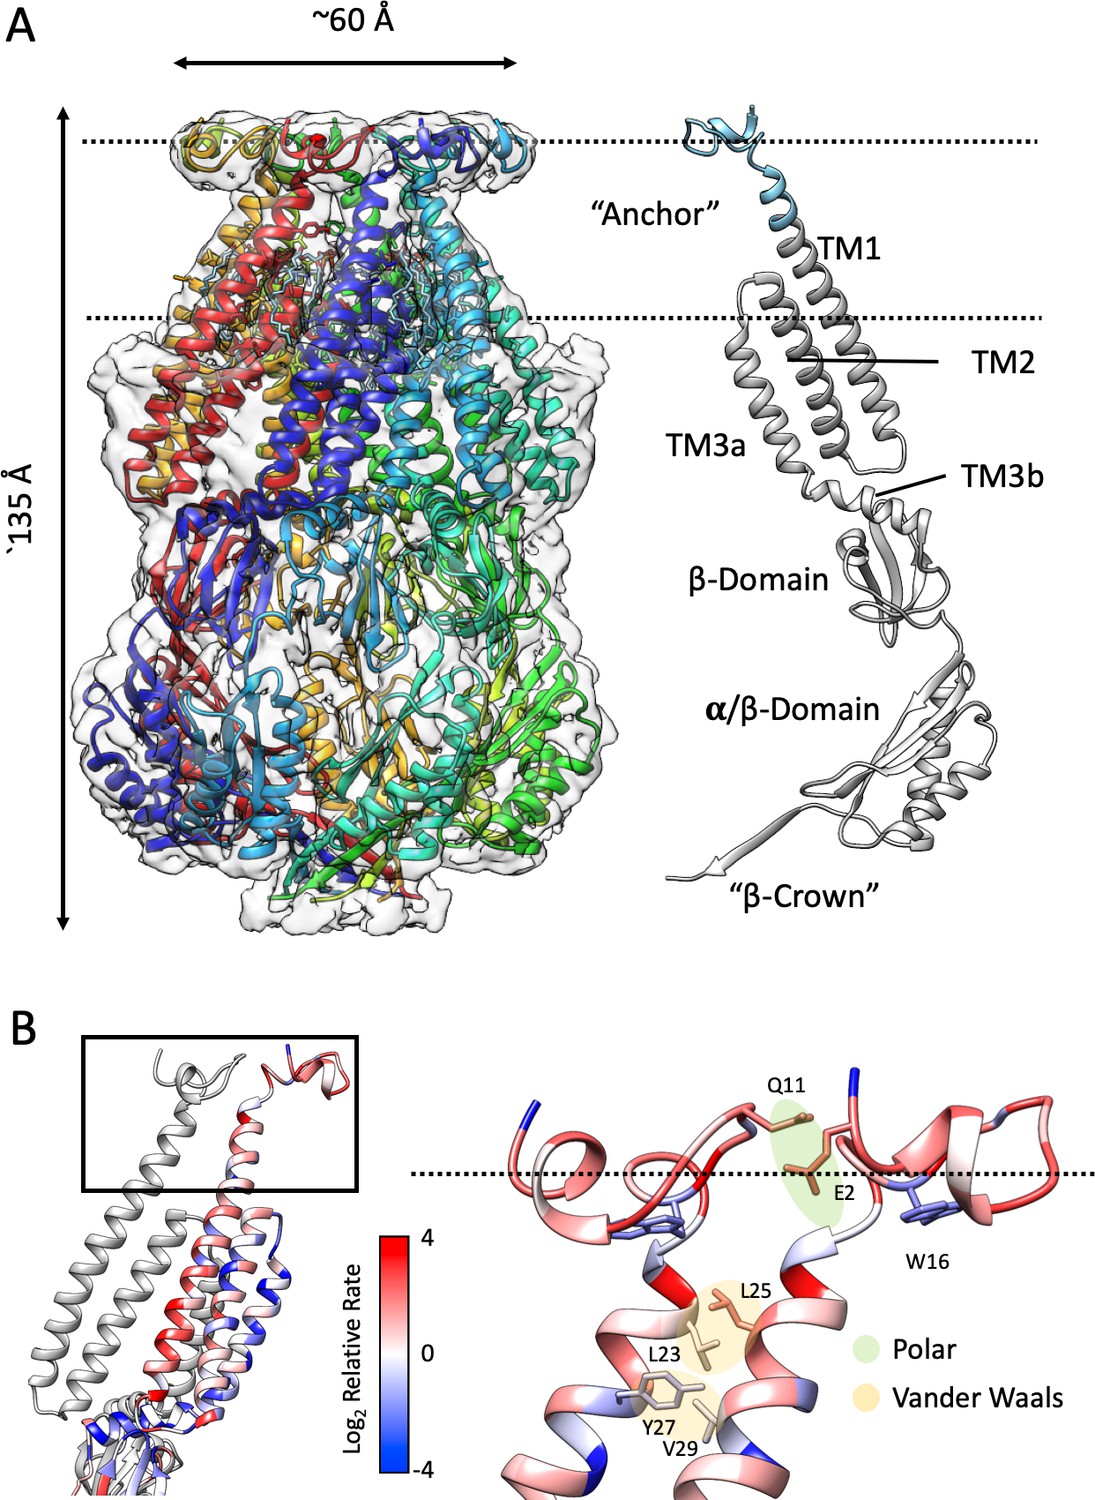
Structure of membrane-embedded MscS (MscS-ND) and its anchor domain.
(A) Left, the 3.1 Å resolution structure of the nanodisc-reconstituted (E3D1) MscS heptamer, shown in cartoon representation. Each subunit is shown in a different color. Bound lipids are shown as stick representation. The transparent EM density is shown overlapped to the cartoon of the protein. Right, cartoon diagram showing the MscS monomer. Colored grey are regions of the channel resolved in the crystal structure (2OAU), regions newly resolved in the MscS-ND structure are shown in cyan. The putative location of the lipid bilayer is shown as a pair of dashed lines. (B) Residue conservation and inter-subunit interactions stabilizing the anchor domain. Highly conserved sites are shown in blue, variable sites in red. Shown in sticks and balls representation are residues participating in inter-subunit interactions, either polar in nature (E2–Q11) or hydrophobic (van der Waals) packing (L23–L24, Y27–V29). On the left, a cartoon representation of the TM segments in two adjacent subunits, where the top box indicates the location of the diagram on the right.
Figure 1—figure supplement 1
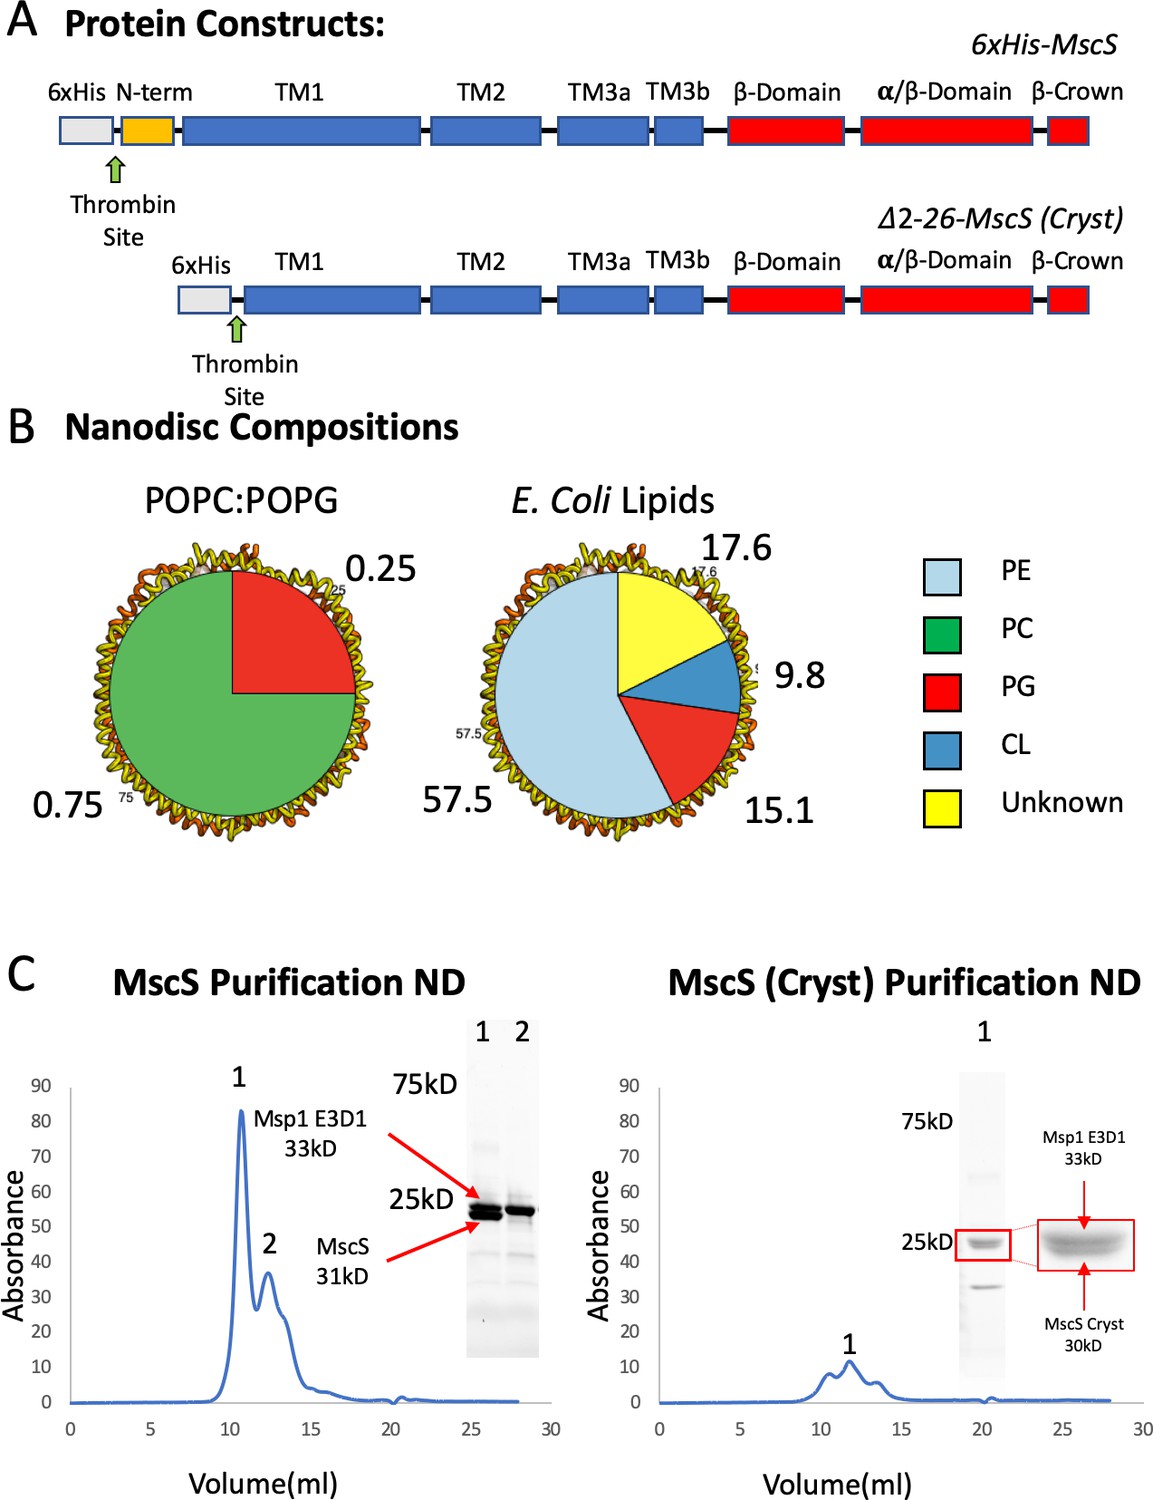
MscS Constructs, Nanodisc Composition, and Purification MscS Nanodiscs.
(A) Overall construction design of wt MscS and MscS-Cryst (Δ2–26). (B) Nanodisc (ND) lipid compositions. (C) Left. A Superdex 200 size exclusion chromatography trace of wt MscS reconstituted in POPC:POPG ND. Inside the trace are the major peaks 1 and 2 ran on a stain free SDS PAGE. Peak one was used for Cryo-EM. Right. A Superdex 200 size exclusion chromatography trace of MscS-Cryst reconstituted in POPC:POPG ND. Inside the trace is the major peak one ran on a stain free SDS PAGE. Peak one was used for Cryo-EM.
Figure 1—figure supplement 2
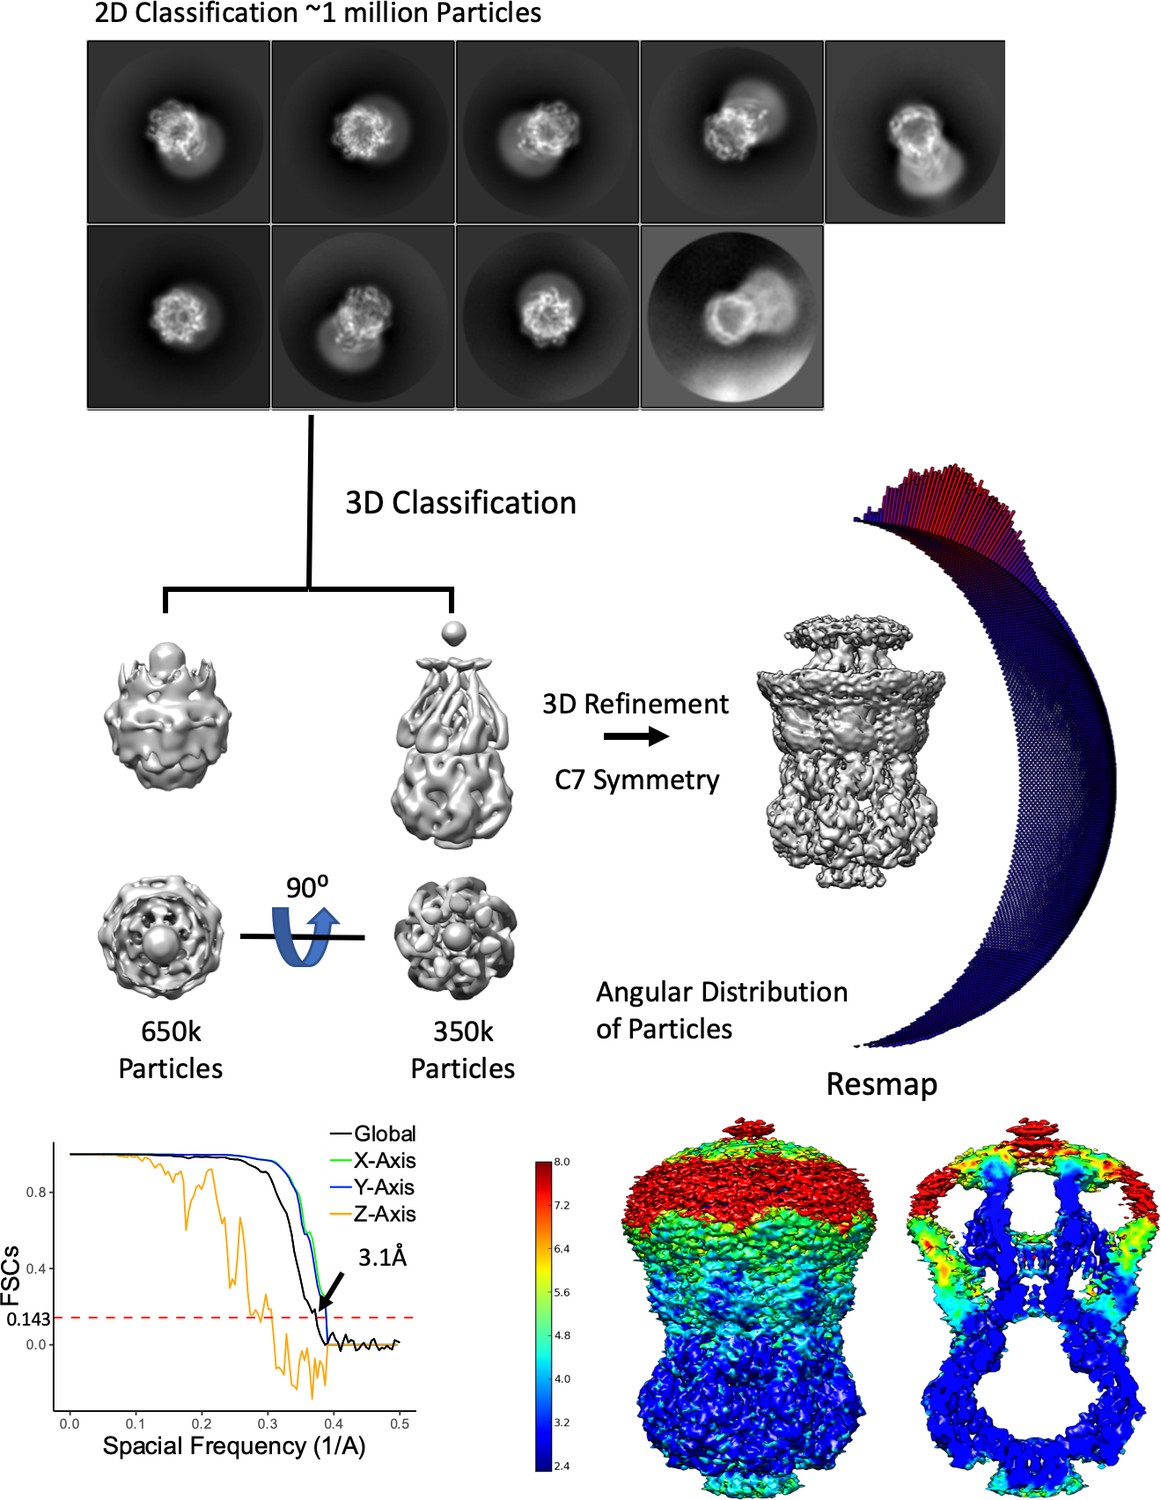
Overview of MscS ND Density Refinement Workflow.
From 4403 movies, about 1 million particles were picked and 2D classified. The selected 2D classes were subjected to multiple rounds of 3D classification were truncated (possibly denatured due to the air-water interface) particles were classified out. The final reconstruction used only the 3D classes with the entire molecule. As can been seen in the 2D classes, the angular distribution of particles and the 3D FSC (Tan et al., 2017) there is an orientation preference of the top views, which in turn cause anisotropy in the Z direction. Finally, the Resmap map shows the structure is 3 Å or better except for the anchor domain and the TM1/2 hairpin.
Figure 1—figure supplement 3
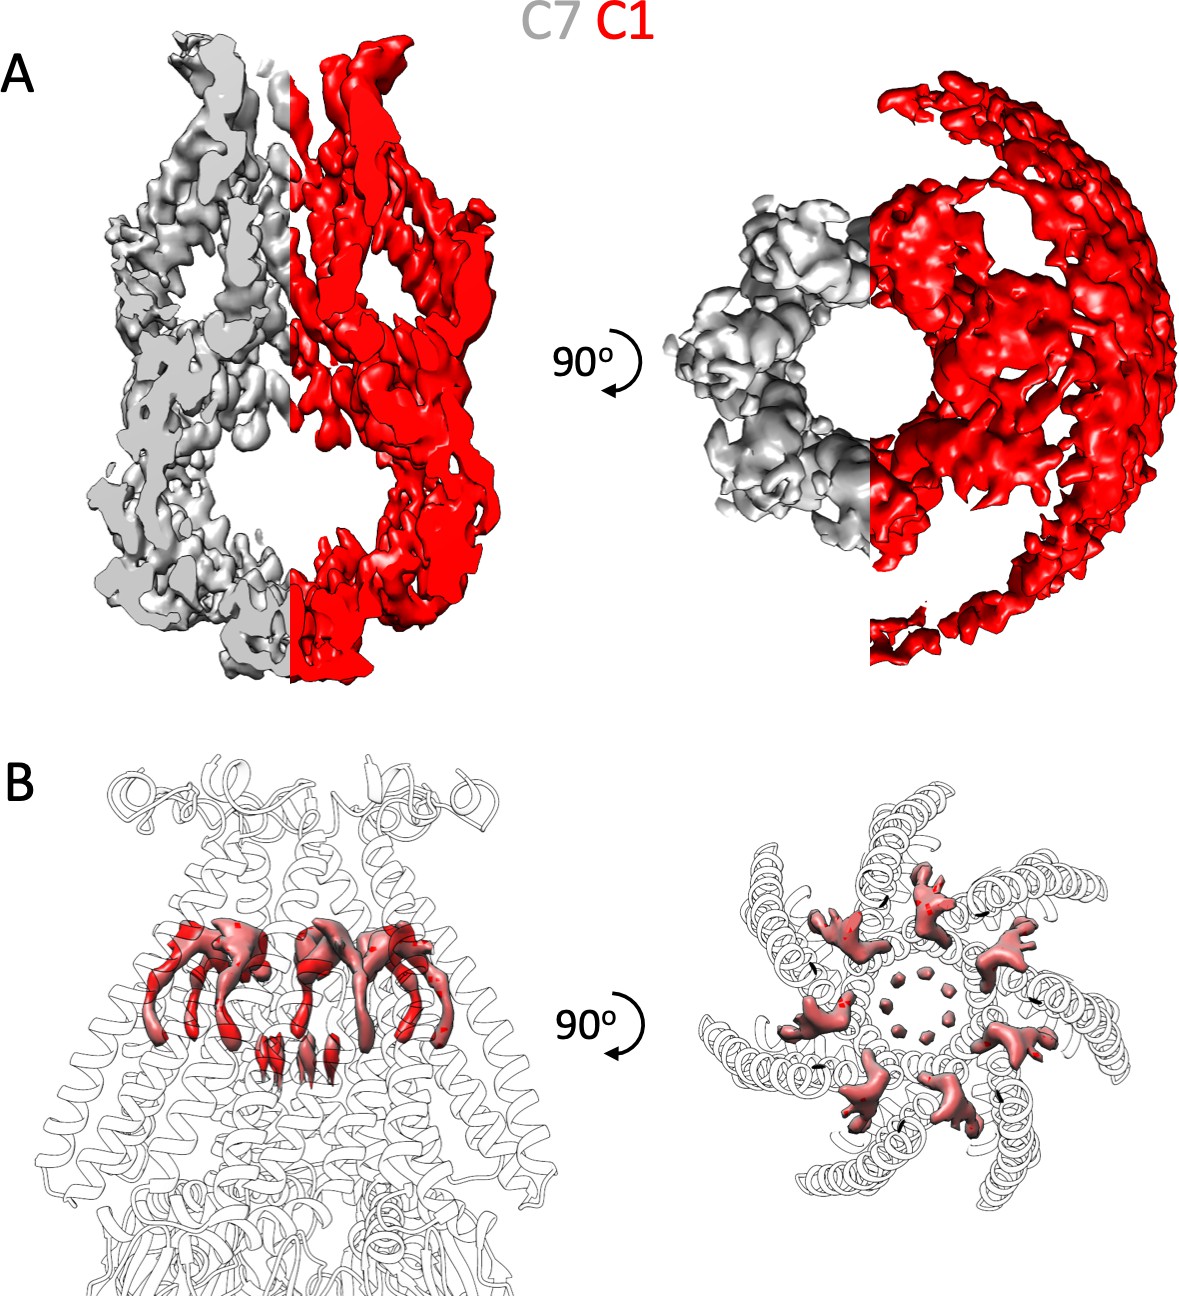
Symmetry Free Processing of MscS ND.
The 3D refined model from Figure S2 was processed without symmetry (C1) in Relion. The C1 processed data were aligned with the C7 processed density. Shown is the full model of MscS contorted at the same level down to remove the ND density formed from the union of one half of the grey density, C7 symmetry, and the red density, C1 symmetry. (A) Left is a side view, while the right is top view. In the C1 processing, ND lipid density is skewed to one side of MscS, suggesting a potential asymmetric placement of MscS in the ND. (B) Pore and hook lipids with the C7 density shown as transparent gray.
Figure 1—figure supplement 4
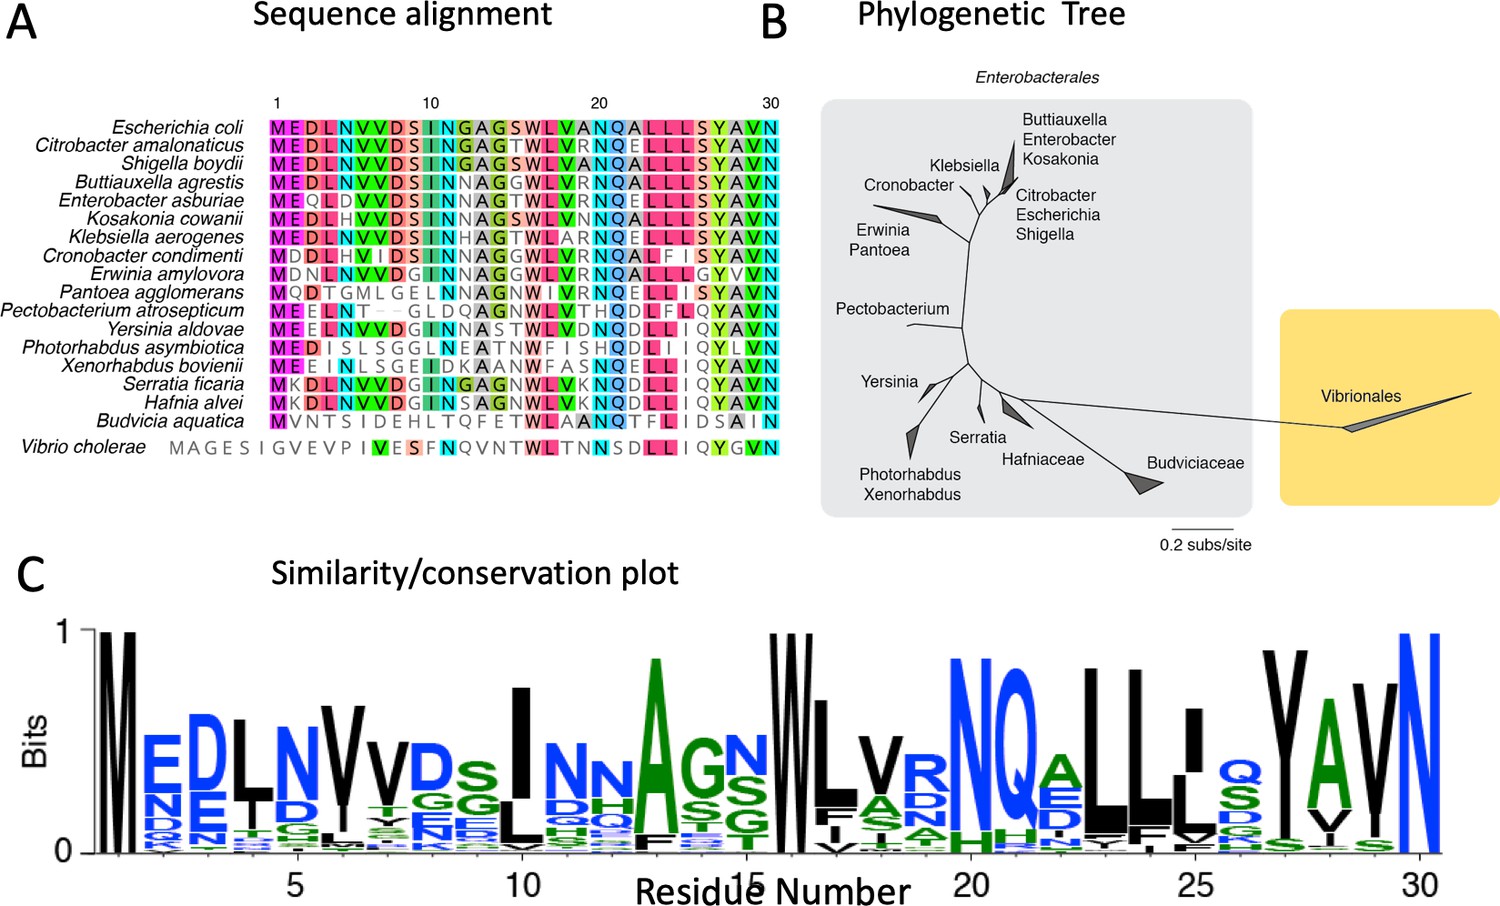
Bioinformatics of the MscS N-terminal Anchor Domain.
Sequence from the N-terminus and first three turns of TM1 for MscS orthologs with equivalently predicted TM segments as E. coli. (A) Alignment from Enterobacterales and Vibrionales MscS proteins sequence MUSCLE (v.3.5) with default parameters. A sample of 10 sequence (put of 168) are shown. (B) Maximum likelihood phylogeny of Enterobacteriales and Vibrionales MscS protein sequences inferred using RAxML (v.8.2.11) under the best-fit model of evolution (LG + G + X). The relative rate of evolution for each site (in log base 2) were normalized by setting the mean to be zero. (C) A sequence logo for the anchor domain of Enterobacteriales MscS proteins sequences. The 168 sequences from the primary alignment were resampled to distribute sequences more evenly across sequence space.
Figure 1—figure supplement 5
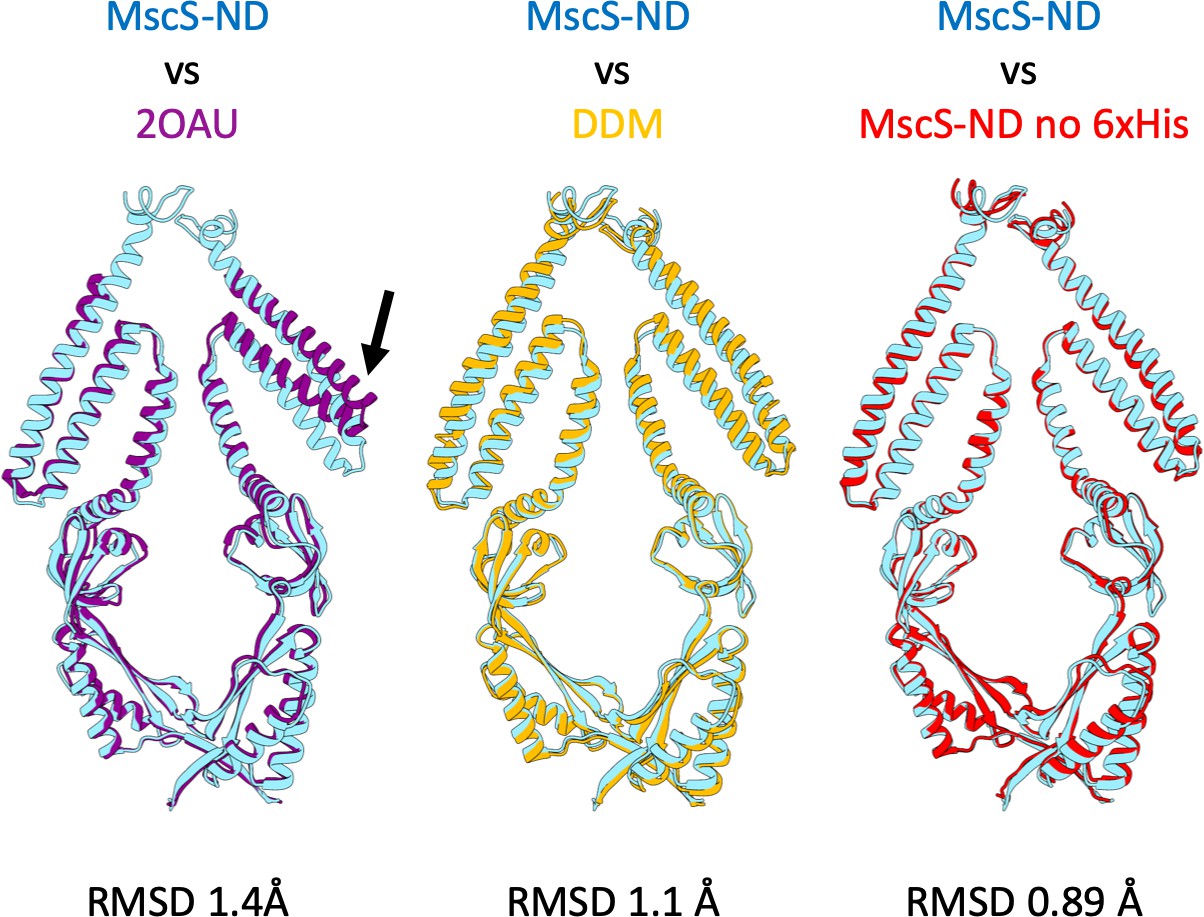
MscS-ND vs.other Models.
MscS-ND aligned using backbone atoms. (A) 2OAU is the deposited MscS crystal structure. (B) MscS in a DDM micelle. (C) MscS-ND with the His-tag cleaved with Thrombin. RMSD was calculated using the backbone atoms. 2OAU was solved asymmetrically, and therefore some TM1/TM2 hairpins align, while other hairpins do not as shown with the black arrow.
Figure 2 with 4 supplements
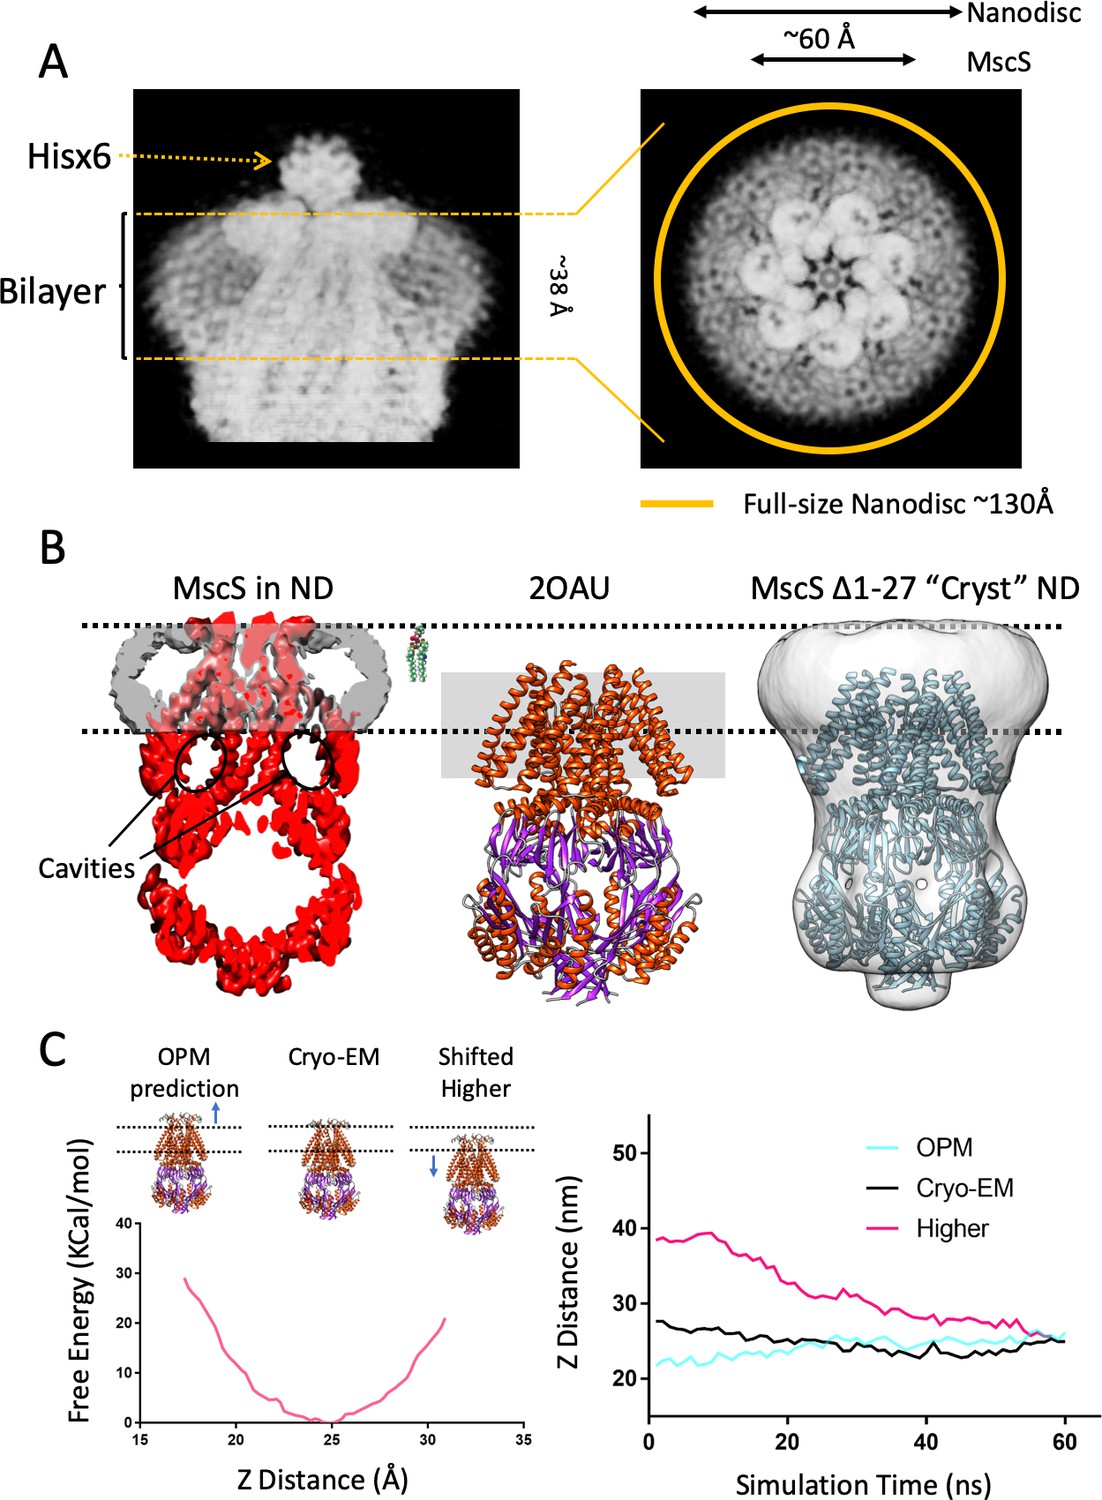
A new lipid-protein interface for membrane-embedded MscS.
(A) Close-up of MscS-ND EM density (in Chimera’s ‘solid’ representation). Left, Side view. The location of the bilayer in the nanodisc in indicated by dashed yellow likes (approximately 38 Å in diameter). Density for the putative heptameric histidine tag complex is shown by a dotted arrow. Right, Top view. The yellow circle represents the putative average size of the E3D1 nanodisc (~130 Å) in relation to the density, which points to a partial averaging of the density likely due to MscS lateral mobility. (B) Comparison between the location of the membrane interface in MscS-ND, the FC14 crystal structure (2OAU) and the ‘Cryst’ deletion construct. Black dashed lines depict the limits of the lipid bilayer based on the nanodisc EM density. Left, EM density for the protein (red) and the nanodisc (grey) for MscS-ND, the black ovals highlight the fact that the prominent cavities formed between the TM1-TM2 hairpin and TM3 are fully located outside the membrane. Center, relative positioning of 2OAU based on a rigid fit of the structure onto MscS-ND EM density. The gray rectangle in the background represents the previous consensus membrane location. Right, the low-resolution cryoEM structure of MscS ∆2–27 (‘Cryst’,~20 Å) shows an overall architecture for the nanodisc-embedded channel. In spite of the N-terminal deletion, the nanodisc is located at the same position as in MscS-ND. (C) Probing the energetics of the membrane interface. A Potential of mean force (PMF) calculation was carried out by relocating a lipid bilayer from a coordinate origin (0 Å) predicted by the CHARM-GUI server (Jo et al., 2008) and moved up to 16 Å (the thickness of a lipid monolayer) along the Z-axis coordinate (see Figure 2—figure supplement 2). Left, free energy as a function of Z-axis displacement. A global minima was found at ~25 Å (~8 Å above the prediction) and the free energy increases exponentially beyond this point. The energy minima coincides with the location if the interface as defined by the EM density of MscS-ND. Right, evolution of MD simulation starting at three membrane interface locations: predicted by CHARM-GUI (0 Å, red trace), at the cryo-EM density (+ 8 Å, black trace) and a further +16 Å (Higher placement, blue trace). After ~60 ns simulation all membrane interfaces converge to that defined by the cryo-EM density.
Figure 2—figure supplement 1
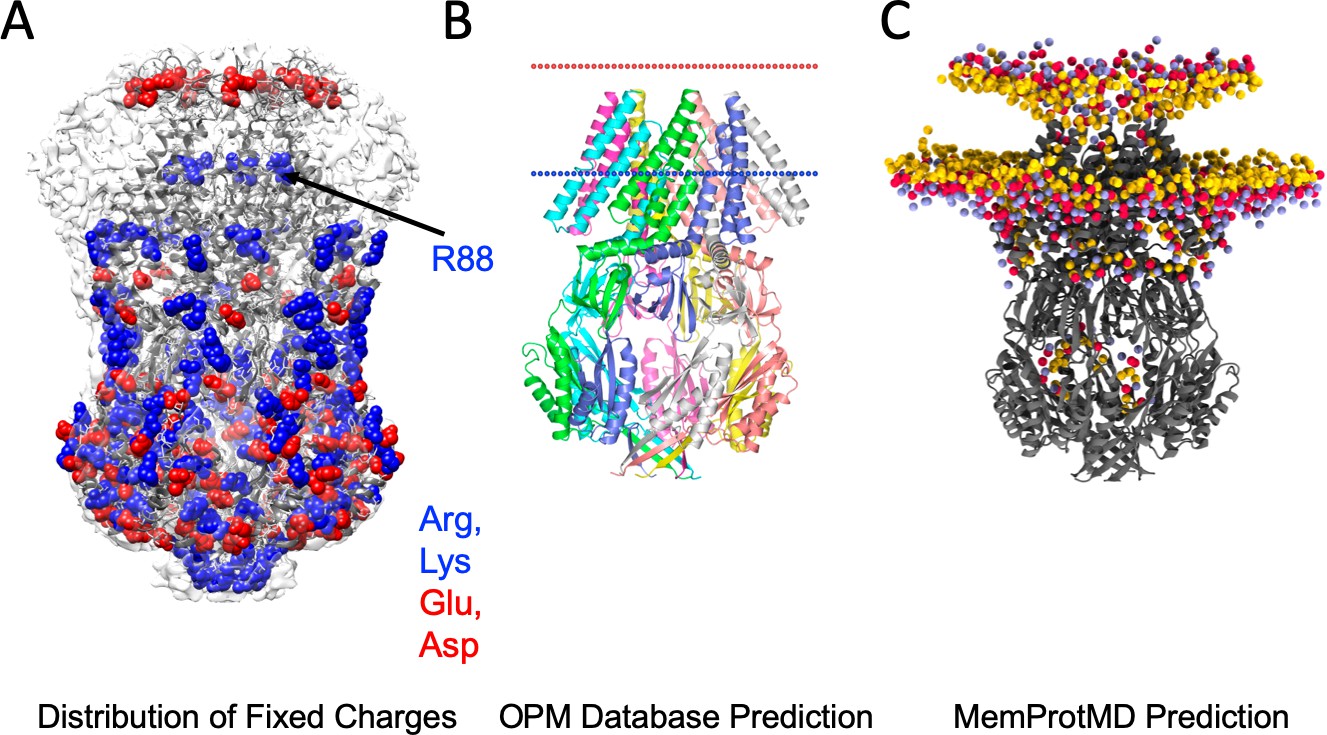
MscS bilayer footprint is compatible with bilayer predictions and surface charge distribution.
(A) A map of all surface-exposed charged residues (in VDW sphere representation) fully agrees with the location of membrane interface based on the MscS-ND EM density. With the exception of Arginine 88 (which coordinates the phosphate group of the hook lipid), there are no charge residues in the proposed TM region. (B) OPM predicted the location of the bilayer for the crystal structure 2OAU (Lomize et al., 2012). (C) MemProtMD predicted location of the bilayer for the crystal structure 2OAU (Newport et al., 2019).
Figure 2—figure supplement 2
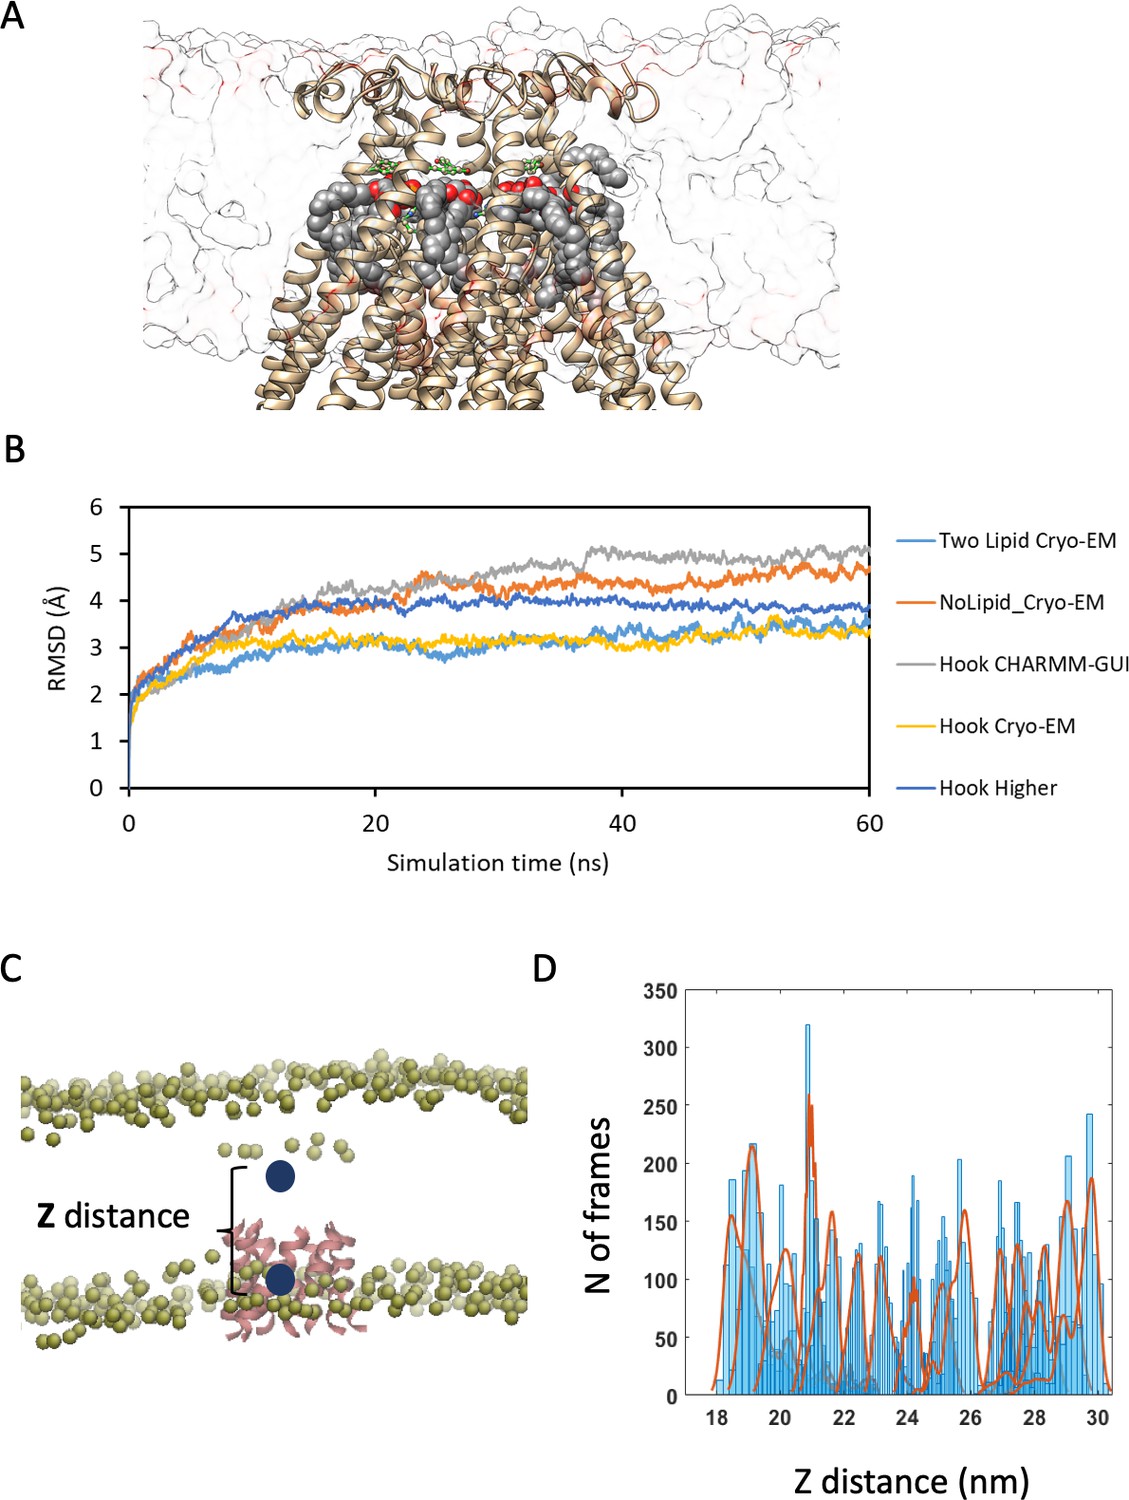
Details of MD simulations and PMF calculated from umbrella sampling for determining the optimum position of MscS with respect to the bilayer.
(A) Example of MscS (MscS Cryo-EM) embedded in a membrane for MD simulation. (B) Root mean square deviation (RMSD) of different MD models used in this study. (C) The reaction coordinate for the PMF calculations has been defined as the distance between the Z coordinate of the center mass of phosphate molecules of the lipid bilayer and the Z coordinate of center mass of the pore-forming helices of MscS (i.e. residue 105 to 115). (D) Counts with respect to different sampling windows (reaction coordinates ranging from 16 Å to 31 Å); 10 ns Simulation for each histogram.
Figure 2—figure supplement 3
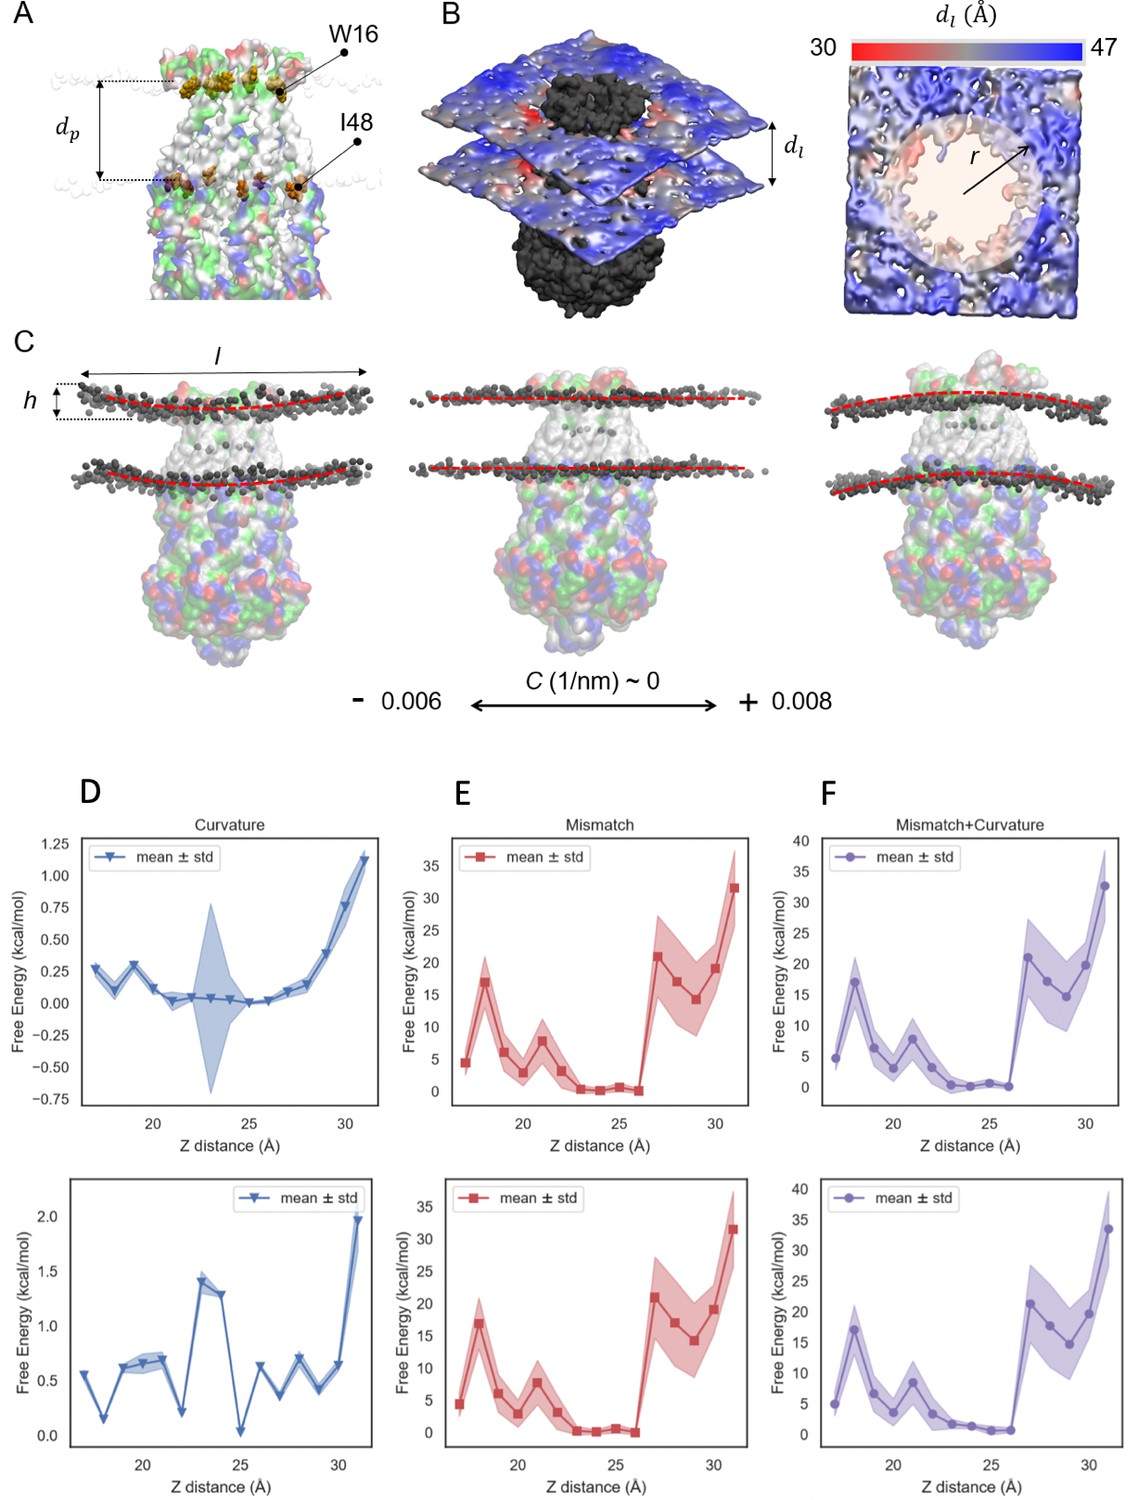
Geometrical properties of MscS embedded in a lipid bilayer for PMF calculations.
(A) Surface representation of MscS with residue-type color map. Red color shows negatively charged residues, blue shows positively charged residues, green hydrophilic and grey hydrophobic residues of MscS while embedded in the bilayer. A van der Waals illustration of residues W16 and I48 at the lipid-protein interface has been shown for determining the hydrophobic length of the protein, . (B) An example membrane thickness () distribution (from the simulation with Z distance = 31 ) shown in color spectrum ranging from ~ 30 (around the protein) to ~ 47 (near the edges). (C) Snapshots of the membrane with different curvatures (C), which are calculated based on the length (l) and the height (h) of the bilayer. (D–F) The mean-field free energy change due to change in the bilayer curvature and lipid-protein hydrophobic mismatch as a result of different MscS position with respect to the membrane. Top panel indicates the free energy change assuming constant curvature across the bilayer area and the bottom panel assume variable curvature across the bilayer area. (D) Indicates the free energy contribution of curvature change at different umbrella sampling windows, (E) shows the contribution of the free energy change due to hydrophobic mismatch between MscS and the bilayer, and (F) shows the combination of the free energy from both curvature and hydrophobic mismatch. Hydrophobic mismatch is the main contributing factor in change in the free energy level across different reaction coordinates. The values are mean ± std.
Figure 2—figure supplement 4
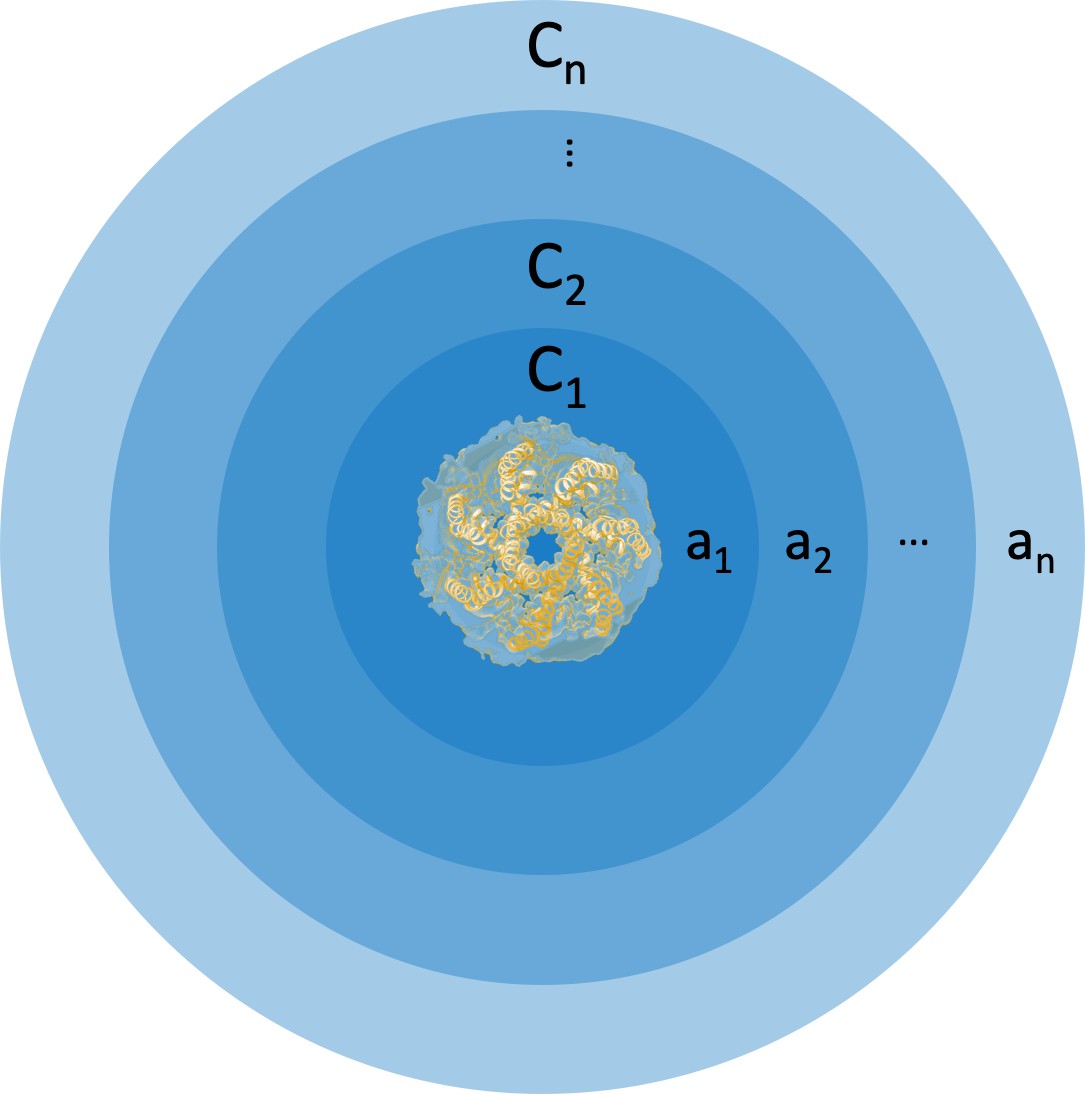
Cartoon representation of concentric areas and associated curvatures around membrane-embedded MscS.
The membrane is discretized into concentric ribbons of areas to with curvatures to .
Figure 3 with 3 supplements
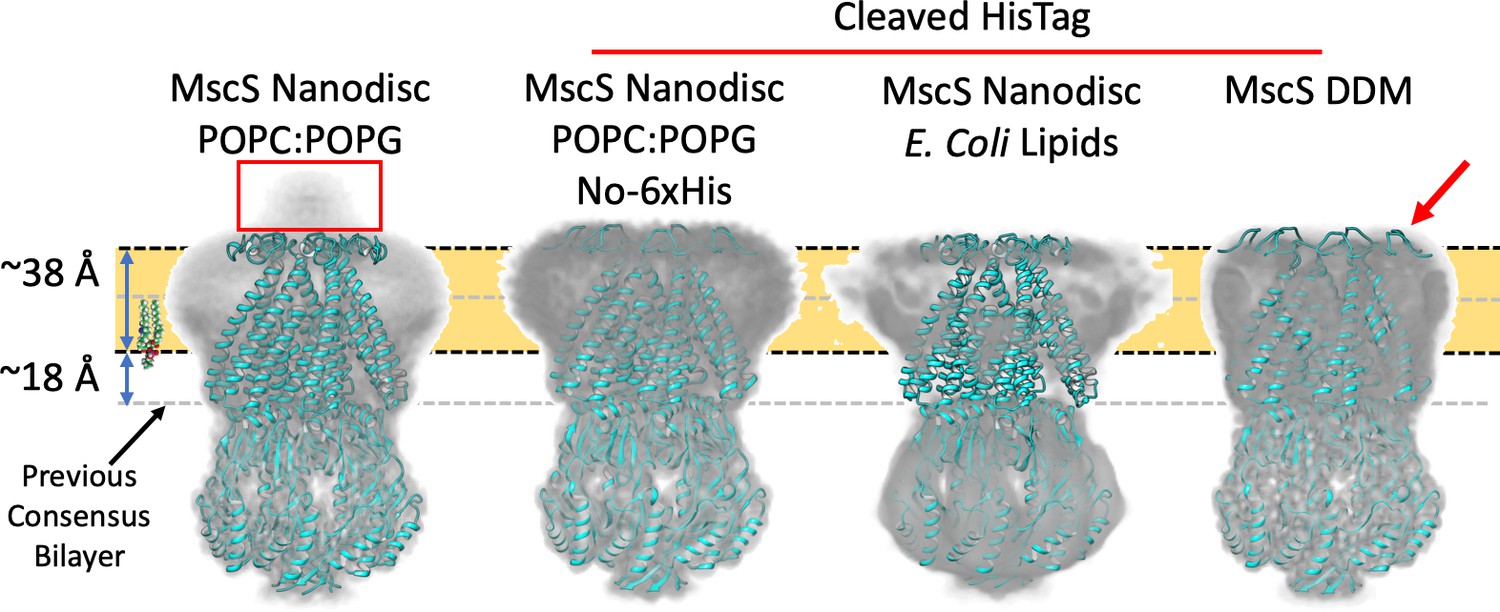
Membrane interface location in nanodisc-reconstituted MscS is independent of lipid composition.
CryoEM structures for three additional lipid reconstitution/detergent conditions show a common membrane interface. Four independently determined structures are shown: Left, MscS-ND (in POPC:POPG 4:1) determined at 3.1 Å. This structure includes the N-terminal 6xHis (red rectangle). Center left, MscS-ND (in POPC:POPG 4:1) after thrombin proteolysis of the N-terminal 6xHis, determined at 4.1 Å. Center right, MscS-ND (in E. coli lipids) after thrombin proteolysis of the N-terminal 6xHis, determined at ~10 Å. Right, DDM-solubilized MscS after thrombin proteolysis of the N-terminal 6xHis, determined at 3.4 Å. In all cases, EM density is shown as Chimera’s ‘solid’ representation with the protein depicted in ribbon representation (cyan). The calculated location of the membrane is shown as a yellow slab with black dash lines, while the previous membrane interface consensus location is represented by the grey dashed lines. The red arror points to a partially unfolded region of the N-terminal loop region.
Figure 3—figure supplement 1
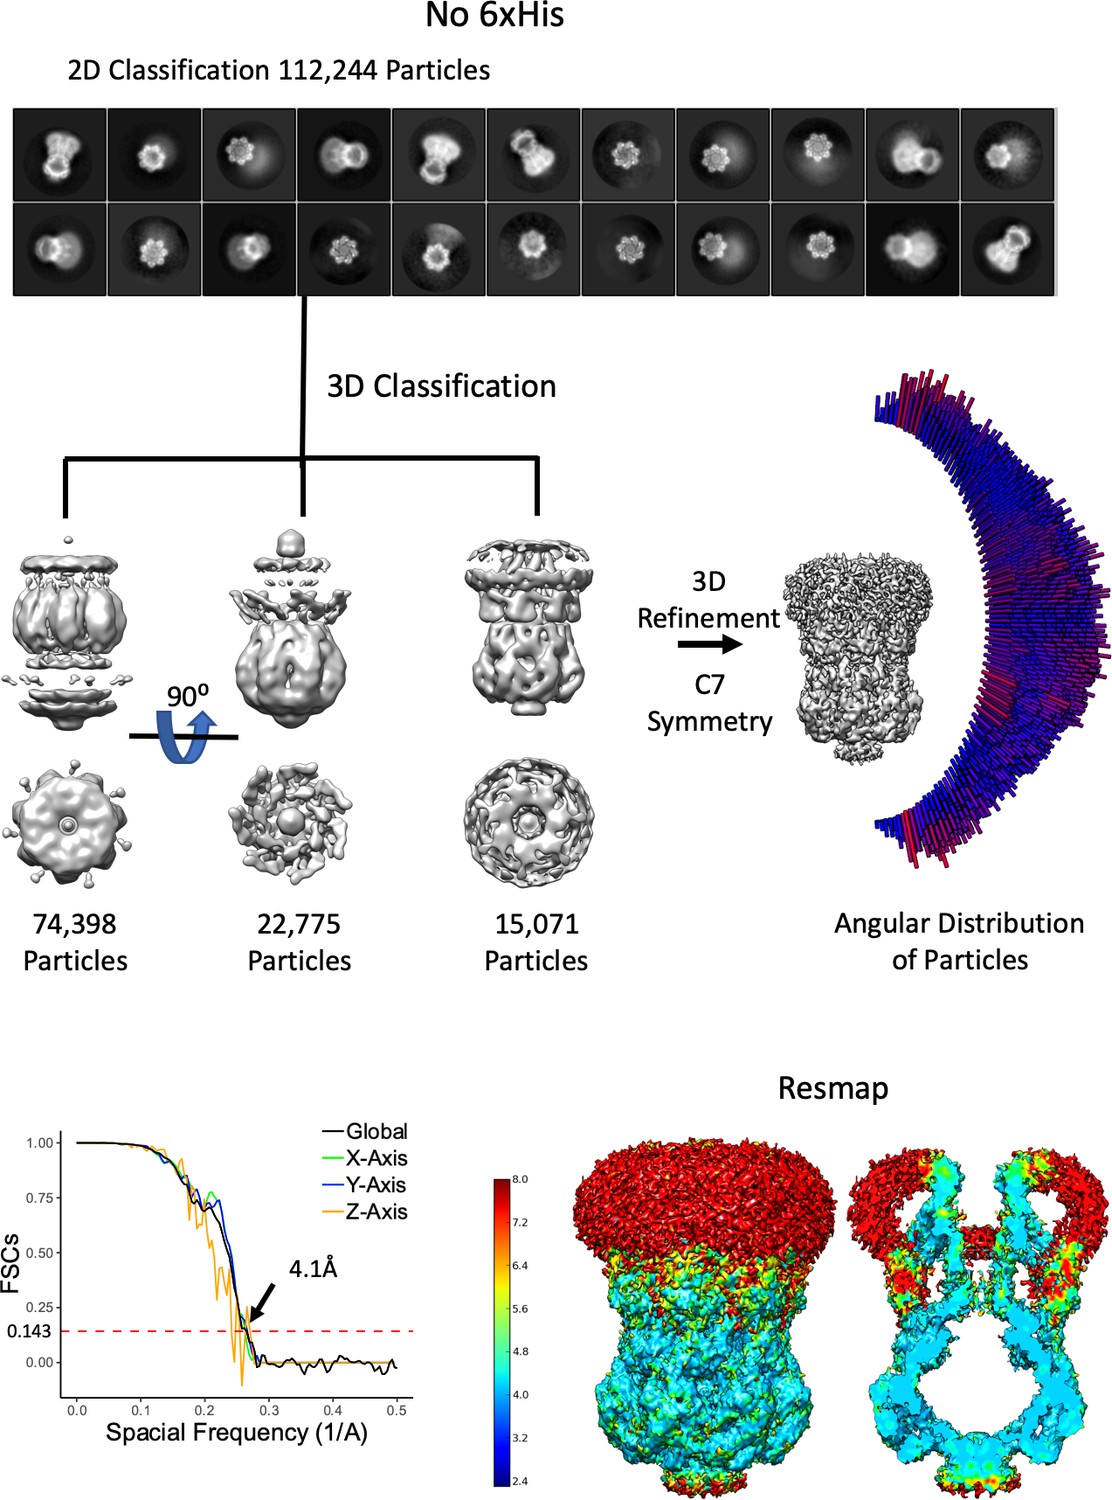
Overview of MscS ND No His-Tag Density Refinement Workflow.
From 2110 movies, 111,244 particles were used after 2D classification. The selected 2D classes were subjected to a 3D classification where truncated (possibly denatured due to the air-water interface) particles were classified out. The final reconstruction used only the 3D class with the entire molecule. As can be seen in the 2D classes, the angular distribution of particles and the 3D FSC (Tan et al., 2017) there are multiple orientations. Finally, the resmap map shows the structure is mostly 4–5 Å.
Figure 3—figure supplement 2
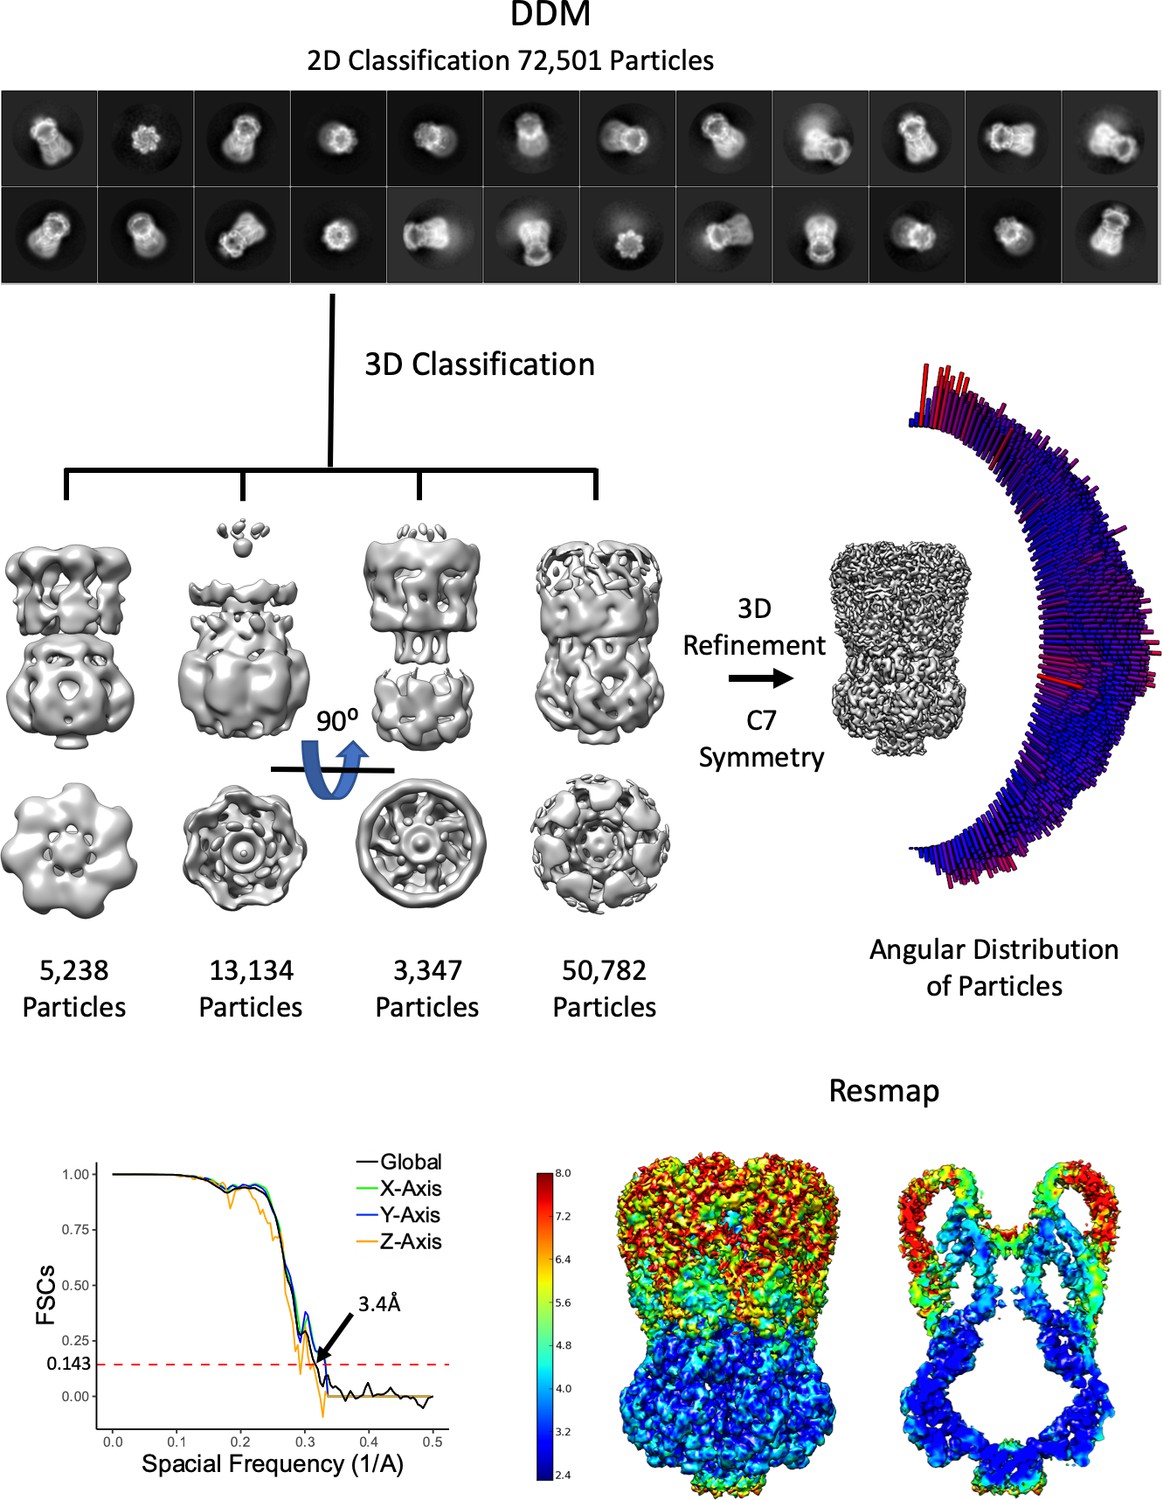
Overview of MscS DDM Density Refinement.
From 1328 movies, 72,501 particles were used after 2D classification. The selected 2D classes were subjected to a 3D classification where truncated (possibly denatured due to the air-water interface) particles were classified out. The final reconstruction used only the 3D class with the entire molecule. As can be seen in the 2D classes, the angular distribution of particles and the 3D FSC (Tan et al., 2017) there are multiple orientations.
Figure 3—figure supplement 3
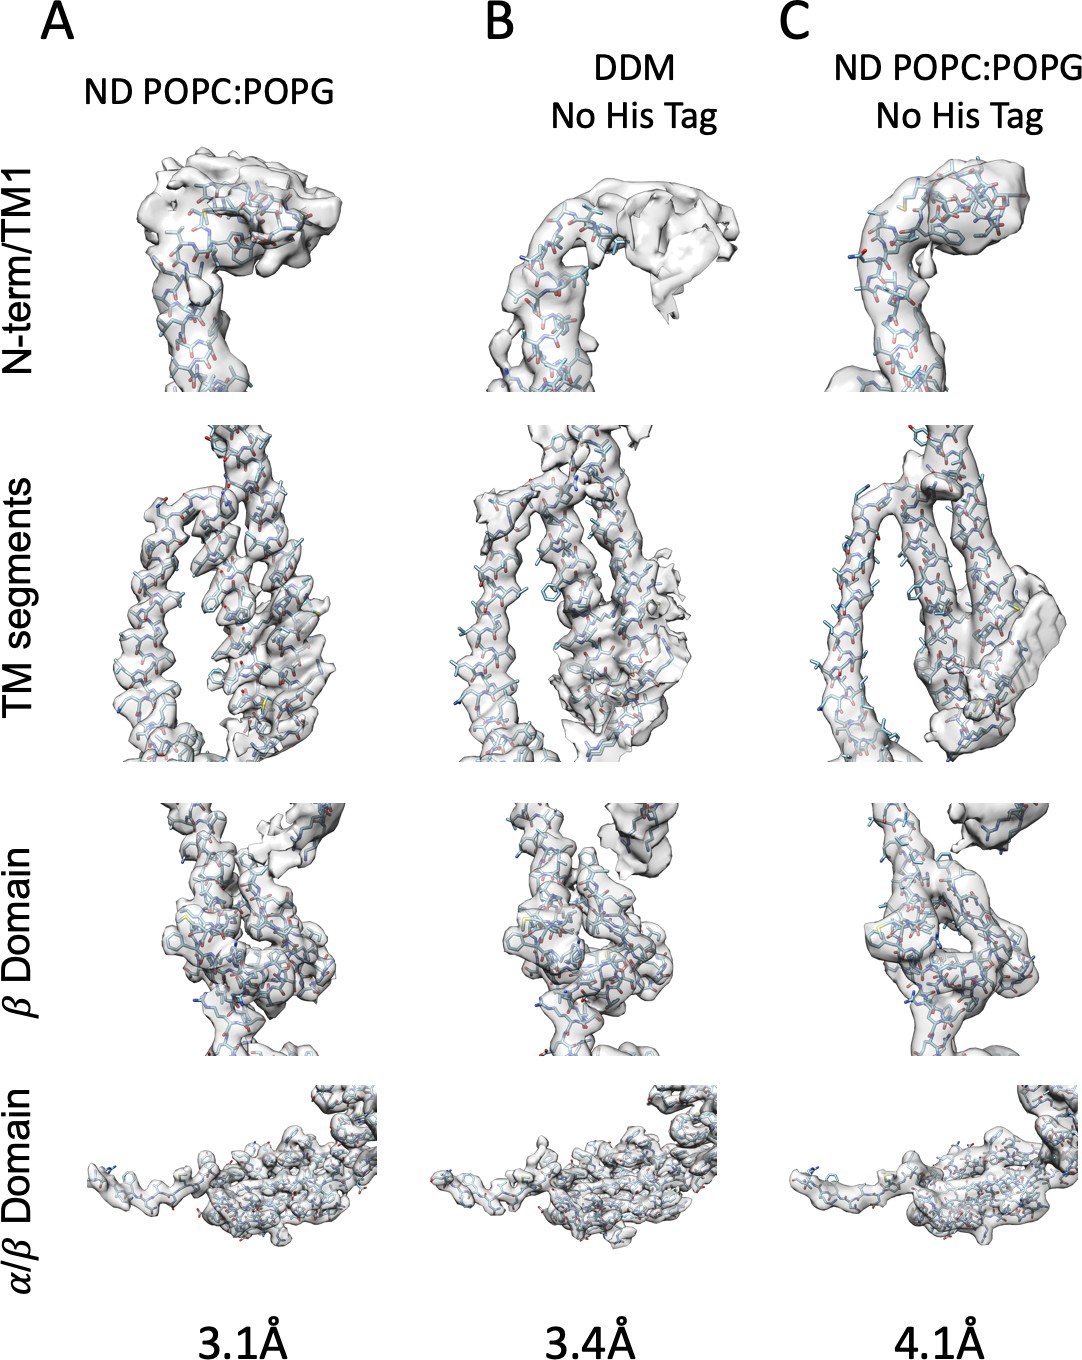
Model Fit to Density.
(A) MscS ND (B) DDM (C) MscS ND No His-Tag.
Figure 4 with 2 supplements
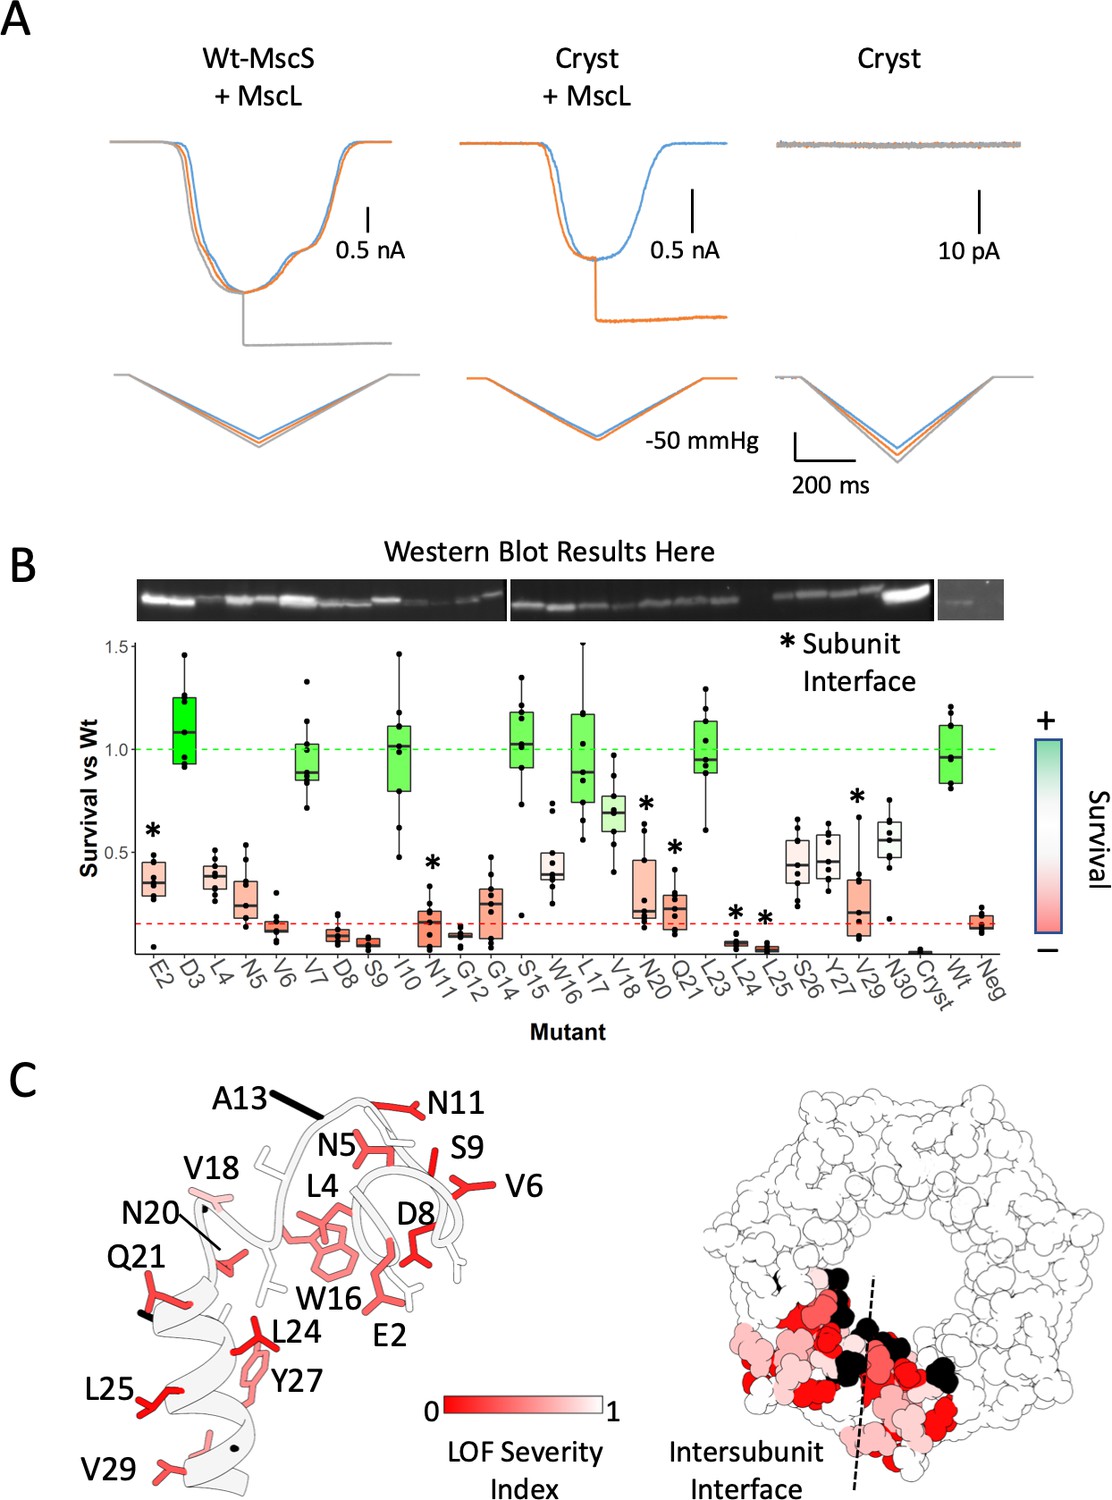
Functional significance of the anchor domain.
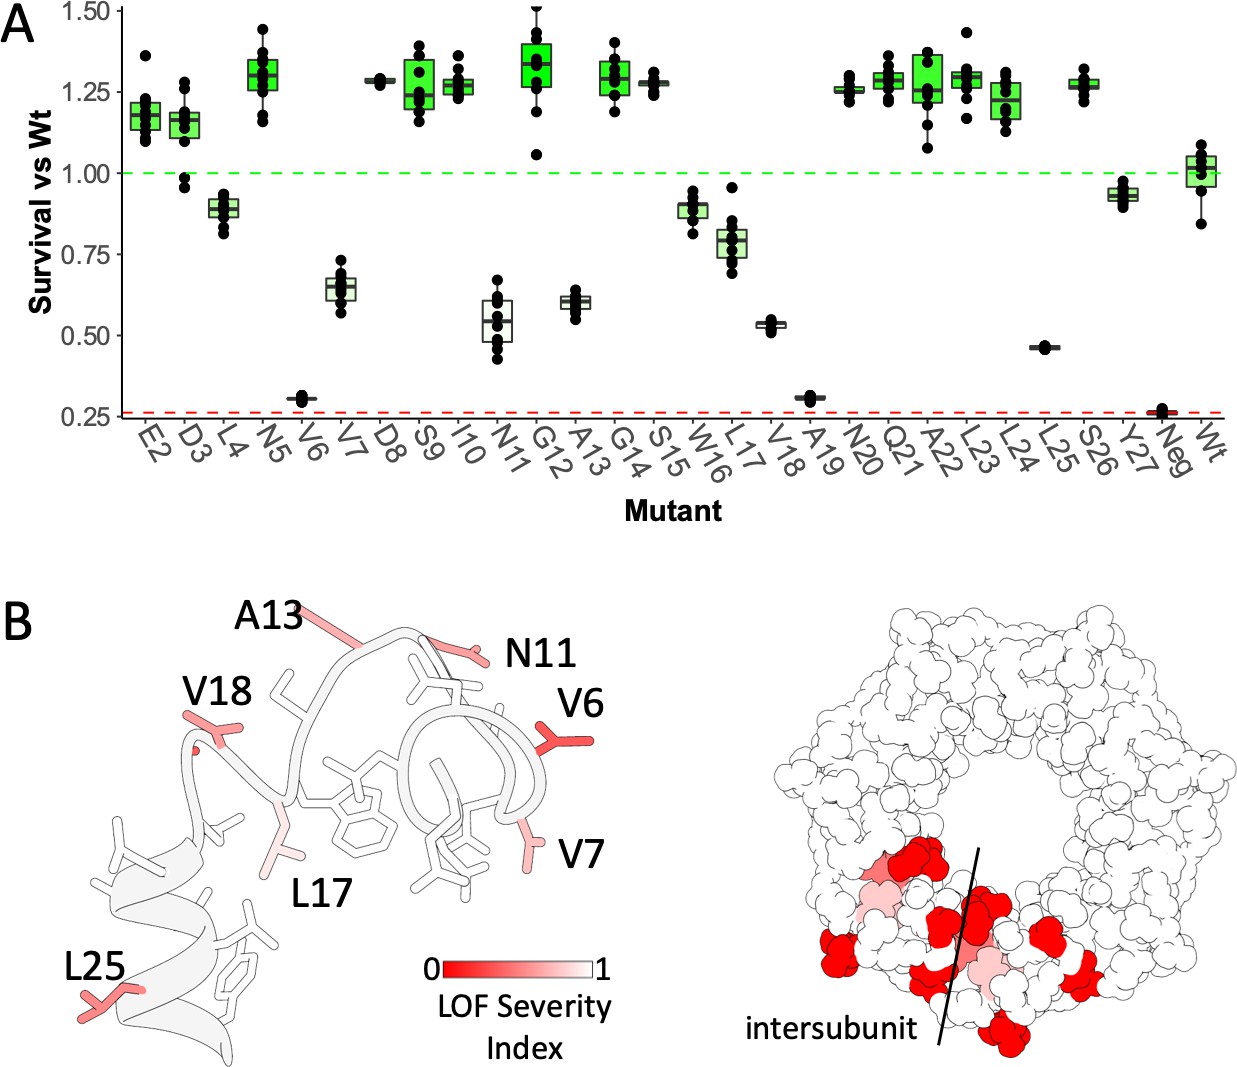
(A) Functional consequences of deleting the anchor domain (MscS ∆1–27). High-speed pressure clamp recordings of co-expressed MscS and MscL in HEK296 cells under voltage clamp conditions. A family of macroscopic currents elicited by pressure ramps are shown for co-expressed wt-MscL and wt-MscS (left traces), wt-MscL and Cryst (center traces) or Cryst alone (right traces). (B) Osmotic downshock assays of N-terminal alanine scan mutants. Box plots are shown for nine independent experiments, where the central bar represents the median, the box 25%−75% quartiles and the individual data are depicted as black dots. Data were normalized to the wild-type behavior and the dotted lines represent the mean survival for the negative control (red, empty vector) and wt-MscS (green). Asterisks indicate residues located at the subunit interface. (C) Functional complementation of alanine scan mutants mapped onto the anchor domain structure. Left, side view of the anchor domain monomer. Right, top view of the anchor domain as a heptamer with data mapped on two adjacent subunits. The residues are colored by surivial relative to Wt (LOF Severity index) where 0 corresponds to no survival compared and one is equal or greater survival than wild-type. Black residues are wild-type alanines (not evaluated). The dashed line indicates the location of the subunit interface.
Figure 4—figure supplement 1

Functional consequences of an N-terminal 6xHis-Tag.
(A) 3D refined model from Figure S2 without masking the His-tag region. Insets show a 45-degree view of the 6xHis tag density (top) and a center section (bottom). The his-tag residues were modeled using coot and molecular dynamic flexible fitting (Ref). (B) As stable 6xHis tag ‘crown’ oligomer inhibits MscS opening. High-speed pressure clamp recordings of reconstituted MscS in HEK296 DMPC:DMPG 3:1. Families of macroscopic currents, elicited by pressure ramps are shown for Wt-MscS with the 6x His-Tag at its C-terminal (C) MscS with the 6x His-Tag at its N-terminus and (D) MscS with the 6x His-Tag after Thrombin cleavage. These data strongly suggest that the N-terminal anchor domain likely separates (in the plane of the bilayer) upon MscS opening.
Figure 4—figure supplement 2
Osmotic downshock assays of N-terminal Cystine Scan Mutants.
(A) Influence of cysteine substitutions in the anchor domain, estimated from downshock assays. Box plots are shown for nine independent experiments, replotted form Vasquez et al. (2008), where the central bar represents the median, the box 25%−75% quartiles, and the individual data are depicted as black dots. Data were normalized to the wild-type behavior, and the dotted lines represent the mean survival for the negative control (red, empty vector) and wt-MscS (green). (B) Like in Figure 1E, functional complementation of Cystine scan mutants mapped onto the anchor domain structure made using molecular dynamic flexible fitting into the density. Left, side view of the anchor domain monomer. Right, top view of the anchor domain as a heptamer with data mapped on two adjacent subunits. The dashed line indicates the location of the subunit interface.
Figure 5 with 3 supplements

Bound lipid at the inner gate and the permeation pathway.
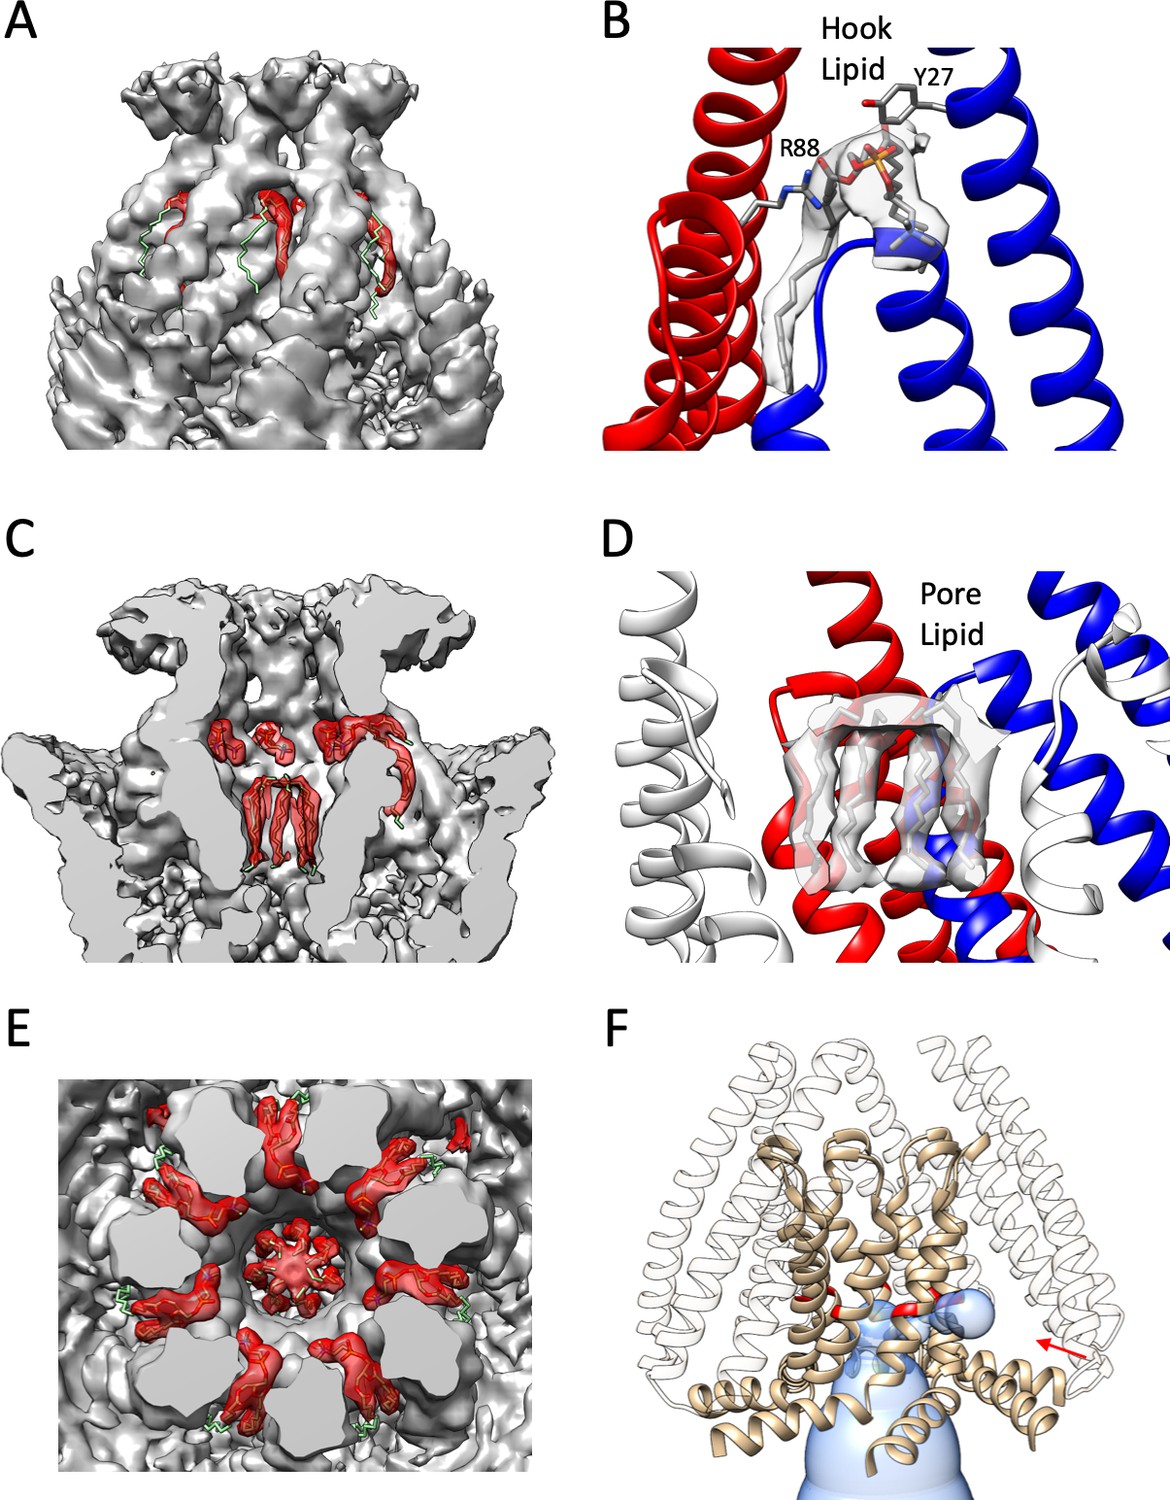
(A) Side (left) and top (right) views of EM density (transparent red surface) associated with putative lipid molecules bound to MscS-ND (shown in white cartoon representation). A ‘hook’ phospholipid is cradled at the subunit interface atop the TM2-TM3 hairpin, while seven individual acyl chains line the permeation pathway along TM3, above the narrowest portion of the gate. (B) Contact map and coordination of the hook lipid. Left, TM helices from two adjacent subunits (red and blue) are shown. Key interactions are highlighted for R88 (in the red subunit) with the head group nitrogen (PC or PE) and Y27 (in the blue subunit) with the phosphate group. Residues within van der Waals distances are shown in red. Right, a cartoon representation of the contact/coordination map. (C) Same as (B), but with the pore lipid acyl chains.
Figure 5—figure supplement 1
Bound Lipids in MscS.
Close up of the hook lipid density fitted to a POPC molecule and pore lipid density fitted as a hexadecane. (A), Hook lipid density highlighted in red showing the insertion into a cavity formed by two adjacent TM1 helices and the hairpin of TM2-TM3a. One of the acyl chains is presumably partially averaged out due to local dynamics. (B) EM density corresponding to a hook lipid. Coordinating side chains Y27 and R88 (from two adjacent subunits) are shown in stick representation. (C) Overview of the hook and pore lipids in the context of the entire density. (D) Close up of pore lipids in close interaction with the N-terminal end of TM3 and the TM2-TM3 linker. (E) Top view of the lipids in the context of the entire density. (A), (C) and (E) have the lipids and overall density contorted at the same level. (F) Predicted pathway connecting the location of the putative pore lipids in the permeation path with the intracellular TM2/TM3a cavity. Volume predicted by MOLEonline (https://mole.upol.cz) is depicted as a blue transparent envelope. The tan ribbon corresponds to the TM3 a and TM3b helices with G104 colored red along with a red arrow points to the potential connecting gap between G104 residues in adjacent subunits.
Figure 5—figure supplement 2
Properties of the MscS Permeation Pathway.
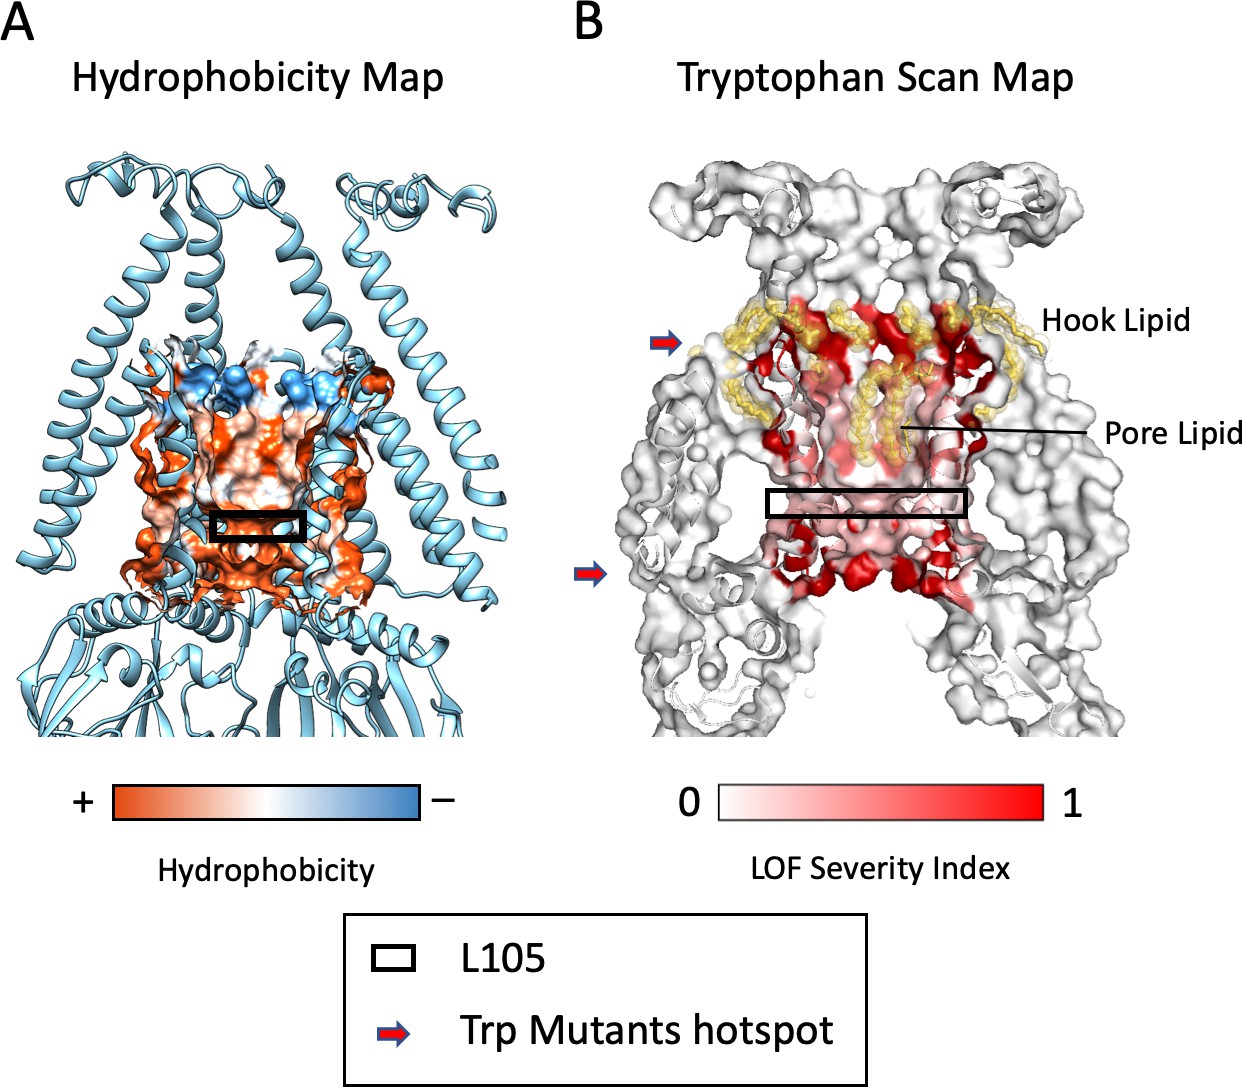
(A) Hydrophobicity map of the residues lining the pore (Chimera, Pettersen et al., 2004). Pore lining lipids (Figure 3C) are located in the hydrophobic region just above the L105 ‘gate’ residue (black box). (B) A Tryptophan scan of TM3a (Rasmussen et al., 2015), when mapped onto the ND-MscS structure shows two severe loss of function (LOF) areas (red arrows): A region that includes residues that coordinate the Hook Lipid (top) and a region (bottom arrow) around and below the L105 gate residue (black box).
Figure 5—figure supplement 3
Bound Lipids are also found in Detergent-Based Structures.
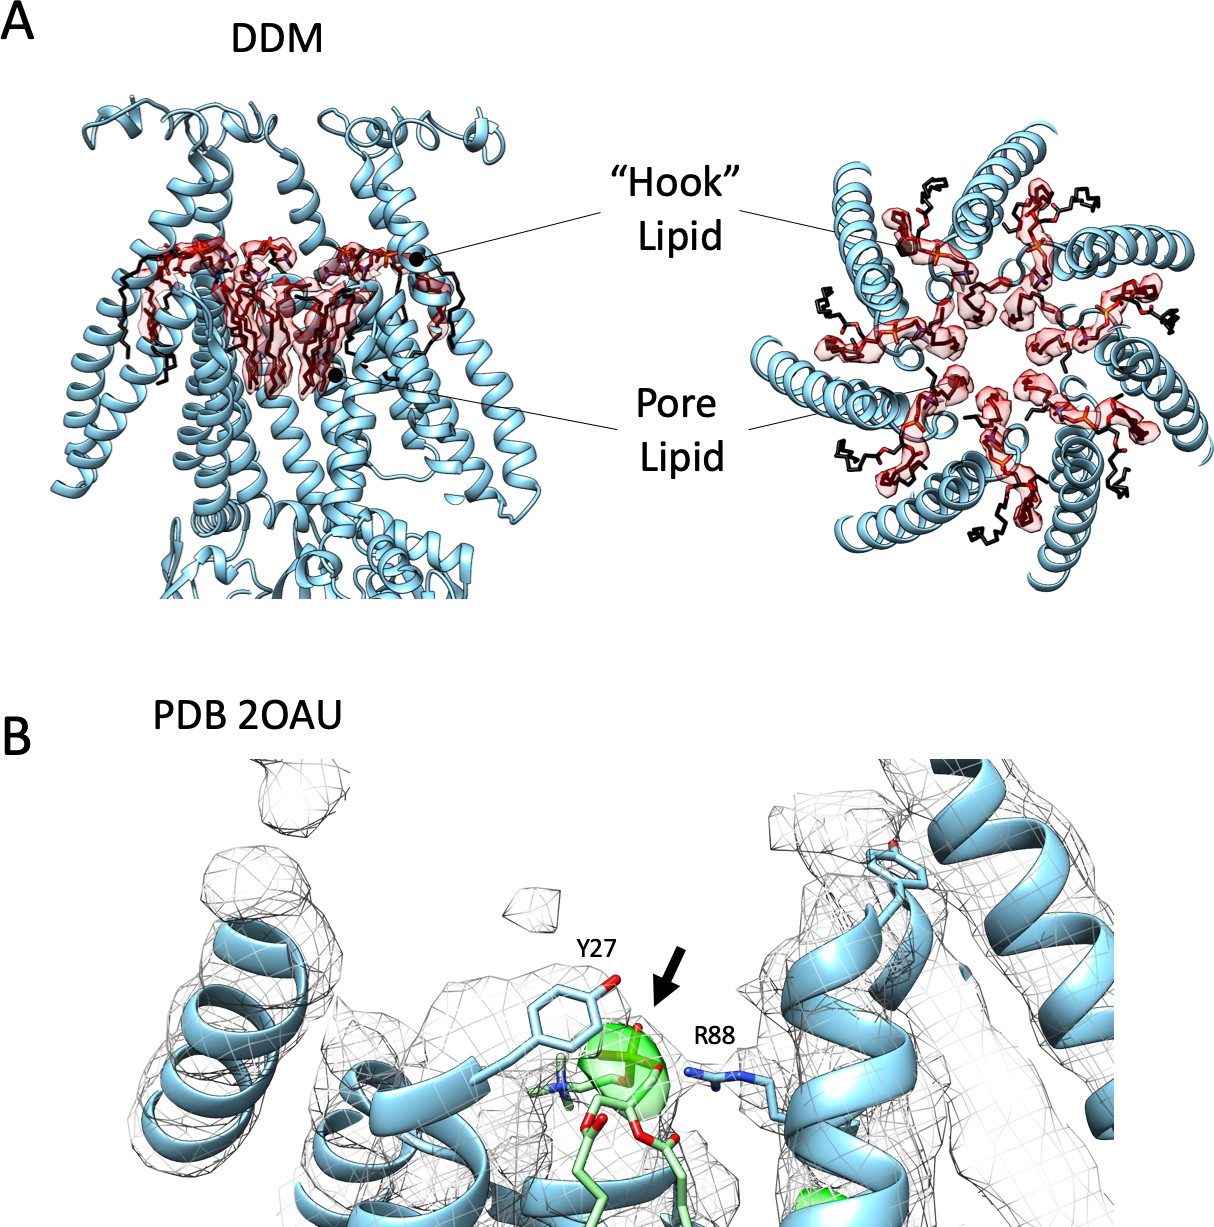
(A) Lipid density in MscS DDM cryo-EM structure. Like in Figure 3A, Side (left) and top (right) views of EM density (transparent red surface) associated with the putative lipid molecules bound to MscS-ND (shown in white cartoon representation). A ‘hook’ phospholipid is cradled at the subunit interface atop the TM2-TM3 hairpin, while seven individual acyl chains line the permeation pathway along TM3, above the narrowest portion of the gate. (B) Electron density maps of 2OAU, in Foscholine-14. 2Fo-Fc map is a grey mesh while the Fo-Fc map is in green. MscS ND cryo-EM model was aligned to the 2OAU model in cyan. The MscS ND hook lipid (POPC), in green, the phosphate group is within the green density. Despite the crystal structure not having any explicit lipids, this density would correspond to the highest electron-dense chemical group in the crystal (Phosphate). Residues Y27 and R88 are precisely positioned to coordinate this density in an equivalent way as the hook lipid in ND-MscS (Figure 3—figure supplement 3A).
Figure 6

Role of bound lipids on the permeation pathway.
(A) MD simulation of water permeation during 10 ns of equilibration under three lipid occupancy conditions: In the absence of bound lipids (black trace), with the hook lipid-bound (red trace) and with both hook and pore lipids bound (blue trace). Waters were counted in a 3 × 2 Å cylinder that includes the L105 residue (shown in the insets). (B) Close-up of the MscS permeation path under the three conditions described in (A). In each case the top image shows side views with water molecules in stick representation and the hook and bound lipids as VDW spheres. The cyan bar represents the slab thickness of the cross section in the bottom image (rotated 90 degrees).
Figure 7 with 1 supplement
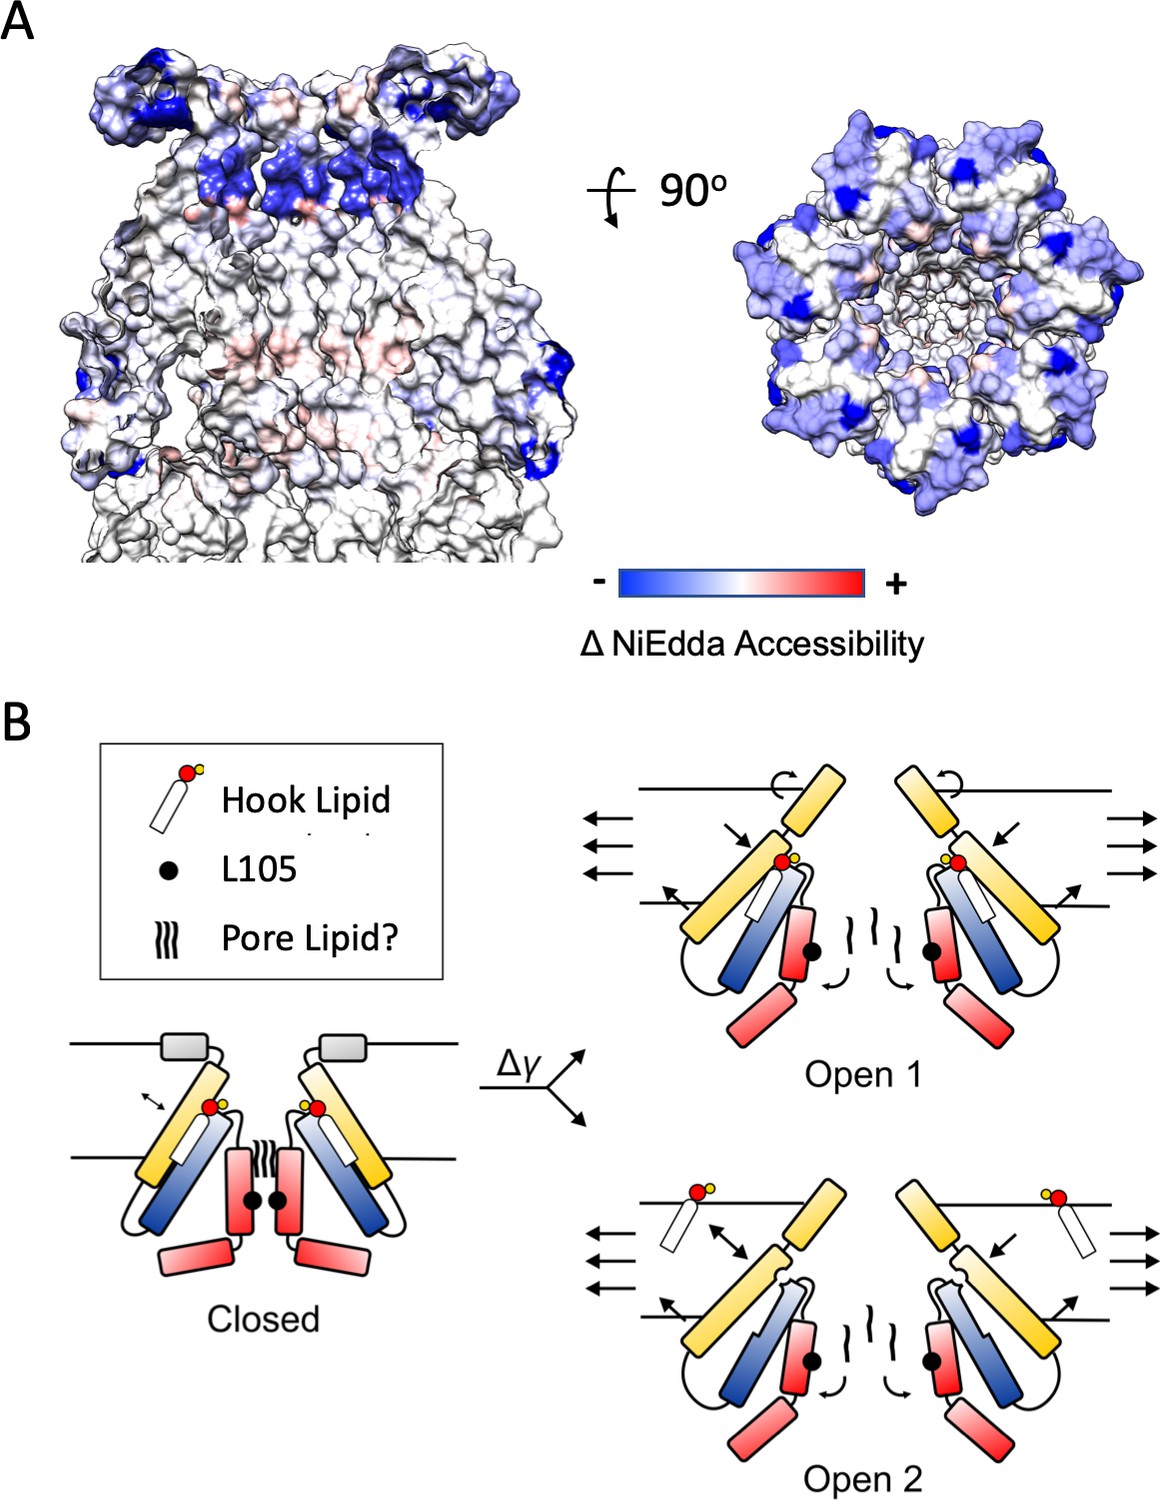
Mechanisms of Force-from-Lipid gating in MscS.
(A) Extent and direction of environmental parameter changes upon MscS opening. Left, NiEdda accessibility (ΠNiEdda) mapped on MscS-ND transmembrane segments. Right, Changes in NiEdda accessibility (ΔΠNiEdda) mapped on MscS-ND transmembrane segments. Data from Vasquez et al. (2008). Note, however that the EPR data were obtained on an unconstrained (though lipid embedded) N-terminal domain and should be treated as a general guide. A decrease in NiEdda accessibility corresponds to a decrease in accessibility to the aqueous milieu. (B) A lipid-centric mechanism of force transduction in MscS. In the nominal absence of external forces, MscS populates the resting, closed state represented by the MscS-ND structure (Figure 1). The non-conductive nature of the closed conformation is determined by a narrow cuff of hydrophobic residues around L105 (black circles) and above that, a plug of acyl chains from the pore lipid. The inter-subunit hook lipid links the top of the TM2-TM3a hairpin and the hydrophobic core of the bilayer. Applying forces in the plane of the bilayer lead to two gating scenarios, depending on whether the hook lipid stays bound to the open channel or not. In the first case (top) the expansion of TM1 in the periphery of MscS is allosterically communicated to the TM2-TM3 hairpin through the hook lipid, leading to the expansion of TM3a and release of the pore lipid. In the second option (bottom), expansion of TM1 destabilizes the binding of the hook lipid which exchanges with the bulk of the bilayer. Acting as a ligand, the release of the hook lipid triggers a conformational rearrangement in TM3a, with subsequent release of the pore lipid, leading to conduction.
Figure 7—figure supplement 1
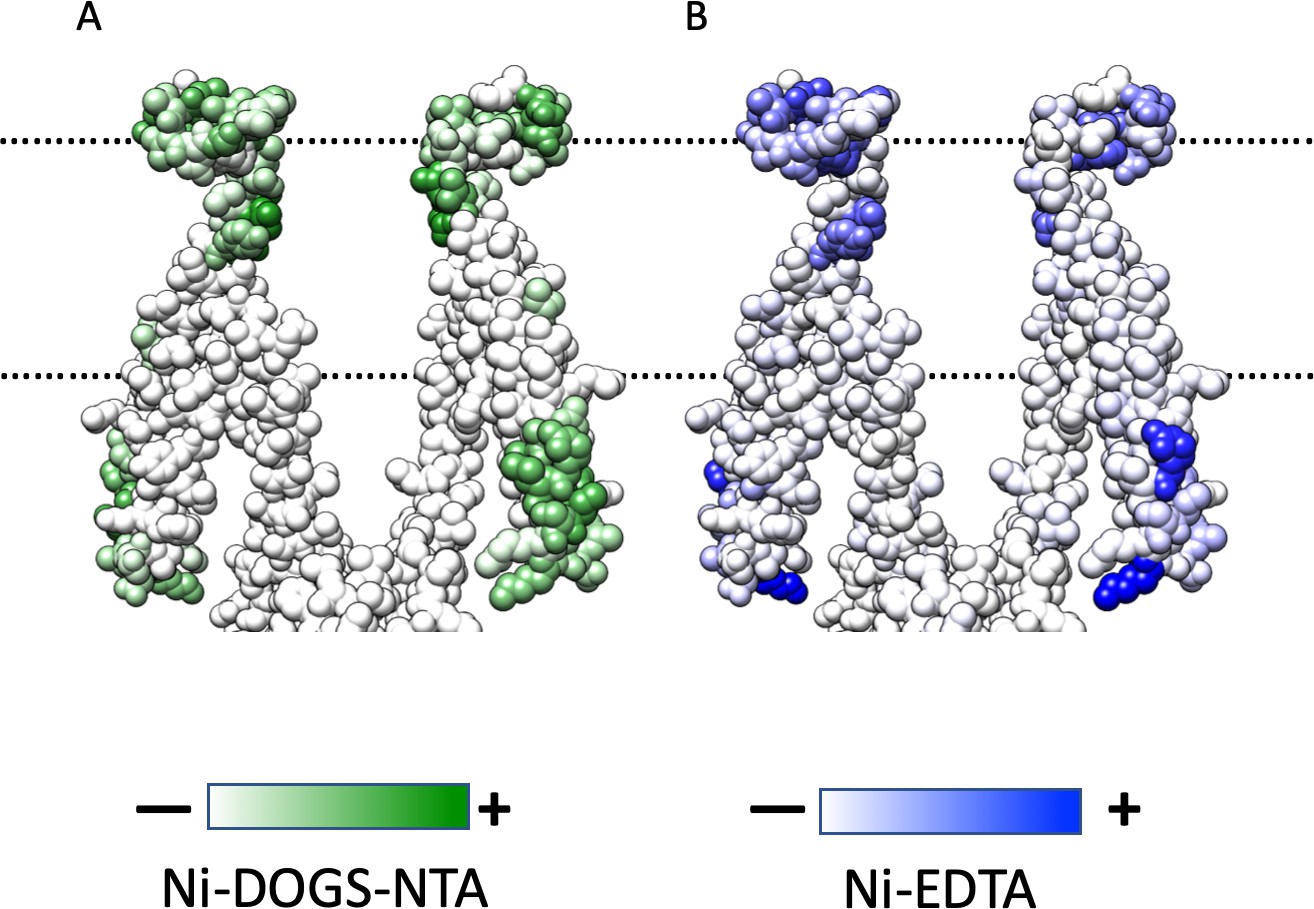
Mapping of EPR Data.
(A) Ni-DOGS-NTA accessibility mapped on MscS-ND transmembrane segments at rest. (B) NiEdda accessibility mapped on MscS-ND transmembrane segments. Data from Vasquez et al. (2008).
Author response image 1

Difference between the surface tension and overall membrane tension based on the lateral pressure profile of the bilayer.
(A) The area shaded with red shows where regarded as “surface tension”, and blue the repulsive forces at the tail region of the bilayer and between the headgroups. (B) Illustration of how the pressure profile of the lipid bilayer in the presence of an MS channel (MscL) changes at different surface tensions of 50 mN/m and 75 mN/m in an NγPzT ensemble (Adapted from Bavi et al., 2016 (reference 4)). As shown, when the target surface tension is 50 mN/m the pressure profile of the lipid shows little or no change in the presence of the channels. Changes in the pressure profile only start to be noticed at 75 mN/m, particularly at the lipid water interface. In this condition (target surface tension of 75 mN/m; blue line), compared to a non-stressed bilayer (equilibrium; dark green) and based on the area under the pressure profile we estimate a mean membrane tension of 25.5 mN/m has been applied on the membrane, which is about 4x the experimental value required to activate MscS in patch clamp experiments.
Author response image 2
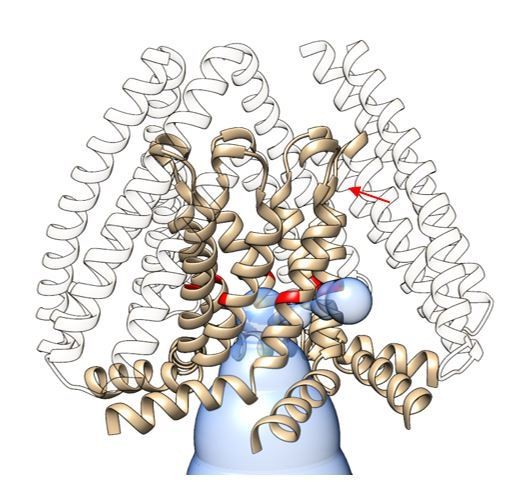
Predicted pathway connecting the location of the putative pore lipids in the permeation path with the intracellular TM2/TM3a cavity.
Volume predicted by MOLEonline (https://mole.upol.cz) is depicted as a blue transparent envelope. The tan ribbon corresponds to the TM3 a and TM3b helices, with G104 colored red. An arrow points to the potential connecting gap between adjacent subunits.
Tables
Key resources table
| Reagent type (species) or resource | Designation | Source or reference | Identifiers | Additional information |
|---|---|---|---|---|
| Gene (E. coli | Addgene# 7855 | 6x N-Terminal His-Tag | ||
| Gene (E. coli) | Addgene# 20066 | |||
| Strain, strain background (E. coli) | MJF465 | Ian Booth and Samantha Miller, University of Aberdeen | ||
| Other | POPC | Avanti Polar Lipids | 850457C | |
| Other | POPG | Avanti Polar Lipids | 840457C | |
| Other | E. coli Polar Lipids | Avanti Polar Lipids | 100600C | |
| Other | Bio-Beads SM-2 Resin | Bio Rad | 1523920 | |
| Other | Quantifoil 2/2 Mesh 200 | Quantifoil | ||
| Other | Quantifoil 1.2/1.3 Mesh 300 | Quantifoil | ||
| Other | Octyl Maltoside, Fluorinated | Anatrace | O310F | |
| Other | n-Dodecyl-β-D-Maltopyranoside | Anatrace | D310A | |
| Other | Fos-Choline-14 | Anatrace | F312S | |
| Strain, strain background (E. coli) | Rosetta 2 | Millipore Sigma | 71400-3 | |
| Other | Thrombin | MP Biomedicals | 154163 | Bovine |
Additional files
-
Supplementary file 1
Data Tables:Cryo-EM data collection and PMF parameters.
- https://cdn.elifesciences.org/articles/50486/elife-50486-supp1-v2.odt
-
Transparent reporting form
- https://cdn.elifesciences.org/articles/50486/elife-50486-transrepform-v2.pdf
Download links
A two-part list of links to download the article, or parts of the article, in various formats.
Downloads (link to download the article as PDF)
Open citations (links to open the citations from this article in various online reference manager services)
Cite this article (links to download the citations from this article in formats compatible with various reference manager tools)
Molecular basis of force-from-lipids gating in the mechanosensitive channel MscS
eLife 8:e50486.
https://doi.org/10.7554/eLife.50486


