Activity-dependent death of transient Cajal-Retzius neurons is required for functional cortical wiring
- Institut Imagine, Université de Paris, France
- Institut Jacques Monod, CNRS UMR 7592, Université de Paris, France
- Institute of Psychiatry and Neuroscience of Paris (IPNP), INSERM U1266, Université de Paris, France
- Institut de Biologie de l’École Normale Supérieure (IBENS), Département de Biologie, École Normale Supérieure, CNRS, INSERM, Université PSL, France
- INSERM U1128, France
- Friedrich Miescher Institute for Biomedical Research, Switzerland
- Universidad Miguel Hernandez, Spain
Figures
Figure 1 with 1 supplement

Hyperpolarization induces the survival of SE-CRs.
(A) Confocal images of cortical sections from P7, P15 and P25 ΔNp73cre/+;R26mT/+ controls (left) and ΔNp73cre/+;R26Kir2.1/+ mutants (right) stained for DsRed (red) and Hoechst (blue). Arrowheads indicate DsRed+ CRs at P15 and P25. (B) Quantification of CR density (CRs/mm3) at the pial surface in the somatosensory (S1) cortex (P7: n = 6 for controls and n = 4 for mutants, p=0.716; P15: n = 4 for controls and n = 10 for mutants, p=0.001; P25: n = 3 for controls and n = 8 for mutants, p=0.006). (C) Confocal images of cortical sections from P7, P15 and P25 Wnt3acre/+;R26mT/+ controls (left) and Wnt3acre/+;R26Kir2.1/+ mutants (right) stained for DsRed (red) and Hoechst (blue). Arrowheads indicate DsRed+ CRs at P15 and P25. For simplicity, arrowheads were not displayed at P7, as there are too many CRs at this stage. (D) Quantification of CR density (CRs/mm3) at the pial surface in the somatosensory (S1) cortex (P7: n = 5 for controls and n = 6 for mutants, p=0.2251; P15: n = 4 for controls and n = 3 for mutants, p=0.771; P25: n = 3 for controls and n = 3 for mutants, p=0.813). Mann-Whitney U Test. Scale bar represents 200 μm. Data used for quantitative analyses as well as the numerical data that are represented in graphs are available in Figure 1—figure supplement 1—source data 1.
Figure 1—figure supplement 1

Electrophysiological properties and morphology of rescued CRs in ΔNp73cre/+; R26Kir2.1/+ mice.
(A) Schematic representation of the electrophysiological recordings from ΔNp73cre/+ CRs. (B) Biocytin-filled CRs in ΔNp73cre/+;R26mT/+ at P17 and ΔNp73cre/+;R26Kir2.1/+ at P15 and P28 displayed a similar characteristic morphology of CRs. (C) Electrophysiological properties of control and rescued CRs expressing Kir2.1. Note that rescued CRs expressing Kir2.1 are hyperpolarized (resting potential, Vrest) at both P15-P17 (n = 16 for controls and n = 17 for mutants, p=0.0001) and P25-29 (n = 11 for mutants, p=0.002; Kruskal-Wallis test followed by a Bonferroni multiple comparison). Moreover, Kir2.1 expression modifies input resistance (Rin), without showing modifications of the amplitudes and durations of the first and second spikes or the afterhyperpolarization (AHP) (n = 12 for controls and n = 15 for mutants at P15-P17 and n = 7–8 for mutants at P25-P29; p<0.0001 for both ages; ANOVA test followed by a Bonferroni multiple comparison). (D) Quantifications of soma diameter of rescued ΔNp73cre/+;R26Kir2.1/+ CRs at P15-P17 and P25-P29 compared to control ΔNp73cre/+;R26mT/+ CRs at P13-P17 (n = 8 for controls and n = 8 for mutants at P15-P17, p=0.075; n = 9 for mutants at P25-P29, p=0.004, compared to P13-P17 controls; one-way ANOVA test followed by a Bonferroni multiple comparison). (E) Quantifications of filament length of ΔNp73cre/+;R26Kir2.1/+ CRs at P15-P17 and P25-P29 compared to control ΔNp73cre/+;R26mT/+ CRs at P13-P17 (n = 8 for controls and n = 7 for mutants at P15-P17, p=0.636; n = 8 for mutants at P25-P29, p=0.964, compared to P13-P17 controls). (F) Merged and single channel confocal images of P7 and P25 mutant and control brains stained for DsRed (red), Reelin (Reln, green) and Hoechst (blue), showing that DsRed positive cells express Reln. Scale bars represent 100 μm. Data used for quantitative analyses as well as the numerical data that are represented in graphs are available in Figure 1—figure supplement 1—source data 1.
-
Figure 1—figure supplement 1—source data 1
Density and properties of CRs in the Kir2.1 model.
- https://cdn.elifesciences.org/articles/50503/elife-50503-fig1-figsupp1-data1-v1.xlsx
Figure 2 with 1 supplement
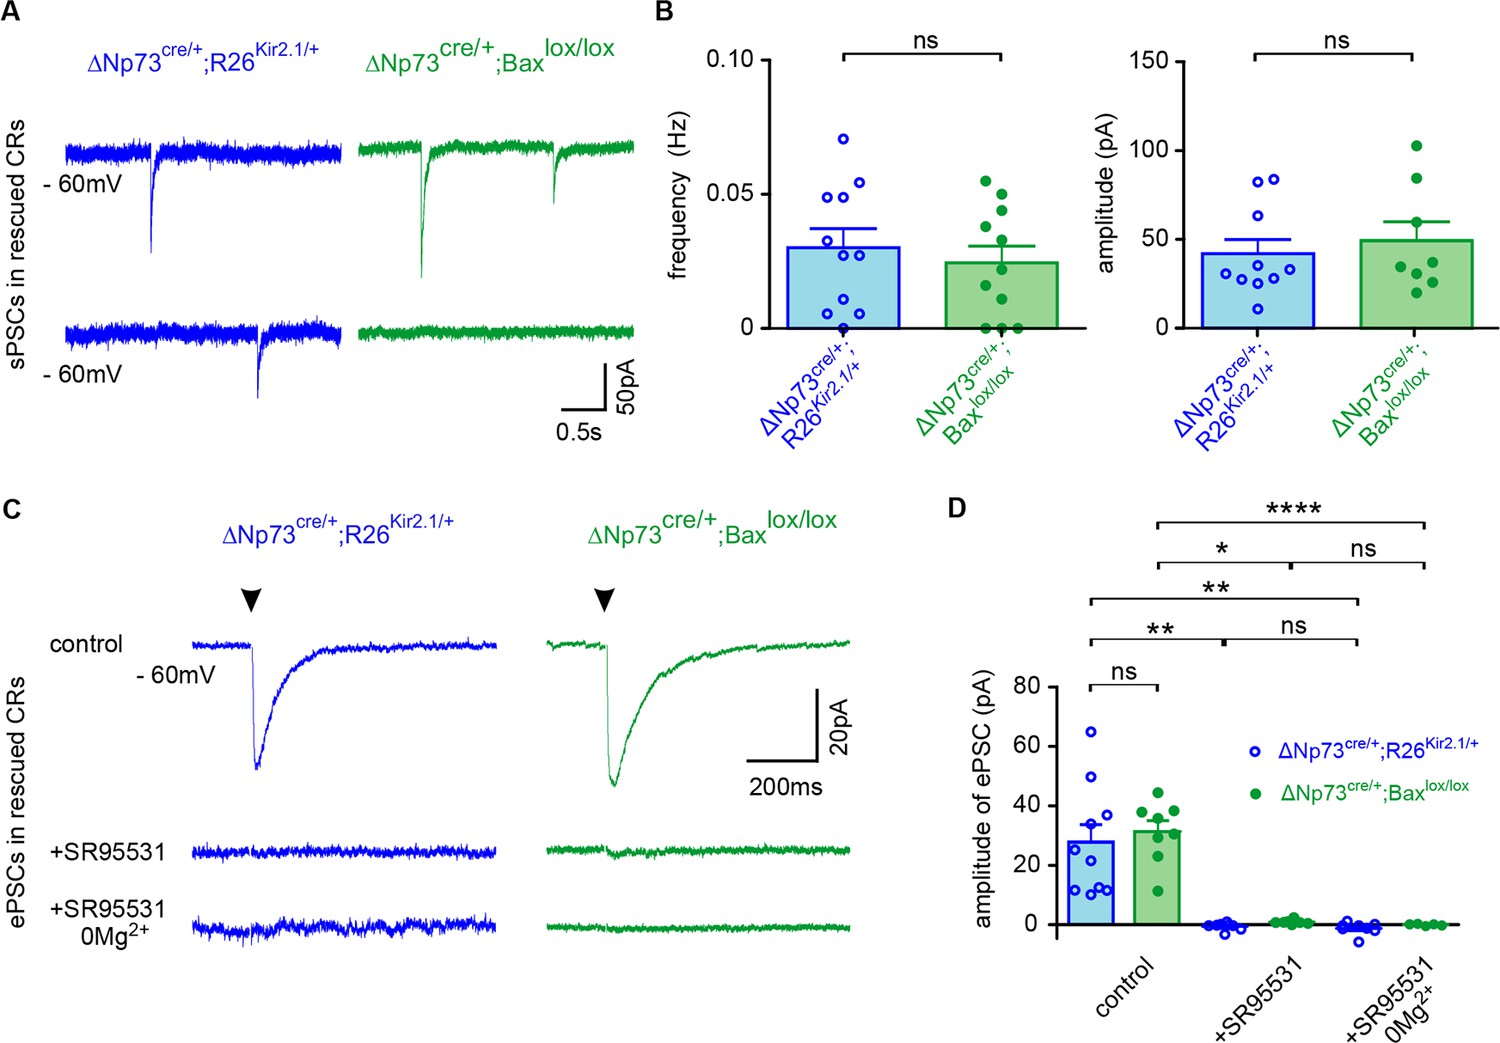
Pure GABAergic sPSCs and ePSCs in rescued CRs.
(A) Spontaneous PSCs (sPSCs) recorded in rescued CRs from ΔNp73cre/+;R26Kir2.1/+ at P27 (blue) and ΔNp73cre/+;Baxlox/lox mutants at P26 (green), respectively. (B) Plots of the frequency and amplitude of sPSCs (n = 11 for ΔNp73cre/+; R26Kir2.1/+ and n = 11 for ΔNp73cre/+; Baxlox/lox mice at P24-29; frequency: p=0.552, amplitude: p=0.580, Student T Test). Rise time is 2.10 ± 0.42 ms vs 1.02 ± 0.20 ms and decay time 34.26 ± 6.39 ms vs 29.14 ± 3.56 ms for ΔNp73cre/+;R26Kir2.1/+ and ΔNp73cre/+;Baxlox/lox mice, respectively. (C) Mean evoked PSCs (ePSCs) for rescued CRs respectively from a ΔNp73cre/+;R26Kir2.1/+ mutant at P29 (blue) and a ΔNp73cre/+;Baxlox/lox mutant at P26 (green) upon stimulation of LI neuronal fibers (stimulation time, arrowhead) in control conditions (top), with SR95531 (middle) and SR95531 in Mg2+-free solution (bottom). Note that ePSCs completely disappeared after bath application of SR95531. (D) Amplitudes of ePSCs in control conditions, with SR95531 and with SR95531 in Mg2+-free solution (ΔNp73cre/+;R26Kir2.1/+ mice at P24-29: ncontrol = 10, nSR95531 = 8 and nSR95531/Mg2+free=8; ΔNp73cre/+;Baxlox/lox: ncontrol = 8, nSR95531 = 5 and nSR95531/Mg2+free=5; Kruskal-Wallis test followed by a Bonferroni multiple comparison when comparing the three conditions for each mutant; Student T test for comparison of control ePSCs between ΔNp73cre/+;R26Kir2.1/+ and ΔNp73cre/+;Baxlox/lox mutants, p=0.638). To detect CRs in ΔNp73cre/+;Baxlox/lox mutants the R26mT/+ reporter line was used. Data used for quantitative analyses as well as the numerical data that are represented in graphs are available in Figure 2—figure supplement 1—source data 1.
Figure 2—figure supplement 1
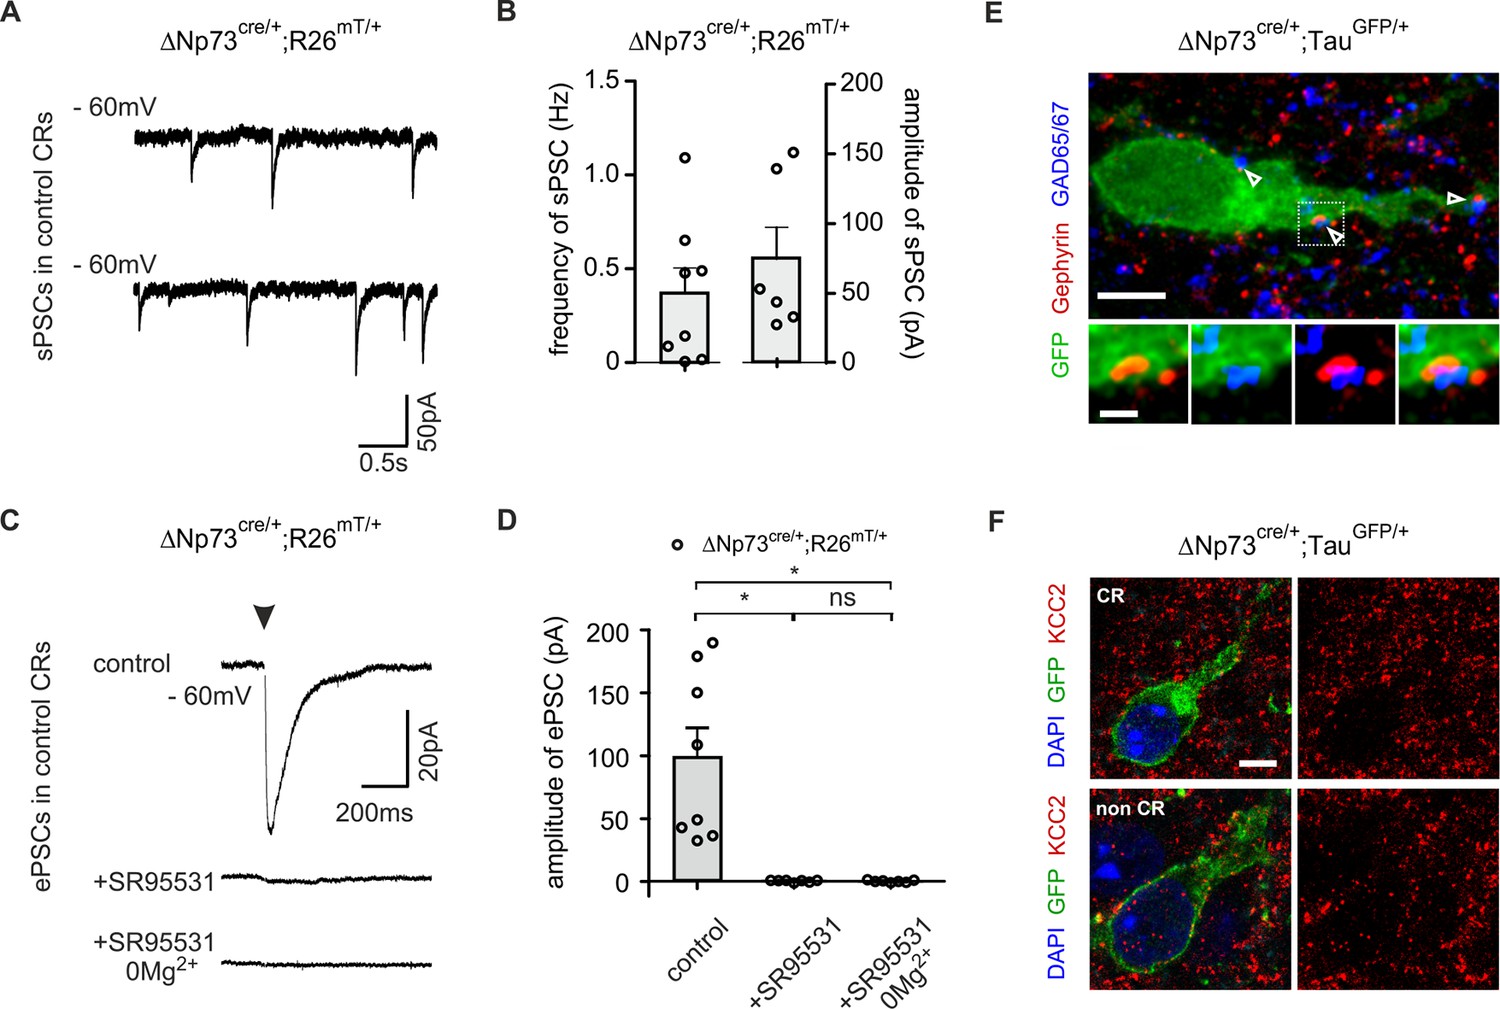
Pure GABAergic sPSCs and ePSCs in control CRs during early postnatal development.
(A) Spontaneous PSCs (sPSCs) recorded in a control CR from ΔNp73cre/+;R26mt/+ at P10. (B) Plots of the frequency and amplitude of sPSCs (n = 8) (p=0.0025 and p=0.0022 for the frequency of sPSCs of controls compared to rescued CRs of both ΔNp73cre/+;R26Kir2.1/+ and ΔNp73cre/+;Baxlox/lox;R26mT/+ mice (Figure 2A); one-way ANOVA followed by a Bonferroni post hoc test). (C) Mean evoked PSCs (ePSCs) for a control CR at P9-11 upon stimulation of LI neuronal fibers in control conditions (top), with SR95531 (middle) and SR95531 in Mg2+-free solution (bottom). Note that ePSCs completely disappeared after bath application of SR95531. Stimulation artefacts were blanked for visibility. The stimulation time is indicated (arrowheads). (D) Amplitudes of ePSCs in control conditions (p=0.0027 and p=0.0067 for the amplitude of ePSCs in controls compared to rescued CRs of ΔNp73cre/+;R26Kir2.1/+ and ΔNp73cre/+;Baxlox/lox;R26mT/+mice, (Figure 2D); one-way ANOVA followed by a Bonferroni post hoc test), in the presence of SR95531 and with SR95531 in Mg2+-free solution (ncontrol = 8, nSR95531 = 7 and nSR95531/Mg2+free=7; Kruskal-Wallis test followed by a Bonferroni multiple comparison). (E) Confocal images of a control CR at P10 in ΔNp73cre/+;TauGFP/+ mice expressing GFP (green), Gephyrin (red) and contacted by GABAergic GAD65/67-positive presynaptic terminals (blue; objective 93×; stack of 109 Z sections, each 0.07 µm, n = 11). Arrowheads show GABAergic synapses onto the CR. Note the partial co-localization of GAD65/67 and Gephyrin on the GFP+ membrane of the CR (Inset). Scale bars: 5 µm and 1 µm (inset). (F) Confocal images of a Layer I CR in the cortex and non-CR in the hypothalamus at P10 stained for DAPI (blue), KCC2 (red) and GFP (green) in ΔNp73cre/+; TauGFP/+ mice (objective 93×; single plane of 0.07 µm, n = 6). Note the low level of KCC2 expression in control CR (upper panels) compared to non-CR of ΔNp73cre/+;TauGFP/+ mice (bottom panels). Scale bar represents 5 µm. Data used for quantitative analyses as well as the numerical data that are represented in graphs are available in Figure 2—figure supplement 1—source data 1.
-
Figure 2—figure supplement 1—source data 1
Evoked and Spontaneous PSCs in rescued and developing CRs.
- https://cdn.elifesciences.org/articles/50503/elife-50503-fig2-figsupp1-data1-v1.xlsx
Figure 3 with 1 supplement
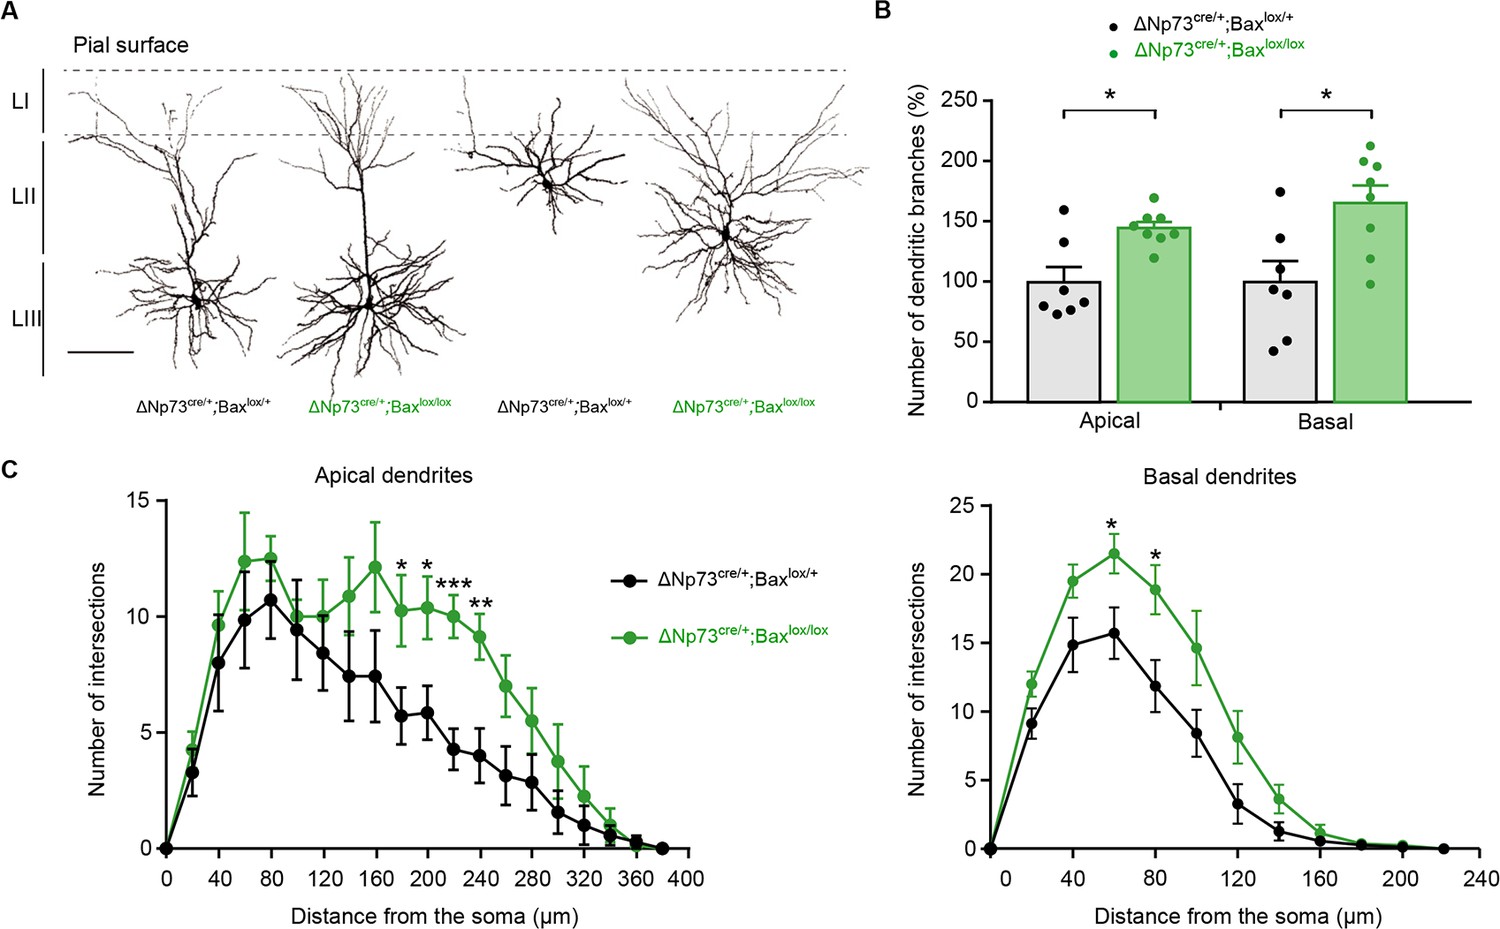
Increased dendritic branches in LII/LIII pyramidal neurons of ΔNp73cre/+;Baxlox/lox mutants.
(A) Representative examples of LII/III pyramidal neurons filled with biocytin in control (P25) and ΔNp73cre/+;Baxlox/lox mutant (P24) somatosensory cortex. (B) Quantification of the number of dentritic branches in control and ΔNp73cre/+;Baxlox/lox mutant LII/III pyramidal neurons, expressed as a percentage of dendritic branches relative to the mean of controls (n = 7 for controls and n = 8 for mutants at P23-28 p=0.0182 for apical dendrites and p=0.014 for basal dendrites; Mann-Whitney U Test). (C) Sholl analysis for the apical and basal dendrites in control and ΔNp73cre/+;Baxlox/lox mutants showing an increased cell complexity between 180 and 240 µm (p-value=0.04, 0.027, 0.0007 and 0.005, respectively) and 60 and 80 µm (p value=0.027 and 0.019, respectively) from the soma, respectively (n = 7 for controls and n = 8 for mutants). Multiple T-test. Scale bar represents 100 μm. Data used for quantitative analyses as well as the numerical data that are represented in graphs are available in Figure 3—figure supplement 1—source data 1.
Figure 3—figure supplement 1
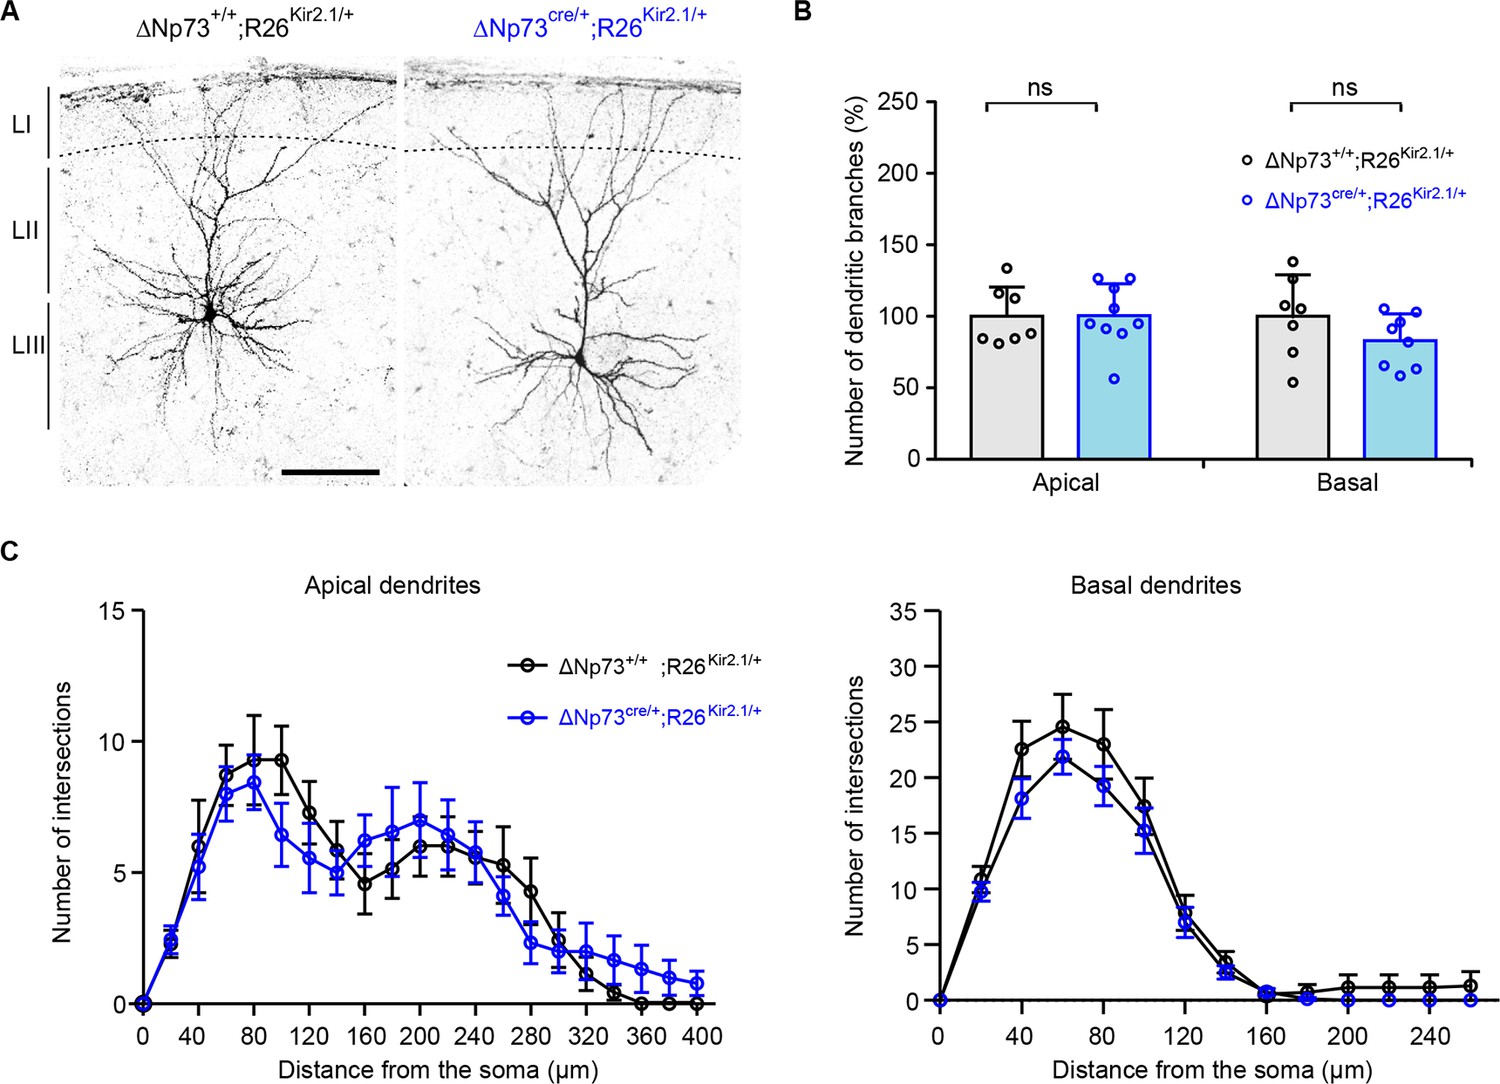
Morphological reconstruction of LII/LIII pyramidal neurons in ΔNp73cre/+;R26Kir2.1/+ mutants.
(A) Representative examples of somatosensory cortex LII/III pyramidal neurons filled with biocytin in control (P24) and ΔNp73cre/+;R26Kir2.1/+ (P27) mice. (B) Quantification of number of dendritic branches of LII/III pyramidal neurons in controls and ΔNp73cre/+;R26Kir2.1/+ mice, expressed as a percentage relative to the mean of controls (apical dendrites n = 7 for controls and n = 9 for mutants at P23-P29, p=0.550; basal dendrites n = 7 for controls and n = 8 for mutants at P23-P29, p=0.199; Mann-Whitney U Test). (C) Sholl analysis for the apical and basal dendrites in control and ΔNp73cre/+;R26Kir2.1/+ mutant mice showing no significant change in cell complexity with respect to the distance from the soma, (apical dendrites n = 7 for controls and n = 9 for mutants; basal dendrites n = 7 for controls and n = 8 for mutants). Multiple T-test. Scale bar represents 100 μm. Data used for quantitative analyses as well as the numerical data that are represented in graphs are available in Figure 3—figure supplement 1—source data 1.
-
Figure 3—figure supplement 1—source data 1
Morphological analyses of layer II/III pyramidal cells in the Bax and Kir2.1 models.
- https://cdn.elifesciences.org/articles/50503/elife-50503-fig3-figsupp1-data1-v1.xlsx
Figure 4 with 1 supplement
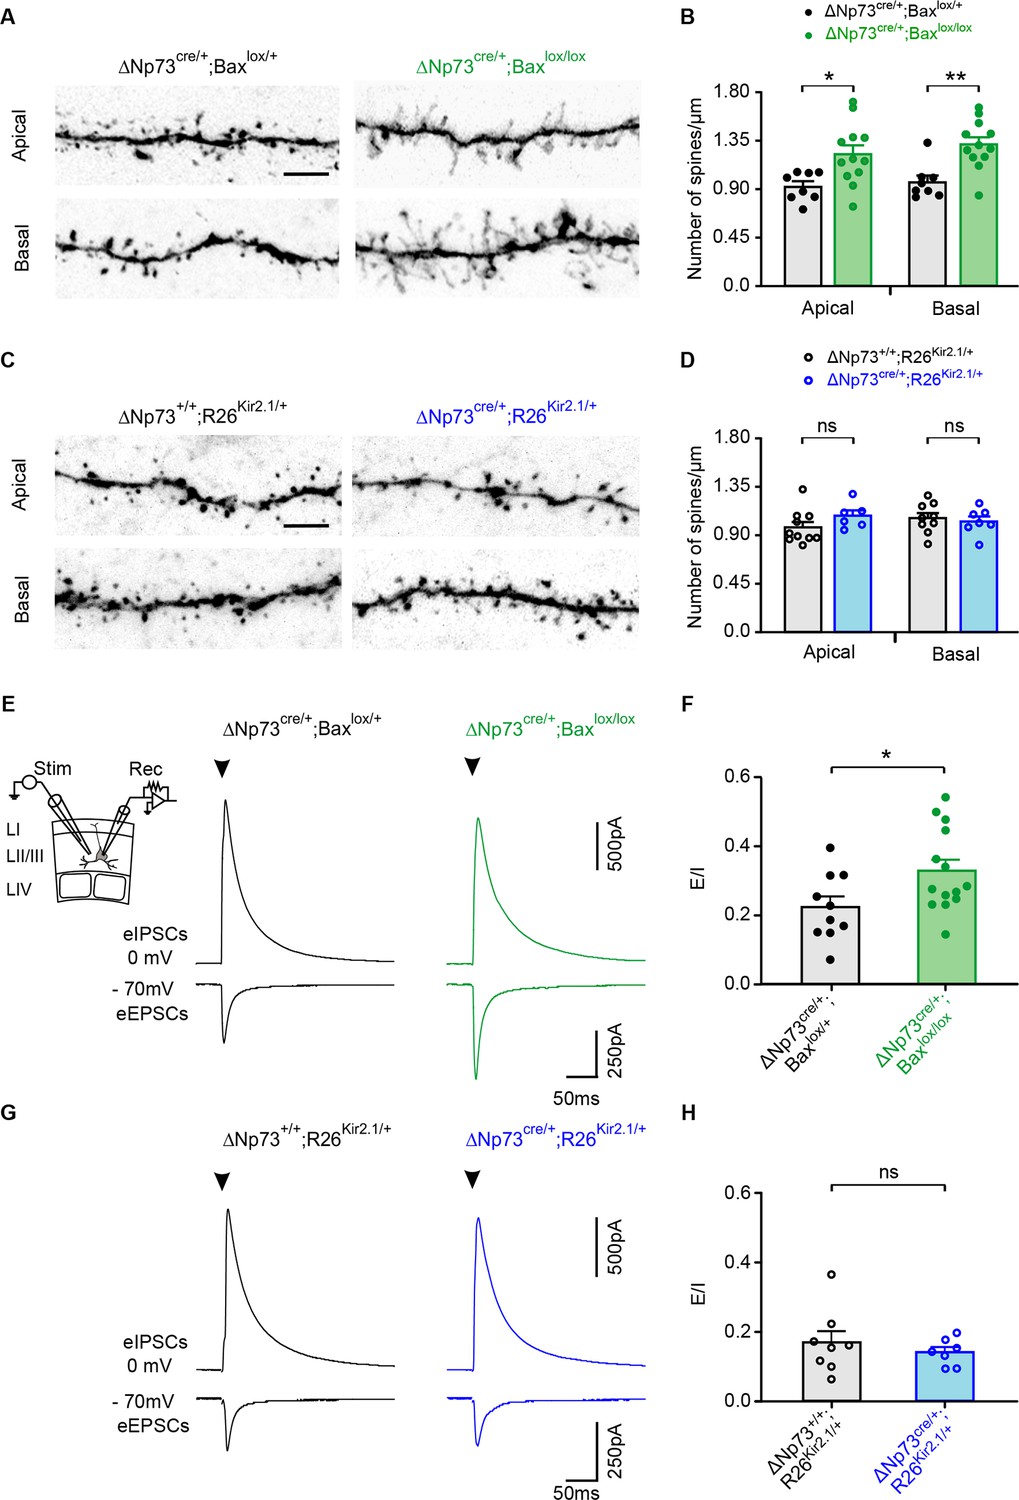
Spine density and evoked synaptic activity recorded in LII/LIII pyramidal neurons in both ΔNp73cre/+;Baxlox/lox and ΔNp73cre/+;R26Kir2.1/+ mutants.
(A, C) Representative confocal images showing spines in apical and basal dendritic segments of controls (left) and ΔNp73cre/+;Baxlox/lox (A, right) and ΔNp73cre/+;R26Kir2.1/+ mutants (C, right) at P24-25. (B, D) Quantification of the spine density (number of spines/µm) in apical and basal dendrites in LII/LIII pyramidal neurons for both controls and mutants from the same litters (for ΔNp73cre/+;Baxlox/lox apical and basal dendrites: n = 8 for controls and n = 12 for mutants at P23-28, p=0.012 for apical dendrites and p=0.0014 for basal dendrites; for ΔNp73cre/+;R26Kir2.1/+ apical dendrites: n = 10 for controls and n = 6 for mutants at P23-P29, p=0.166; basal dendrites: n = 9 for controls and n = 7 for mutants, p=0.652; Mann-Whitney U Test). Scale bar represents 5 μm. (E, G) Pyramidal neurons recorded in voltage-clamp at −70 mV and 0 mV in control at P26 (E, left) and P24 (G, left) and in a ΔNp73cre/+;Baxlox/lox mutant at P23 (E, right) and a ΔNp73cre/+;R26Kir2.1/+ mutant at P28 (G, right) during the extracellular stimulation of LII/III fibers as indicated (E, inset). Stimulation artefacts were blanked for visibility. The stimulation time is indicated (arrowheads). (F, H) Plots of E/I ratio calculated from eEPSCs and eIPSCs in controls and ΔNp73cre/+;Baxlox/lox mutants (F) and ΔNp73cre/+; R26Kir2.1/+ mutants (H) (for ΔNp73cre/+;Baxlox/lox: n = 10 for controls and n = 14 for mutants, p=0.031, Student T Test; for ΔNp73cre/+;R26Kir2.1/+: n = 8 for controls and n = 7 for mutants, p=0.612; Mann-Whitney U Test). Data used for quantitative analyses as well as the numerical data that are represented in graphs are available in Figure 4—figure supplement 1—source data 1.
Figure 4—figure supplement 1
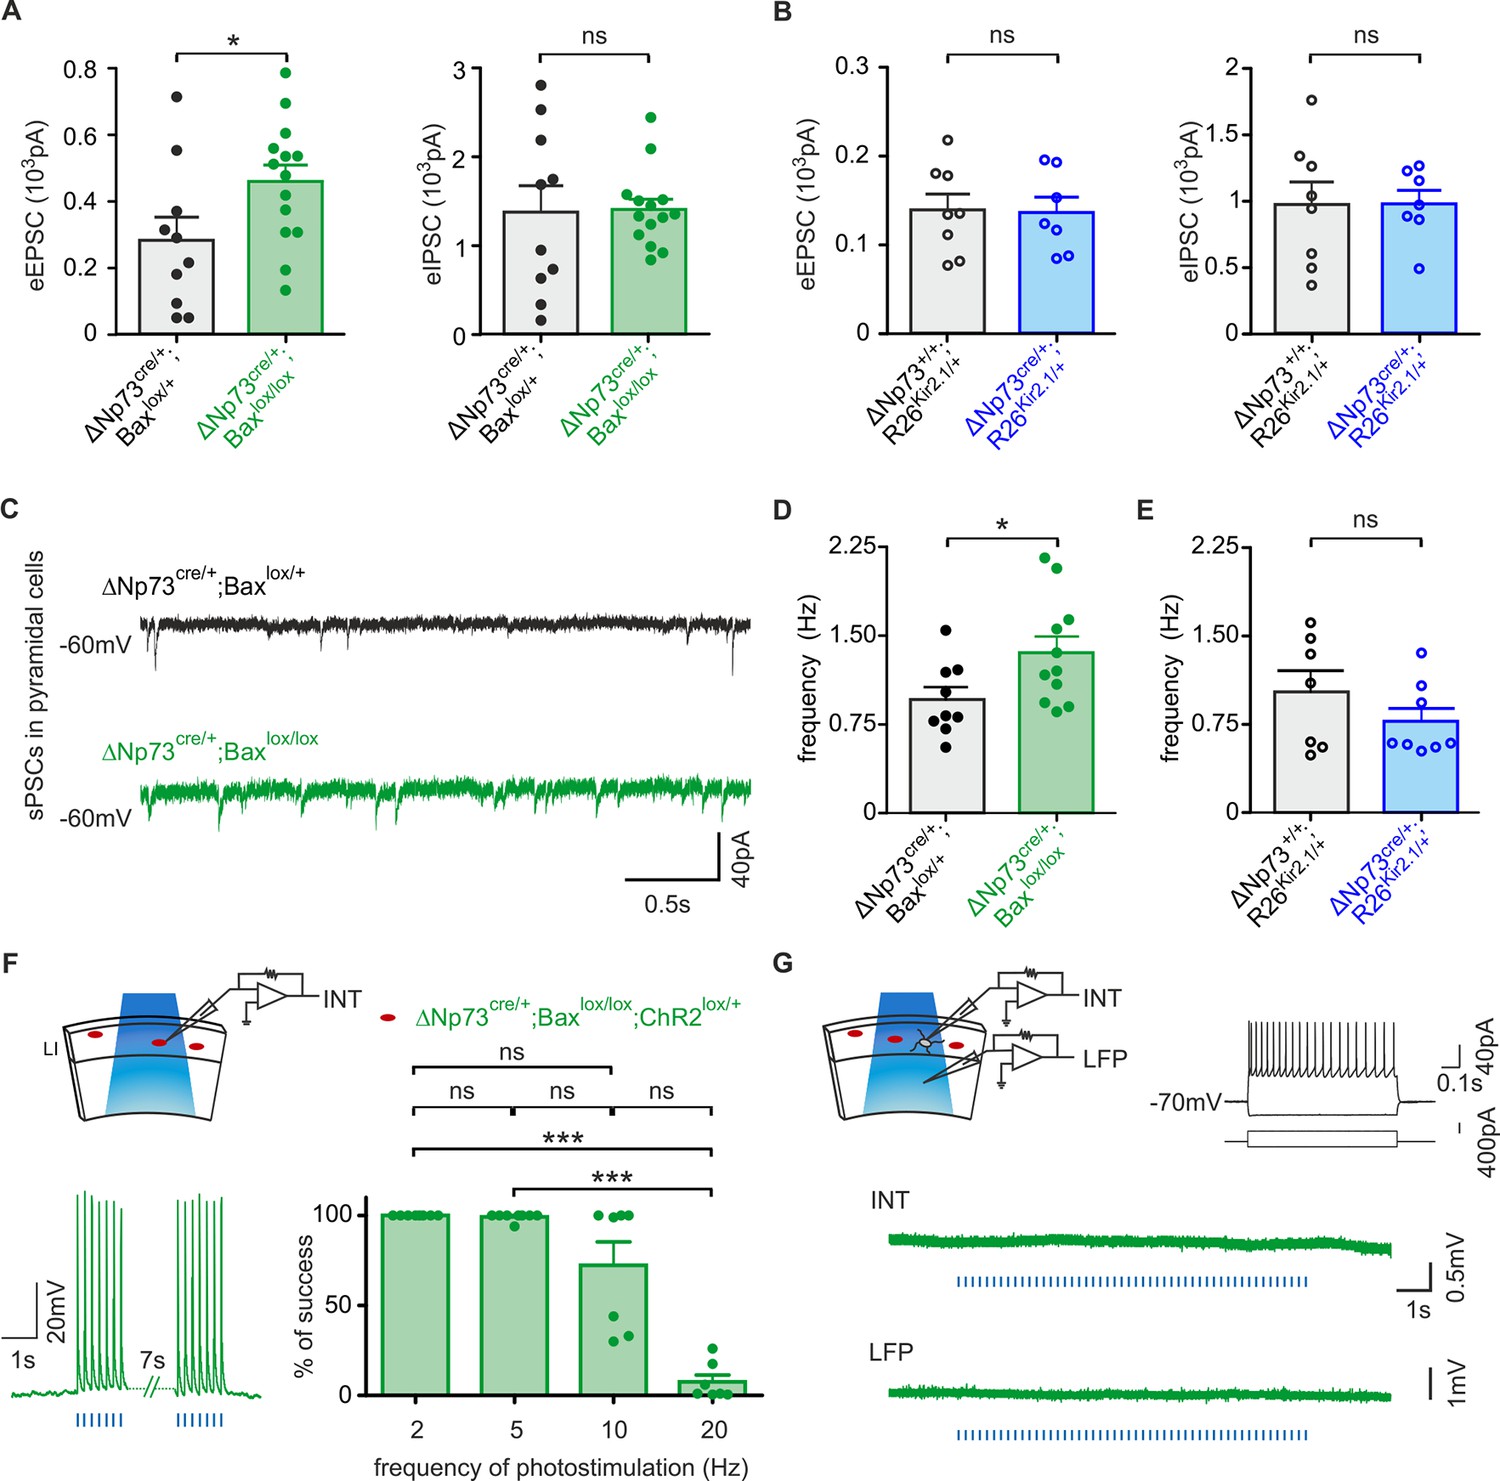
Evoked and spontaneous EPSCs and IPSCs of LII/LIII pyramidal neurons in ΔNp73cre/+;Baxlox/lox and ΔNp73cre/+;R26Kir2.1/+ mutants.
(A, B) Plots of the mean amplitude of eEPSCs (left) and eIPSCs (right) evoked by extracellular stimulation for the same pyramidal neurons of Figure 4 held at −70 mV and 0 mV, respectively, in controls and ΔNp73cre/+;Baxlox/lox (A) and ΔNp73cre/+;R26Kir2.1/+ (B) mutants. Note the significant increase in the mean amplitude of eEPSCs for ΔNp73cre/+;Baxlox/lox (p=0.042) but not for ΔNp73cre/+;R26Kir2.1/+ mutants (p=0.902). eIPSCs remained unchanged. (C) sEPSCs recorded in pyramidal neurons held at −70 mV in a control at P26 (black) and a ΔNp73cre/+;Baxlox/lox mutant at P23 (green). (D, E) Plots of the mean frequencies of sEPSCs in ΔNp73cre/+;Baxlox/lox (D) and ΔNp73cre/+;R26Kir2.1/+ (E) mutants at P23-26 and P23-28, respectively. Note the significant increase in the mean frequency of sEPSCs for ΔNp73cre/+;Baxlox/lox but not for ΔNp73cre/+;R26Kir2.1/+ mutants (n = 9 for controls and n = 11 for ΔNp73cre/+;Baxlox/loxp=0.038, Student T test; n = 7 for controls and n = 8 for ΔNp73cre/+;R26Kir2.1/+ mice p=0.942, Mann-Whitney U test). For the same cells, mean sEPSC amplitudes: −17.5 ± 2.2 pA for controls vs −19.2 ± 1.4 pA for ΔNp73cre/+;Baxlox/lox mice (p=0.501; Student T test) and −12.20 ± 0.81 pA for controls vs –14.30 ± 1.95 pA for ΔNp73cre/+;R26Kir2.1/+ mice (p=0.9551; Mann-Whitney U test). (F) Current-clamp recording of a ChR2-expressing rescued CR upon light stimulation in a ΔNp73cre/+;Baxlox/lox;ChR2lox/+ mouse (see diagram). Note that photoactivation (blue pulses, 1 ms) evoked action potentials in response to every light pulse of a 5 Hz-light train of 10 s (bottom left). Similar results were obtained with a 5 Hz-light train of 30 s (n = 7) and in the presence of ionotropic receptor antagonists 10 µM NBQX, 50 µM AP5 and 10 µM SR95351 (n = 2). Average percentage of success to elicit action potentials with light trains of 10 s delivered from 2 to 20 Hz (right). Note the decreased number of action potentials triggered by photoactivation from 10 Hz (n = 7; Kruskal-Wallis test followed by a Bonferroni multiple comparison). (G) Simultaneous Layer II/III extracellular recording and whole-cell recording of a Layer I interneuron localized nearby a ChR2-expressing rescued CR (see diagram, top left). The firing of the interneuron in response to 800 ms depolarizing and hyperpolarizing steps is shown (inset, top right). A 5 Hz-light train of 10 s did not induce Layer II/III LFPs or postsynaptic currents in the recorded interneuron held at −70 mV (bottom left). Similarly, no responses were observed during extracellular recordings of Layer I (n = 3), Layer II/III (n = 5) and Layer V (n = 3) or during whole-cell recordings of Layer I interneuron (n = 3) in normal conditions or in the presence of 0 mM Mg2+, 3 mM Ca2+ and 4AP (n = 3). Data used for quantitative analyses as well as the numerical data that are represented in graphs are available in Figure 4—figure supplement 1—source data 1.
-
Figure 4—figure supplement 1—source data 1
Spine densities, evoked and spontaneous PSCs in LII/III pyramidal neurons in both Bax and Kir2.1 models.
- https://cdn.elifesciences.org/articles/50503/elife-50503-fig4-figsupp1-data1-v1.xlsx
Tables
Key resources table
| Reagent type (species) or resource | Designation | Source or reference | Identifiers | Additional information |
|---|---|---|---|---|
| Strain Mus musculus (males and female) | C57BL6J | Janvier | ||
| Mus musculus (males and female) | ΔNp73CreIRESGFP | Tissir et al., 2009 | ΔNp73Cre | |
| Mus musculus (males and female) | Wnt3aCre | Yoshida et al., 2006 | Wnt3aCre | |
| Mus musculus (males and female) | TauloxP-stop-loxP-MARCKSeGFP-IRES-nlslacZ | Hippenmeyer et al., 2005 | TauGFP | |
| Mus musculus (males and female) | Baxtm2Sjk;Bak1tm1Thsn/J | Takeuchi et al., 2005 | Baxlox/lox | |
| Mus musculus (males and female) | ROSA26loxP-stop-loxP-Tomato | Madisen et al., 2010 | R26mT | |
| Mus musculus (males and female) | ROSA26 loxP-stop-loxP- Kcnj2-cherry/+ | Moreno-Juan et al., 2017 | R26Kir2.1/+ | |
| Mus musculus (males and female) | Ai32(RCL-ChR2(H134R)/EYFP | https://www.jax.org/strain/012569 | ChR2lox | |
| Antibody | rabbit polyclonal anti-DsRed | Takara | RRID:AB_10013483 | IF(1:500) |
| Antibody | mouse monoclonal anti-Reelin | Merck Millipore | RRID:AB_565117 | IF(1:300) |
| Antibody | mouse monoclonal anti-Gephyrin | Synaptic systems | RRID:AB_2619837 | IF(1:250) |
| Antibody | rabbit polyclonal anti-GAD65/67 | Merck | RRID: AB_22 78725 | IF(1:250) |
| Antibody | guinea-pig anti-KCC2 | D Ng and S Morton TM Jessell’s lab | IF(1:4000) | |
| Antibody | donkey anti-mouse Alexa-488 | Jackson ImmunoResearch Laboratories | RRID:AB_2340846 | IF(1:800) |
| Antibody | donkey anti-rabbit Cy3 | Jackson ImmunoResearch Laboratories | RRID:AB_2307443 | IF(1:800) |
| Antibody | donkey anti-rabbit Alexa-647 | Molecular Probes | RRID:AB_2536183 | IF(1:500) |
| Antibody | donkey anti-chick Alexa-488 | Jackson ImmunoResearch Laboratories | RRID:AB_2340375 | IF(1:1000) |
| Antibody | donkey anti-mouse Alexa-555 | Molecular Probes | RRID:AB_2536180 | IF(1:1000) |
| Antibody | goat anti-guinea pig Alexa-555 | Molecular Probes | RRID:AB_2535856 | IF(1:1000) |
| Antibody | DAPI (4', 6-diamidino-2-phenylindole) | Invitrogen Molecular Probes | RRID:AB_2629482 | IF(1:2000) |
| Antibody | DyLight 488 streptavidin | Vector Labs | SP-4488 | |
| Sequence-based reagent | CRE genotyping 188 f 167 r | This paper | PCR primers | 188 f: TGA TGG ACA TGT TCA GGG ATC 167 r: GAA ATC AGT GCG TTC GAA CGC TAG A |
| Sequence-based reagent | R26Kir2.1/+genotyping AAY101 AAY103 SD297 | PCR primers | AAY101: AAAGTCGCTCTGAGTTGTTAT (Rosa26 forward WT) AAY103: GGGAGCGGGAGAAATGGATATG (Rosa26 reverse WT) SD297: GGCCATTTACCGTAAGTTATG (CAG promoter reverse) | |
| Chemical compound, drug | Paraformaldehyde | Sigma-Aldrich | CAT:P6148 | |
| Chemical compound, drug | Triton 100X | Eurobio | CAT:GAUTTR00-07 | |
| Chemical compound, drug | SR95531 | Abcam | Ab120042 | |
| Chemical compound, drug | 4-AP | Sigma Aldrich | A-0152 | |
| Software, algorithm | IMARIS software 8.4. | IMARIS | RRID:SCR_007370 | |
| Software, algorithm | GraphPad Prism 7.0 | GraphPad Software | RRID:SCR_000306 | |
| Software, algorithm | ImageJ/FIJI | NIH | RRID:SCR_002285 | |
| Software, algorithm | Adobe Photoshop CS6 | Adobe Systems | RRID:SCR_014199 | |
| Software, algorithm | pClamp10.1 | Molecular Devices | RRID:SCR_011323 | |
| Software, algorithm | IGOR Pro 6.0 | Wavemetrics | RRID:SCR_000325 | |
| Software, algorithm | NeuroMatic | Wavemetrics | RRID:SCR_004186 |
Additional files
Download links
A two-part list of links to download the article, or parts of the article, in various formats.
Downloads (link to download the article as PDF)
Open citations (links to open the citations from this article in various online reference manager services)
Cite this article (links to download the citations from this article in formats compatible with various reference manager tools)
Activity-dependent death of transient Cajal-Retzius neurons is required for functional cortical wiring
eLife 8:e50503.
https://doi.org/10.7554/eLife.50503


