Epistasis and entrenchment of drug resistance in HIV-1 subtype B
- Temple University, United States
- Rutgers University, United States
Figures
Figure 1 with 1 supplement
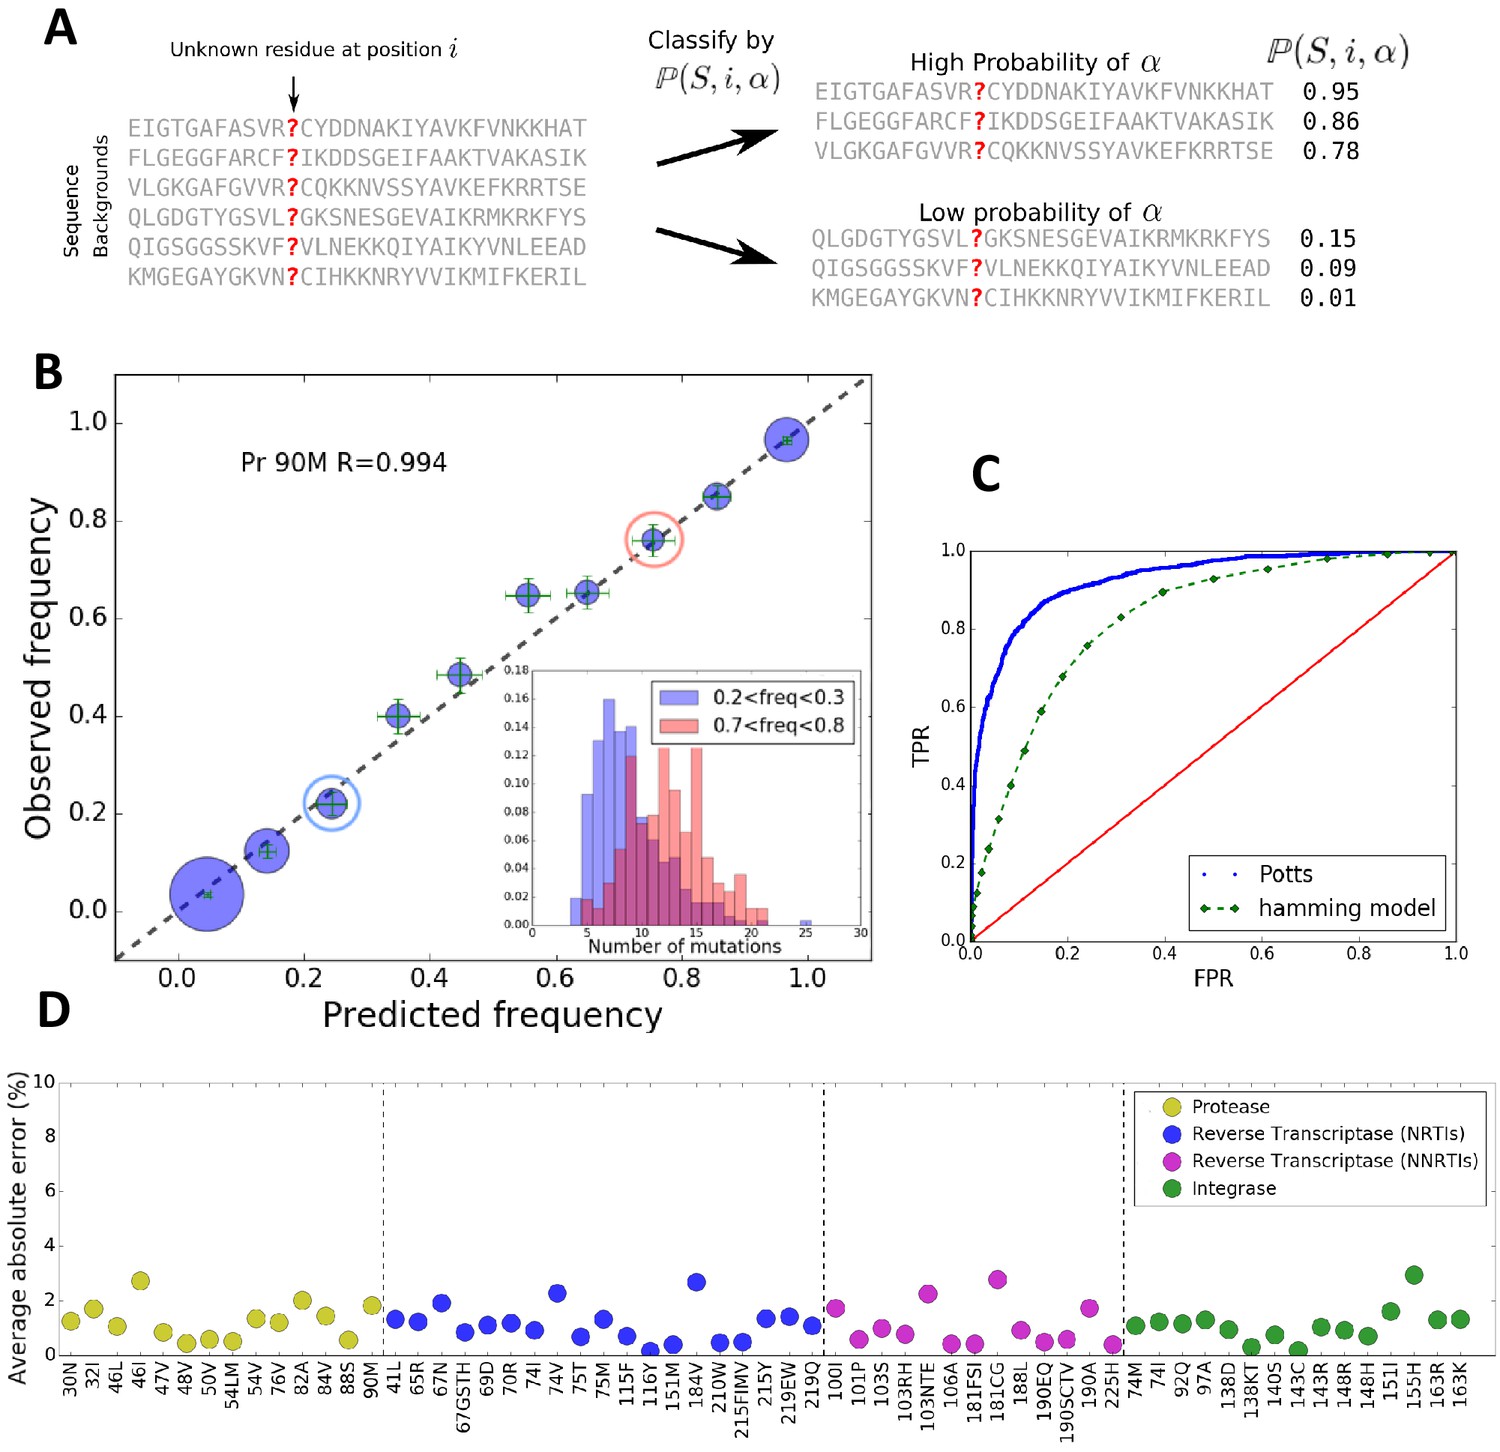
The Potts model predicts residue frequencies.
(A) Schematic showing that the Potts model can be used to classify sequences by how likely a residue is to appear at a position in a sequence using the background-dependent probability, . (B) The observed frequency of the resistance mutation L90M in HIV-1 drug-experienced proteases matches the Potts model predicted frequencies in sequence clusters binned according to the Potts-predicted frequencies in steps of 0.1 (blue circles) with statistical error (green). Diameters of the circles represent the number of sequences. Inset shows the significant overlap in Hamming distance for sequences with low predicted mutant frequencies between 0.2 and 0.3 (blue) and high, 0.7 and 0.8 (pink) depicting the difficulty of such a classification based on Hamming distance. (C) The receiver operator characteristic (ROC) curve comparing the Potts model and Hamming distances as classifiers of mutational probabilities for L90M in HIV protease. (D) The average absolute error between the observed mutational frequencies and the Potts-predicted frequencies for the major drug-resistance mutations in HIV-1 in three drug targets. The average absolute error is calculated by binning the sequences in ascending order of their predicted frequencies such that there are roughly equal number of sequences in each bin as shown in Figure 1—figure supplement 1, and averaging over the absolute error in each bin.
Figure 1—figure supplement 1

Observed vs predicted frequencies for calculating the average absolute error in Figure 1D.
The average absolute error in Figure 1D is calculated by binning the sequences in ascending order of their predicted frequencies such that there are roughly equal number of sequences in each bin, and averaging the absolute error of the bins. This binning procedure avoids finite sampling errors encountered when following a more restrictive method of binning by Potts frequencies from 0 to 1 in steps of 0.1 as shown in Figure 1B especially when the mutation frequency is small. The observed vs predicted frequencies are shown for primary drug-resistance mutations V82A occurring in response to PIs in HIV-1 protease (A); N155H occurring in response to INSTIs in HIV-1 IN (B); M184V occurring in response to NRTIs in HIV-1 reverse transcriptase (C); and Y181C/G occurring in response to NNRTIs in HIV-1 reverse transcriptase (D). Diameters of the blue circles represent data sizes in each bin, and error bars are shown as green cross-hairs.
Figure 2
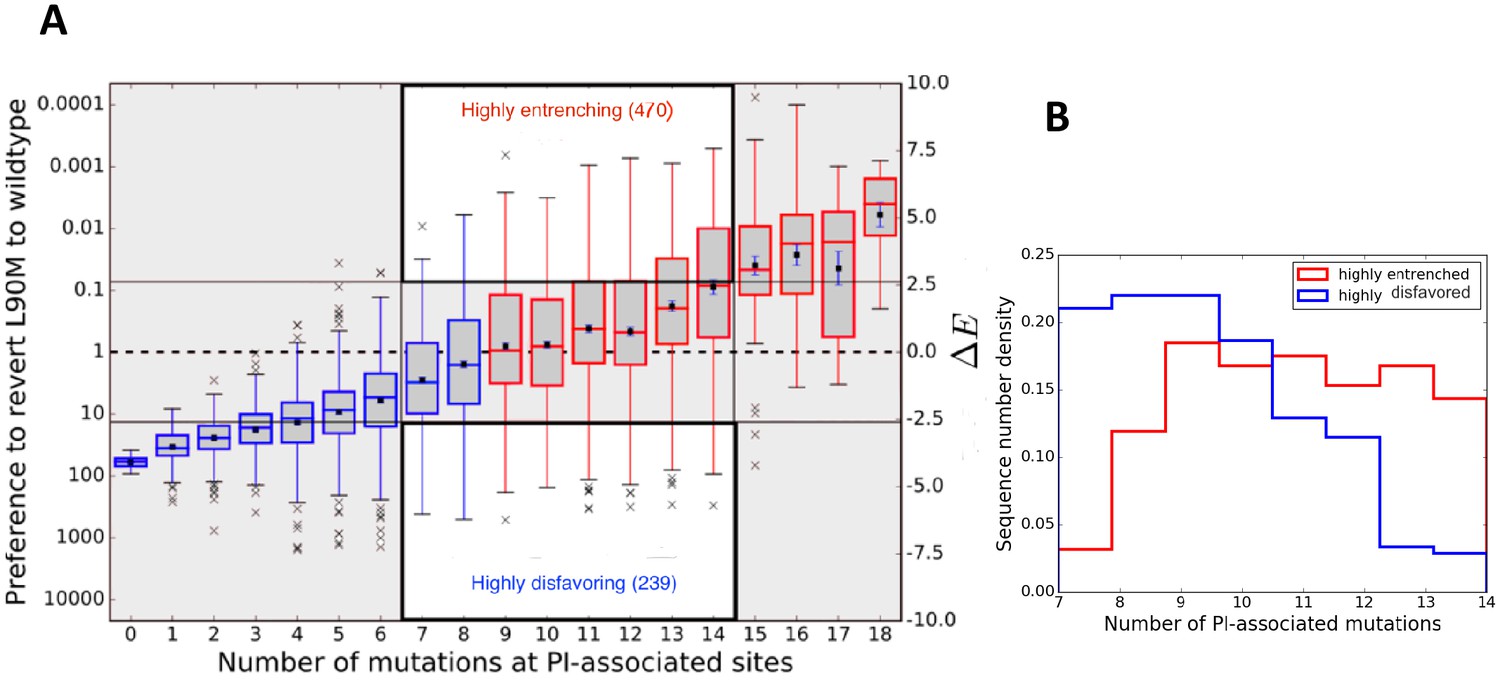
Entrenchment and the effect of epistasis on the favorability of a primary resistance mutation.
(A) change for sequences, conditional on the number of PI-associated mutations is shown as boxplots annotating the first, second and third interquartile range. Whiskers extend to 1.5 times the interquartile range with outliers marked as ’x’s and the mean values are marked as squares. The left ordinate scale shows the relative probability of reversion , and the right shows . Sequences whose energy difference fall above (dashed line) are entrenching backgrounds favoring the mutation. Sequence backgrounds where the mutation is favored on average are shown in red, the others in blue. The mutation L90M becomes favorable on average when there are about 9 PI-associated mutations, but there is a wide range of favorability and ‘which’ PI-associated mutations are present play an important role in determining if the primary mutation is favored/disfavored. The highlighted regions (white with dark border) show there are many sequence backgrounds with between 7 and 14 mutations in which L90M is either ‘highly entrenched or favored’ (top) or ‘highly disfavored’ (bottom). (B) Distributions of number of PI-associated mutations in sequences in the ‘highly entrenching’ and ‘highly disfavoring’ regions from panel A have a large overlap, again showing that entrenchment is not primarily determined by number of associated mutations. Prediction of the likelihood of M based on the number of PI-associated mutations alone for these sequence backgrounds where M is highly entrenched (red) or highly disfavored (blue) would be especially difficult due to the large overlap between them.
Figure 3
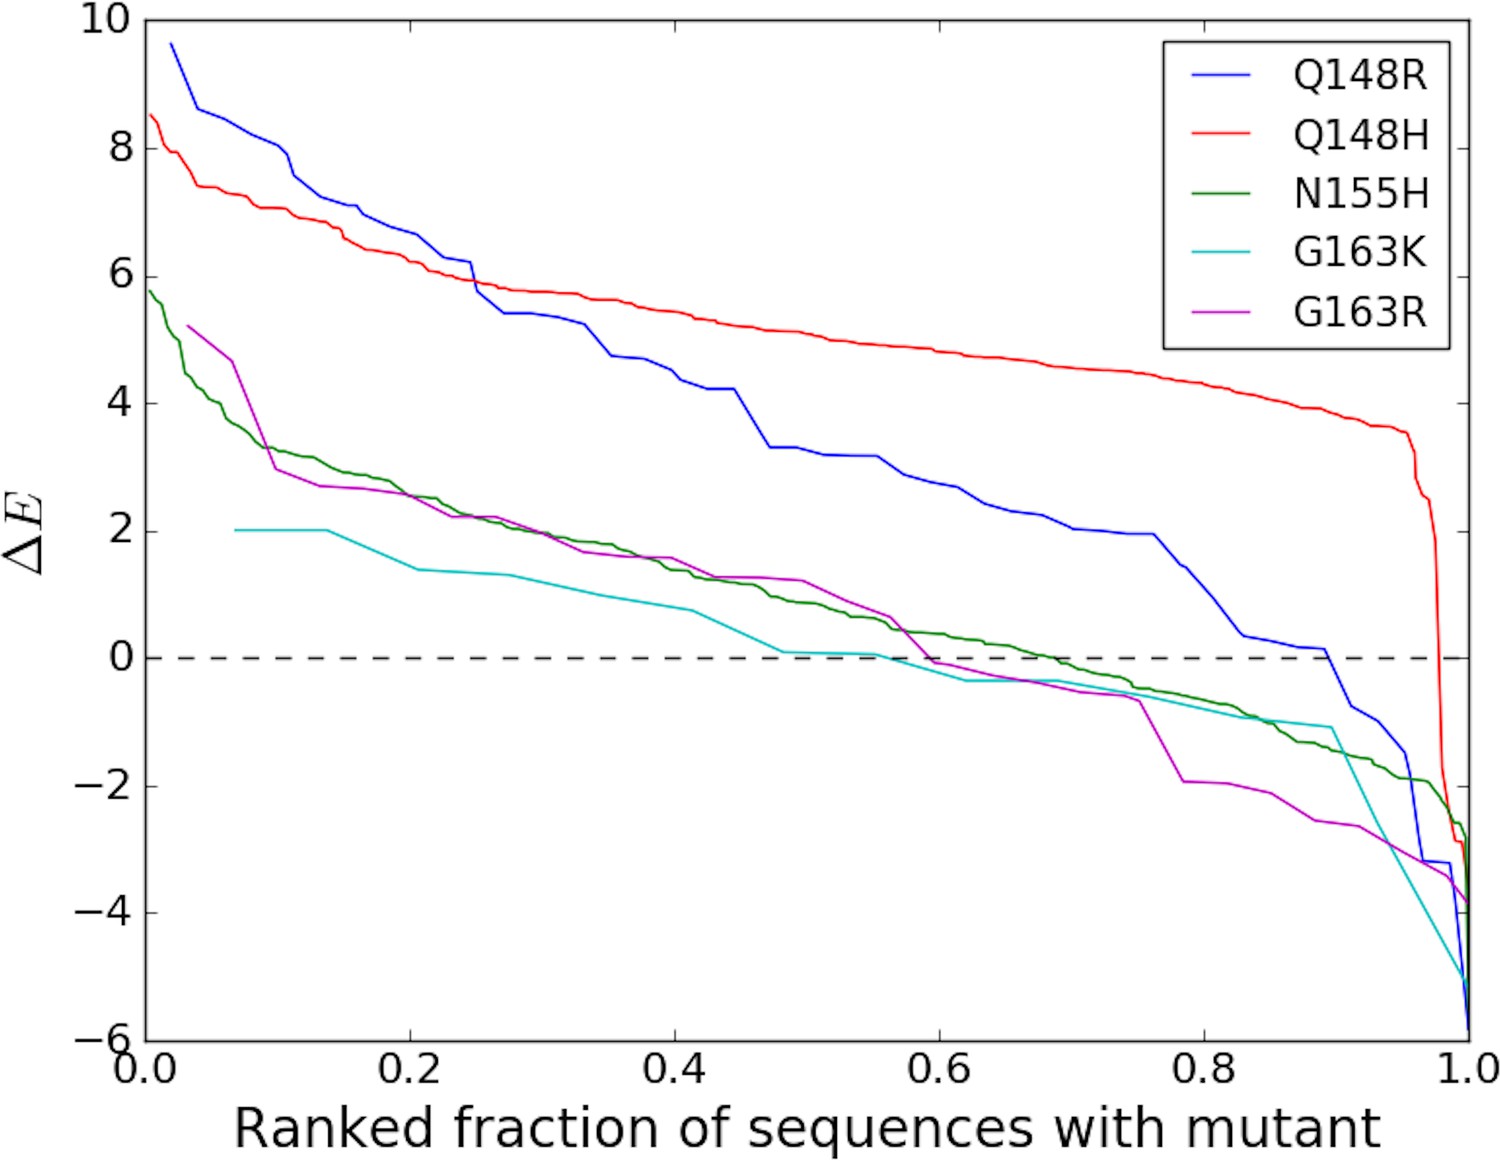
Degree of entrenchment of key resistance mutations occurring in the catalytic core domain (CCD) of HIV-1 IN.
The change in Potts statistical energy for some of the key resistance mutations occurring in the catalytic core domain (CCD) of IN, is plotted as a function of the rank of mutation-carrying sequences, ranked in descending order of their favorability towards the mutant. Plot shows the degree of entrenchment for these mutations. For example, Q148R is highly entrenched in almost all sequences carrying it, whereas, G163K is entrenched () in only about half of the sequences carrying G163K.
Figure 4

Distribution of Potts scores for key residues associated with drug resistance in HIV-1 IN.
The distribution of the Potts scores for sequences carrying the particular resistance mutation are shown in ’green’ for the most frequently observed INSTI selected resistance mutations in HIV IN, and in ’blue’ for all other possible mutations at the same sites. Other possible mutations include rarely observed or unobserved mutations. The histograms show the differential distribution of scores for observed vs. unobserved/rare mutations at 15 primary mutation sites associated with evolving drug resistance in HIV-1 IN. The green (observed) and blue (unobserved/rare) distributions are normalized to the total number of primary DRMs in IN in the Stanford HIVDB and the total number of other possible mutations at the same sites, respectively. The mean scores for observed vs. unobserved mutations are +2.11 and −5.58, respectively (). The wide distribution of scores also illustrates the role of the background in which the resistance mutation occurs.
Figure 5
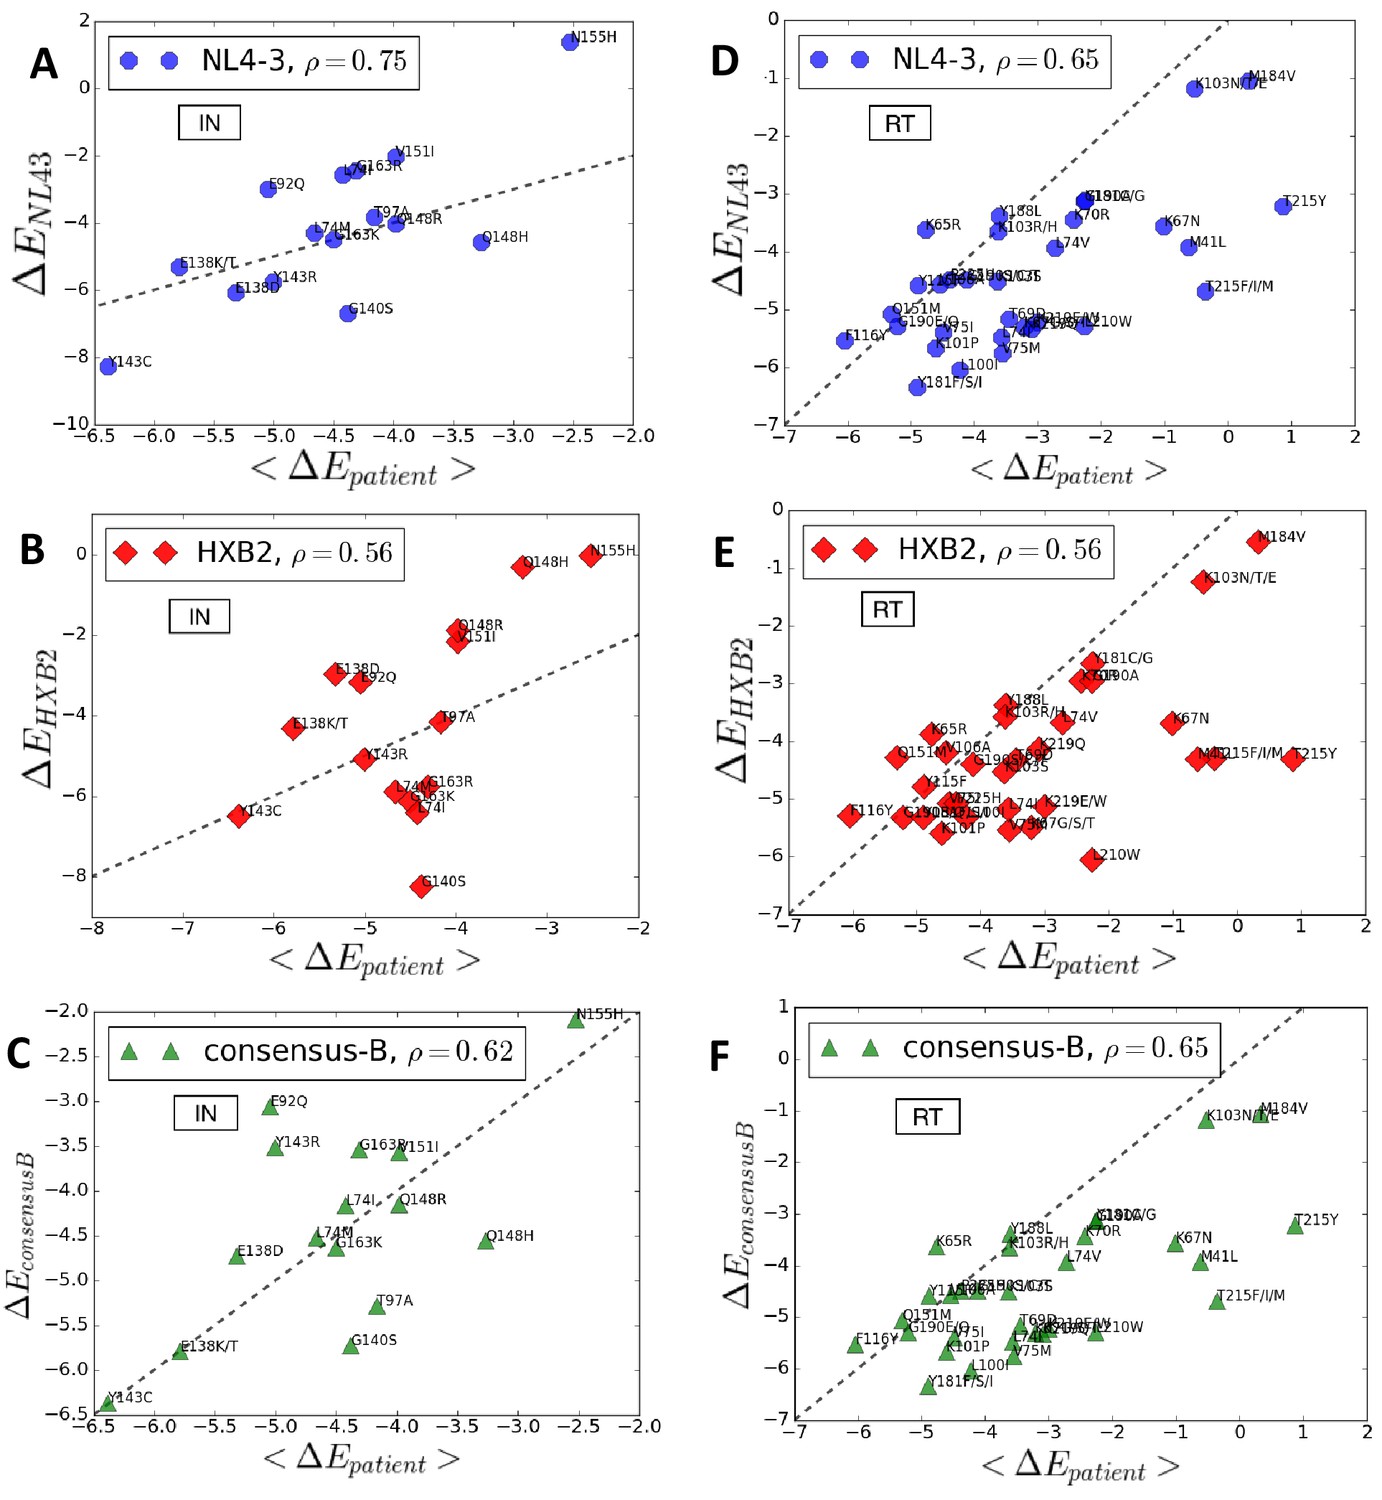
Entrenchment and favorability of key resistance mutations in specific backgrounds.
The change in Potts energy of a sequence is used as the measure of ‘entrenchment’ and favorability of key resistance mutations in HIV-1 NL4-3, HXB2, and the subtype-B consensus sequences, respectively, shown as a function of the average in drug-experienced HIV-1 subtype B patient populations () in the Stanford HIVDB for viral integrase (A,B,C) and reverse transcriptase (D,E,F). In each case, the Pearson correlation coefficients are indicated. The protein sequences for the molecular clones NL4-3 and HXB2 are obtained from GenBank with accession number AF324493.2 and K03455.1, respectively with protein ids for the pol polyprotein as AAK08484.2 and AAB50259.1, respectively. The subtype B consensus sequence is obtained from the Stanford HIVDB. The degree of ‘entrenchment’ in these subtype B strains is often not representative of the average entrenchment effects in a patient population or even the most representative background from a patient population.
Figure 6

The particular sequence background in which a resistance mutation occurs affects the degree of entrenchment, with often a clear distinction between sequences where the mutation is present (green) versus absent (blue) shown here for the mutations N155H (A) and G140S (B) in integrase.
The degree of entrenchment for subtype B consensus, NL4-3 and HXB2 are shown as ’black dashed’, ’red’ and ’magenta’ lines, respectively. The Potts entrenchment score manifests as a clear distinction between backgrounds where a particular mutation is observed from ones where the mutation is absent, with the former more likely to present a distinct fitness advantage towards the mutation.
Figure 7
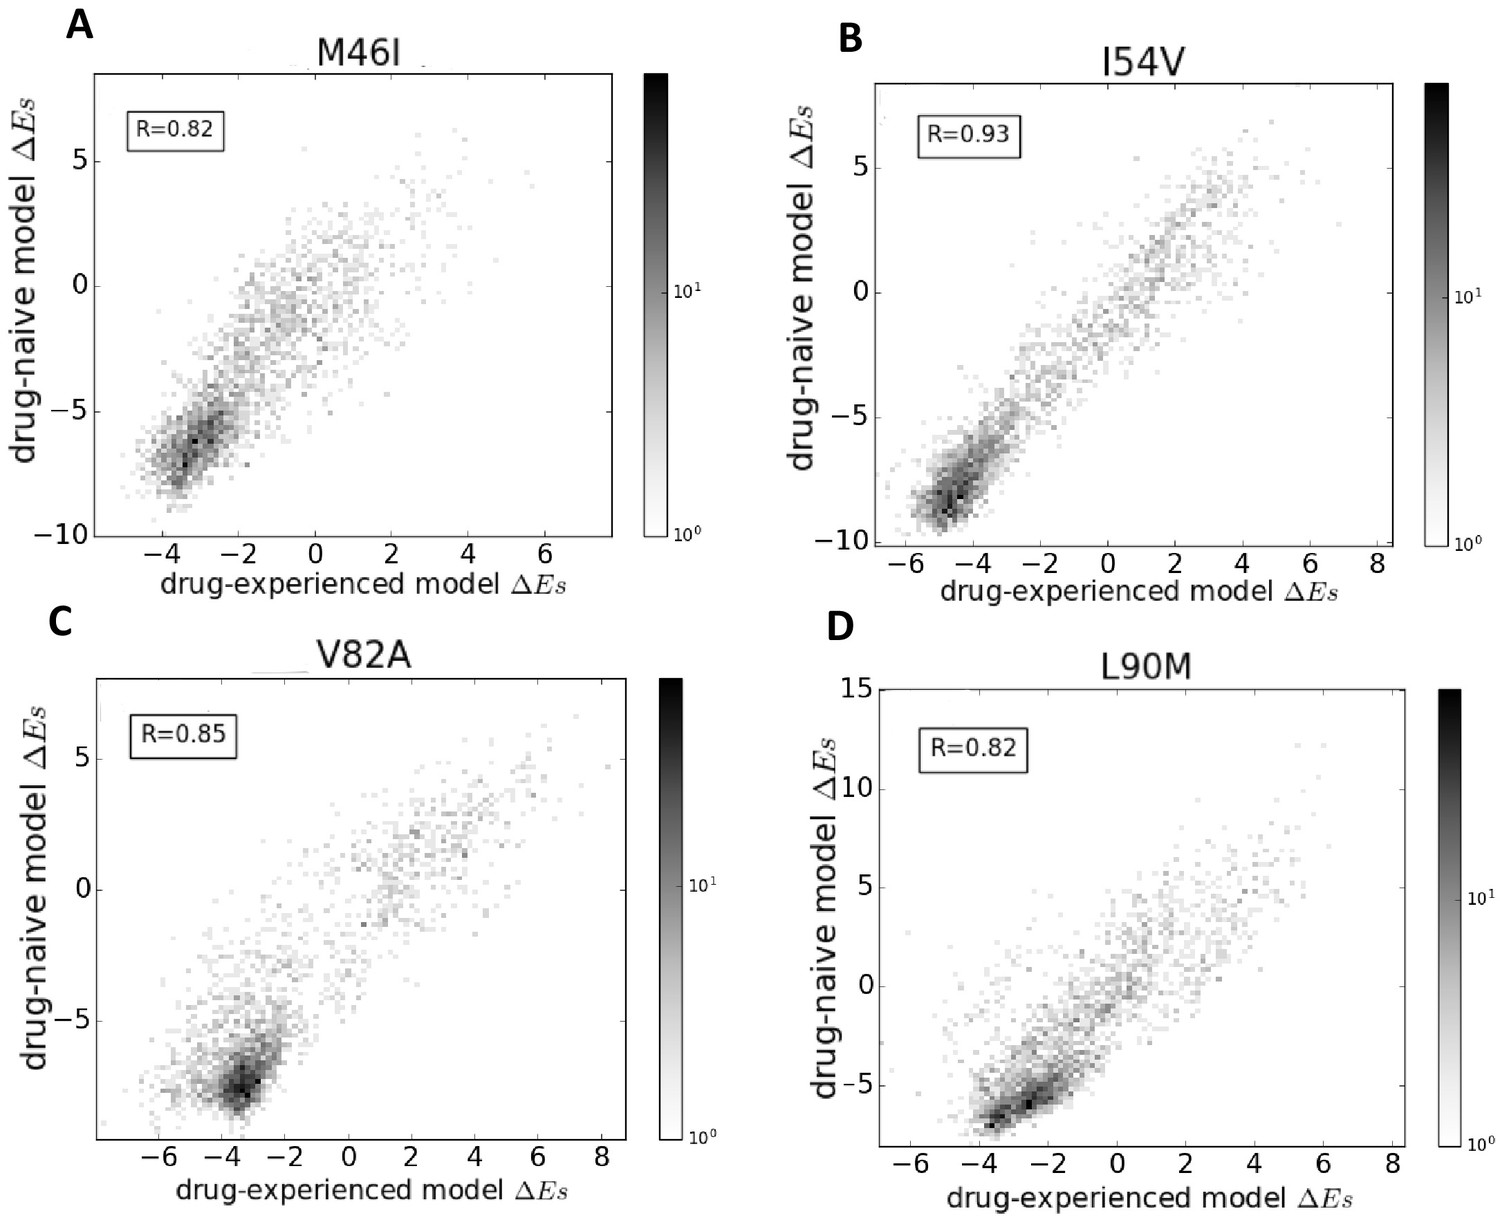
Comparison of Potts models parameterized on drug-naive and drug-experienced HIV protein sequences.
The comparison of the effects of point mutations is shown in terms of Potts scores (which forms the basis of our study) using two different Potts models, parameterized on drug-naive vs drug-experienced sequences for PR drug-resistance mutations M46I (A), I54V (B), V82A (C), and L90M (D), all of which appear with at least a frequency of 0.25% in both datasets. Bin shading for the 2D histogram scatter plots shown here scales logarithmically with the number of sequences whose scores fall into each bin. To obtain scores, the sequences are scored using a drug-naive model vs. a drug-experienced model. The scores are highly correlated with a Pearson correlation coefficient of 0.82 (), 0.93 (), 0.85 (), and 0.82 (), respectively.
Figure 8
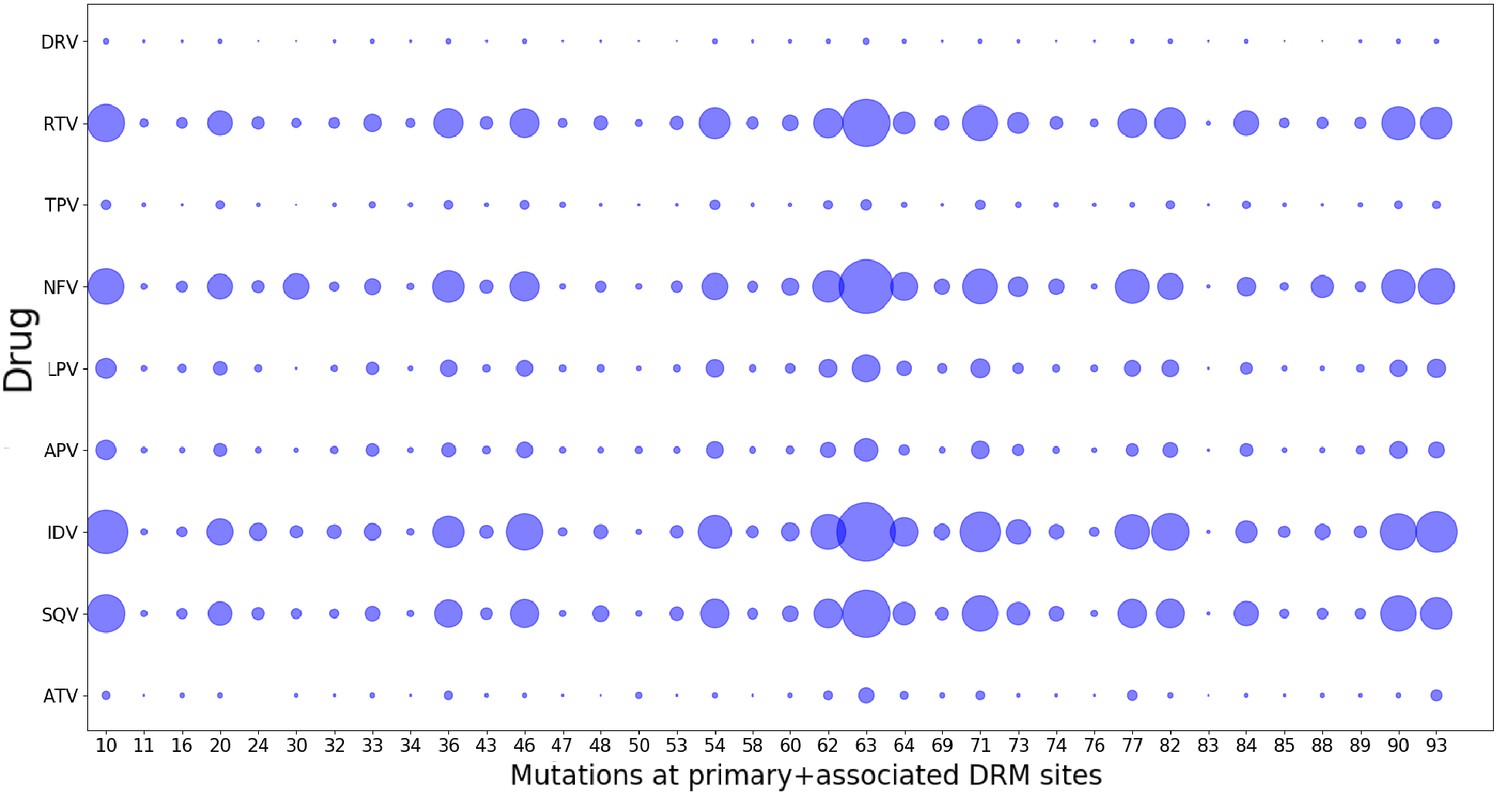
Drug-pressure associated mutations are largely common between drugs of the same class.
The mutations (both primary and associated) arising in drug-treated HIV proteases in response to inhibitor treatment are shown corresponding to each protease drug. The diameters of the circles represent the number of mutations at that site that occurred in sequences treated with the particular drug. Most mutations that occur in response to one drug are seen to have occurred when treated with another drug of the same class, showing that the ‘spurious correlations’ (that could be picked up by a Potts model built on a mixture of patient sequences treated with different drugs of the same class, if the mutations occurring in response to one drug are not at all observed in response to another), are minimal.
Appendix 1—figure 1
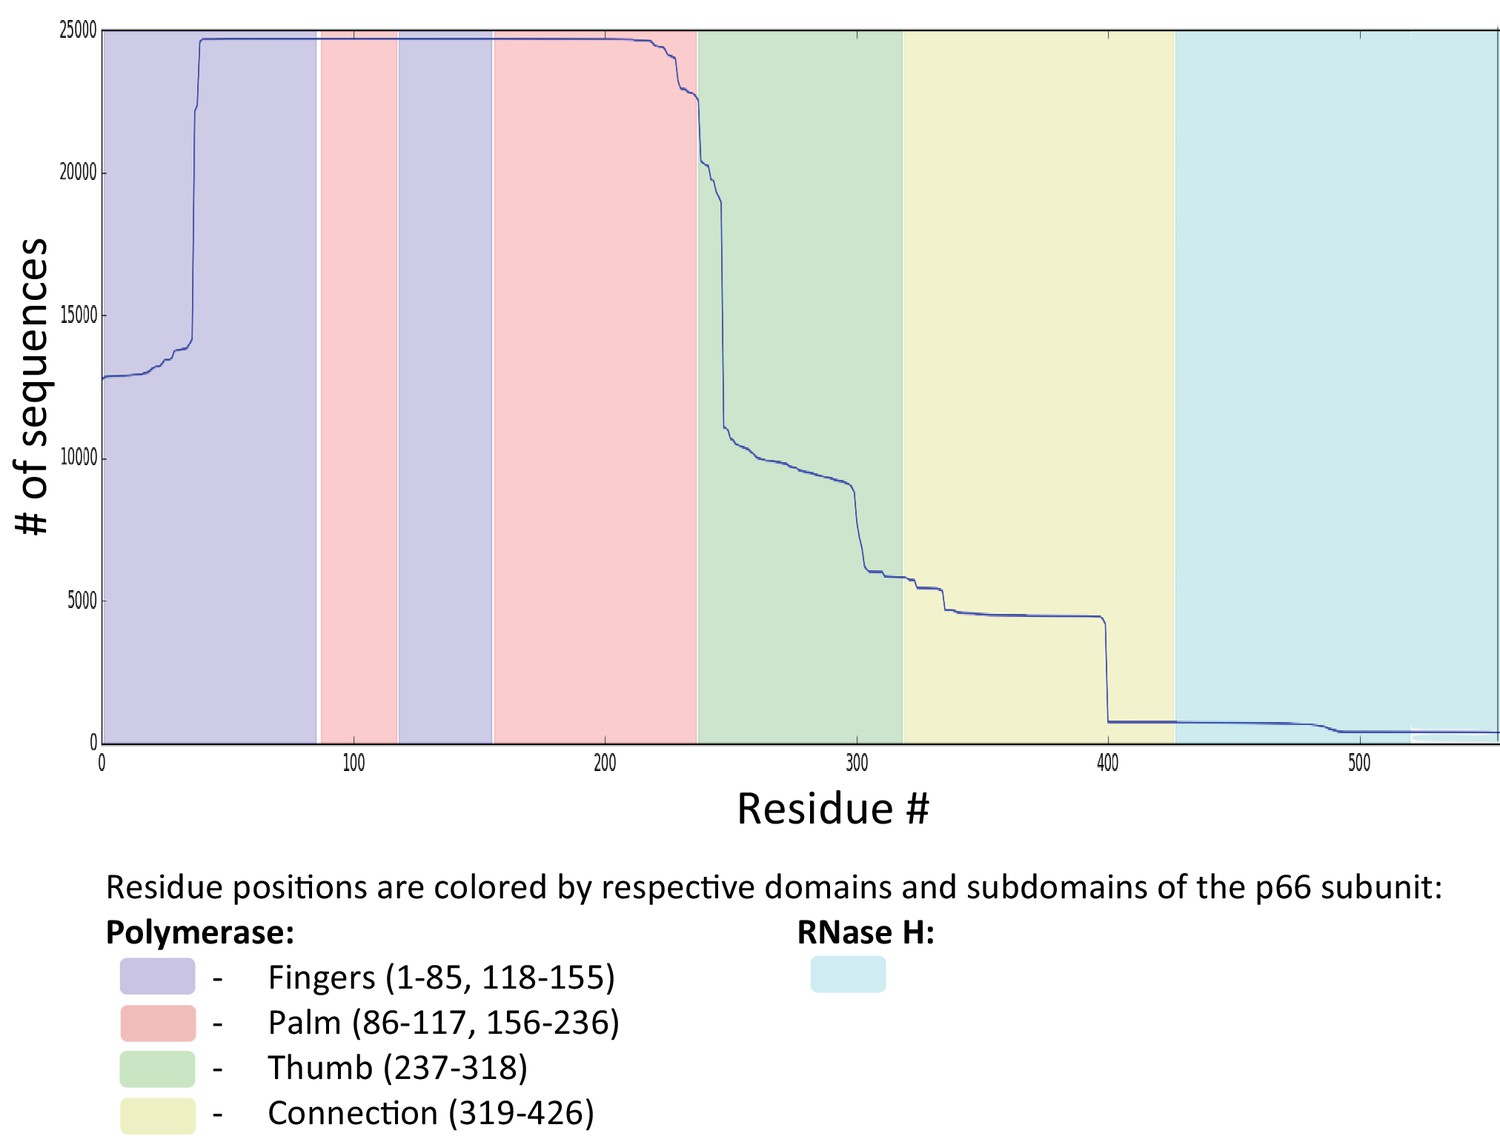
Sequence coverage for RT.
Figure shows the sequence coverage (# of sequences vs the # of residues) for RT drug-experienced (both NRTI and NNRTI) sequences derived from the Stanford HIVDB (22,444 isolates from 20422 patients). For RT, sequences with exposure to both NRTIs and NNRTIs were selected as an alternate search for RT sequences exposed to only NRTIs or NNRTIs would return a vastly smaller number of isolates (5398 and 80, respectively). Sequences with insertions (‘#‘) and deletions (‘ ~‘) are removed. MSA columns and rows with more than 1% gaps (‘.’) are removed. This resulted in a final MSA size of N = 19194 sequences from 17130 persons each with length L = 188 for RT. To retain enough sequence coverage in the MSA, we removed residues: residues 1–38, and residue 227 onwards for RT. For this reason, some interesting DRMs like F227I/L/V/C, L234I, P236L or N348I (NNRTI affected) for RT are not amenable for our analysis.
Tables
Table 1
Confirmation of the Potts model entrenchment predictions for the mutation L90M in HIV-1 protease.
Analytical predictions of likelihoods of the mutation (using the Potts model) are shown along with the corresponding observed frequencies in different subsets of our dataset classified as entrenching () or disfavoring () for the mutation. The agreement between the predicted and observed frequencies is remarkable and serves as a confirmation for the Potts model entrenchment predictions.
| Sequences | Classification | Number of sequences | Predicted frequency | Observed frequency |
|---|---|---|---|---|
| All | Entrenched | 1475 | 82.7% | 83.9% |
| Disfavored | 3283 | 12.7% | 11.9% | |
| All with of | Entrenched | 560 | 97.6% | 97.3% |
| Disfavored | 1444 | 3.5% | 1.9% | |
| With between 7 and 14 mutations and of | Entrenched | 470 | 97.5% | 97.0% |
| Disfavored | 239 | 2.8% | 2.1% |
Table 2
Entrenchment in the population (of sequences carrying the mutation) for four major classes of resistance mutations in HIV-1 subtype B: A DRM is entrenched in the population if at least ~50% or more of the sequences containing the mutation entrench it (i.e ).
We catalog entrenchment in the population (of sequences carrying the mutation) for all primary DRMs appearing at ~1% frequency or more, and our study reveals mutations in response to NNRTIs are much less entrenched in the population (of sequences carrying the mutation) than others.
| NRTIs | NNRTIs | PIs | INSTIs | |
|---|---|---|---|---|
| Years in therapy | 32 | 23 | 24 | 12 |
| Number of primary DRMs | 18 | 15 | 13 | 15 |
| DRMs entrenched in the population (of sequences carrying the mutation) | 11 (61.1%) | 1 ( 6.7%) | 10 (76.9%) | 13 (86.7 %) |
| Number of DRMs conferring high-level resistance | 7 | 11 | 7 | 6 |
| High-level resistance DRMs entrenched in the population (of sequences carrying the mutation) | 3 (42.8%) | 1 (9.1 %) | 5 (71.4%) | 5 (83.3 %) |
-
Source: Results shown in this table are based on calculations for ‘entrenchment in the population’ (of sequences carrying the mutation) for each primary DRM occurring at ~1% frequency or more in HIV-1 RT, PR, and IN, respectively as shown in Table 2—source data 1, Table 2—source data 2, Table 2—source data 3 and Table 2—source data 4. Resistance levels are determined according to Stanford HIVDB (Rhee et al., 2003; Shafer, 2006) mutation scores for PIs, NRTIs, NNRTIs, and INSTIs.
-
Table 2—source data 1
Table showing entrenchment in the population (of sequences carrying the mutation) for primary resistance mutations against NRTIs.
- https://doi.org/10.7554/eLife.50524.007
-
Table 2—source data 2
Table showing entrenchment in the population (of sequences carrying the mutation) for primary resistance mutations against NNRTIs.
- https://doi.org/10.7554/eLife.50524.008
-
Table 2—source data 3
Table showing entrenchment in the population (of sequences carrying the mutation) for primary resistance mutations against PIs.
- https://doi.org/10.7554/eLife.50524.009
-
Table 2—source data 4
Table showing entrenchment in the population (of sequences carrying the mutation) for primary resistance mutations against INSTIs.
- https://doi.org/10.7554/eLife.50524.010
Table 3
Entrenchment of at least one primary DRM for each of the four drug classes in HIV-1: Table shows the percentage of drug-experienced sequences which contain at least one primary DRM, and the percentage of drug-experienced sequences which contain at least one primary DRM such that the DRM is entrenched by its respective background.
This is shown separately for resistance mutations occurring in response to each of the four HIV drug classes. A significantly lower percentage (~28%) of the patient sequences carry at least one entrenched resistance mutation conferring resistance to the NNRTIs when compared to other drugs (~50%–65%).
| NRTIs | NNRTIs | PI | Insti | |
|---|---|---|---|---|
| Number of sequences in MSA | 19194 | 19194 | 4758 | 1220 |
| % of total sequences containing at least one primary DRM | 78.5% | 62.4% | 64.8% | 61.7% |
| % of total sequences with at least one entrenched primary DRM | 64.7% | 28.1% | 50.8% | 47.2 % |
Appendix 1—table 1
Most entrenched (ME) and least entrenched (LE) or most disfavoring sequence pairs with the same Hamming distances (HD) for primary resistance mutations against the INSTIs
https://doi.org/10.7554/eLife.50524.021| E92Q | L74M | N155H | Q148H | G140S | |||||||
|---|---|---|---|---|---|---|---|---|---|---|---|
| Position | Consensus | ME | LE | ME | LE | ME | LE | ME | LE | ME | LE |
| 6 | D | -- | -- | -- | E | -- | -- | -- | -- | -- | -- |
| 11 | E | -- | -- | -- | -- | -- | -- | -- | D | -- | D |
| 17 | S | -- | -- | N | N | N | N | -- | T | -- | -- |
| 20 | R | -- | -- | -- | -- | -- | -- | -- | -- | K | -- |
| 22 | M | -- | -- | I | -- | -- | -- | -- | -- | -- | -- |
| 23 | A | -- | -- | V | -- | -- | -- | -- | -- | -- | -- |
| 28 | L | -- | -- | I | -- | -- | -- | -- | -- | -- | -- |
| 31 | V | -- | -- | -- | -- | I | -- | I | -- | I | -- |
| 32 | V | -- | -- | -- | -- | -- | -- | -- | -- | -- | I |
| 37 | V | -- | -- | -- | -- | -- | -- | -- | -- | -- | I |
| 39 | S | C | C | -- | -- | -- | -- | -- | -- | -- | -- |
| 45 | L | Q | -- | V | -- | -- | -- | -- | -- | -- | -- |
| 50 | M | -- | -- | M | I | -- | -- | I | -- | L | -- |
| 63 | L | I | -- | -- | -- | -- | -- | -- | -- | -- | -- |
| 72 | I | L | -- | -- | V | -- | V | -- | -- | -- | -- |
| 74 | L | M | -- | M | M | -- | -- | -- | -- | -- | -- |
| 92 | E | Q | Q | -- | -- | -- | -- | -- | -- | -- | -- |
| 97 | T | -- | -- | A | A | -- | -- | -- | -- | -- | -- |
| 101 | L | -- | I | I | -- | I | -- | -- | I | I | I |
| 119 | S | -- | -- | T | R | -- | -- | -- | P | -- | -- |
| 124 | T | -- | N | -- | -- | -- | A | -- | N | -- | -- |
| 135 | I | -- | V | -- | -- | -- | -- | -- | V | -- | -- |
| 136 | K | -- | -- | -- | -- | -- | -- | -- | -- | Q | -- |
| 138 | E | -- | -- | D | -- | -- | -- | K | -- | -- | -- |
| 140 | G | -- | -- | -- | -- | -- | S | S | -- | S | S |
| 143 | Y | -- | -- | R | -- | -- | -- | -- | -- | -- | -- |
| 148 | Q | -- | -- | -- | -- | -- | H | H | H | H | R |
| 151 | V | -- | -- | -- | I | I | -- | -- | -- | -- | -- |
| 154 | M | -- | -- | -- | -- | -- | I | -- | -- | -- | -- |
| 155 | N | -- | H | -- | H | H | H | -- | -- | -- | -- |
| 156 | K | -- | -- | -- | N | -- | -- | -- | -- | -- | -- |
| 170 | E | -- | -- | -- | -- | -- | A | -- | -- | -- | -- |
| 181 | F | -- | L | -- | -- | -- | -- | -- | L | -- | -- |
| 188 | K | -- | -- | -- | -- | -- | -- | R | -- | -- | -- |
| 196 | A | -- | -- | -- | -- | P | -- | -- | -- | -- | -- |
| 201 | V | -- | I | -- | -- | I | I | I | I | -- | I |
| 206 | T | -- | -- | -- | -- | -- | -- | S | -- | -- | -- |
| 208 | I | -- | -- | -- | M | -- | -- | -- | -- | L | -- |
| 212 | E | -- | -- | A | -- | -- | -- | -- | -- | -- | |
| 215 | K | -- | -- | -- | -- | -- | -- | S | -- | -- | -- |
| 216 | Q | N | -- | -- | -- | -- | -- | -- | -- | -- | -- |
| 220 | I | -- | -- | -- | -- | -- | -- | -- | L | -- | -- |
| 230 | S | -- | -- | -- | -- | -- | -- | G | -- | -- | -- |
| 232 | D | -- | -- | -- | -- | N | -- | -- | -- | -- | E |
| 234 | L | I | -- | -- | -- | -- | -- | -- | -- | -- | -- |
| 256 | D | -- | -- | E | -- | E | -- | -- | -- | E | E |
| HD | 8 | 8 | 12 | 12 | 9 | 9 | 10 | 10 | 9 | 9 | |
-
Residues same as consensus are shown as ‘--', mutations are shown as the one letter abbreviated alphabet encoding the mutant residue (in bold are primary drug-resistance mutations appearing at more than 1% frequency).
Appendix 1—table 2
Most entrenched (ME) and least entrenched (LE) or most disfavoring sequence pairs with the same Hamming distances (HD) for primary resistance mutations against NNRTIs
https://doi.org/10.7554/eLife.50524.022| P225H | Y188L | L100I | K103N/E | Y181C/G | ■ | E138K/R | ||||||||
|---|---|---|---|---|---|---|---|---|---|---|---|---|---|---|
| Consensus | ME | LE | ME | LE | ME | LE | ME | LE | ME | LE | ME | LE | ||
| 39 | T | -- | -- | --- | -- | -- | S | -- | -- | -- | -- | -- | -- | |
| 41 | M | -- | -- | L | L | L | L | -- | -- | -- | -- | -- | L | |
| 43 | K | -- | -- | -- | -- | -- | R | -- | -- | -- | -- | -- | -- | |
| 44 | E | -- | -- | -- | D | -- | -- | -- | -- | -- | -- | -- | -- | |
| 48 | S | -- | -- | -- | -- | -- | -- | T | -- | -- | -- | -- | -- | |
| 49 | K | -- | -- | -- | -- | -- | -- | -- | R | -- | -- | -- | -- | |
| 50 | I | -- | -- | -- | -- | -- | -- | -- | -- | -- | -- | -- | -- | |
| 58 | T | -- | -- | N | -- | -- | -- | -- | -- | -- | -- | -- | -- | |
| 60 | V | -- | -- | -- | -- | -- | -- | -- | -- | -- | I | -- | -- | |
| 62 | A | -- | -- | V | -- | -- | -- | -- | -- | V | -- | -- | -- | |
| 65 | K | -- | -- | -- | -- | -- | -- | -- | -- | R | -- | -- | -- | |
| 67 | D | -- | -- | -- | G | N | -- | -- | -- | -- | -- | -- | -- | |
| 68 | S | -- | -- | -- | G | -- | -- | -- | -- | G | -- | -- | -- | |
| 69 | T | -- | -- | N | -- | N | -- | -- | -- | I | N | -- | -- | |
| 70 | K | -- | -- | -- | T | -- | -- | -- | -- | -- | R | -- | -- | |
| 74 | L | -- | V | -- | V | V | -- | V | -- | -- | -- | -- | V | |
| 75 | V | -- | -- | I | -- | T | -- | -- | -- | A | -- | -- | -- | |
| 77 | F | -- | -- | L | -- | -- | -- | -- | -- | -- | -- | -- | -- | |
| 82 | K | -- | -- | -- | -- | -- | -- | -- | -- | -- | -- | R | -- | |
| 90 | V | -- | -- | -- | -- | -- | -- | I | -- | I | -- | -- | -- | |
| 98 | A | S | G | -- | -- | -- | S | -- | S | -- | -- | -- | -- | |
| 100 | L | -- | -- | -- | -- | I | I | I | -- | -- | -- | -- | -- | |
| 101 | K | Q | -- | -- | -- | -- | -- | -- | E | E | -- | E | -- | |
| 103 | K | N | -- | -- | N | N | -- | N | N | -- | N | R | -- | |
| 104 | K | -- | -- | -- | -- | -- | -- | -- | -- | N | -- | -- | -- | |
| 106 | V | -- | -- | I | -- | -- | -- | -- | A | -- | -- | -- | -- | |
| 108 | V | -- | -- | -- | -- | -- | -- | -- | -- | I | -- | -- | -- | |
| 116 | F | -- | -- | W | -- | -- | -- | -- | -- | -- | -- | -- | -- | |
| 118 | V | -- | -- | -- | I | -- | -- | -- | -- | -- | -- | -- | -- | |
| 122 | K | -- | -- | -- | E | E | -- | E | -- | -- | -- | E | E | |
| 123 | D | -- | -- | -- | -- | -- | E | -- | -- | -- | -- | -- | -- | |
| 126 | K | -- | -- | -- | -- | -- | -- | -- | -- | -- | -- | R | -- | |
| 135 | I | L | -- | -- | K | M | V | -- | -- | -- | T | -- | -- | |
| 138 | E | -- | -- | -- | -- | -- | -- | -- | K | -- | -- | K | K | |
| 139 | T | -- | -- | -- | -- | -- | -- | -- | -- | -- | -- | E | -- | |
| 142 | I | -- | -- | -- | -- | -- | Q | -- | -- | -- | V | T | -- | |
| 151 | Q | -- | -- | M | -- | -- | -- | -- | -- | -- | -- | -- | -- | |
| 158 | A | -- | S | -- | -- | -- | -- | -- | -- | -- | -- | -- | S | |
| 162 | S | -- | -- | -- | -- | -- | C | -- | -- | -- | -- | -- | A | |
| 165 | T | -- | I | -- | -- | -- | K | -- | -- | -- | -- | -- | -- | |
| 166 | K | -- | -- | -- | -- | -- | -- | -- | Q | -- | -- | -- | -- | |
| 169 | E | -- | -- | -- | A | -- | -- | -- | -- | -- | -- | -- | -- | |
| 172 | R | -- | -- | K | -- | -- | -- | -- | -- | -- | -- | -- | -- | |
| 173 | K | -- | -- | N | -- | -- | -- | -- | -- | -- | -- | -- | -- | |
| 176 | P | Q | -- | -- | -- | -- | -- | -- | -- | -- | -- | -- | -- | |
| 177 | D | -- | -- | -- | -- | -- | -- | N | -- | -- | -- | -- | -- | |
| 178 | I | -- | -- | -- | -- | -- | -- | M | -- | -- | -- | M | -- | |
| 179 | V | -- | D | -- | I | -- | D | -- | -- | -- | -- | -- | -- | |
| 180 | I | -- | -- | -- | -- | -- | -- | -- | -- | -- | M | -- | -- | |
| 181 | Y | -- | C | -- | C | -- | -- | -- | -- | C | C | -- | -- | |
| 184 | M | V | -- | -- | -- | V | I | I | -- | -- | V | -- | -- | |
| 188 | Y | -- | -- | L | L | -- | -- | -- | -- | -- | L | -- | -- | |
| 189 | V | -- | -- | I | -- | -- | -- | -- | -- | -- | -- | -- | -- | |
| 190 | G | -- | A | -- | S | -- | -- | -- | A | A | -- | -- | -- | |
| 196 | G | E | -- | -- | -- | -- | -- | -- | -- | -- | -- | -- | -- | |
| 197 | Q | -- | -- | -- | -- | -- | -- | -- | K | -- | -- | -- | -- | |
| 200 | T | A | V | A | -- | A | A | A | A | -- | A | -- | A | |
| 202 | I | -- | -- | V | -- | V | -- | -- | -- | -- | -- | -- | -- | |
| 203 | E | --- | -- | -- | -- | D | -- | -- | -- | -- | -- | -- | -- | |
| 207 | Q | -- | -- | -- | -- | -- | A | -- | -- | -- | -- | -- | -- | |
| 210 | L | -- | -- | -- | W | W | -- | -- | -- | -- | -- | -- | -- | |
| 211 | R | -- | -- | -- | K | -- | K | -- | -- | K | K | -- | K | |
| 214 | F | -- | -- | L | -- | -- | -- | -- | -- | -- | L | -- | -- | |
| 215 | T | -- | -- | Y | Y | Y | D | -- | -- | -- | -- | -- | Y | |
| 219 | K | -- | -- | -- | -- | E | -- | -- | -- | Q | Q | -- | -- | |
| 221 | H | -- | -- | -- | -- | -- | -- | -- | -- | Y | -- | -- | -- | |
| 223 | K | -- | -- | T | -- | -- | -- | -- | -- | -- | -- | -- | -- | |
| 225 | P | H | H | -- | -- | -- | -- | H | -- | -- | -- | -- | -- | |
| HD | 9 | 9 | 18 | 18 | 16 | 16 | 11 | 11 | 14 | 14 | 9 | 9 | ||
-
Residues same as consensus are shown as ‘--', mutations are shown as the one letter abbreviated alphabet encoding the mutant residue (in bold are primary drug-resistance mutations appearing at more than 1% frequency).
Appendix 1—table 3
Most entrenched (ME) and least entrenched (LE) or most disfavoring sequence pairs with the same Hamming distances (HD) for primary resistance mutations against PIs
https://doi.org/10.7554/eLife.50524.023| I50V | I84V | L90M | V82A | ||||||
|---|---|---|---|---|---|---|---|---|---|
| Position | Consensus | ME | LE | ME | LE | ME | LE | ME | LE |
| 10 | L | I | -- | F | -- | I | -- | I | I |
| 13 | I | -- | V | -- | -- | V | -- | -- | V |
| 15 | I | -- | V | -- | V | -- | V | -- | -- |
| 18 | Q | -- | -- | -- | -- | H | -- | -- | H |
| 19 | L | -- | I | -- | -- | -- | -- | -- | -- |
| 20 | K | -- | -- | -- | -- | I | R | -- | -- |
| 24 | L | -- | -- | -- | -- | -- | -- | I | -- |
| 30 | D | -- | -- | -- | N | -- | -- | -- | -- |
| 32 | V | -- | -- | -- | -- | -- | I | -- | -- |
| 33 | L | -- | F | -- | F | -- | -- | F | -- |
| 34 | E | Q | -- | -- | -- | -- | -- | -- | -- |
| 35 | E | -- | D | -- | D | -- | D | -- | -- |
| 36 | M | -- | -- | -- | L | -- | I | -- | -- |
| 37 | N | -- | S | -- | E | -- | D | -- | -- |
| 41 | R | -- | K | -- | -- | -- | K | -- | -- |
| 43 | K | -- | -- | -- | T | -- | -- | -- | -- |
| 46 | M | I | -- | I | -- | -- | L | L | I |
| 47 | I | -- | -- | -- | -- | -- | A | -- | -- |
| 48 | G | V | -- | -- | -- | -- | -- | -- | -- |
| 50 | I | V | V | -- | -- | -- | -- | -- | -- |
| 53 | F | Y | -- | -- | -- | -- | -- | L | -- |
| 54 | I | S | -- | V | -- | V | -- | V | -- |
| 55 | K | -- | -- | R | -- | -- | -- | -- | -- |
| 57 | R | -- | -- | -- | -- | -- | K | -- | -- |
| 58 | Q | -- | E | -- | -- | -- | -- | -- | -- |
| 60 | D | -- | -- | -- | E | -- | -- | -- | -- |
| 61 | Q | -- | -- | -- | -- | -- | Y | -- | -- |
| 62 | I | V | -- | -- | V | V | -- | -- | -- |
| 63 | L | Q | P | P | P | P | -- | P | P |
| 64 | I | -- | -- | V | -- | -- | -- | -- | -- |
| 66 | I | -- | -- | V | -- | -- | -- | -- | -- |
| 67 | C | -- | -- | -- | -- | F | -- | -- | -- |
| 71 | A | V | T | -- | -- | V | -- | V | -- |
| 72 | I | V | V | -- | -- | K | -- | -- | -- |
| 73 | G | -- | -- | T | -- | S | -- | -- | -- |
| 74 | T | S | -- | -- | -- | -- | -- | -- | -- |
| 76 | L | -- | -- | -- | -- | -- | -- | -- | V |
| 77 | V | I | -- | -- | -- | -- | I | -- | -- |
| 79 | P | -- | -- | A | -- | A | -- | -- | -- |
| 82 | V | A | I | -- | -- | -- | I | A | A |
| 84 | I | -- | -- | V | V | V | -- | -- | V |
| 88 | N | -- | -- | -- | D | -- | -- | -- | -- |
| 89 | L | -- | V | -- | -- | -- | -- | -- | I |
| 90 | L | -- | -- | M | M | M | M | -- | -- |
| 93 | I | L | L | L | -- | -- | -- | -- | -- |
| 95 | C | -- | -- | F | -- | -- | -- | -- | -- |
| HD | 15 | 15 | 13 | 13 | 14 | 14 | 9 | 9 | |
-
Residues same as consensus are shown as ‘--', mutations are shown as the one letter abbreviated alphabet encoding the mutant residue (in bold are primary drug-resistance mutations appearing at more than 1% frequency).
Additional files
-
Transparent reporting form
- https://doi.org/10.7554/eLife.50524.018
Download links
A two-part list of links to download the article, or parts of the article, in various formats.
Downloads (link to download the article as PDF)
Open citations (links to open the citations from this article in various online reference manager services)
Cite this article (links to download the citations from this article in formats compatible with various reference manager tools)
Epistasis and entrenchment of drug resistance in HIV-1 subtype B
eLife 8:e50524.
https://doi.org/10.7554/eLife.50524


