Reliability of an interneuron response depends on an integrated sensory state
- The Rockefeller University, United States
- Chan Zuckerberg Initiative, United States
Figures
Figure 1 with 3 supplements
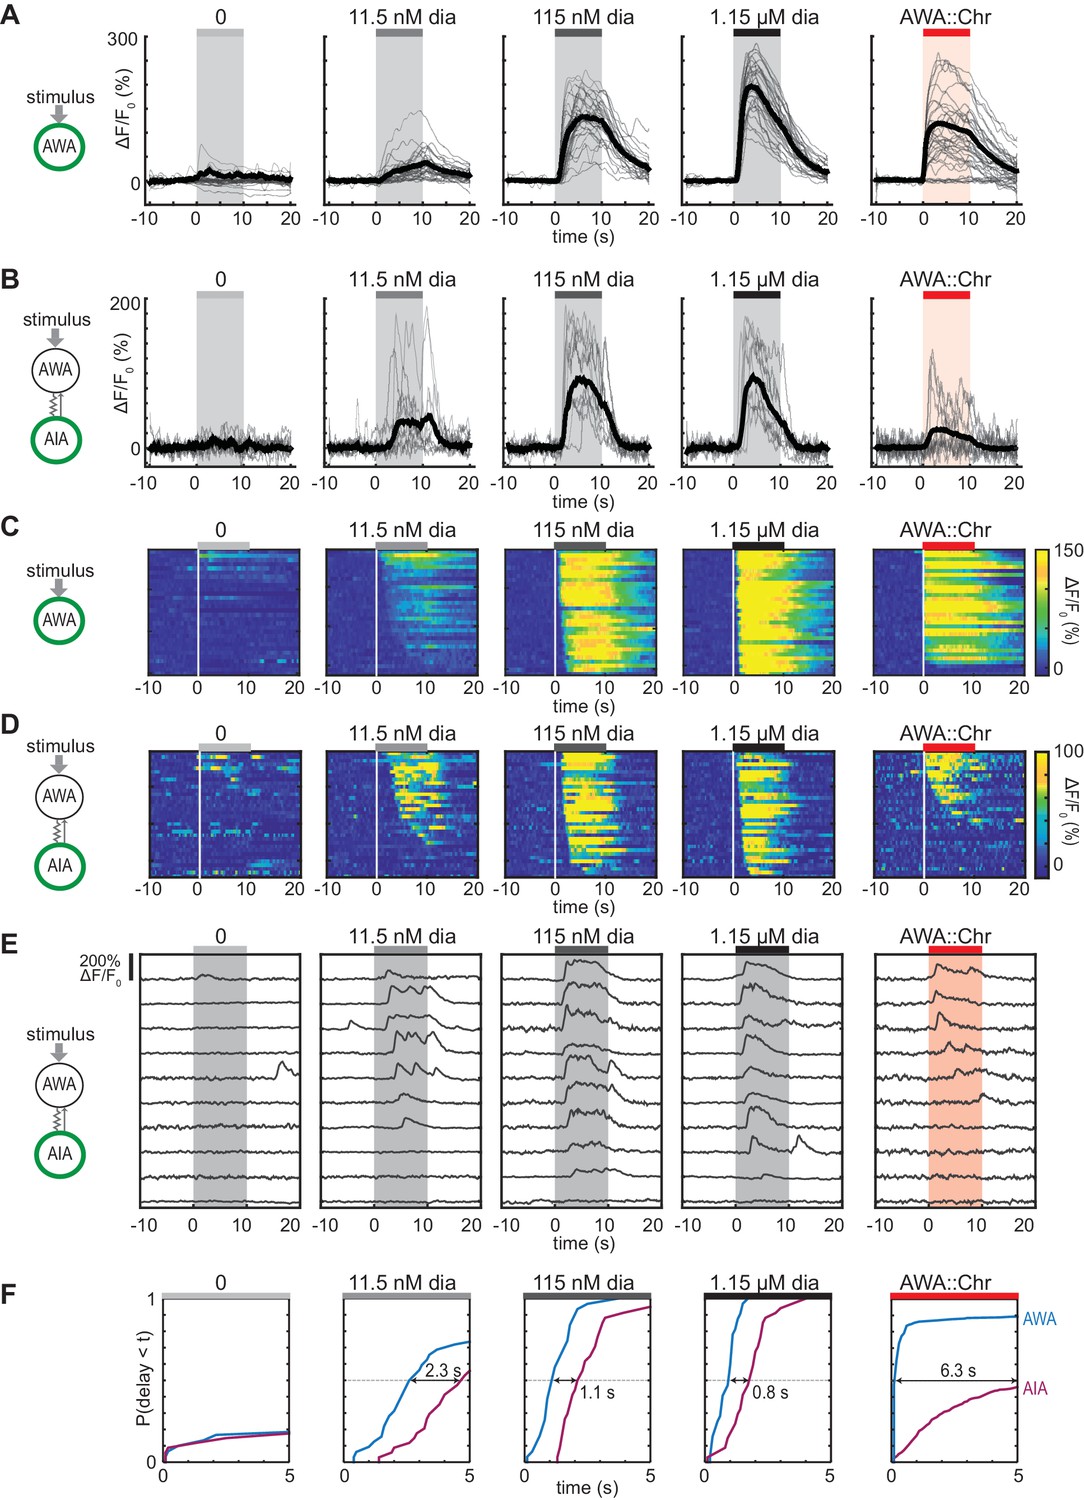
Optogenetic activation of AWA sensory neurons elicits unreliable AIA calcium responses.
(A and B) AWA GCaMP2.2b (A) or AIA GCaMP5A (B) calcium responses to 10 s pulses of increasing concentrations of diacetyl and to AWA optogenetic stimulation. Bold lines indicate mean response, and light lines show individual traces. AWA traces to optogenetic stimulation were randomly downsampled to 40 traces from a complete set of 268 traces to match the number of odor traces and enhance visibility. AIA traces were randomly downsampled to 10 traces from a set of 34 (for 0–1.15 µM diacetyl) or 569 (for AWA::Chrimson stimulation). In all schematic diagrams, calcium was monitored in the neuron indicated in green, resistor symbols represent gap junctions, and thin arrows represent chemical synapses. (C and D) Heat maps of AWA (C) or AIA (D) calcium traces from (A) and (B), respectively. Responses to optogenetic stimulation were downsampled to 32 traces (C) or 34 traces (D) for visibility and to match sample sizes to diacetyl; see Figure 1—figure supplement 3A for complete data. Each heat map row represents a calcium trace to a single stimulus pulse; each animal received two stimulus pulses. Traces are ordered by response latency. (E) Representative AIA calcium traces to a given stimulus. Responses were sorted by response latency, binned into ten bins, then one trace was randomly selected from each bin for presentation. (F) Cumulative response time profiles of AWA and AIA responses representing response latencies and probability, without downsampling. Only first 5 s of stimulation are shown. Arrows indicate the delay between the time at which 50% of AWA neurons responded versus the time at which 50% of AIA neurons responded.
-
Figure 1—source data 1
Source data for Figure 1 and figure supplements.
- https://cdn.elifesciences.org/articles/50566/elife-50566-fig1-data1-v2.xlsx
Figure 1—figure supplement 1
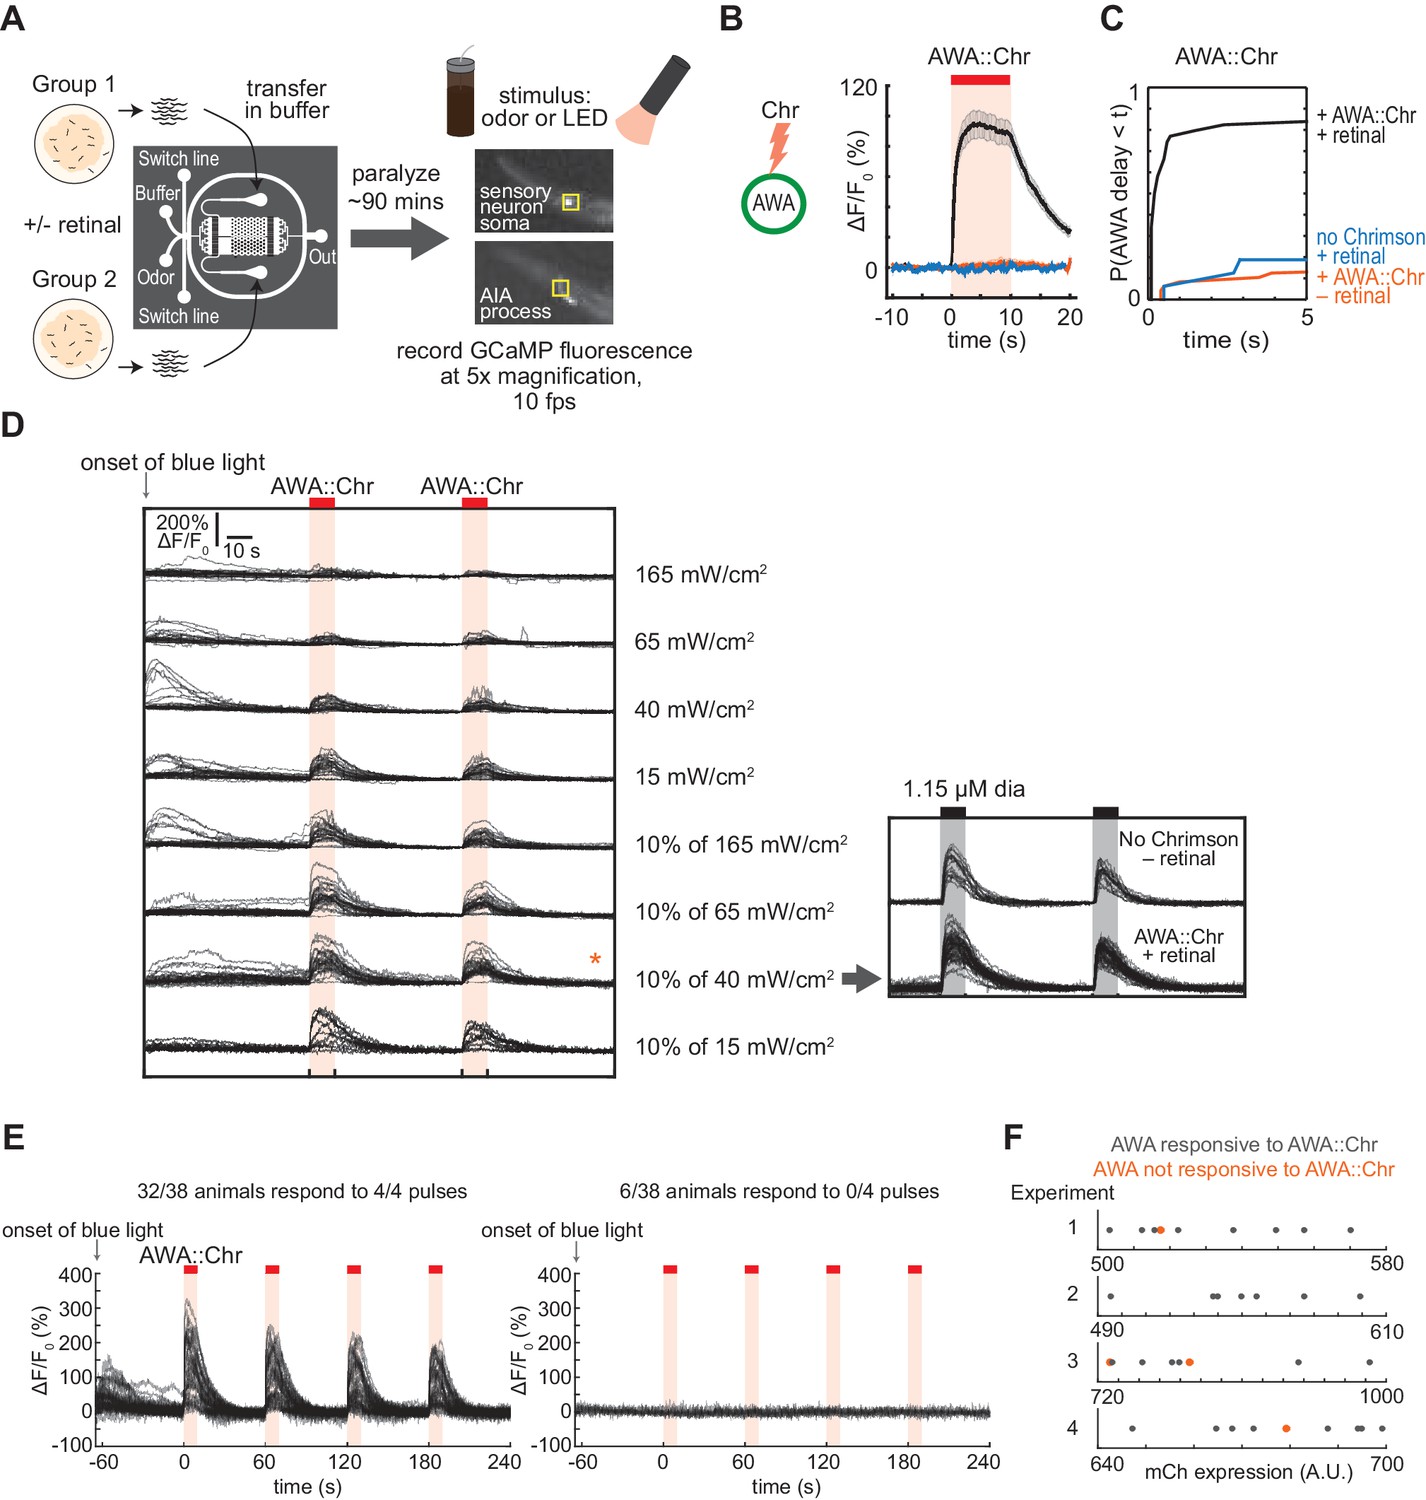
Experimental configuration and calibration of simultaneous GCaMP-Chrimson imaging conditions.
(A) Schematic of experimental configuration. Animals are paralyzed in a microfluidic device and their neural activity is recorded during exposure to odor or light. Two arenas can be recorded simultaneously with up to 10 animals per arena. See Materials and methods for details. (B and C) AWA requires both retinal pre-treatment and expression of the Chrimson transgene for responses to 617 nm light. (B) Mean AWA calcium responses; shading indicates ± SEM. Transgene with retinal: n = 74; transgene without retinal: n = 48; retinal without transgene: n = 16. (C) Cumulative response time profiles of data from (B), showing first 5 s of light exposure. (D) Individual AWA calcium responses to direct Chrimson excitation (617 nm) using various 474 nm light levels to excite GCaMP. Under strong illumination of GCaMP with 474 nm light (full power of LED, 165 mW/cm2), GCaMP fluorescence did not increase with subsequent 617 nm stimulation, presumably because of direct Chrimson excitation by 474 nm light. At lower 474 nm light levels (15–65 mW/cm2), or using a duty cycle with 10 ms of illumination every 100 s (10% of 40–165 mW/cm2), GCaMP fluorescence transiently increased but returned to a baseline that allowed a subsequent Chrimson response to 617 nm light. Chrimson responses were partly suppressed under continuous 474 nm illumination or at the highest light level at 10% illumination, suggesting some cross-activation. The 10% duty cycle at 40 mW/cm2 minimized the initial transient response to 474 nm while providing a strong signal to noise ratio at 617 nm. The 10% duty cycle at 15 mW/cm2 was too dim for AIA GCaMP experiments. In general, the 10 ms/100 ms duty cycle for 474 nm illumination is used for GCaMP experiments because strobing reduces motion artefacts, and because the duty cycle minimizes GCaMP photobleaching during long-term imaging. AWA had normal responses to 1.15 µM diacetyl when using the 10% duty cycle of 40 mW/cm2; this light level was used for all Chrimson experiments. Left: n = 20–25; Right: AWA::Chr, with retinal: n = 45; No Chrimson, no retinal: n = 16. (E) AWA calcium responses to four consecutive pulses of Chrimson excitation. AWA either responded to all or none of the Chrimson pulses, suggesting that variability in AWA responses to Chrimson is the property of an individual animal rather than a trial-to-trial property. Note that all experiments in other figures used two stimulus pulses, unless otherwise stated. (F) AWA::Chrimson::sl2::mCherry transgene expression levels for four separate experiments. Animals that responded to Chrimson excitation are in gray; animals that did not respond are in orange. There is no obvious correlation between mCherry expression level and the likelihood of AWA responses to light.
Figure 1—figure supplement 2
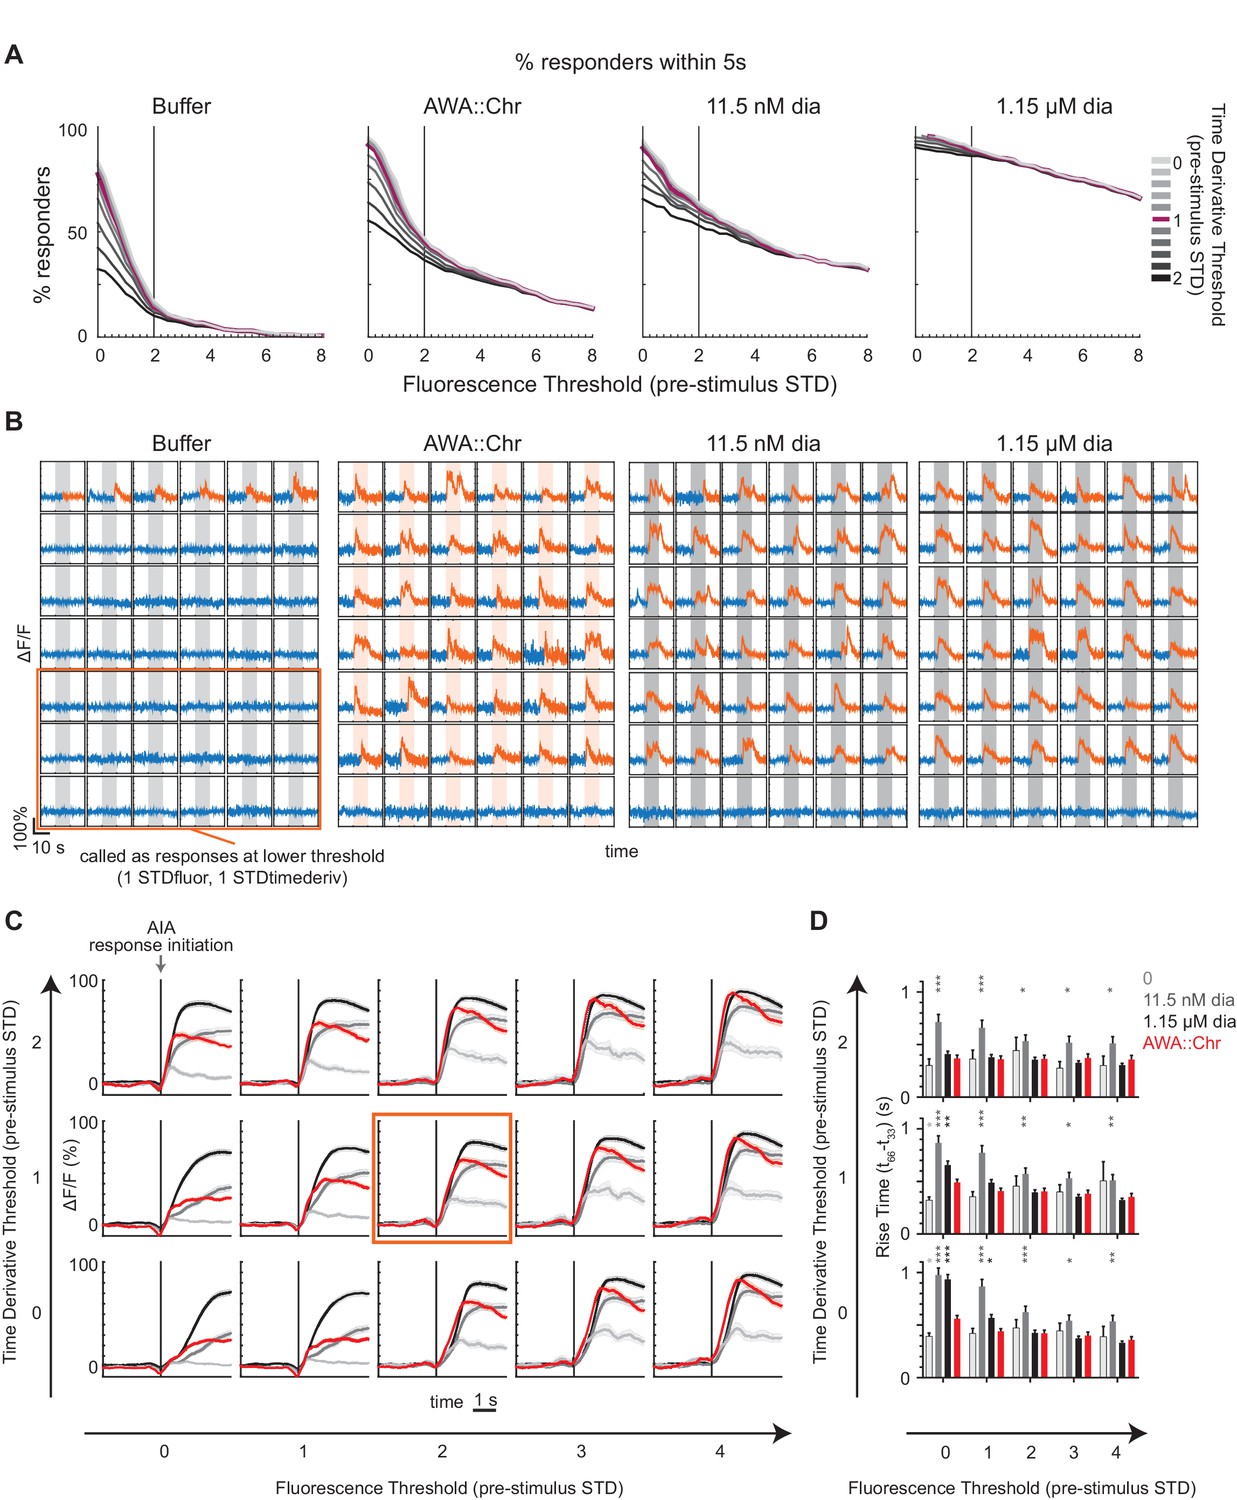
Validation of AIA response thresholding procedure.
(A) Proportion of AIA calcium traces counted as ‘responses’ at varying fluorescence (x-axis) and time derivative (color axis) threshold parameters to various stimuli. Thresholds depend on the standard deviation (STD) of either fluorescence or time derivative of the 10 s window preceding the stimulus. A ‘response’ indicates that a frame t has fulfilled two criteria within 5 s of the stimulus onset: the mean fluorescence of t:t+12 frames exceeds the fluorescence threshold, and the mean time derivative of t:t+1 exceeds the time derivative threshold. A fluorescence threshold of 2 STD marks an inflection point in number of traces called ‘responses’ to pulses of buffer, such that a lower fluorescence threshold would include false positives. The time derivative threshold of 1 STD marks another inflection point such that higher thresholds begin to exclude events for all stimuli. All subsequent analyses use the thresholds of 2 STD for fluorescence and 1 STD for time derivative. The chosen time derivative threshold is useful for constraining the response timing for latency analyses rather than excluding traces based on slope or shape. Buffer: n = 297; AWA::Chr: n = 569; 11.5 nM diacetyl: n = 230; 1.15 µM diacetyl: n = 438. (B) Representative selection of individual AIA calcium traces deemed ‘responses’ or ‘nonresponses’ to various stimuli. Traces that are completely blue were deemed ‘nonresponses’ using the chosen threshold of 2 STD for fluorescence and 1 STD for time derivative. Traces in both blue and orange were deemed ‘responses’ at the color transition. Orange box shows a subset of traces that were deemed ‘nonresponses’ at the chosen threshold but were deemed ‘responses’ at the lower threshold of 1 STD for fluorescence and 1 STD for time derivative. (C) AIA ‘responses’ to various stimuli at given threshold parameters, aligned to the initiation of each response rather than stimulus onset, and averaged. Only calcium traces that were called ‘responses’ within 5 s into stimulus are included. Threshold parameters used in this study (2 STD for fluorescence; 1 STD for time derivative) are indicated by the orange box. Shading indicates ± SEM. (D) Rise times of AIA ‘responses’ to various stimuli and threshold parameters. Error bars show SEM. Asterisks refer to significance of one-way ANOVA with Dunnett’s multiple comparisons test, using AWA::Chrimson as the comparison stimulus. No asterisks: not significant; *: p<0.05; **: p<0.01; ***: p<0.001.
Figure 1—figure supplement 3
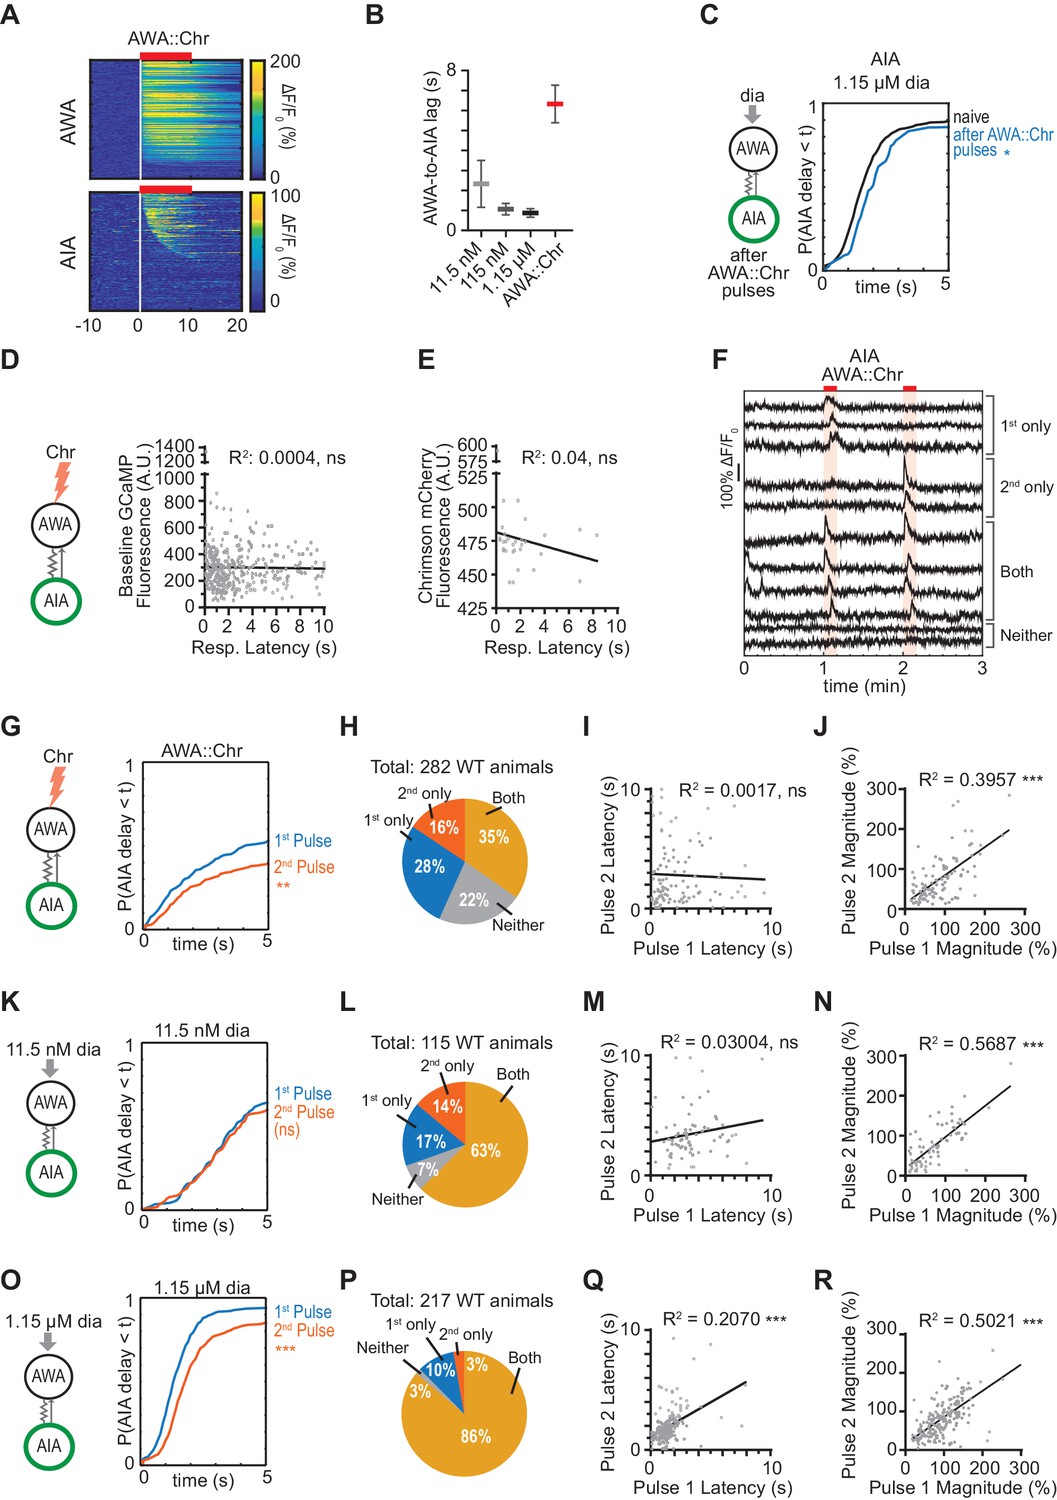
Sequential imaging of AIA responses to odor or AWA::Chrimson stimulation.
(A) Heat maps of AWA and AIA responses to AWA::Chrimson stimulation, combined over all experiments. AWA: n = 268; AIA: n = 569. (B) Delay between the time at which 50% of AWA versus 50% of AIA neurons responded to various stimuli. Delay was greatest for AWA::Chrimson stimulation. Bars are mean ± SEM. (C) Cumulative response time profiles of AIA responses to 1.15 µM diacetyl recorded immediately after recordings of AWA::Chrimson stimulation (blue), representing a subset of animals used in (A). AIA responses to 1.15 µM diacetyl combined over all experiments are shown for comparison (black). (D) Response latencies of 318 AIA responses to AWA::Chrimson stimulation do not correlate with GCaMP fluorescence levels at pre-stimulus baseline. (E) Response latencies of 31 responses to AWA::Chrimson stimulation do not correlate with Chrimson transgene expression levels. (F) Representative AIA calcium traces to two pulses of AWA::Chrimson stimulation. AIA can response to the first pulse only, second pulse only, both pulses, or neither pulse. (G, K, and O) Cumulative response time profiles of AIA responses to the first or second stimulation with AWA::Chrimson (I), 11.5 nM diacetyl (L), or 1.15 µM diacetyl (O). Only animals for which both trial pulses yielded usable results were included (e.g. for AIA::Chrimson, 282/287 animals). All other figures and analyses beyond this supplement pool responses to both pulses. (H, L, and P) Proportion of animals that respond to only the first, second, both, or neither pulse of stimulation with AWA::Chrimson (H), 11.5 nM diacetyl (L), or 1.15 µM diacetyl (P). Some of the 22% of animals that did not respond to either AWA::Chrimson pulse may be the result of AWA::Chrimson transgene failure (~15% failure rate; see Figure 1—figure supplement 1E); transgene failure does not explain the large proportion of animals that responded to one of two pulses, nor does it explain variability in response latencies. (I and J) In 98 animals that responded to both AWA::Chrimson stimulation pulses, there was no correlation between response latencies across pulses (I), but response magnitudes were correlated across pulses (J). (M and N) In 72 animals that responded to both 11.5 µM diacetyl pulses, there was no correlation between response latencies across pulses (M), but response magnitudes were correlated across pulses (N). (Q and R) In 187 animals that responded to both 1.15 µM diacetyl pulses, there was a moderate correlation between response latencies (Q) and a correlation between response magnitudes (R) across pulses. Three outlier data points were excluded from (R) but were included in analysis. For (C), (G), (K), and (O), asterisks refer to Kolmogorov-Smirnov test significance over full 10 s stimulus pulse. ns: not significant; *: p<0.05; **: p<0.01; ***: p<0.001. See Supplementary file 2 for sample sizes and test details. For (D), (E), (I), (J), (M), (N), (Q) and (R), asterisks refer to significance of linear regression slope differing from 0. ns: not significant; ***: p<0.001.
Figure 2 with 1 supplement
Gap junctions mediate AWA-to-AIA communication.
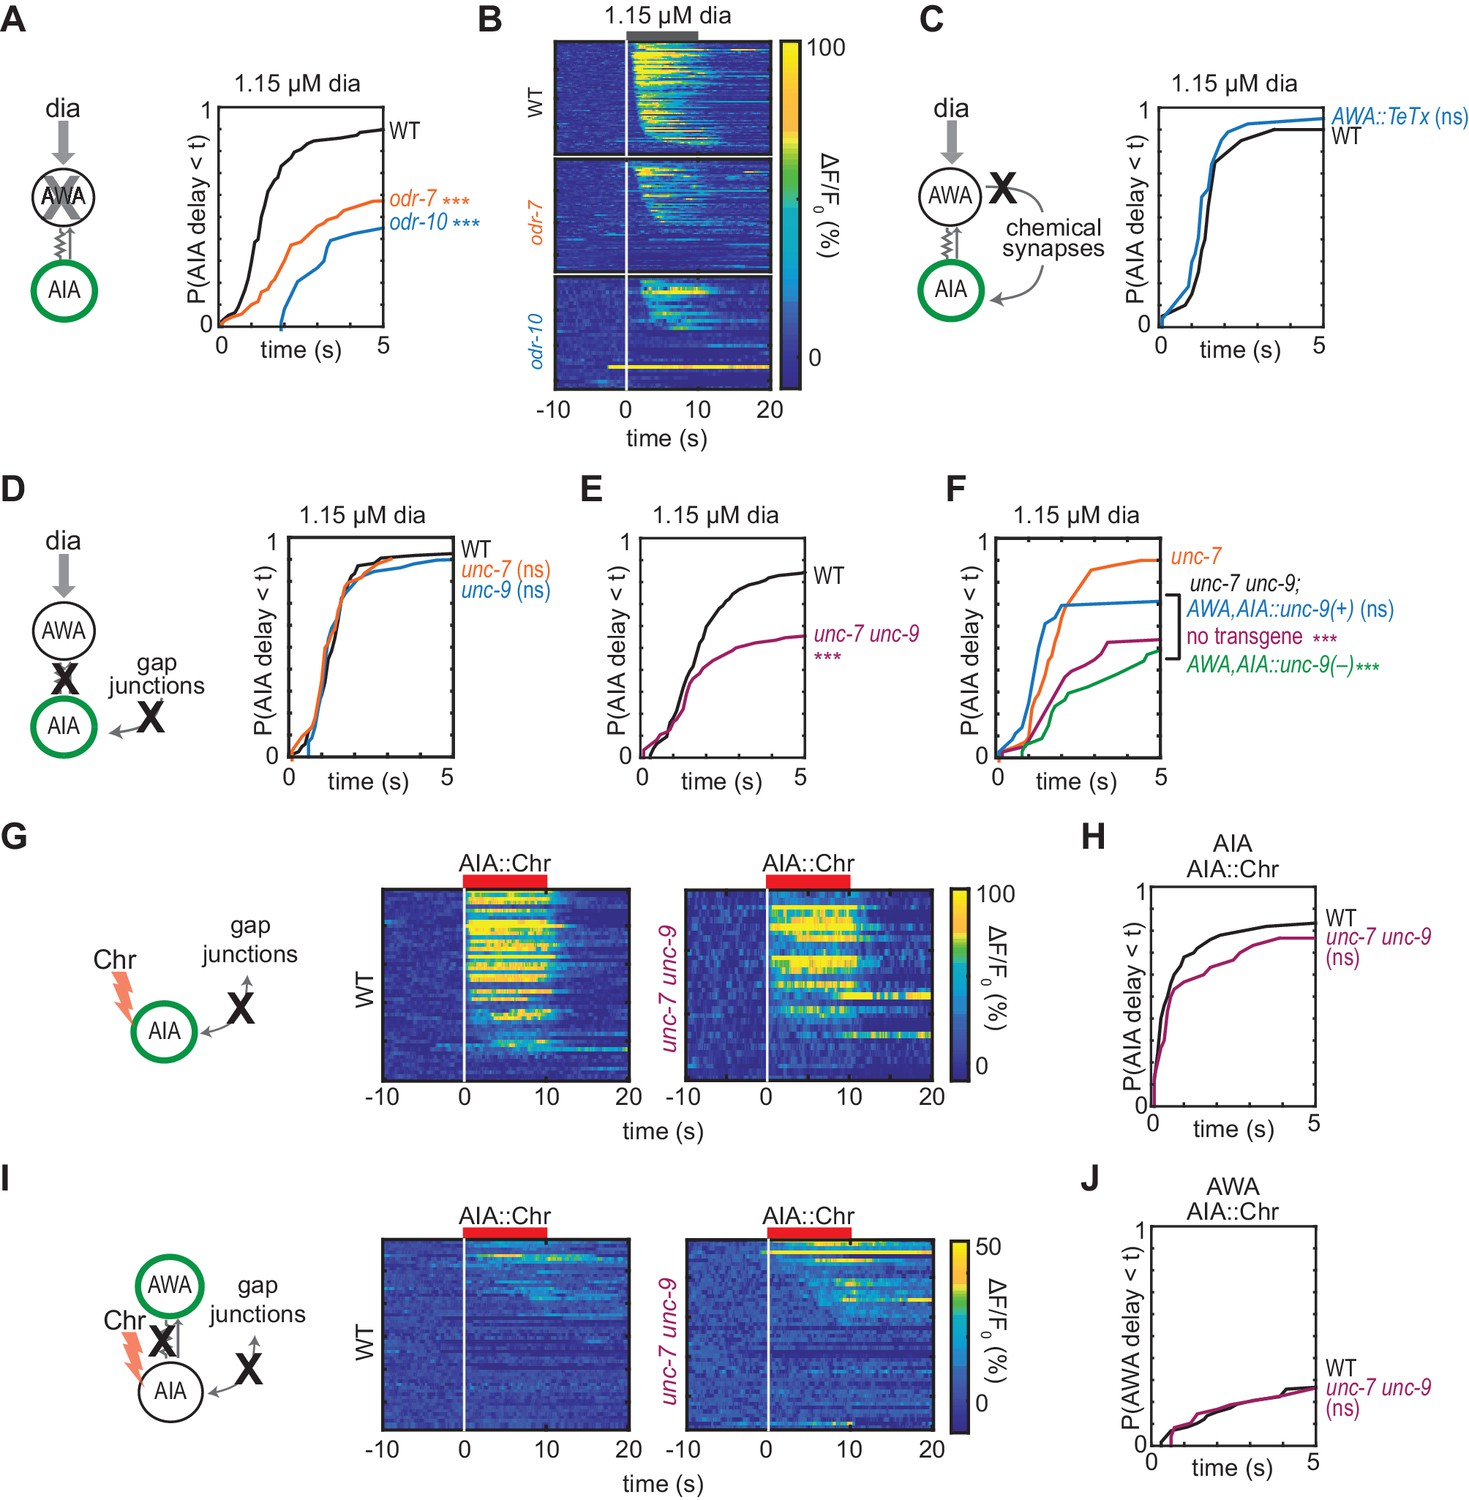
(A, C, D and E) Cumulative response time profiles of AIA responses to 1.15 µM diacetyl in WT versus odr-7 animals (AWA cell fate mutants) (A), odr-10 animals (AWA diacetyl receptor mutants) (A), animals expressing a transgene encoding Tetanus Toxin Light Chain A (TeTx) in AWA (C), unc-7 or unc-9 animals (innexin mutants) (D), and unc-7 unc-9 double mutants (E). (B) Heat maps of AIA responses to 1.15 µM diacetyl in WT, odr-7, and odr-10 animals from (A). (F) unc-9 innexin rescue in AWA and AIA. Cumulative response time profiles of AIA responses to 1.15 µM diacetyl in unc-7 innexin mutants, unc-7 unc-9 double mutants, unc-7 unc-9; AWA,AIA::unc-9(+) transgenic rescue animals, and unc-7 unc-9; AWA,AIA::unc-9(fc16) transgenic control animals. (G and I) AIA (G) and AWA (I) responses to 10 s pulses of AIA::Chrimson stimulation in WT and unc-7 unc-9 animals; one row per calcium trace. Note that scale bar in (I) differs from scale bar in Figure 1C. (H) Cumulative response time profiles of AIA responses shown in (G). (J) Cumulative response time profiles of AWA responses shown in (I). Asterisks refer to Kolmogorov-Smirnov test significance versus WT (A, C, D, E, H and J) or versus unc-7 (F) over full 10 s stimulus pulse. ns: not significant; ***: p<0.001. See Supplementary file 2 for sample sizes and test details. Additional heat maps of data from Figure 2 appear in Figure 2—figure supplement 1.
-
Figure 2—source data 1
Source data for Figure 2 and figure supplement.
- https://cdn.elifesciences.org/articles/50566/elife-50566-fig2-data1-v2.xlsx
Figure 2—figure supplement 1
Gap junctions contribute to AWA-to-AIA communication, additional data.
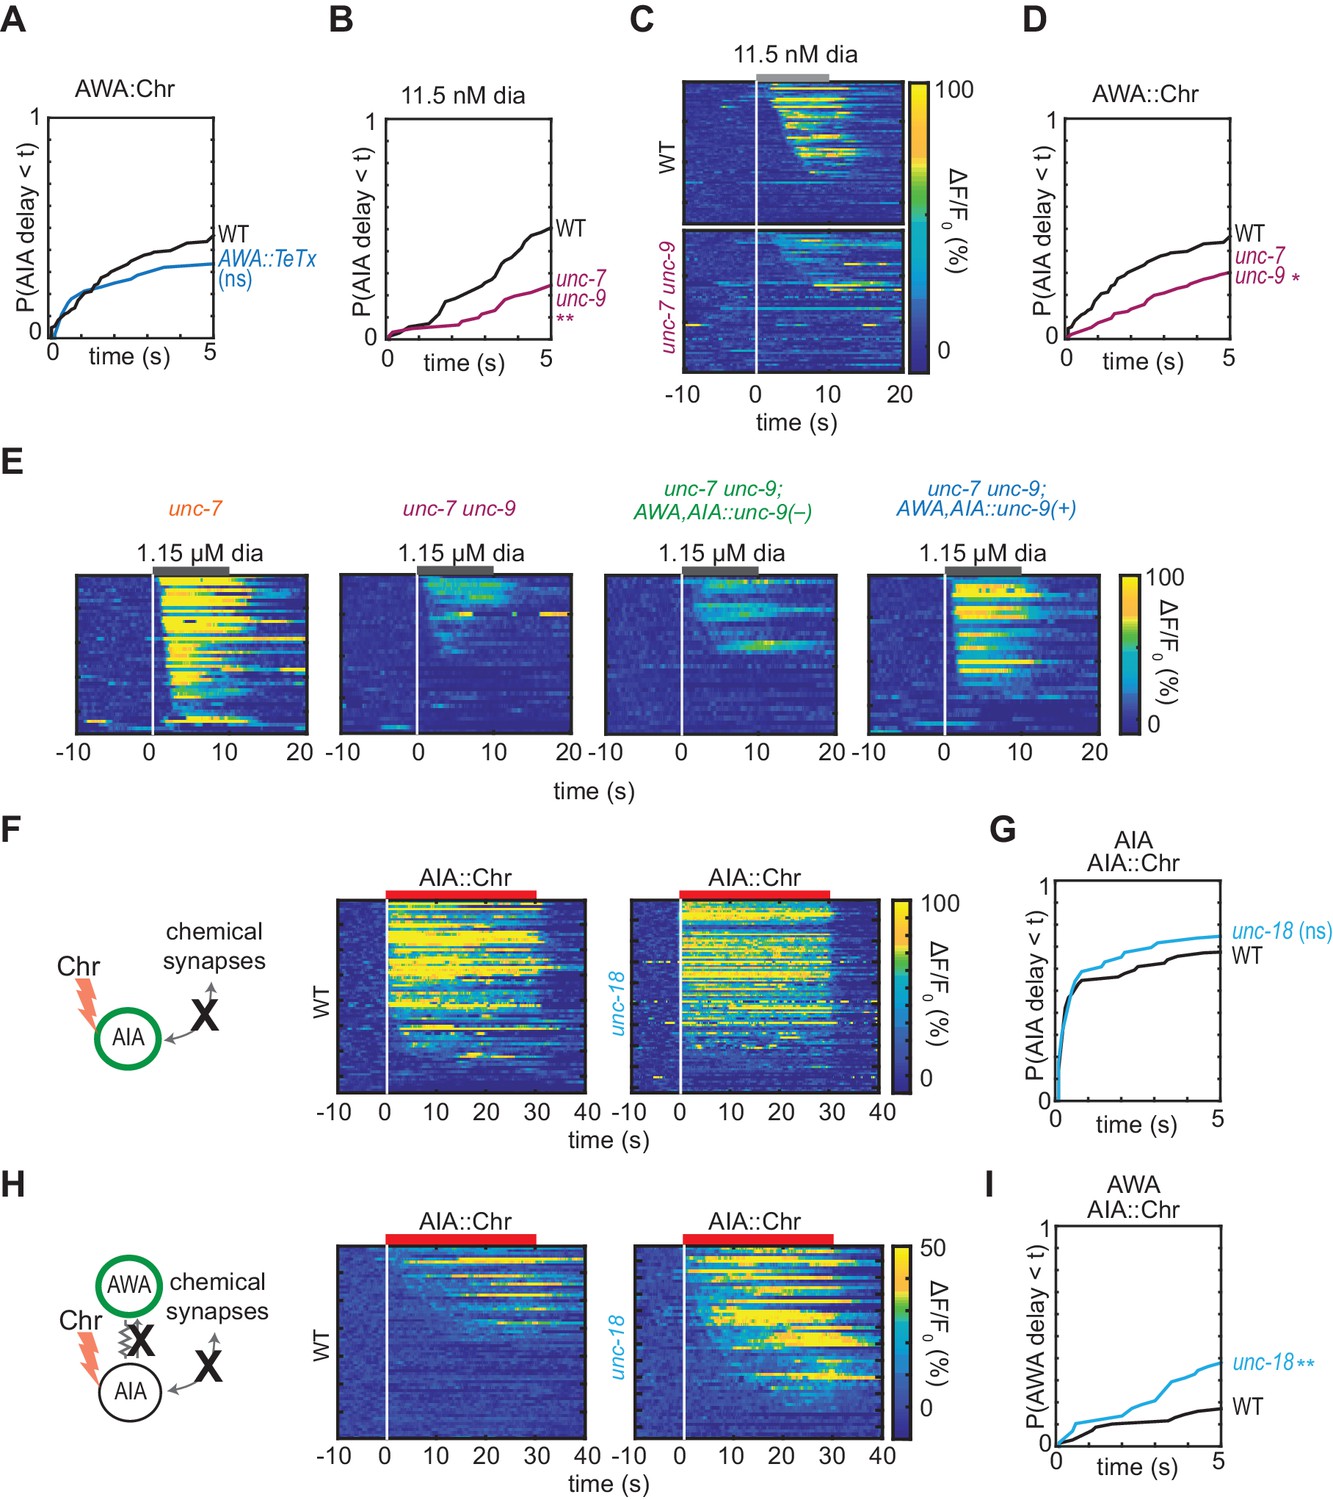
(A) Cumulative response time profiles of AIA responses to AWA::Chrimson stimulation in WT versus animals expressing Tetanus Toxin Light Chain A (TeTx) in AWA. (B and D) Cumulative response time profiles of AIA responses to 11.5 nM diacetyl (B) and AWA::Chrimson stimulation (D) in WT versus unc-7 unc-9 animals (innexin double mutants). (C) Heat maps of AIA responses to 11.5 nM diacetyl in WT versus unc-7 unc-9 animals shown in (B). (E) Heat maps of AIA responses to 1.15 µM diacetyl in unc-7 mutants, unc-7 unc-9 double mutants, unc-7 unc-9; AWA,AIA::unc-9(+) transgenic rescue animals, and unc-7 unc-9; AWA,AIA::unc-9(fc16) transgenic control animals bearing an inactivating point mutation, shown in Figure 2F. (F and H) AIA (F) and AWA (H) responses to 10 s pulses of AIA::Chrimson stimulation in WT and unc-18 animals (synaptic transmission mutants); one row per calcium trace. (G) Cumulative response time profiles of AIA responses shown in (F). (I) Cumulative response time profiles of AWA responses shown in (H). Asterisks refer to Kolmogorov-Smirnov test significance versus WT over full 10 s stimulus pulse. ns: not significant; *: p<0.05; **: p<0.01. See Supplementary file 2 for sample sizes and test details.
Figure 3 with 1 supplement
Chemical synapses inhibit AIA.
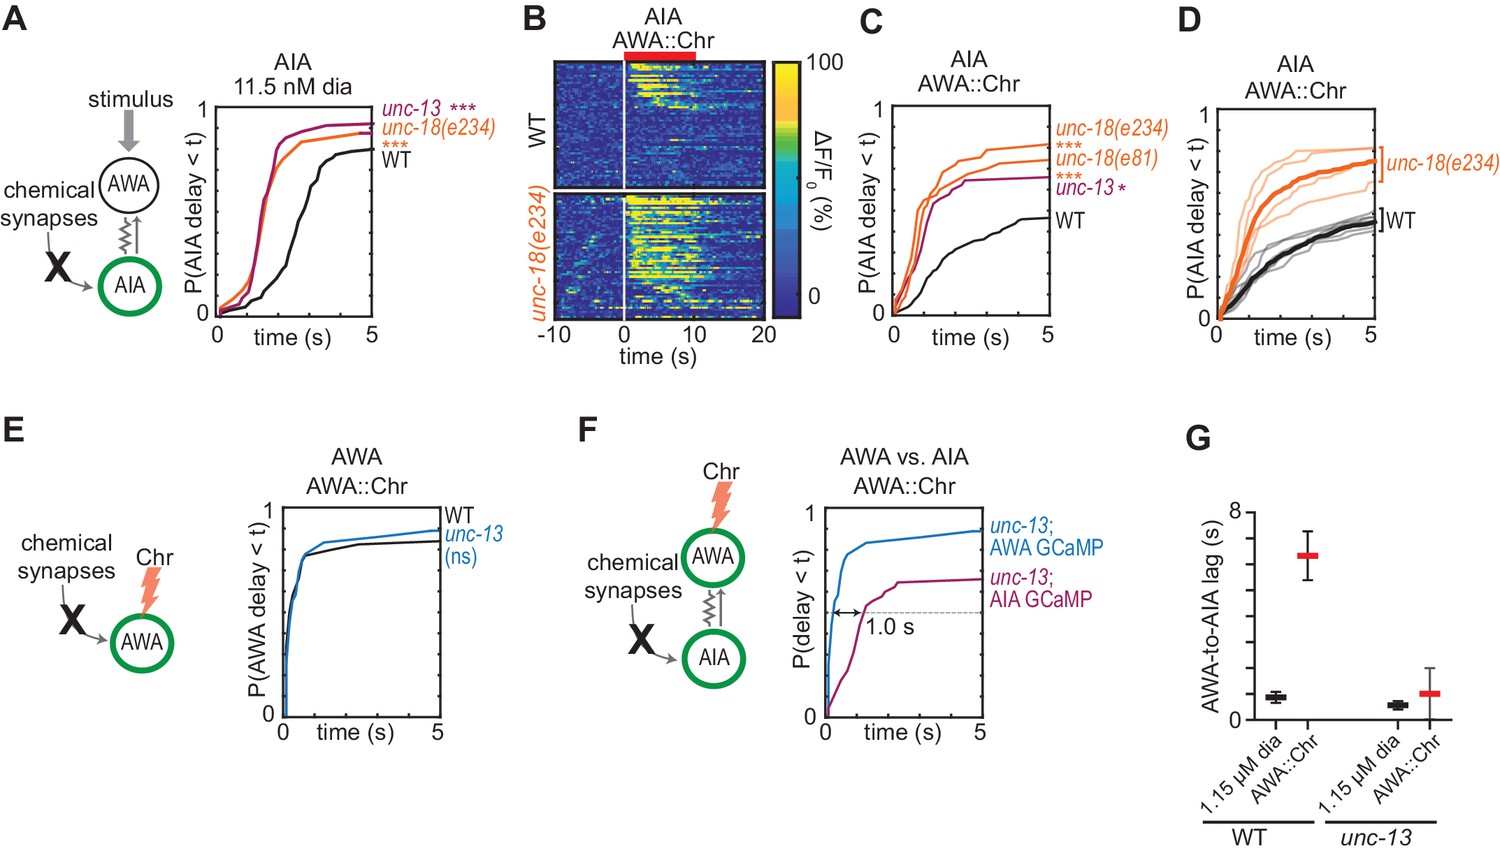
(A) Cumulative response time profiles of AIA responses to 11.5 nM diacetyl in WT versus unc-13(e51) and unc-18(e234) animals (synaptic transmission mutants). (B) Heat maps of AIA responses to AWA::Chrimson stimulation in WT and unc-18(e234) animals. WT data were randomly downsampled to 57 traces for visibility and to match number of unc-18(e234) traces; data shown for single experiment block. See Figure 3—figure supplement 1B for pooled data from all experiments. (C) Cumulative response time profiles of AIA responses to AWA::Chrimson stimulation in WT versus unc-13, unc-18(e234), and unc-18(e81) animals. (D) Cumulative response time profiles of WT and unc-18(e234) response time profiles, combined over all experiments. Thick lines represent distributions of all data, faint lines represent distributions from individual experimental blocks. (E) Cumulative response time profiles of AWA responses to AWA::Chrimson stimulation in WT versus unc-13 animals. (F) Cumulative response time profiles of AWA and AIA responses to AWA::Chrimson stimulation in unc-13 animals. Arrow indicates the delay between the time at which 50% of AWA versus 50% of AIA neurons have responded. (G) Delay between the time at which 50% of AWA versus 50% of AIA neurons responded to 1.15 µM diacetyl and AWA::Chrimson stimulation in WT and unc-13 animals. WT responses are the same as in Figure 1—figure supplement 3B. Bars are mean ± SEM. Asterisks refer to Kolmogorov-Smirnov test significance versus WT over full 10 s stimulus pulse. ns: not significant; *: p<0.05; ***: p<0.001. See Supplementary file 2 for sample sizes and test details. Additional heat maps of data from Figure 3 appear in Figure 3—figure supplement 1.
-
Figure 3—source data 1
Source data for Figure 3 and figure supplement.
- https://cdn.elifesciences.org/articles/50566/elife-50566-fig3-data1-v2.xlsx
Figure 3—figure supplement 1
Chemical synapses inhibit AIA, additional data.
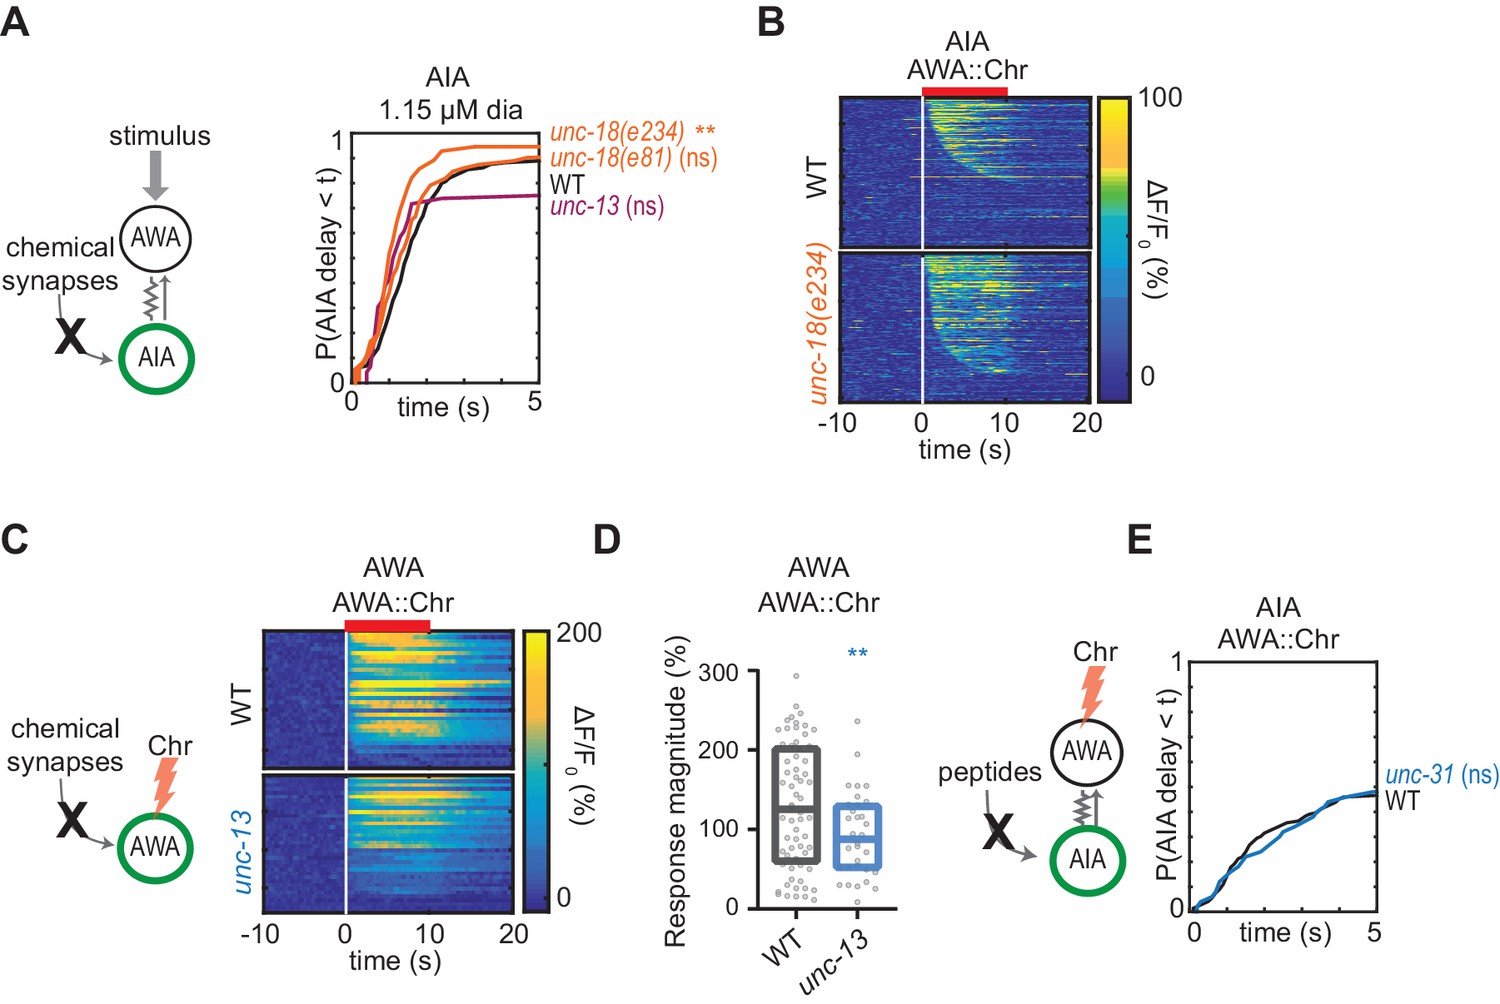
(A) Cumulative response time profiles of AIA to 1.15 µM diacetyl in WT versus unc-13(e51), unc-18(e234), and unc-18(e81) animals (synaptic transmission mutants). (B) Heat maps of AIA responses to AWA::Chrimson stimulation in WT and unc-18(e234) animals, combined over all experiments. WT: n = 569; unc-18(e234): n = 335. (C) Heat maps of AWA responses to AWA::Chrimson stimulation in WT and unc-13 animals from Figure 3E. (D) Magnitude of AWA responses shown in (C), omitting traces that did not produce a detectable response. Boxes show median and interquartile range. (E) Cumulative response time profiles of AIA responses to AWA::Chrimson stimulation in WT versus unc-31 animals (dense core vesicle exocytosis mutants). For (A) and (E), asterisks refer to Kolmogorov-Smirnov test significance versus WT over full 10 s stimulus pulse. ns: not significant; **: p<0.01. See Supplementary file 2 for sample sizes and test details. For (D), asterisks refer to statistical significance of an unpaired t-test. ns: not significant; **: p<0.01. See Supplementary file 3 for sample sizes and test.
Figure 4 with 2 supplements

Glutamatergic sensory neurons cooperate to inhibit AIA.
(A) Simplified diagram of connections between AWA, AIA and four glutamatergic sensory neurons, based on White et al. (1986). (B) Schematic of cell-selective glutamate knockout genetic strategy (López-Cruz et al., 2019). The eat-4 locus is excised only in the presence of flippase. ORF: open reading frame; UTR: untranslated region; FRT: flippase recombinase target. (C–H) Cumulative response time profiles of AIA responses to AWA::Chrimson stimulation in various animals lacking either glutamate release or cellular function of specific sensory neurons. For (D–G), dotted black and blue lines are control and eat-4-FRT; AWC,ASE,ASK,ASG::nFlippase, respectively, from (C). (C) Control (eat-4-FRT genetic background with no flippase expression), unc-18, and eat-4-FRT; AWC,ASE,ASK,ASG::nFlippase animals. (D) eat-4-FRT; ASK::nFlippase animals. (E) eat-4-FRT; ASG::nFlippase animals. (F) eat-4-FRT; AWC::nFlippase animals. (G) eat-4-FRT; AWC+ASE::nFlippase animals. (H) WT and che-1 animals (ASE cell fate mutants). (I) Cumulative response time profiles of AIA responses to AWA::Chrimson stimulation in WT, unc-18 animals, unc-18; AWC,ASE::unc-18(+) transgenic rescue animals (two lines), and unc-18; AWC,ASE::unc-18(e234) transgenic control animals. Asterisks refer to Kolmogorov-Smirnov significance versus eat-4-FRT controls (C–G) or WT (H, I) over full 10 s stimulus pulse. ns: not significant; **: p<0.01; ***: p<0.001. See Supplementary file 2 for sample sizes and test details. Heat maps of data from Figure 4 appear in Figure 4—figure supplement 1. Additional representations of data from Figures 1–4 appear in Figure 4—figure supplement 2.
-
Figure 4—source data 1
Source data for Figure 4 and figure supplements.
- https://cdn.elifesciences.org/articles/50566/elife-50566-fig4-data1-v2.xlsx
Figure 4—figure supplement 1
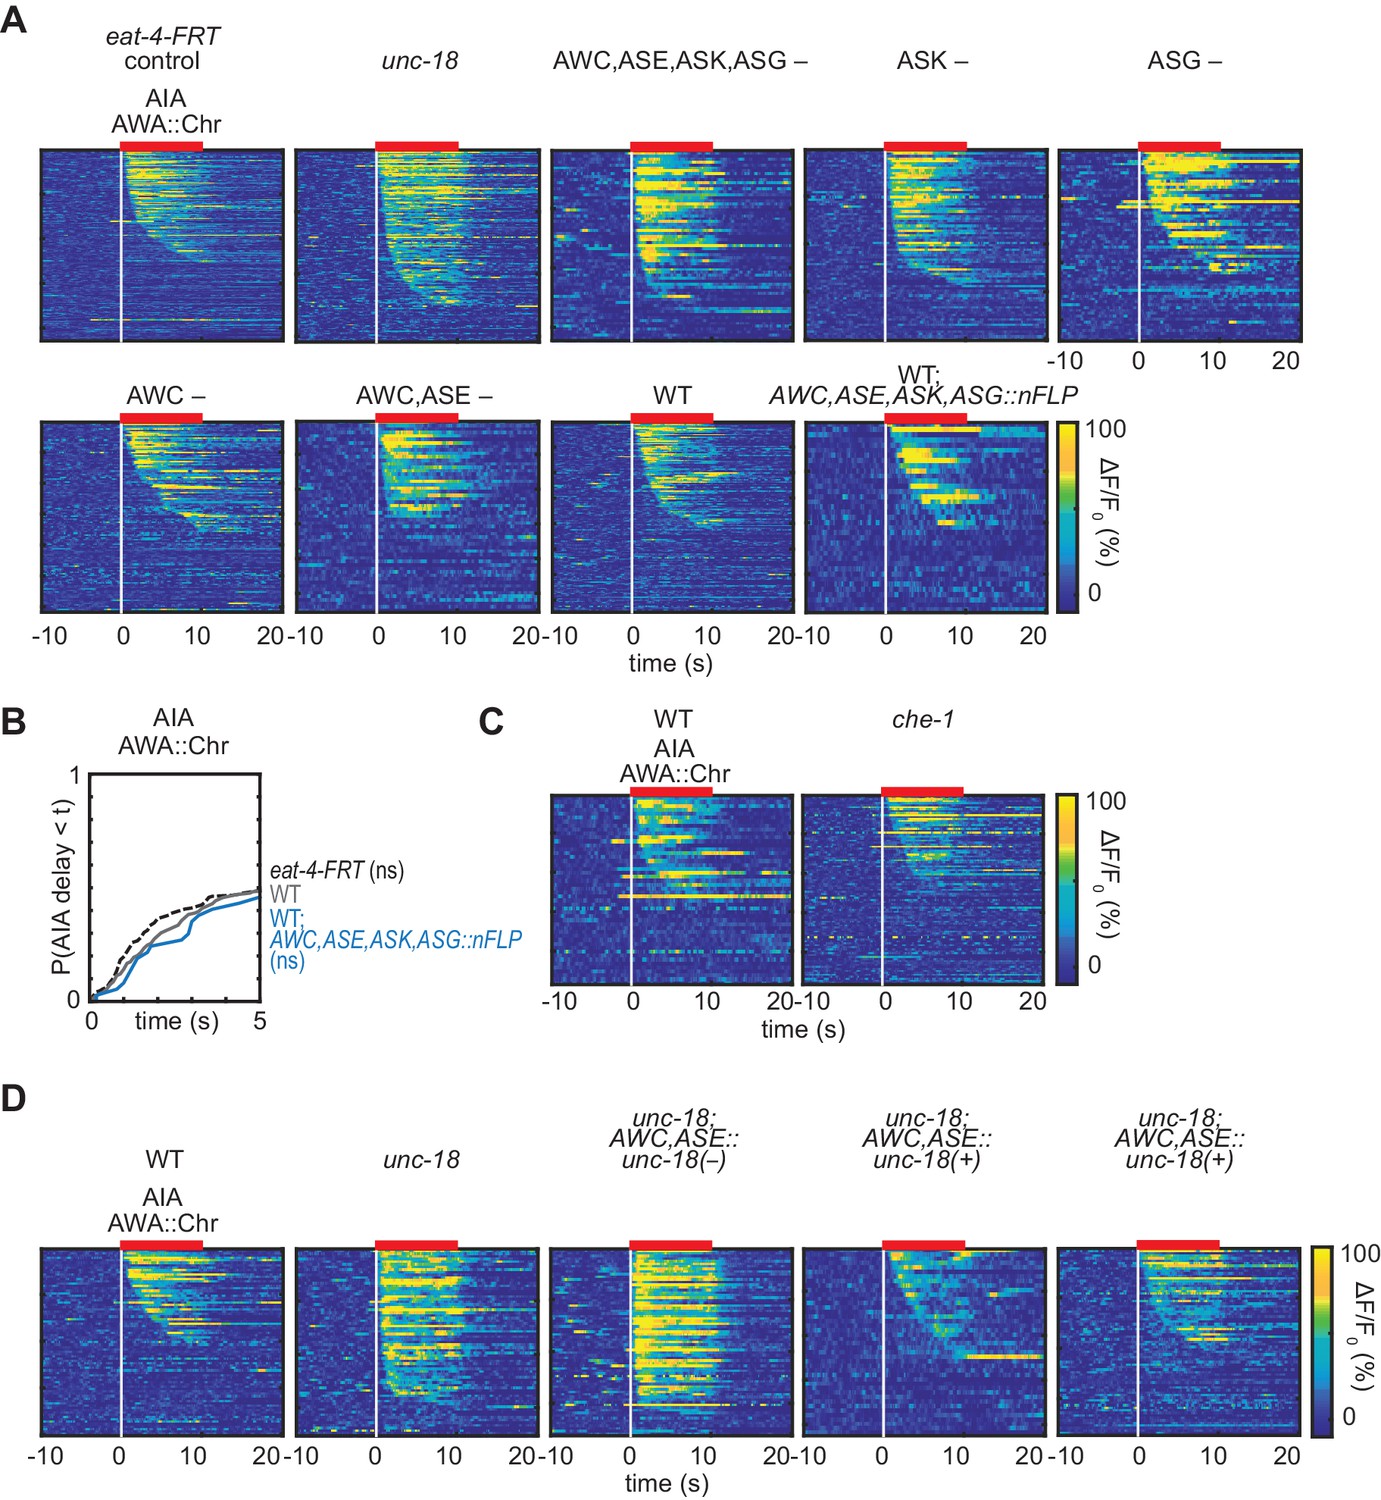
Controls and heat maps for FRT-FLP recombination.
(A) Heat maps of AIA responses to AWA::Chrimson in eat-4-FRT control strain, unc-18, FRT+nFlippase animals lacking glutamate release in specific sensory neurons, shown in Figure 4C–G, WT, and WT control strain expressing AWC,ASE,ASK,ASG::nFlippase. (B) Cumulative response time profiles of AIA responses to AWA::Chrimson stimulation in WT animals, animals with the genetically modified eat-4-FRT locus alone, or animals with the AWC,ASE,ASK,AWG::nFlippase transgene alone. All genotypes include the AWA::Chrimson transgene. (C) Heat maps of AIA responses to AWA::Chrimson in WT and che-1 animals (ASE cell fate mutants), shown in Figure 4H. (D) Heat maps of AIA responses to AWA::Chrimson in WT, unc-18, unc-18; AWC,ASE::unc-18(e234) transgenic control animals bearing an inactivating point mutation, and unc-18; AWC,ASE::unc-18(+) transgenic rescue animals (two lines).
Figure 4—figure supplement 2

Additional representations of AIA data from Figures 1–4.
(A – C) Negative correlation between AIA GCaMP fluorescence at baseline and magnitude of responses to AWA::Chrimson (A), 11.5 nM diacetyl (B), and 1.15 µM diacetyl (C). Only responses to the first stimulus pulse are included in this analysis. AWA::Chrimson: n = 176; 11.5 nM diacetyl: n = 91; 1.15 µM diacetyl: n = 208. (D – I) Mean AIA responses to various stimuli that resulted in AIA activation within 5 s of stimulus, aligned to the beginning of AIA activation rather than stimulus time. Shading indicates ± SEM. (D) WT versus odr-7 and odr-10 to 1.15 µM diacetyl, shown in Figure 2A. (E and F) WT versus animals expressing a transgene encoding Tetanus Toxin Light Chain A (TeTx) in AWA to 1.15 µM diacetyl (E) or AWA::Chrimson (F), shown in Figure 2C and Figure 2—figure supplement 1A. (G and H) WT versus unc-7 unc-9 animals to 11.5 nM diacetyl (G) or AWA::Chrimson (H), shown in Figure 2—figure supplement 1B and D. (I) unc-7 mutants versus unc-7 unc-9 double mutants, unc-7 unc-9; AWA,AIA::unc-9(+) transgenic rescue animals, and unc-7 unc-9; AWA,AIA::unc-9(fc16) transgenic control animals with an inactivating point mutation, shown in Figure 2F. (J – L) Mean AIA responses to 11.5 nM diacetyl (J), 1.15 µM diacetyl (K), and AWA::Chrimson (L) that resulted in activation within 5 s of stimulus, aligned to the beginning of AIA activation rather than stimulus time, in WT versus unc-13, unc-18(e234), and unc-18(e81) animals, shown in Figure 3A, Figure 3—figure supplement 1A, and Figure 3C. (M) Rise times of AIA responses to AWA::Chrimson in WT, unc-13, unc-18(e234), and unc-18(e81) synaptic transmission mutants, shown in Figure 3C. (N – P) Mean AIA responses to AWA::Chrimson stimulation that resulted in activation within 5 s of stimulus, aligned to the beginning of AIA activation rather than stimulus time, in various animals lacking either glutamate release or cellular function of specific sensory neurons, shown in Figure 4. (N) eat-4-FRT, eat-4-FRT; AWC,ASE,ASK,ASG::nFlippase, eat-4-FRT; ASG::nFlippase, eat-4-FRT; AWC,ASE::nFlippase, eat-4-FRT; ASK::nFlippase, and eat-4-FRT; AWC::nFlippase. (O) eat-4-FRT, unc-18(e234), WT, and WT expressing nFlippase in AWC, ASE, ASK, and ASG. (P) WT and che-1 animals (ASE cell fate mutants). For (A), (B), and (C), asterisks refer to significance of linear regression slope differing from 0. ***: p<0.001. For (M), ns refers to a lack of statistical significance of one-way ANOVA with Dunnett’s multiple comparisons test. See Supplementary file 4 for sample sizes and test details. For (P), ns refers to lack of statistical significance of an unpaired t-test. For all others, asterisks refer to statistical significance of one-way ANOVA with Dunnett’s multiple comparisons test versus unc-7 (for I only) or versus WT (for all others). ns: not significant; *: p<0.05; **: p<0.01; ***: p<0.001. See Supplementary file 3 for sample sizes and test details.
Figure 5 with 3 supplements
Multiple sensory neurons detect diacetyl and isoamyl alcohol.
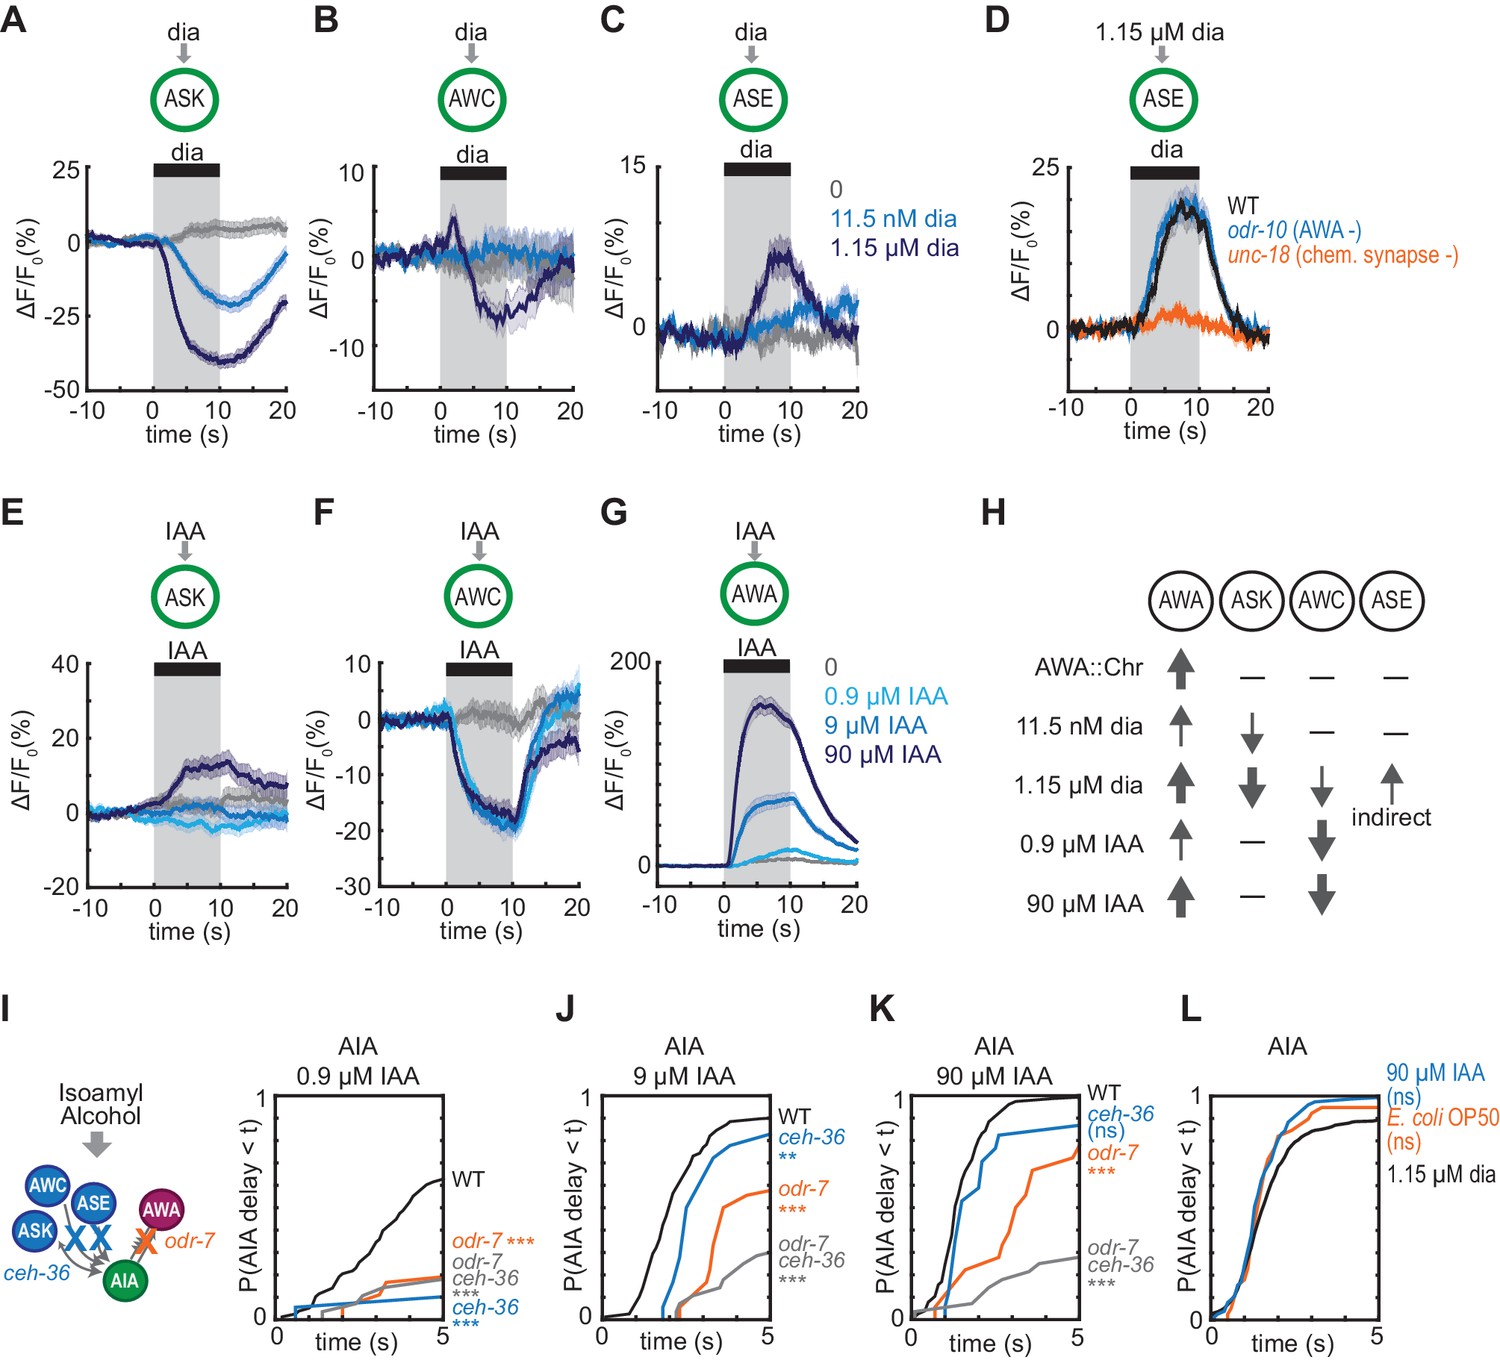
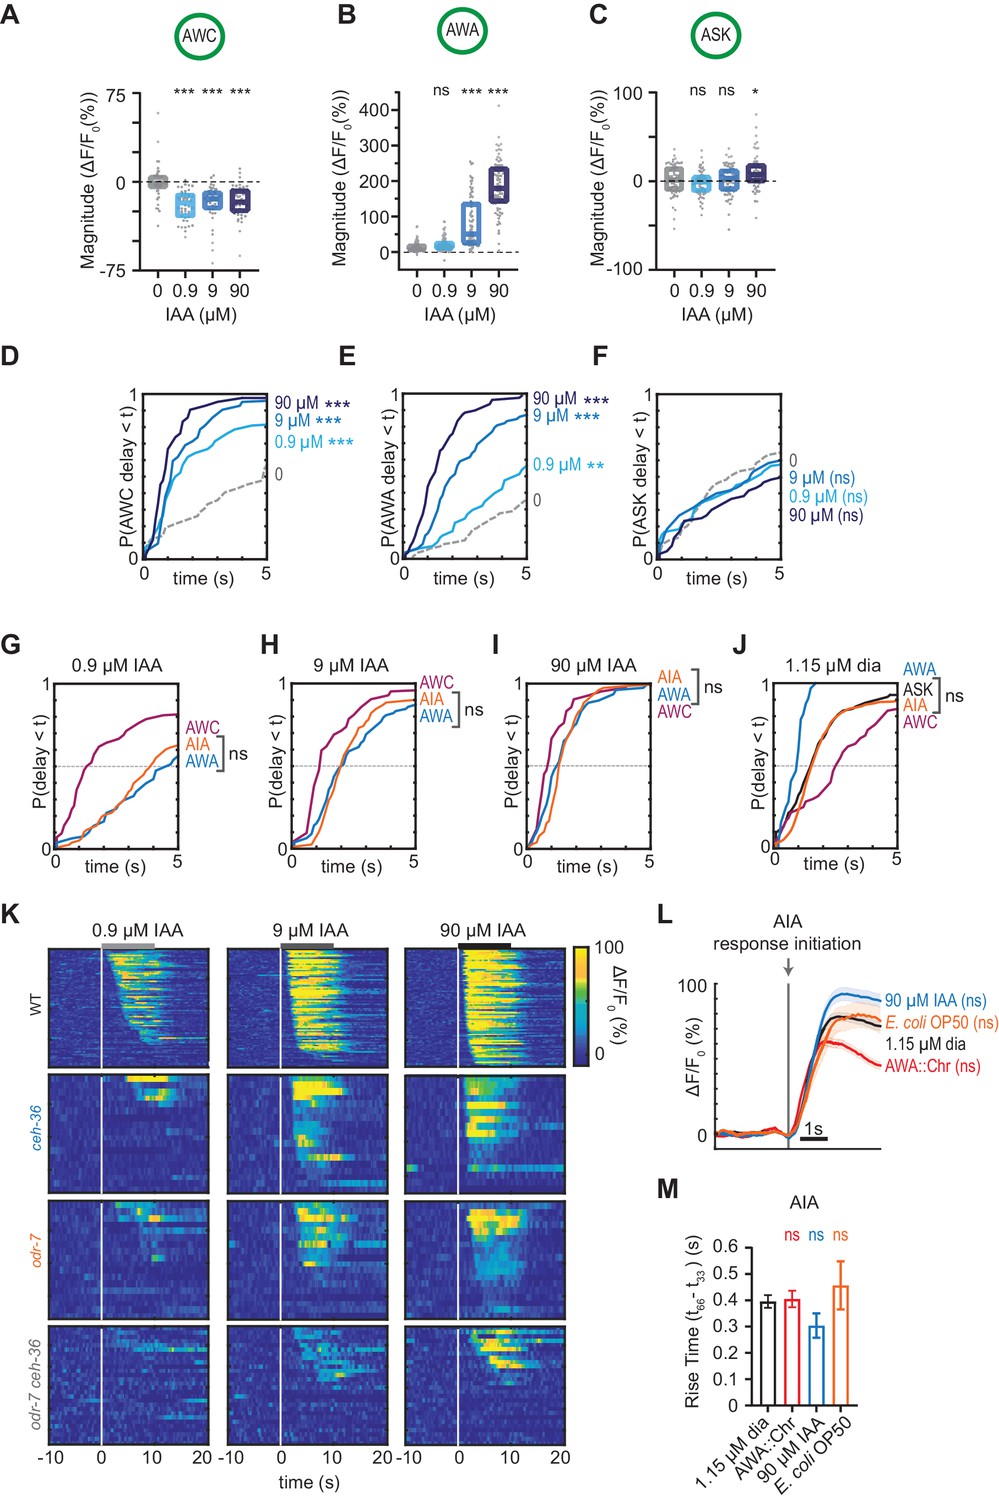
(A – C) Mean ASK (A), AWC (B), and ASE (C) responses to 10 s pulses of buffer (0) or 11.5 nM or 1.15 µM diacetyl. ASK: n = 82–115; AWC: n = 52–60; ASE: n = 42–54. Shading indicates ± SEM. (D) Mean ASE responses to 1.15 µM diacetyl in WT versus unc-18 animals (synaptic transmission mutants) and odr-10 animals (AWA diacetyl receptor mutants). ASE responses in unc-18 animals are greatly diminished. Shading indicates ± SEM. (E – G) Mean ASK (E), AWC (F), and AWA (G) responses to 10 s pulses of buffer (0), 0.9 µM, 9 µM, or 90 µM isoamyl alcohol. ASK: n = 60; AWC: n = 42; AWA: n = 78–80. Shading indicates ± SEM. (H) Summary of sensory neuron responses to various stimuli. Upward arrows indicate activation; downward arrows indicate inhibition. Arrow thickness reflects response magnitude. (I – K) Cumulative response time profiles of AIA responses to 0.9 µM (I), 9 µM (J), or 90 µM (K) isoamyl alcohol in WT versus odr-7 animals (AWA cell fate mutants), ceh-36 animals (AWC and ASE cell fate mutants), and odr-7 ceh-36 animals. (L) Cumulative response time profiles of AIA responses to 1.15 µM diacetyl, 90 µM isoamyl alcohol, and E. coli OP50 bacteria-conditioned medium. Asterisks refer to Kolmogorov-Smirnov test significance versus buffer over full 10 s stimulus pulse. ns: not significant; *: p<0.05; **: p<0.01; ***: p<0.001. See Supplementary file 2 for sample sizes and test details.
-
Figure 5—source data 1
Source data for Figure 5 and Figure 5—figure supplements 1–3.
- https://cdn.elifesciences.org/articles/50566/elife-50566-fig5-data1-v2.xlsx
Figure 5—figure supplement 1
Controls for diacetyl activation of sensory neurons.
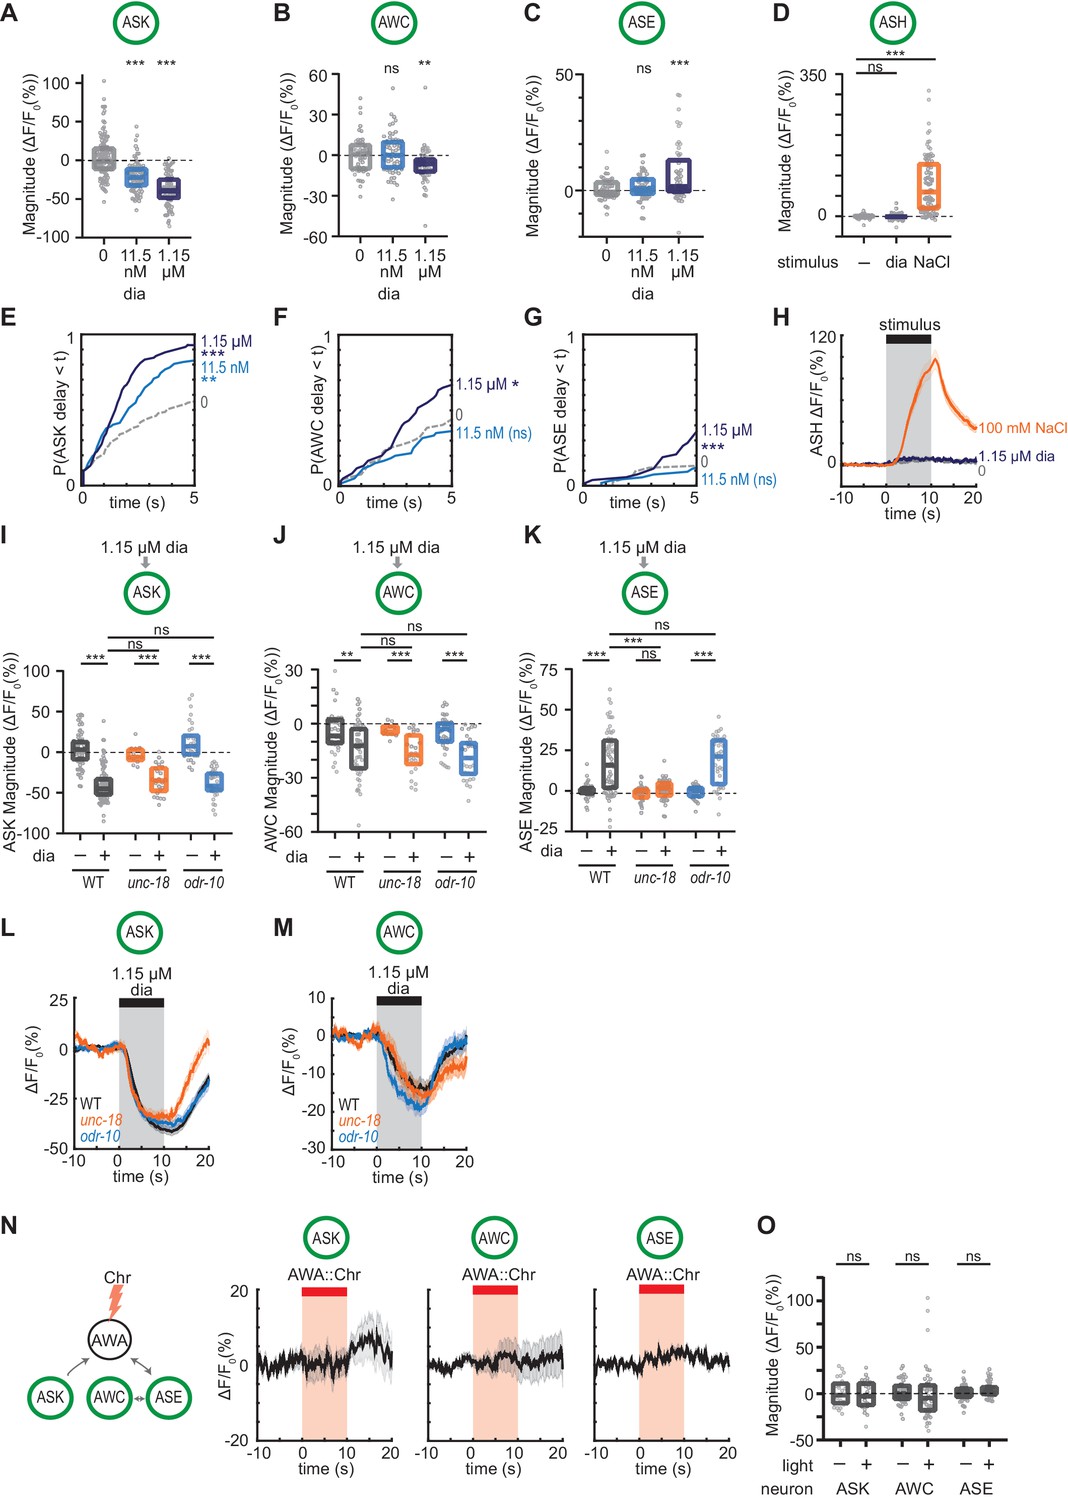
(A – C) Magnitude of individual ASK (A), AWC (B), or ASE (C) responses to buffer (0), 11.5 nM or 1.15 µM diacetyl shown in Figure 5A–C. Boxes show median and interquartile range. (D) Magnitude of individual ASH responses to buffer (0), 1.15 µM diacetyl, or 100 mM NaCl in WT animals. Boxes show median and interquartile range. (E – G) Cumulative response time profiles of responses from (A), (B), and (C). Only the first 5 s are shown. (H) Mean ASH responses to pulses of buffer (0), 1.15 µM diacetyl, or 100 mM NaCl in WT animals shown in (D). Shading indicates ± SEM. (I – K) Magnitude of individual ASK (I), AWC (J), or ASE (K) responses to pulses of 1.15 µM diacetyl in WT versus unc-18 and odr-10 animals. Boxes show median and interquartile range. (L and M) Mean ASK (L) and AWC (M) response to pulses of 1.15 µM diacetyl in WT versus unc-18 and odr-10 animals shown in (I) and (J). Shading indicates ± SEM. (N) Mean ASK, AWC, and ASE responses to pulses of AWA::Chrimson stimulation in WT animals. Shading indicates ± SEM. (O) Magnitude of individual responses in (N). Boxes show median and interquartile range. For (A), (B), (C), (D), (I), (J), and (K), asterisks refer to statistical significance of a one-way ANOVA with Dunnett’s multiple comparisons test versus buffer (A–D and I–K) or versus WT (I–K). ns: not significant; **: p<0.01; ***: p<0.001. For (O), ns refers to lack of statistical significance in paired t-tests comparing pre-light to within-light periods in same neurons. See Supplementary file 3 for sample sizes and test details. For (E), (F), and (G), asterisks refer to Kolmogorov-Smirnov test significance versus buffer over full 10 s stimulus pulse. ns: not significant; *: p<0.05; **: p<0.01; ***: p<0.001. See Supplementary file 2 for sample sizes and test details.
Figure 5—figure supplement 2
Simultaneous recording of multiple neurons.
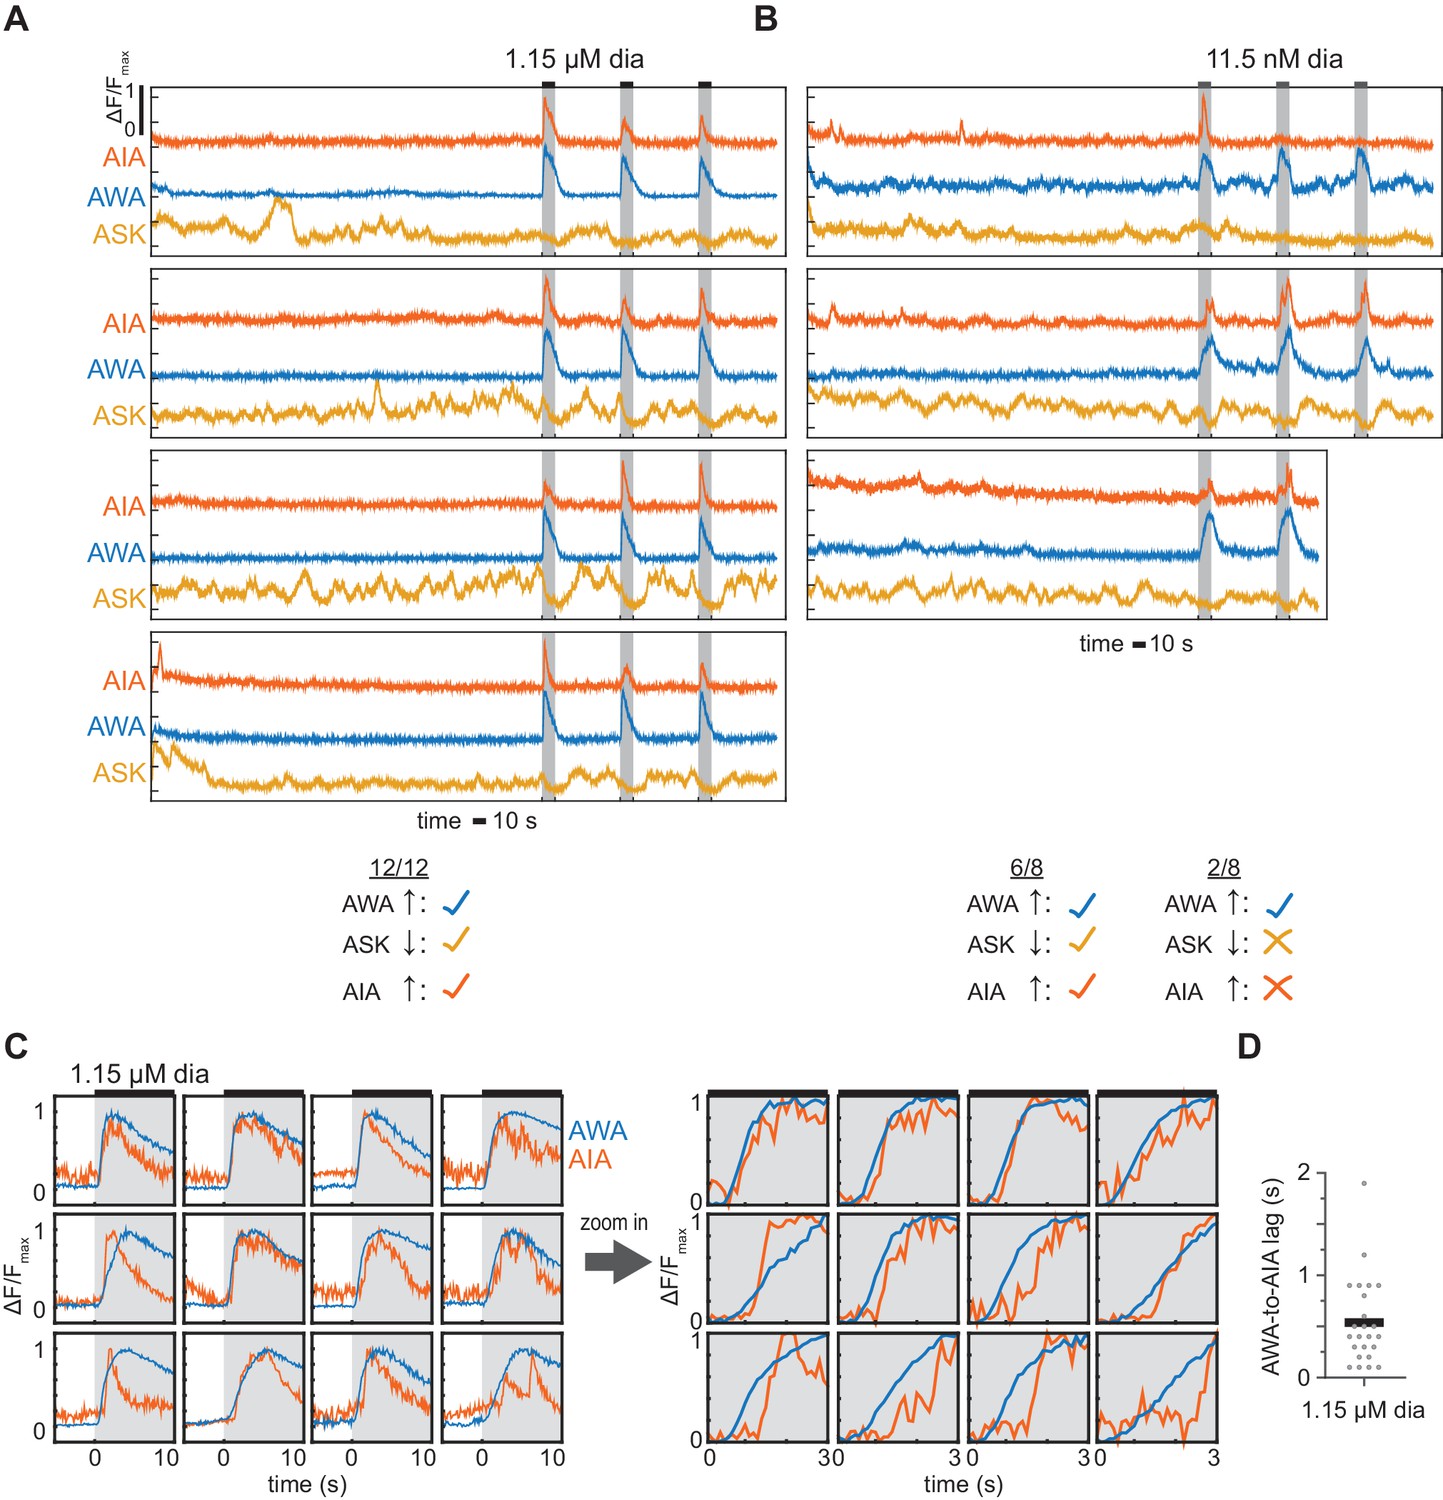
(A and B) Cytoplasmic AIA GCaMP5A and nuclear AWA GCaMP6s and ASK GCaMP6s responses to 10 s pulses of 1.15 µM (A) or 11.5 nM (B) diacetyl, with all three neurons recorded simultaneously in the same animal. AWA and ASK fluorescence were measured in the nucleus, AIA fluorescence was measured in the neurite. Two pulses at 11.5 nM did not elicit AIA or ASK responses. 1.15 µM diacetyl videos came from two animals; 11.5 nM diacetyl videos came from two animals. Note spontaneous ongoing activity in ASK sensory neurons, which can contribute to spontaneous AIA activity (López-Cruz et al., 2019), and may also contribute to AIA responses to weak stimuli. (C) AIA GCaMP5A and AWA GCaMP6s responses to 10 s pulses of 1.15 µM diacetyl, ordered by AWA-to-AIA lag. Right: same responses, zoomed in and re-scaled to capture response initiations. n = 12 pulses from six animals. (D) Delay between AWA and AIA neuron response initiations to 1.15 µM diacetyl pulses, measured by eye for 12 pulses shown in (A) and the 12 pulses shown in (C). Bar indicates mean. In all cases, AWA response initiated before the AIA response.
-
Figure 5—figure supplement 2—source data 1
Source data for Figure 5—figure supplement 2.
- https://cdn.elifesciences.org/articles/50566/elife-50566-fig5-figsupp2-data1-v2.xlsx
Figure 5—figure supplement 3
Controls and heat maps for isoamyl alcohol stimulation.
(A – C) Magnitude of individual AWC (A), AWA (B), and ASK (C) responses to buffer (0), 0.9 µM, 9 µM, and 9 µM isoamyl alcohol shown in Figure 5E–G. Boxes show median and interquartile range. (D – F) Cumulative response time profiles of responses from (A), (B), and (C). Only the first 5 s are shown. (G – J) Cumulative response time profiles of AWC, AWA, AIA, and ASK (for J only) responses to 0.9 µM (G), 9 µM (H), or 90 µM (I) isoamyl alcohol, or 1.15 µM diacetyl (J) in WT animals. (K) Heat maps of AIA responses to 0.9, 9, or 90 µM isoamyl alcohol in WT versus odr-7 animals (AWA cell fate mutants), ceh-36 animals (AWC and ASE cell fate mutants), and odr-7 ceh-36 animals, shown in Figure 5I–K. (L) Mean AIA responses to 1.15 µM diacetyl, 90 µM isoamyl alcohol, AWA::Chrimson, and E. coli OP50 bacteria-conditioned medium from Figure 5L that initiated within 5 s of stimulus, aligned to the beginning of AIA activation rather than stimulus time. Shading indicates ± SEM. 1.15 µM diacetyl: n = 390; 90 µM isoamyl alcohol: n = 76; AWA::Chrimson: n = 260; OP50: n = 37. (M) Rise time of responses from (M). Bars indicate ± SEM. For (A), (B), (C), (L), and (M) asterisks refer to statistical significance of a one-way ANOVA with Dunnett’s multiple comparisons test versus buffer magnitude (A–C), versus 1.15 µM diacetyl magnitude (L), or versus 1.15 µM diacetyl rise time (M). ns: not significant; *: p<0.05; ***: p<0.001. See Supplementary file 3 (A–C and L) or Supplementary file 4 (M) for sample sizes and test details. For (D–J), asterisks refer to statistical significance of a Kolmogorov-Smirnov test versus buffer (D–F), between AWA and AIA (G–I), or between ASK and AIA (J), over full 10 s stimulus pulse. ns: not significant; *: p<0.05; **: p<0.01; ***: p<0.001. See Supplementary file 2 for sample sizes and test details.
Figure 6 with 1 supplement
AIA neurons are bistable and act as a nonlinear AND-gate.
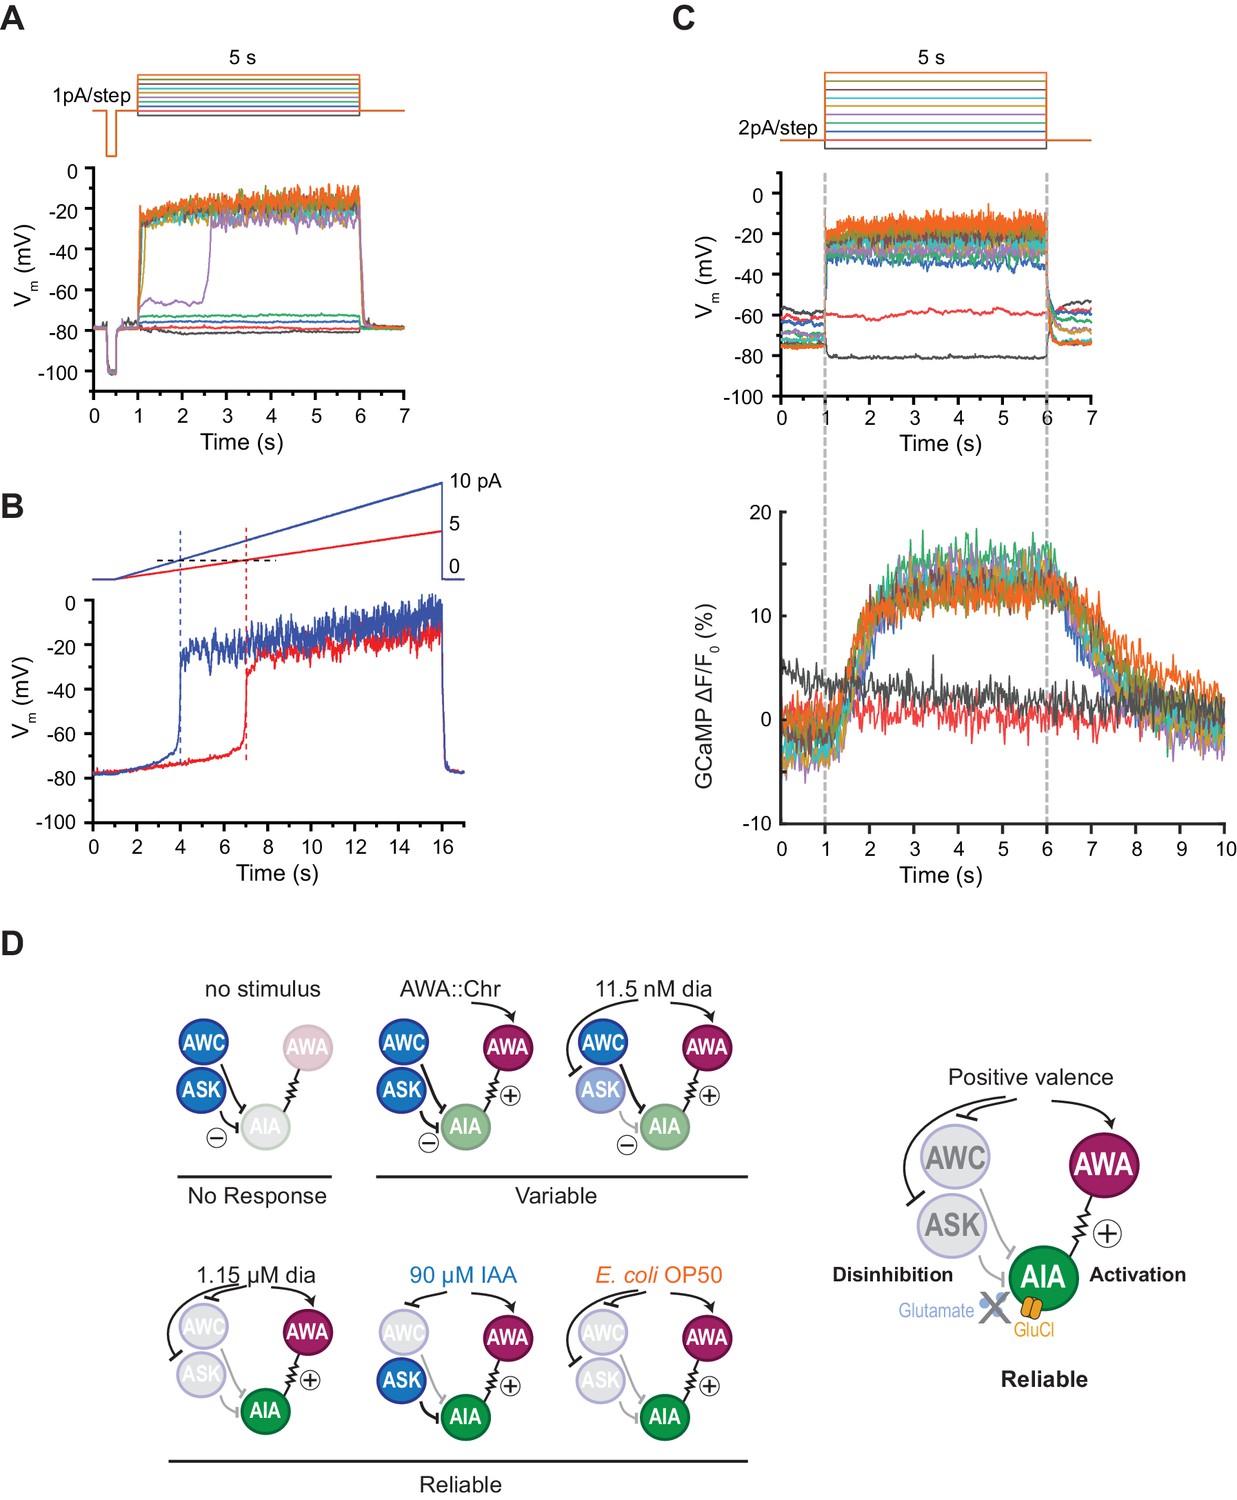
(A) Representative example of membrane potential dynamics induced by current injection steps in current-clamped AIA neurons (n=45 AIA neurons recorded, all showing bimodal dynamics). Top, current injection protocol: a series of 5 s square pulses starting at −1 pA and increasing to 8 pA in 1 pA increments. Current injections between −1 and 2 pA had little effect on membrane potential (Vm), while the 3 pA step and all larger steps thereafter depolarized Vm from the resting Vm around −80 mV to a stable state of higher voltage around −20 mV. (B) Representative membrane potential dynamics (2 AIA neurons recorded) induced by current injection ramps at different slopes in AIA. Top, current injection protocol: two 15 s long ramping current injections from 0 pA to 5 pA (red) or 10 pA (blue) before returning to 0 pA, recorded from the same cell. AIA Vm is abruptly depolarized from around −80 mV to −20 mV when the current injection ramps reaches the same threshold around 2 pA. (C) Representative example of simultaneous membrane potential recording (upper traces) and calcium imaging in the AIA neurite (lower traces). Top, current injection protocol: a series of 5 s square pulses starting at −2 pA and increasing to 16 pA in 2 pA increments. Both membrane potential and GCaMP signals show bimodal all-or-none dynamics. (D) Summary of sensory neuron and AIA responses to various stimuli, and a model for how AIA uses AND-gate logic to integrate sensory information. In the absence of food odor, glutamatergic sensory neurons release glutamate and activate glutamate-gated chloride channels on AIA, preventing AWA from activating AIA. In the presence of food odor, AWA is activated, glutamatergic sensory neurons are inhibited, and AIA is disinhibited and more sensitive to AWA depolarization, resulting in reliable activation. Weak odor or optogenetic stimuli engage a subset of sensory neurons, resulting in a variable and delayed response in AIA. With respect to the delay, full conditions for the AIA AND-gate may be met when weak stimuli coincide with spontaneous sensory neuron activity (López-Cruz et al., 2019; Figure 5—figure supplement 2).
-
Figure 6—source data 1
Source data for Figure 6A–B and figure supplement.
- https://cdn.elifesciences.org/articles/50566/elife-50566-fig6-data1-v2.zip
-
Figure 6—source data 2
Source data for Figure 6C.
- https://cdn.elifesciences.org/articles/50566/elife-50566-fig6-data2-v2.xlsx
Figure 6—figure supplement 1

Current-voltage relationship in AIA.
(A) Representative example of whole-cell current traces induced by a series of voltage steps in voltage-clamped AIA neuron. Top, voltage step protocol: a series of 0.5 s square steps starting at −120 mV and increasing to 50 mV in 10 mV increments. The holding potential was set at −60 mV before and after applying each voltage step. (B) Current-voltage (I–V) relationship obtained from averaged voltage-clamp recordings in AIA. Black squares: peak currents measured by the absolute maximum amplitude of currents within the first 100 ms of each voltage step. Blue triangles: steady-state currents measured by the averaged current amplitudes of the final 50 ms of each voltage steps. N = 25 AIA neurons, error bars represent SEM.
Tables
Key resources table
| Reagent type (species) or resource | Designation | Source or reference | Identifiers | Additional information |
|---|---|---|---|---|
| Strain, strain background (Caenorhabditis elegans N2, hermaphrodite) | AWA::GCaMP2.2b | DOI: 10.1016/j.celrep.2015.08.032 | ID_BargmannDatabase:CX14647 | See Figure 1, Figure 1—figure supplements 1, Figure 3, Figure 5—figure supplement 3 |
| Strain, strain background (C. elegans N2, hermaphrodite) | AWA::Chrimson; AWA::GCaMP2.2b | DOI: 10.1016/j.celrep.2015.08.032 | ID_BargmannDatabase:CX16573 | See Figure 1, Figure 1—figure supplements 1, 3, Figure 3, Figure 3—figure supplement 1 |
| Strain, strain background (C. elegans N2, hermaphrodite) | AIA::GCaMP5A | DOI: 10.1016/j.celrep.2015.08.032 | ID_BargmannDatabase:CX15257 | See Figure 1, Figure 1—figure supplements 2, 3, Figure 3—figure supplement 1, Figure 5, Figure 4—figure supplements 2, Figure 5—figure supplement 3, Figure 6, Figure 6—figure supplement 1 |
| Strain, strain background (C. elegans N2, hermaphrodite) | AWA::Chrimson; AIA::GCaMP5A | DOI: 10.1016/j.celrep.2015.08.032 | ID_BargmannDatabase:CX16561 | See Figure 1, Figure 1—figure supplements 2, 3, Figure 2—figure supplement 1, Figure 3, Figure 3—figure supplement 1, Figure 4, Figure 4—figure supplements 1, 2, Figure 5—figure supplement 3 |
| Strain, strain background (C. elegans N2, hermaphrodite) | odr-7; AIA::GCaMP5A | DOI: 10.1016/j.celrep.2015.08.032 | ID_BargmannDatabase:CX16171 | See Figure 2, Figure 5, Figure 4—figure supplement 2, Figure 5—figure supplement 3 |
| Strain, strain background (C. elegans N2, hermaphrodite) | odr-10; AIA::GCaMP5A | DOI: 10.1016/j.celrep.2015.08.032 | ID_BargmannDatabase:CX16170 | See Figure 2, Figure 4—figure supplement 2 |
| Strain, strain background (C. elegans N2, hermaphrodite) | AWA::TeTx; AIA::GCaMP5A | this paper | ID_BargmannDatabase:CX16584 | See Figure 2, Figure 4—figure supplement 2 |
| Strain, strain background (C. elegans N2, hermaphrodite) | AWA::TeTx; AWA::Chrimson; AIA::GCaMP5A | this paper | ID_BargmannDatabase:CX17519 | See Figure 2—figure supplement 1, Figure 4—figure supplement 2 |
| Strain, strain background (C. elegans N2, hermaphrodite) | unc-7(e5); AIA::GCaMP5A | this paper | ID_Bargmann Database:CX18039 | See Figure 2, Figure 4—figure supplement 2 |
| Strain, strain background (C. elegans N2, hermaphrodite) | unc-9(fc16); AIA::GCaMP5A | this paper | ID_BargmannDatabase:CX16980 | See Figure 2 |
| Strain, strain background (C. elegans N2, hermaphrodite) | unc-9 unc-7; AIA::GCaMP5A | this paper | ID_BargmannDatabase:CX16979 | See Figure 2, Figure 2—figure supplement 1, Figure 4—figure supplement 2 |
| Strain, strain background (C. elegans N2, hermaphrodite) | unc-9 unc-7; AWA,AIA::unc-9(-); AIA::GCaMP5A | this paper | ID_Bargmann Database:CX18040 | See Figure 2, Figure 2—figure supplement 1, Figure 4—figure supplement 2 |
| Strain, strain background (C. elegans N2, hermaphrodite) | unc-9 unc-7; AWA,AIA::unc-9(+); AIA::GCaMP5A | this paper | ID_Bargmann Database:CX18041 | See Figure 2, Figure 2—figure supplement 1, Figure 4—figure supplement 2 |
| Strain, strain background (C. elegans N2, hermaphrodite) | unc-7 unc-9; AWA::Chrimson; AIA::GCaMP5A | this paper | ID_BargmannDatabase:CX17320 | See Figure 2, Figure 5—figure supplement 3 |
| Strain, strain background (C. elegans N2, hermaphrodite) | AIA::Chrimson; AIA::GCaMP5A | this paper | ID_BargmannDatabase:CX17432 | See Figure 2, Figure 2—figure supplement 1 |
| Strain, strain background (C. elegans N2, hermaphrodite) | unc-7 unc-9; AIA::Chrimson; AIA::GCaMP5A | this paper | ID_BargmannDatabase:CX17895 | See Figure 2 |
| Strain, strain background (C. elegans N2, hermaphrodite) | AIA::Chrimson; AWA::GCaMP2.2b | this paper | ID_BargmannDatabase:CX17464 | See Figure 2, Figure 2—figure supplement 1 |
| Strain, strain background (C. elegans N2, hermaphrodite) | unc-7 unc-9; AIA::Chrimson; AWA::GCaMP2.2b | this paper | ID_BargmannDatabase:CX17897 | See Figure 2 |
| Strain, strain background (C. elegans N2, hermaphrodite) | unc-18; AIA::Chrimson; AIA::GCaMP5A | this paper | ID_BargmannDatabase:CX17584 | See Figure 2—figure supplement 1 |
| Strain, strain background (C. elegans N2, hermaphrodite) | unc-18; AIA::Chrimson; AWA::GCaMP2.2b | this paper | ID_BargmannDatabase:CX17640 | See Figure 2—figure supplement 1 |
| Strain, strain background (C. elegans N2, hermaphrodite) | unc-13; AIA::GCaMP5A | this paper | ID_BargmannDatabase:CX16591 | See Figure 3, Figure 3—figure supplement 1, Figure 4—figure supplement 2 |
| Strain, strain background (C. elegans N2, hermaphrodite) | unc-18(e234); AIA::GCaMP5A | this paper | ID_BargmannDatabase:CX16412 | See Figure 3, Figure 3—figure supplement 1, Figure 4—figure supplement 2 |
| Strain, strain background (C. elegans N2, hermaphrodite) | unc-13; AWA::Chrimson; AIA::GCaMP5A | this paper | ID_BargmannDatabase:CX16592 | See Figure 3, Figure 4—figure supplement 2 |
| Strain, strain background (C. elegans N2, hermaphrodite) | unc-18(e234); AWA::Chrimson; AIA::GCaMP5A | this paper | ID_BargmannDatabase:CX17158 | See Figure 3, Figure 3—figure supplement 1, Figure 4, Figure 4—figure supplement 2 |
| Strain, strain background (C. elegans N2, hermaphrodite) | unc-18(e81); AWA::Chrimson; AIA::GCaMP5A | this paper | ID_BargmannDatabase:CX17640 | See Figure 3, Figure 3—figure supplement 1, Figure 4, Figure 4—figure supplement 2 |
| Strain, strain background (C. elegans N2, hermaphrodite) | unc-13; AWA::Chrimson; AWA::GCaMP2.2b | this paper | ID_BargmannDatabase:CX17213 | See Figure 3, Figure 3—figure supplement 1 |
| Strain, strain background (C. elegans N2, hermaphrodite) | unc-31; AWA::Chrimson; AIA::GCaMP5A | this paper | ID_BargmannDatabase:CX17319 | See Figure 3—figure supplement 1 |
| Strain, strain background (C. elegans N2, hermaphrodite) | eat-4-FRT; AWA::Chrimson; AIA::GCaMP5A | this paper | ID_BargmannDatabase:CX17714 | See Figure 4, Figure 4—figure supplement 1, Figure 4—figure supplement 2 |
| Strain, strain background (C. elegans N2, hermaphrodite) | eat-4-FRT; AWC,ASE,ASK,ASG::nFlippase; AWA::Chrimson; AIA::GCaMP5A | this paper | ID_BargmannDatabase:CX17679 | See Figure 4, Figure 4—figure supplement 1, Figure 4—figure supplement 2 |
| Strain, strain background (C. elegans N2, hermaphrodite) | eat-4-FRT; ASK::nFlippase; AWA::Chrimson; AIA::GCaMP5A | this paper | ID_BargmannDatabase:CX17722 | See Figure 4, Figure 4—figure supplement 1, Figure 4—figure supplement 2 |
| Strain, strain background (C. elegans N2, hermaphrodite) | eat-4-FRT; ASG::nFlippase; AWA::Chrimson; AIA::GCaMP5A | this paper | ID_BargmannDatabase:CX17892 | See Figure 4, Figure 4—figure supplement 1, Figure 4—figure supplement 2 |
| Strain, strain background (C. elegans N2, hermaphrodite) | eat-4-FRT; AWC::nFlippase; AWA::Chrimson; AIA::GCaMP5A | this paper | ID_BargmannDatabase:CX17611 | See Figure 4, Figure 4—figure supplement 1, Figure 4—figure supplement 2 |
| Strain, strain background (C. elegans N2, hermaphrodite) | eat-4-FRT; AWC,ASE::nFlippase; AWA::Chrimson; AIA::GCaMP5A | this paper | ID_BargmannDatabase:CX17723 | See Figure 4, Figure 4—figure supplement 1, Figure 4—figure supplement 2 |
| Strain, strain background (C. elegans N2, hermaphrodite) | che-1; AWA::Chrimson; AIA::GCaMP5A | this paper | ID_BargmannDatabase:CX17678 | See Figure 4, Figure 4—figure supplement 1 |
| Strain, strain background (C. elegans N2, hermaphrodite) | AWC,ASE,ASK,ASG::nFlippase; AWA::Chrimson; AIA::GCaMP5A | this paper | ID_BargmannDatabase:CX17866 | See Figure 4, Figure 4—figure supplement 1, Figure 4—figure supplement 2 |
| Strain, strain background (C. elegans N2, hermaphrodite) | unc-18; AWC,ASE::unc-18(+); AWA::Chrimson; AIA::GCaMP5A (line A) | this paper | ID_BargmannDatabase:CX17675 | See Figure 4, Figure 4—figure supplement 1 |
| Strain, strain background (C. elegans N2, hermaphrodite) | unc-18; AWC,ASE::unc-18(+); AWA::Chrimson; AIA::GCaMP5A (line B) | this paper | ID_BargmannDatabase:CX17676 | See Figure 4, Figure 4—figure supplement 1 |
| Strain, strain background (C. elegans N2, hermaphrodite) | unc-18; AWC,ASE::unc-18(-); AWA::Chrimson; AIA::GCaMP5A | this paper | ID_BargmannDatabase:CX17677 | See Figure 4, Figure 4—figure supplement 1 |
| Strain, strain background (C. elegans N2, hermaphrodite) | ASK::GCaMP5A | DOI: 10.1016/j.neuron.2019.01.053 | ID_BargmannDatabase:CX17590 | See Figure 5, Figure 5—figure supplement 1, Figure 5—figure supplement 3 |
| Strain, strain background (C. elegans N2, hermaphrodite) | unc-18; ASK::GCaMP5A | this paper | ID_BargmannDatabase:CX17724 | See Figure 5—figure supplement 1 |
| Strain, strain background (C. elegans N2, hermaphrodite) | odr-10; ASK::GCaMP5A | this paper | ID_BargmannDatabase:CX17867 | See Figure 5—figure supplement 1 |
| Strain, strain background (C. elegans N2, hermaphrodite) | AWC::GCaMP5A | this paper | ID_BargmannDatabase:CX17520 | See Figure 5, Figure 5—figure supplement 1, Figure 5—figure supplement 3 |
| Strain, strain background (C. elegans N2, hermaphrodite) | unc-18; AWC::GCaMP5A | this paper | ID_BargmannDatabase:CX17636 | See Figure 5—figure supplement 1 |
| Strain, strain background (C. elegans N2, hermaphrodite) | odr-10; AWC::GCaMP5A | this paper | ID_BargmannDatabase:CX17606 | See Figure 5—figure supplement 1 |
| Strain, strain background (C. elegans N2, hermaphrodite) | ASE::GCaMP3 | this paper | ID_BargmannDatabase:CX14571 | See Figure 5, Figure 5—figure supplement 1 |
| Strain, strain background (C. elegans N2, hermaphrodite) | unc-18; ASE::GCaMP3 | this paper | ID_BargmannDatabase:CX17638 | See Figure 5, Figure 5—figure supplement 1 |
| Strain, strain background (C. elegans N2, hermaphrodite) | odr-10; ASE::GCaMP3 | this paper | ID_BargmannDatabase:CX16497 | See Figure 5, Figure 5—figure supplement 1 |
| Strain, strain background (C. elegans N2, hermaphrodite) | ASH::GCaMP3 | DOI: 10.1016/j.neuron.2013.11.020 | ID_BargmannDatabase:CX10979 | See Figure 5—figure supplement 1 |
| Strain, strain background (C. elegans N2, hermaphrodite) | AWA::Chrimson; ASK::GCaMP5A | this paper | ID_BargmannDatabase:CX17751 | See Figure 5—figure supplement 1 |
| Strain, strain background (C. elegans N2, hermaphrodite) | AWA::Chrimson; AWC::GCaMP5A | this paper | ID_BargmannDatabase:CX17521 | See Figure 5—figure supplement 1 |
| Strain, strain background (C. elegans N2, hermaphrodite) | AWA::Chrimson; ASE::GCaMP3 | this paper | ID_BargmannDatabase:CX17392 | See Figure 5—figure supplement 1 |
| Strain, strain background (C. elegans N2, hermaphrodite) | ceh-36; AIA::GCaMP5A | DOI: 10.1016/j.celrep.2015.08.032 | ID_BargmannDatabase:CX16169 | See Figure 5, Figure 5—figure supplement 3 |
| Strain, strain background (C. elegans N2, hermaphrodite) | odr-7 ceh-36; AIA::GCaMP5A | DOI:10.1016/j.celrep.2015.08.032 | See Figure 5, Figure 5—figure supplement 3 | |
| Strain, strain background (C. elegans N2, hermaphrodite) | ASK,AWA::GCaMP6s; AIA::GCaMP5A | this paper | ID_BargmannDatabase:CX18038 | See Figure 5—figure supplement 2 |
| Strain, strain background (C. elegans N2, hermaphrodite) | AIA::GFP | this paper | ID_BargmannDatabase:CX8293 | See Figure 6, Figure 6—figure supplement 1 |
| Strain, strain background (C. elegans N2, hermaphrodite) | AIA::GCaMP5A | this paper | ID_BargmannDatabase:CX16976 | See Figure 6, Figure 6—figure supplement 1 |
| Chemical compound, drug | (-)-tetramisole hydrochloride | Sigma | L9756 | CAS 16595-80-5 |
| Chemical compound, drug | Polydimethylsiloxane (PDMS) | Sigma | 761036 | 9:1 base:curing agent, Sylgard 184 |
| Software, algorithm | ImageJ | ImageJ (http://imagej.nih.gov/ij/) | RRID:SCR_003070 | Version 1.52a |
| Software, algorithm | GraphPad Prism | GraphPad Prism (https://graphpad.com) | RRID:SCR_002798 | Version 8 |
| Software, algorithm | Matlab | MathWorks (https://www.mathworks.com/) | RRID:SCR_001622 | Versions R2013b and R2015a |
| Software, algorithm | Metamorph | Molecular Devices (https://www.moleculardevices.com) | RRID:SCR_002368 | Versions 7.7.6 and 7.7.8 |
| Software, algrorithm | analysis code | this paper | See Source code 1 |
Additional files
-
Source code 1
Source code for data analysis.
- https://cdn.elifesciences.org/articles/50566/elife-50566-code1-v2.m
-
Supplementary file 1
Presynaptic partners of AIA.
Both Chen et al. (2006) and Cook et al. (2019) are based on same collection of serial-section electron micrographs from White et al. (1986). Neurotransmitter information is based on Pereira et al. (2015).
- https://cdn.elifesciences.org/articles/50566/elife-50566-supp1-v2.docx
-
Supplementary file 2
Cumulative response time profiles.
Kolmogorov-Smirnov test statistics and sample sizes for all cumulative response time profiles presented, calculated for full 10 s stimulus pulse. Italics indicate non-WT genetic backgrounds. D test represents the maximum effect size across the distributions. p-values below 0.05 are bolded for emphasis.
- https://cdn.elifesciences.org/articles/50566/elife-50566-supp2-v2.docx
-
Supplementary file 3
Calcium response magnitude comparisons.
Magnitudes of responses to various stimuli, with either an unpaired t-test (if the number of comparisons is one) or an ordinary one-way ANOVA with Dunnett’s multiple comparisons test (if the number of comparisons exceeds one); * indicates paired t-test. Bolded genotype or stimulus indicates the control group used for comparisons. Italics indicate non-wildtype genetic background. p-values below 0.05 are bolded for emphasis.
- https://cdn.elifesciences.org/articles/50566/elife-50566-supp3-v2.docx
-
Supplementary file 4
Calcium rise time comparisons.
Rise times (t66-t33) of responses to various stimuli, with either an ordinary one-way ANOVA with Dunnett’s multiple comparisons test. Bolded genotype or stimulus indicates the control group used for comparisons. Italics indicate non-wildtype genetic background.
- https://cdn.elifesciences.org/articles/50566/elife-50566-supp4-v2.docx
-
Supplementary file 5
Strain list.
- https://cdn.elifesciences.org/articles/50566/elife-50566-supp5-v2.docx
-
Transparent reporting form
- https://cdn.elifesciences.org/articles/50566/elife-50566-transrepform-v2.docx
Download links
A two-part list of links to download the article, or parts of the article, in various formats.
Downloads (link to download the article as PDF)
Open citations (links to open the citations from this article in various online reference manager services)
Cite this article (links to download the citations from this article in formats compatible with various reference manager tools)
Reliability of an interneuron response depends on an integrated sensory state
eLife 8:e50566.
https://doi.org/10.7554/eLife.50566


