A Fyn biosensor reveals pulsatile, spatially localized kinase activity and signaling crosstalk in live mammalian cells
- Institute for Stem Cell Science and Regenerative Medicine, India
- SASTRA University, India
- National Centre for Biological Sciences, India
- North Carolina State University, United States
Figures
Figure 1 with 3 supplements

High-throughput screening yields a new protein binder for generating a specific biosensor for active Fyn.
(A) Rationale for a biosensor targeting active conformation of SFK, Fyn. A cartoon depicts how activation of Fyn kinase leads to a more open conformation and buried regions (including its SH3 domain) becoming more accessible for biosensor binding. Inactive (left) SFKs are held in a closed conformation through two key intramolecular interactions (for instance see Cell, 2001, 105, 115–12) that are lost in the open state (right). (B) Schematic diagram representing sensing of active and open state of kinase by an active state sensor. (C) High-throughput combinatorial library screening yields a protein binder specific for Fyn SH3 domain. Analysis of the yeast clone ‘F29’ using fluorescence activated cell sorting (FACS) shows F29 preferentially binds Fyn while showing little or no binding to SH3 domains of ubiquitously expressed SFKs, c-Src and Yes (1 µM each). Here, fluorescence signal due to biotin-labeled target SH3 (Streptavidin-PE) is plotted against signal due to yeast cells expressing the c-myc-tagged Sso7d scaffold (Alexa 633 labeled anti-c-myc). Detection of fluorescence signal due to Fyn-SH3 along with anti-c-myc fluorescence in a single yeast cell, indicates expression of full-length F29 fusion-protein and binding to labeled Fyn-SH3 target (also see Figure 1—figure supplement 2). (D) Comparison of amino acid sequences of new binder F29 with original Sso7d scaffold. 10 Sso7d residues randomized for library generation are shown in bold while corresponding new residues in binder F29 are shown in blue. (E) Binder F29 is able to recognize Fyn SH3 outside the context of yeast surface with recombinantly expressed and purified F29 showing saturable binding to Fyn SH3. Immunoblot showing pull-down of His-tagged Fyn or Src SH3 domains (75 nM to 1.25 µM) using GST-F29 fusion protein immobilized as bait on glutathione sepharose beads. His-tagged SH3 protein detected via anti-6X-His antibody (also see Figure 1—figure supplement 3). (F) Amount of bound Fyn SH3 plotted against total input Fyn SH3. The data from three independent binding experiments (n = 3) was plotted and fitted assuming 1:1 binding using a GraphPad Prism module. The apparent KD values were calculated using Equation 1 (refer Materials and methods). Values are mean ± s.e.m.
-
Figure 1—source data 1
Analysis of F29 binding to Fyn-SH3.
- https://cdn.elifesciences.org/articles/50571/elife-50571-fig1-data1-v1.xlsx
Figure 1—figure supplement 1
Combinatorial library screening for a Fyn specific binder using yeast surface display of Sso7d variants.
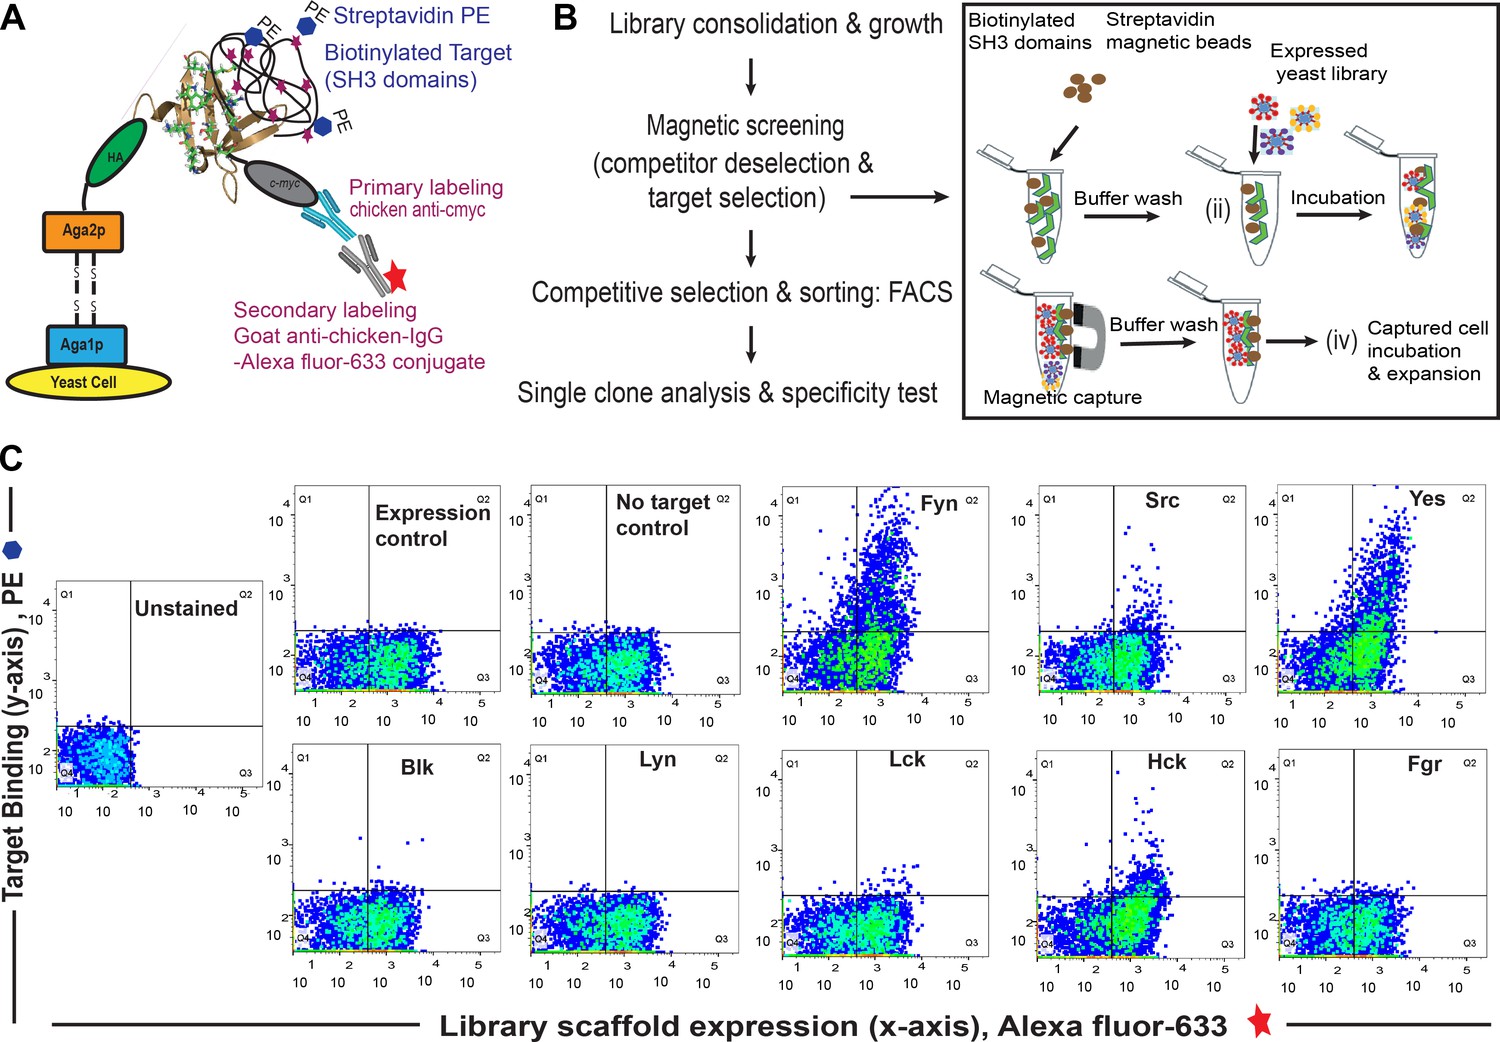
(A) Schematic of yeast surface display platform. Briefly, a combinatorial library based on Sso7d scaffold (obtained by random mutagenesis of surface residues; Methods, 2013, 60, 15–26) was cloned in a yeast display vector. In this vector, Sso7d variants are flanked by HA tag and c-myc tag. Upon galactose induction, the Sso7d scaffold is expressed on the yeast surface as a fusion complex of Aga1p and Aga2p proteins along with HA and c-myc tags making it accessible for interaction with biotinylated target. The interaction of target and scaffold can be detected using immunofluorescence with Strep–PE (to detect biotinylated target) and a secondary antibody conjugated Alexa-Fluor 633 (for anti-c-myc antibody). The Alexa-Fluor 633 fluorescence corresponds to the full-length scaffold being expressed on the yeast cell surface, while the PE fluorescence intensity corresponds to the target SH3 domain presence. These features enable fluorescence assisted flow cytometer-based sorting of heterogeneous yeast cells (displaying variants of Sso7d scaffold) sensitive to target binding events. The figure is based on earlier reports (Methods in Molecular Biology, 2015, 1319, 155–175; Methods, 2013, 60, 15–26) (B) Work flow for binder screening (see Materials and methods information for details). (C) FACS dot plot showing quantitative analysis of a pool of yeast cells obtained after magnetic selection and multiple rounds of FACS by flow cytometry to assess binding SH3 domains (1 µM) from Src family of kinases. Data show binding of yeast clones to Fyn. Binding of some yeast cells is also detected for Yes and Hck; this is clarified further through single clone analysis (see Figure 1 and Figure 1—figure supplement 2). ‘Expression control’ refers to yeast cells labeled with chicken anti-c-myc primary antibody and goat anti-chicken-IgG-Alexa Fluor 633 conjugate as secondary antibody. This control (antibody staining and subsequent FACS) confirms expression of the fusion protein containing Sso7d scaffold with a c-myc tag for detection. ‘No target control’ has been used to determine the specificity of Streptavidin-PE being used to label the target (i.e. biotinylated SH3 domains).
Figure 1—figure supplement 2
Screening yields new binder F29 that is highly specific for Fyn SH3.
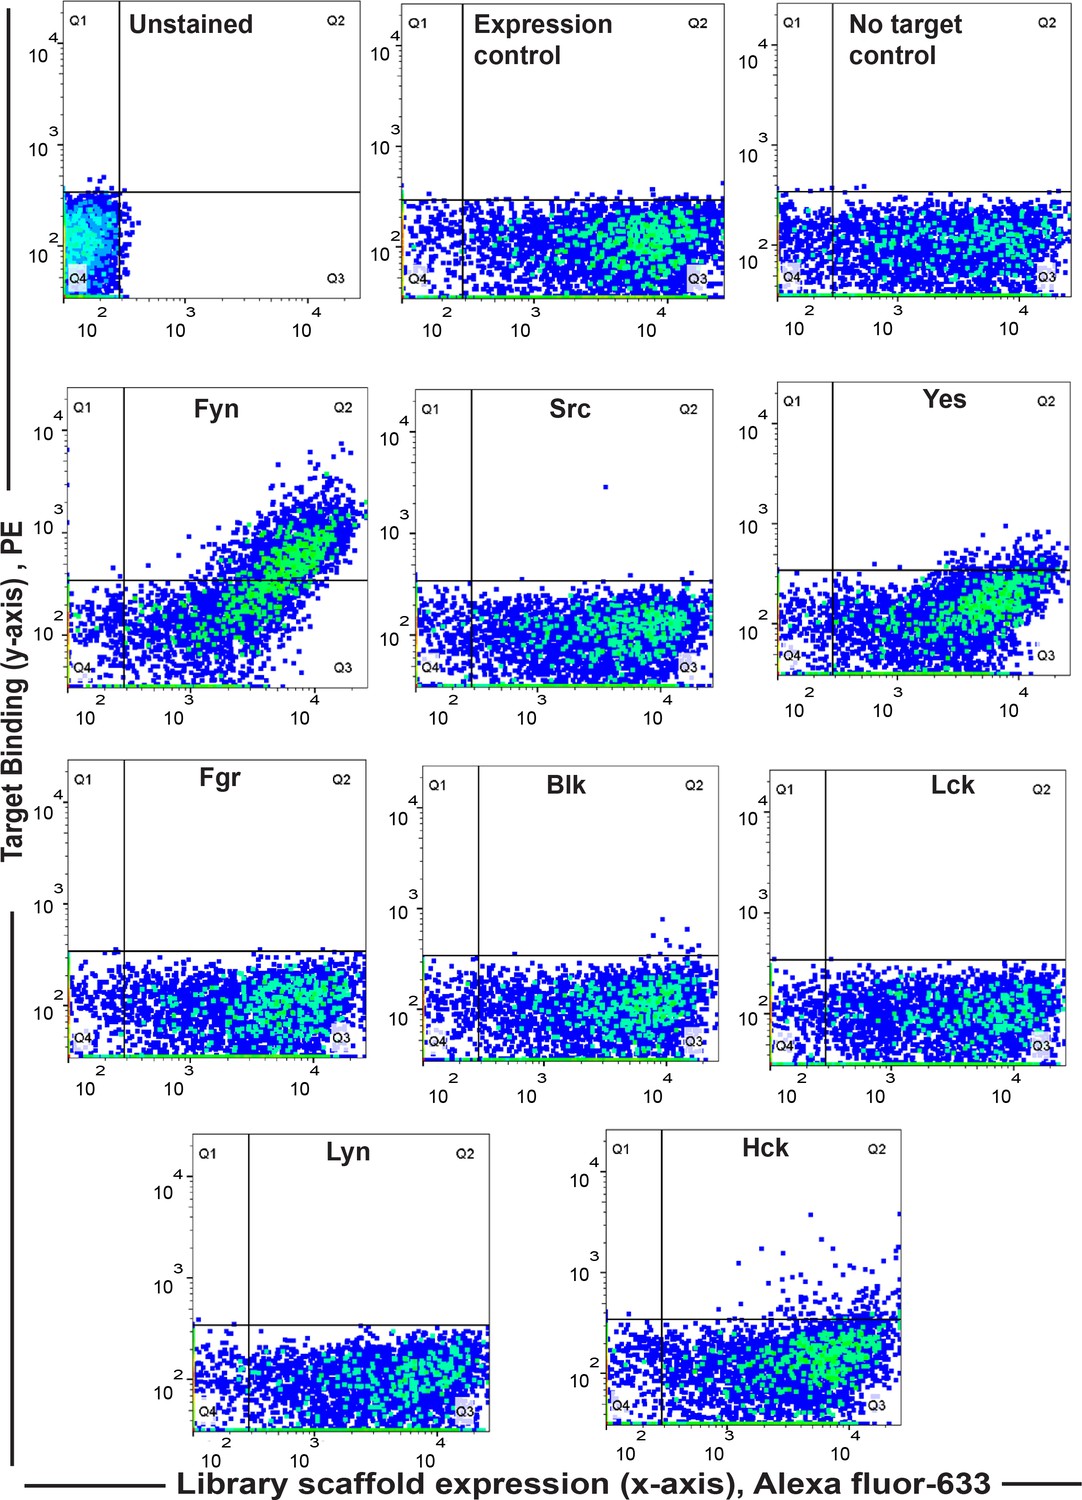
Specificity analysis of the yeast clone ‘F29’ using FACS against SH3 domains of all the Src family of kinases (1 µM) shows F29 preferentially binds Fyn. In all the graphs, fluorescence signal due to biotin-labeled target SH3 (Streptavidin-PE) is plotted against signal due to yeast cells expressing the c-myc-tagged Sso7d scaffold (Alexa 633 labeled anti-c-myc). Here, we have scored for positive events wherein yeast cells likely expressing F29 are also stained for target with Strep-PE (for detailed explanation see Materials and methods, 2013, 60, 15–26. Also see Figure 1—figure supplement 1). Expression and No-target controls were used as above.
Figure 1—figure supplement 3
Newly identified, isolated protein binder F29 binds Fyn SH3 domain.
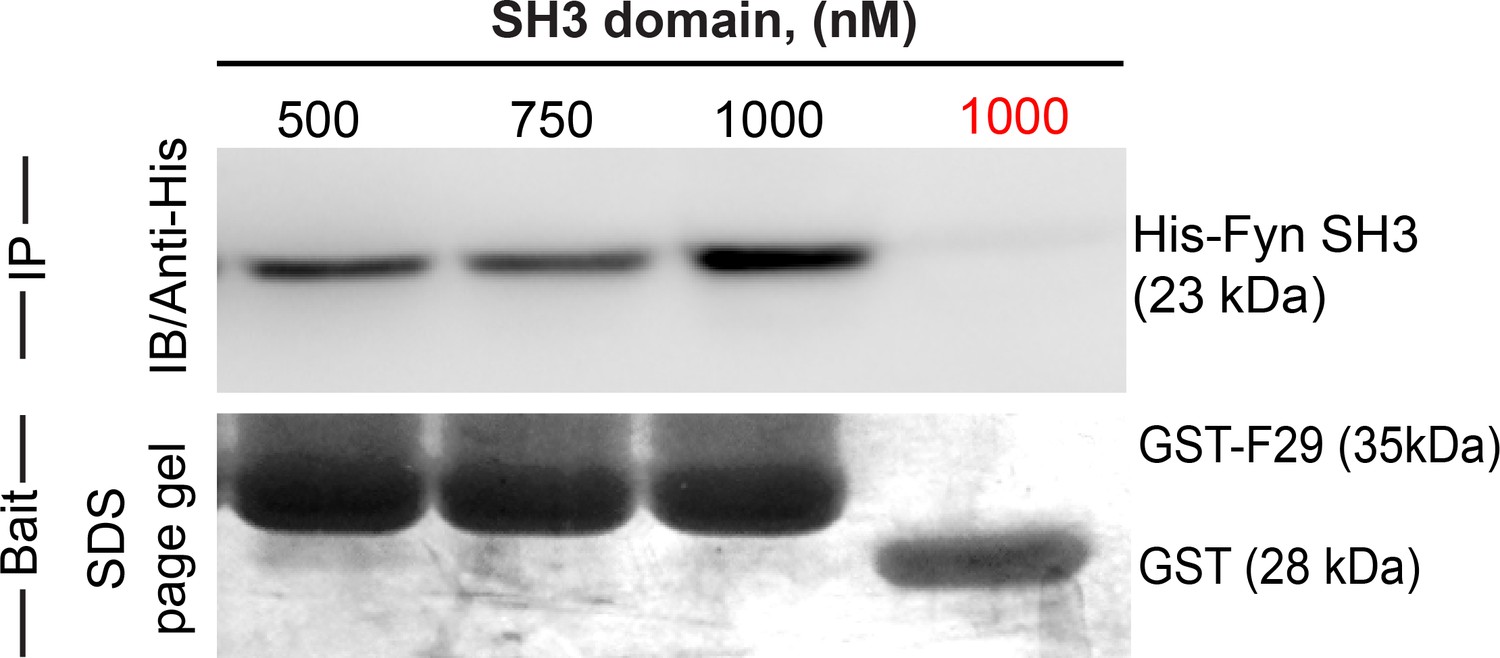
Binder F29 is able to recognize Fyn SH3 outside the context of the yeast surface, with recombinantly expressed and purified F29 showing binding to Fyn SH3. Immunoblot showing pull-down of His-tagged Fyn SH3 domains (500 nM to 1000 nM) using GST-F29 fusion protein, immobilized as the bait on glutathione sepharose beads. In contrast GST-alone control beads (GST protein immobilized glutathione sepharose beads) incubated with 1000 nM of Fyn SH3 showed no pull-down (in red, last lane on the right). The His-tagged protein detected via anti-6X-His antibody. Coomassie stained gel shows the bait protein bands immobilized on the beads (GST-F29 or GST).
Figure 2 with 3 supplements
Structure and binding interface of Fyn-SH3:F29 complex by NMR.
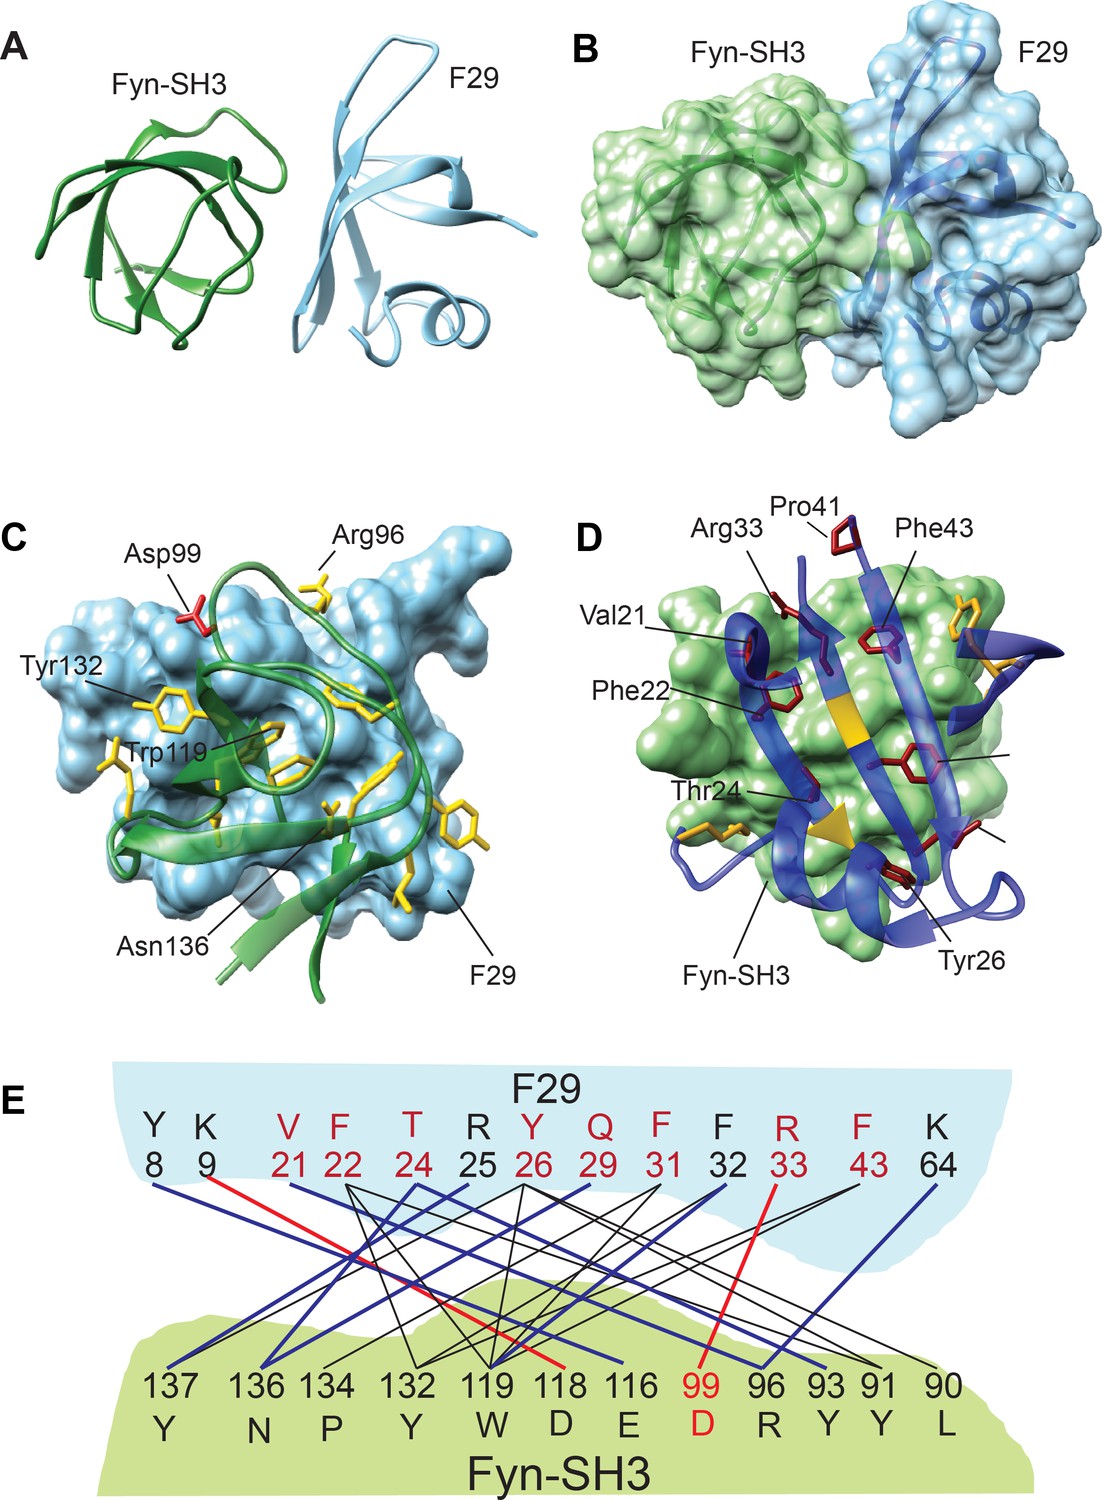
(A) The lowest energy structure from Haddock is provided, where Fyn-SH3 is colored green and F29 is colored in light blue. (B) The surface representation of A, where the surface of Fyn-SH3 and F29 are colored in green and light blue, respectively. (C) Ribbon diagram of contact interface: A view of the contact interface where the F29 surface is represented in light blue and Fyn-SH3 is shown in green ribbon. The interacting side chains of Fyn-SH3 are shown in yellow. A key interacting residue, Asp99, that forms a salt-bridge with F29 and has been subjected to mutagenesis is shown in red. (D) Complementary view of interface: Complementary view of the interface with Fyn-SH3 in green and F29 in blue (ribbon diagram) is shown. The interacting side chains of F29 residues are shown and identified here. They are colored in dark red if randomized and colored in gold otherwise. The non-randomized residues Arg25 and Phe32 interact with Fyn-SH3 through the backbone atoms and hence, their ribbons are colored in gold. Non-interacting regions of F29 far away from the interface are hidden for clarity. (E) Schematic showing Fyn-SH3:F29 amino acids involved in interfacial contacts. The hydrophobic and aromatic-aromatic contacts between specific residues are shown in black lines, the hydrogen bonds are shown in blue lines and salt-bridges are shown in red lines. Residues of F29 are colored in red if randomized and colored in black otherwise. Asp99 in Fyn-SH3 is colored in red (Also see Figure 2—figure supplement 3B).
Figure 2—figure supplement 1

NMR analysis yields structure of the Fyn-SH3 complex with newly isolated binder.
(A)15N-edited HSQC spectrum of F29 (red) overlapped with the spectrum of Fyn-bound F29 (black). (B) 15N-edited heteronuclear single quantum coherence (HSQC) spectrum of Fyn SH3 (red) overlapped with the spectrum of F29-bound Fyn-SH3 (black). The peaks and assigned residues with significant chemicals shifts are marked in both A and B. Chemical shift perturbations (CSP) observed in A and B are plotted in (C) and (D), respectively. A horizontal line is drawn at 2σ, where σ is the standard deviation of the CSP values. (E) Comparison with SH3-polyproline binding: An alignment of the Fyn-SH3:F29 complex with two structures of Fyn-SH3:poly-proline complexes (pdb:4eik and pdb:3ua7). (F) A rotation of e to show a comparison between the two interfaces. F29 is differently aligned as compared to the poly-prolines (1-purple and 2-blue) when bound to SH3 domain. The angle between poly-prolines and the β-sheet of F29 is ~30° with respect to the SH3 domain. (G) Eight amino acid residues of Fyn SH3 domain are found to be common for binding with both poly-proline motifs and newly isolated binder, F29. The Fyn SH3 sequence is shown on the top and its residues which are found to be interacting with F29 (Figure 2, current study), poly-proline 1 (pdb = 4 EIK) and poly-proline 2 (3UA7) are shown below. The Fyn SH3 residues which are found to be common in all interactions have been highlighted.
Figure 2—figure supplement 2
Structures of F29 bound to target Fyn SH3 domain.
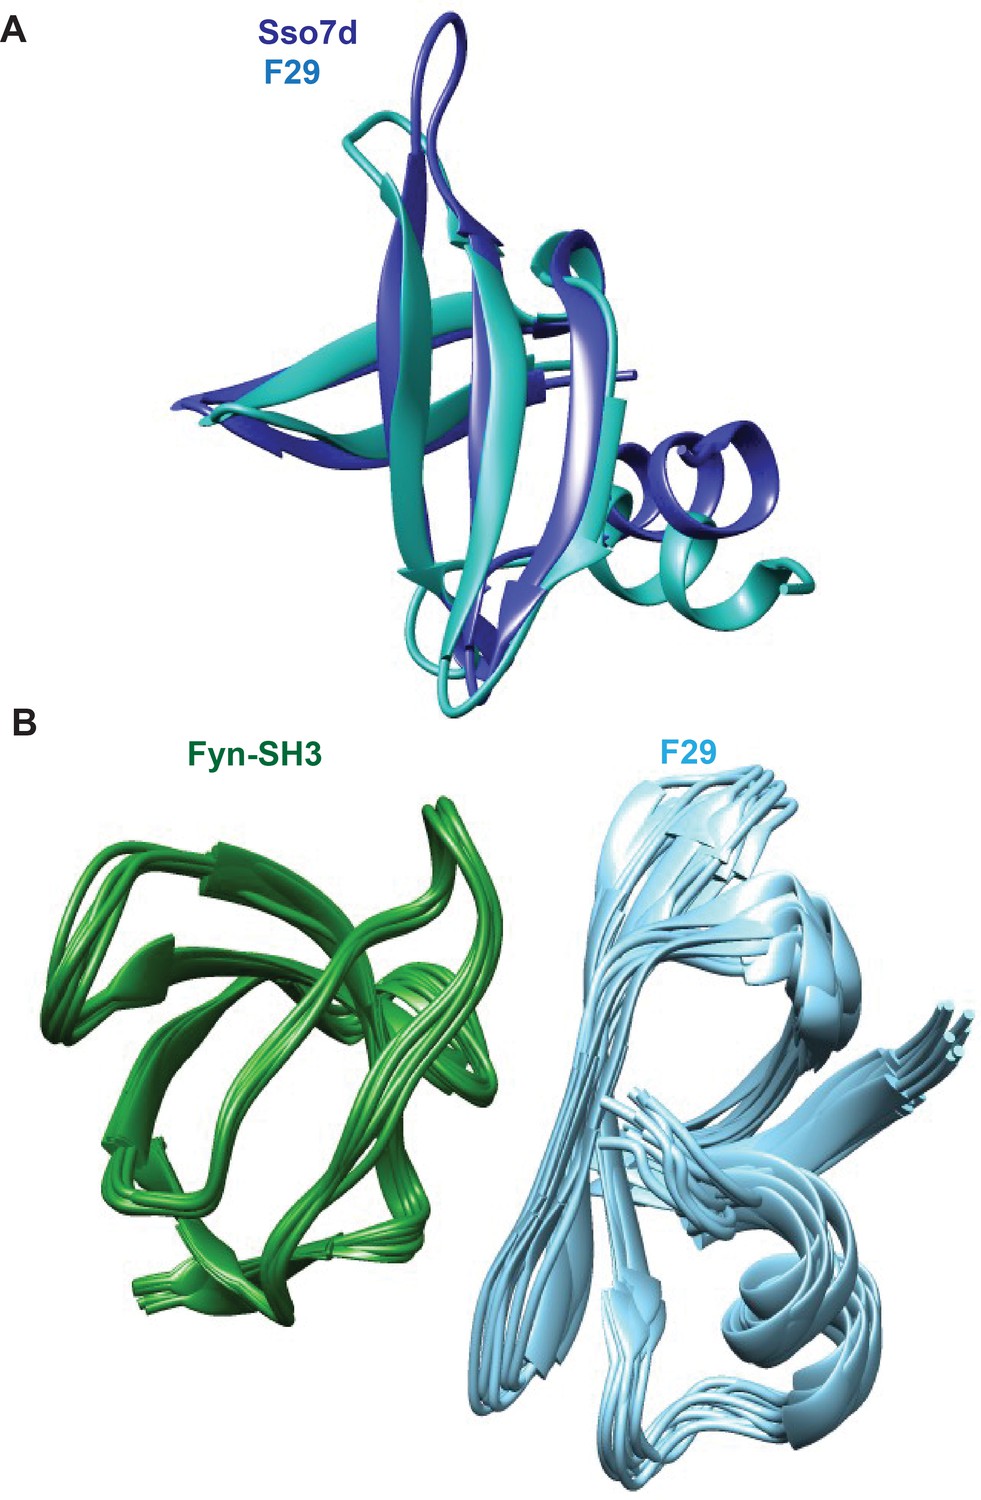
A superposition of (A) the CS-rosetta generated structure of F29 with Sso7d crystal structure. The root-mean-square-deviation (rmsd) between Sso7d (pdb id: 1BF4) and F29 is 1.4 angstroms. (B) Ten lowest energy structures of Fyn-SH3:F29 complex generated by Haddock.
Figure 2—figure supplement 3
F29 specifically binds Fyn SH3 independent of the yeast cell surface and binding specificity can be switched through targeted mutagenesis.
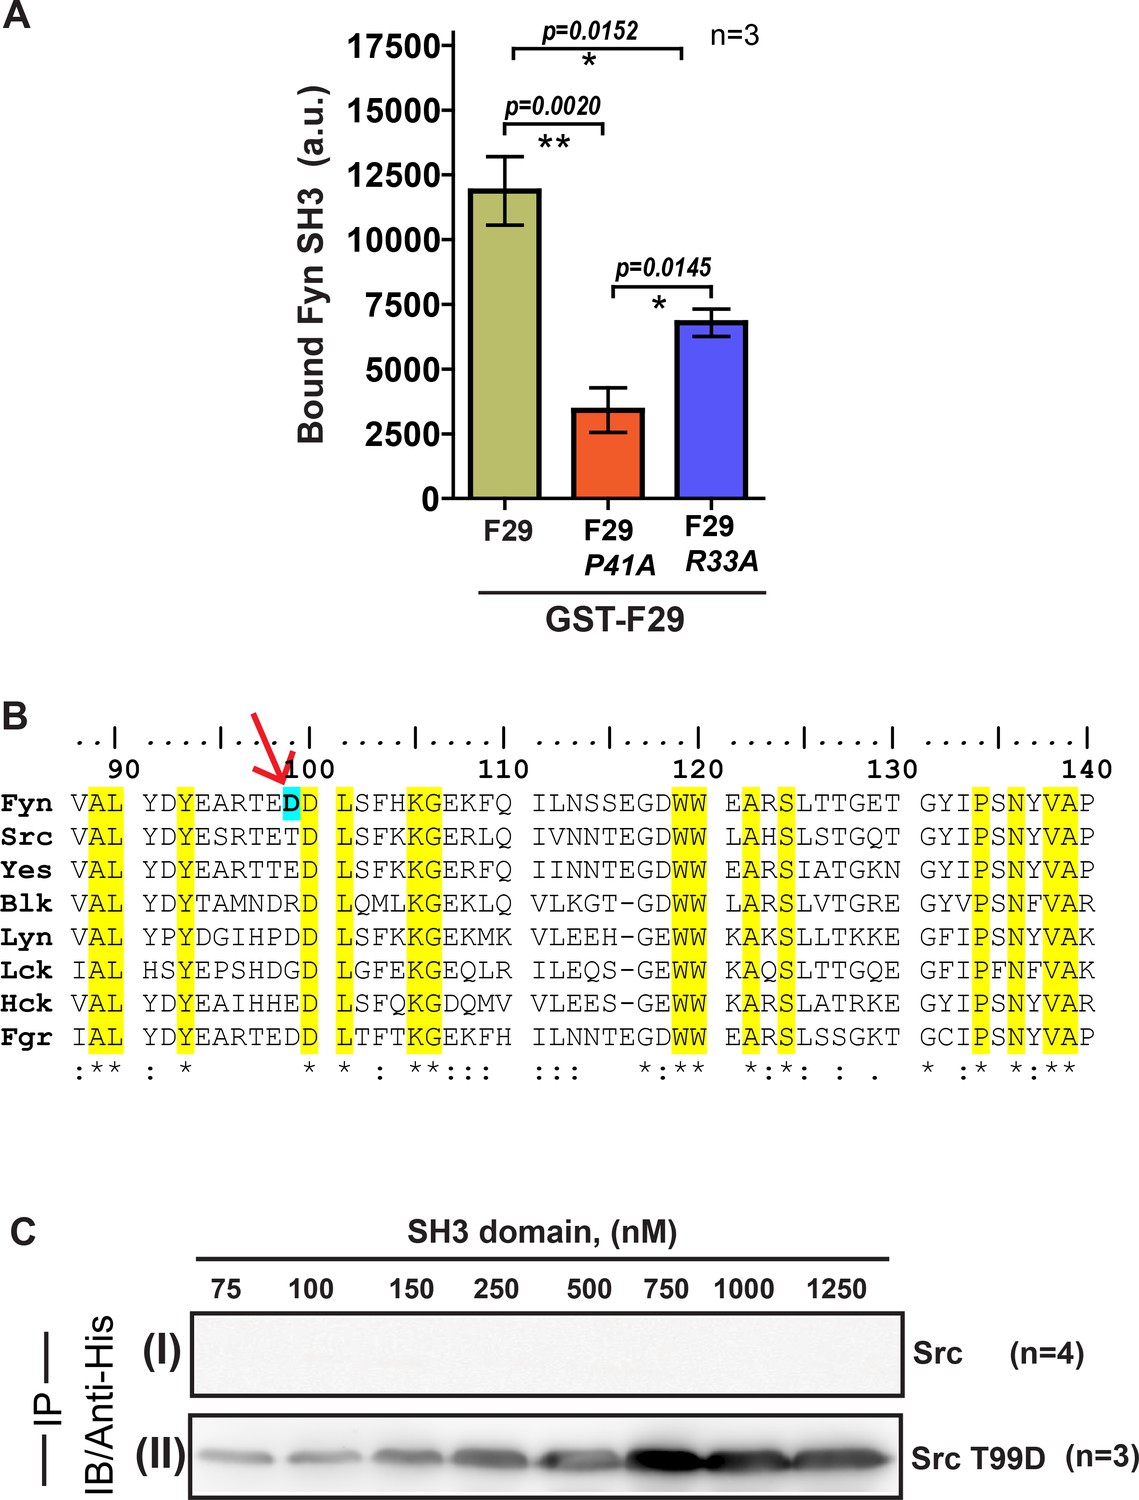
Pull-down with F29 binder shows specific binding to Fyn SH3 domain. (A) Plot showing the amounts (band intensity, calculated from densitometry performed on immunoblot bands after pull-down) of bound Fyn SH3 domain to either immobilized GST-tagged binder F29 (by pull-down experiment) or F29 mutants P41A and R33A, respectively. Mutations, especially P41A attenuates binding significantly. Data from three independent experiments (n = 3) were analyzed on GraphPad Prism. Student’s unpaired one tailed-t-test was used to determine the p-value (shown in the figure). Values are mean ± s.d. (B) Amino acid ClustalW alignment of Src family kinase SH3 domains. The residue numbers are according to full-length tyrosine-protein kinase Fyn [Homo sapiens, (protein id-XP_016866143.1)]. The residues conserved across SFK SH3 domains are highlighted in yellow. The Fyn SH3 residue (D99) that shows exclusive interaction with binder (R33) is marked with an arrow. (C) Immunoblot (probes with anti-6X-His antibody) showing pull down of 6X-His tagged (I) Src SH3 domain and, (II) Src SH3-T99D domain mutant using GST-F29. While c-Src SH3 domain shows no binding, detectable binding to F29 is observed for Src SH3 T99D domain mutant.
-
Figure 2—figure supplement 3—source data 1
Analysis of the extent of Fyn SH3 pulldown by F29 and its mutants.
- https://cdn.elifesciences.org/articles/50571/elife-50571-fig2-figsupp3-data1-v1.xlsx
Figure 3 with 11 supplements

Developing a FRET biosensor for sensing active Fyn in cells.
(A) F29 preferentially binds active Fyn kinase. (I) Immunoblots showing GST-F29 pulldowns of cellular Fyn after transfecting cells with either Fyn WT (wild type) or Fyn CA (constitutively active kinase). (II) Extent of pulldown with either CA or WT Fyn. The band intensity of pulled-down Fyn kinase from five such experiments (n=5) was quantified and normalized to expression level. Binder F29 is able to pull-down CA mutant of Fyn to a greater extent than WT. Values are mean ± s.d from five independent experiments (n=5). Data was compared using Student’s unpaired one-tailed t-test on GraphPad Prism. (B) F29 binds full-length, endogenous cellular Fyn kinase. Immunoblots, using anti-Fyn antibody, show pulldown of full-length endogenous Fyn from cell lysates by GST-F29 immobilized on glutathione beads (n = 3). GST-coated beads are shown as controls. Coomassie stained gels of the bait proteins, either GST-F29 or GST used for pulldown are also shown. (C) Schematic diagram and model for an intermolecular FRET biosensor for visualizing active Fyn in cells. The donor fluorophore (mCerulean) is inserted in between Fyn kinase unique (UD) and SH3 domains using flexible linker sequences to minimally disrupt kinase function (also see Figure 3—figure supplements 2 and 5). Newly developed Fyn active-state binder, F29, is fused with acceptor fluorophore (mVenus). In the cell, F29 binder (FRET-acceptor) would bind the exposed SH3 domain of active Fyn (FRET donor), resulting in an intermolecular FRET between donor and acceptor fluorophores (bottom panel). In contrast, F29 would be expected to show significantly lower binding and reduced or no FRET when Fyn is inactive (upper panel). (D) Sensing active Fyn in cells through binding-dependent FRET. Fluorescence spectral measurements from HEK-293T cells co-transfected with FRET-donor (WT or CA Fyn-mCerulean) alone OR along with a FRET-acceptor (either Fyn binder mVenus-F29 or the non-binding mutant, mVenus-F29P41A). Specifically, the normalized emission spectra of transiently transfected cells when excited at 435 nm (corresponding to donor mCerulean excitation) are shown. Spectra has been normalized relative to emission intensity at 475 nm (corresponding to mCerulean emission). Overall, the spectra show that FRET (‘sensitized’ acceptor emission at 525 nm) is greater for CA Fyn as compared to WT Fyn. No FRET signal is observed (sensitized 525 nm emission) with donor alone or non-binding mutant F29-P41A. Left inset figure shows that binding and increase in FRET efficiency is saturable. Using raw fluorescent intensity values the FRET efficiency was calculated as per the equation Fa/(Fa+Fd), where Fa is acceptor and Fd is donor raw fluorescence intensity, respectively. Increasing the amount of labeled binder (mVenus-F29/acceptor) in cells while maintaining constant Fyn (donor) levels causes an increase in FRET till saturation is reached (blue closed squares), indicating binding dependent FRET. From three independent experiments (n=3) , a nonlinear best fit was plotted (R2 = 0.97) using GraphPad Prism (blue, dotted line). In contrast, acceptor-labeled non-binder control (F29 P41A mutant) shows little or no FRET (orange open symbol) showing FRET response is binding dependent and specific. Right inset figure shows a bar plot of FRET efficiency comparing WT and CA Fyn for a 1:2 donor:acceptor molar ratio. From three such independent experiments (n=3) , data was compared using Student’s unpaired one-tailed t-test on GraphPad Prism. Values are mean ± s.e.m. (E) Membrane tagging of F29 increases biosensor sensitivity and FRET efficiency (calculated as above). (I) The emission spectra of cells co-transfected with Fyn (WT) and, either mVenus-F29 or myr-mVenus-F29 at a 1:4 donor:acceptor molar ratio on 435 nm excitation are shown. Spectra for corresponding non-binding controls (mVenus-F29P41A with and without myristoyl tags) are also shown. (II) Box-and-Whisker plot showing observed FRET efficiency (calculated as above) in cells when myristoyl-tag is added to the FRET-acceptor (mVenus-F29) or its non-binding control mutant P41A. Here, Whiskers represents the lowest and highest observed values of FRET efficiency, while Box spans the interquartile region with the ends demarcating the lower and upper quartile values. The mid-line marks the median. Plus symbol (+) represents the mean FRET efficiency. Data from four such independent experiments (n=4) were analyzed using Student’s unpaired one-tailed t-test on GraphPad Prism (respective p values are indicated on panel).
-
Figure 3—source data 1
Analysis of F29 pulldown of Fyn and its constitutively active CA mutant.
- https://cdn.elifesciences.org/articles/50571/elife-50571-fig3-data1-v1.xlsx
-
Figure 3—source data 2
Analysis of FynSensor FRET efficiency with changing the cellular levels of acceptor F29 and non-binding control.
- https://cdn.elifesciences.org/articles/50571/elife-50571-fig3-data2-v1.xlsx
-
Figure 3—source data 3
Analysis of FynSensor FRET response towards WT Fyn and constitutively active (CA) Fyn.
- https://cdn.elifesciences.org/articles/50571/elife-50571-fig3-data3-v1.xlsx
-
Figure 3—source data 4
Analysis of biosensor FRET efficiency observed with various labeled F29 and non-binding constructs.
- https://cdn.elifesciences.org/articles/50571/elife-50571-fig3-data4-v1.xlsx
Figure 3—figure supplement 1
Step-wise representation of PCR based cloning methods for biosensor generation.
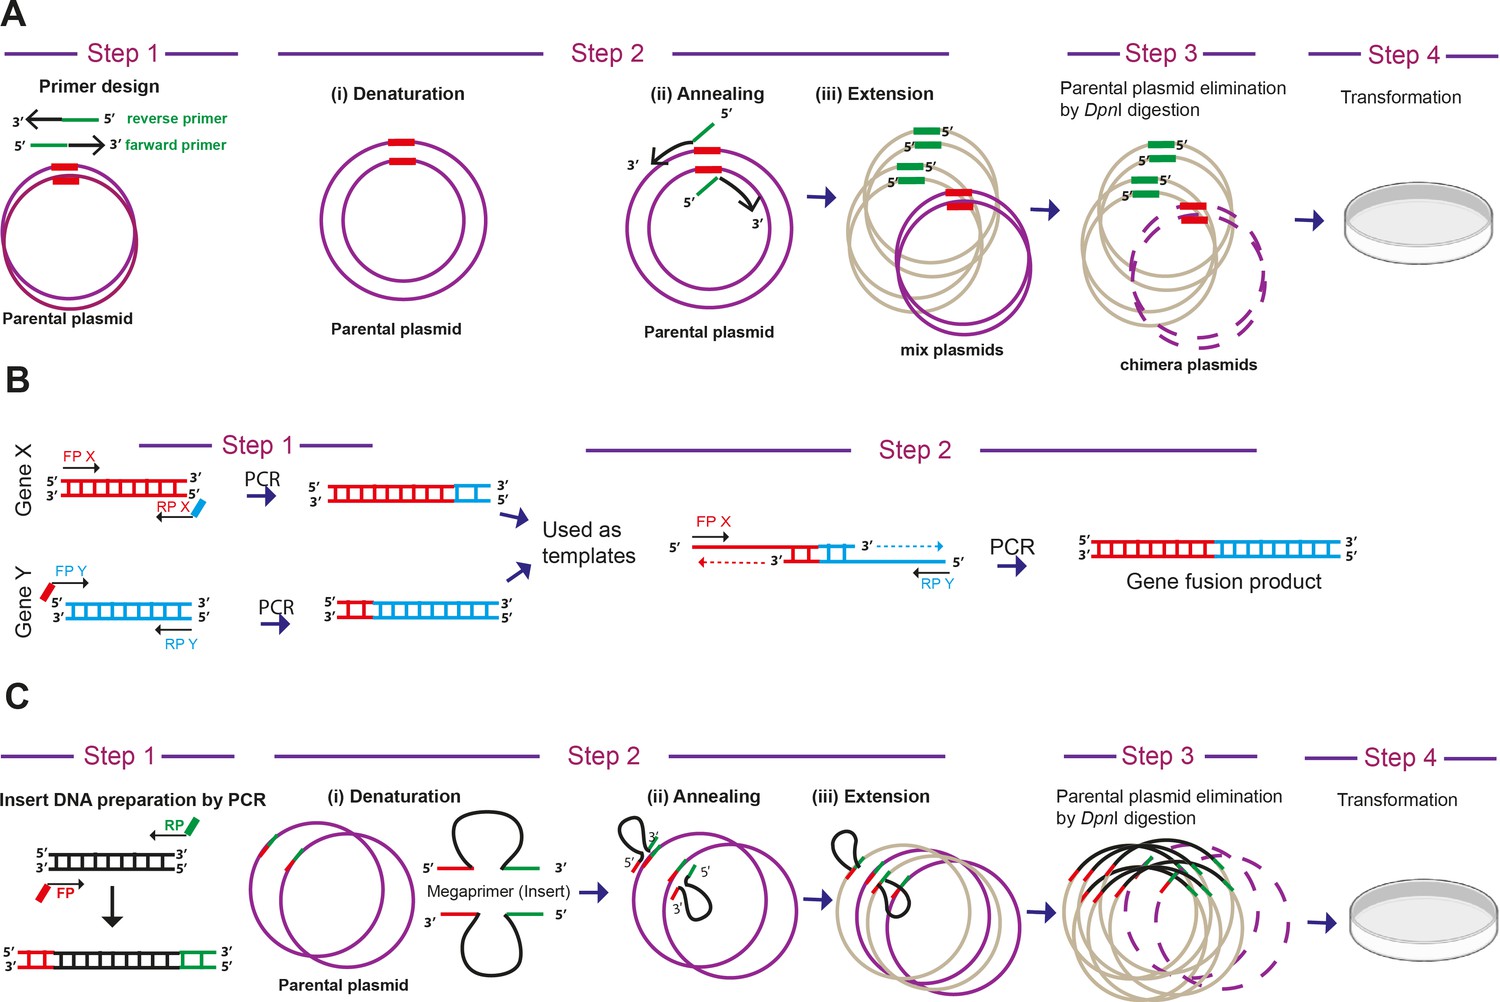
(A) ‘Quick change’ mutagenesis –The ‘Quick change’ mutagenesis method was adapted and used to perform point mutations, replace amino acids, deletion or insertion of single or multiple adjacent amino acids in a single tube reaction. This mutagenesis method was performed using Phusion high-fidelity DNA Polymerase (NEB) for mutagenic-primer directed replication of both parental plasmid strands. The primers, each complementary to opposite strands of the vector, were extended during temperature cycling by DNA polymerase, without primer displacement. Extended primers typically generated a mutated plasmid containing staggered nicks. Followed by temperature cycling, the products were treated with DpnI restriction endonuclease (NEB) to digest methylated and hemi-methylated parental DNA. The mutation-containing synthesized DNA products here selected as clones after transformation in E. coli XL10 gold ultra-competent cells. The method was adapted and modified similar to as described earlier (Methods in Enzymology, 1987, 154, 367–382; Nucleic acids research, 2004, 32, e115). (B) Overlapping PCR - In order to join two genes or DNA fragments X and Y by PCR, the pair of primers FPX-RPX and FPY and RPY were designed. The primers RPX and FPY typically had overlapping regions with each other. The genes X and Y were amplified and gel eluted from given template using these primers. In the next PCR cycle, these eluted PCR X and Y products were taken (equimolar DNA) as template along with FPX and RPY primers and amplification performed. (C) Overlap extension PCR- This method was used to clone an insert into a plasmid without restriction endonucleases or T4 DNA ligase treatment. The method was similar to ‘Quick change’ mutagenesis, except here we used PCR amplified inserts of interest as large primers. The inserts needed to have the overlap region of plasmid site for cloning. The strategy and schematics were adapted from an earlier report (Bryksin and Matsumura, 2010).
Figure 3—figure supplement 2
Labeled Fyn biosensor, mCer-Fyn is active, fluorescent, resistant to proteolysis and shows activity (autophosphorylation) levels identical to unlabeled, wild-type kinase.
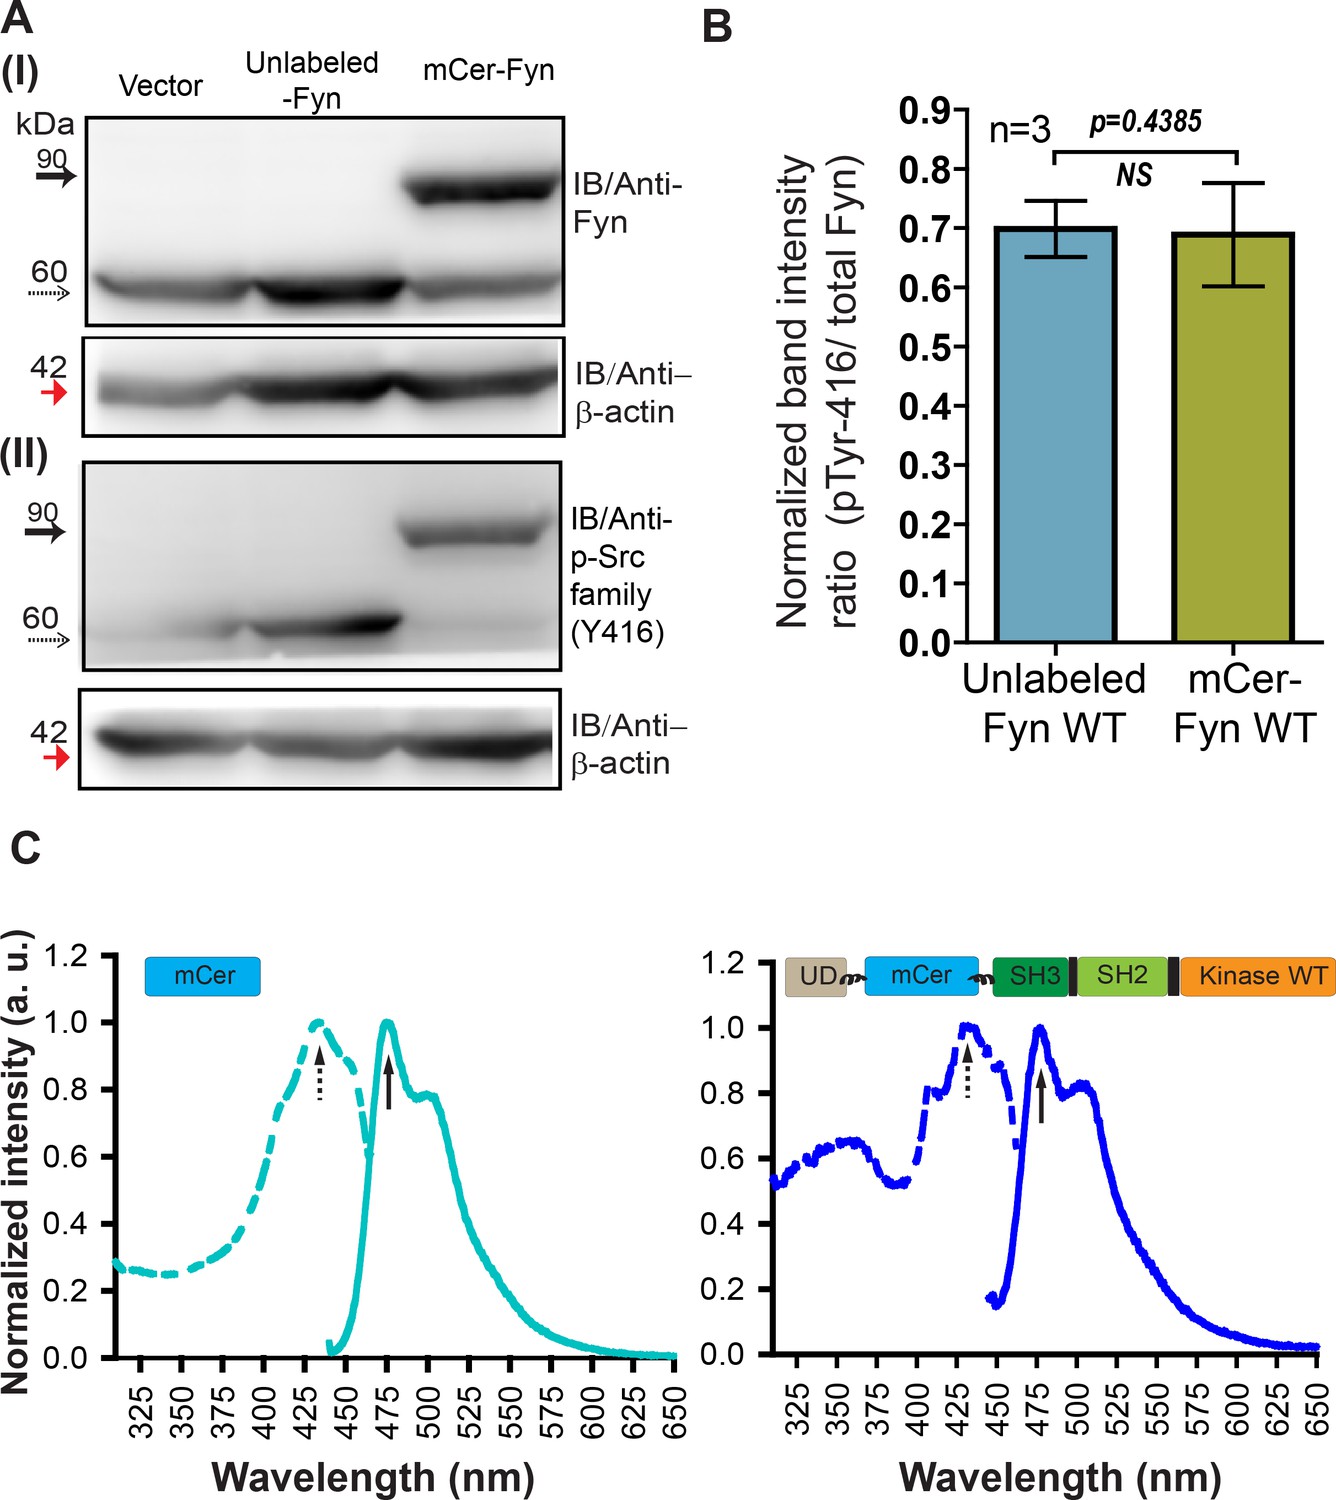
(A) Immuno-blot of FRET donor (mCer-Fyn) and unlabeled Fyn construct ectopically expressed in HEK-293T cells. The lysate (50 µg) was resolved on 8% SDS gel followed by PVDF membrane transfer and probed using (I) anti-Fyn antibody, as well as (II) anti-phospho-Src family (Tyr416) antibody. Also shown is a loading control, β-actin (~42 kDa, red arrow). In each panel, the labeled kinase (with mCerulean insertion, mCer-Fyn) bands (~90 kDa) are shown with solid arrows while the unmodified or unlabeled Fyn kinase variants (~60 kDa) are shown with dotted arrows. (B) Kinase auto-phosphorylation levels observed with FRET donor labeled wild-type (wt) Fyn (mCer-Fyn) compared with autophosphorylation of the unlabeled, WT Fyn kinase using immunoblot analysis from panel A. In each case, the band intensity was normalized with their loading controls. The ratios of active Fyn (pTyr416) to total Fyn have been plotted for both unmodified and FRET-donor (mCer-Fyn) from three such blots,(n = 3). Data sets were compared using Student’s unpaired one tailed-t-test on GraphPad Prism. The extent of autophosphorylation for both labeled (mCer-Fyn) and unlabeled wild-type Fyn were virtually identical (p-value=0.4385). Values are mean ± s.d. (C) Whole cell fluorescence excitation (dotted line) and emission (solid line) spectra of HEK-293T cells ectopically expressing either FRET donor construct (mCer-Fyn, wt) or unmodified mCerulean. For emission spectra, λex = 435 nm and for excitation spectra, λem = 475 nm. Labeled Fyn (mCer-Fyn) expressing cells show spectra similar to cells expressing untagged mCerulean.
-
Figure 3—figure supplement 2—source data 1
Analysis of autocatalytic activity of labeled and unlabeled Fyn.
- https://cdn.elifesciences.org/articles/50571/elife-50571-fig3-figsupp2-data1-v1.xlsx
Figure 3—figure supplement 3
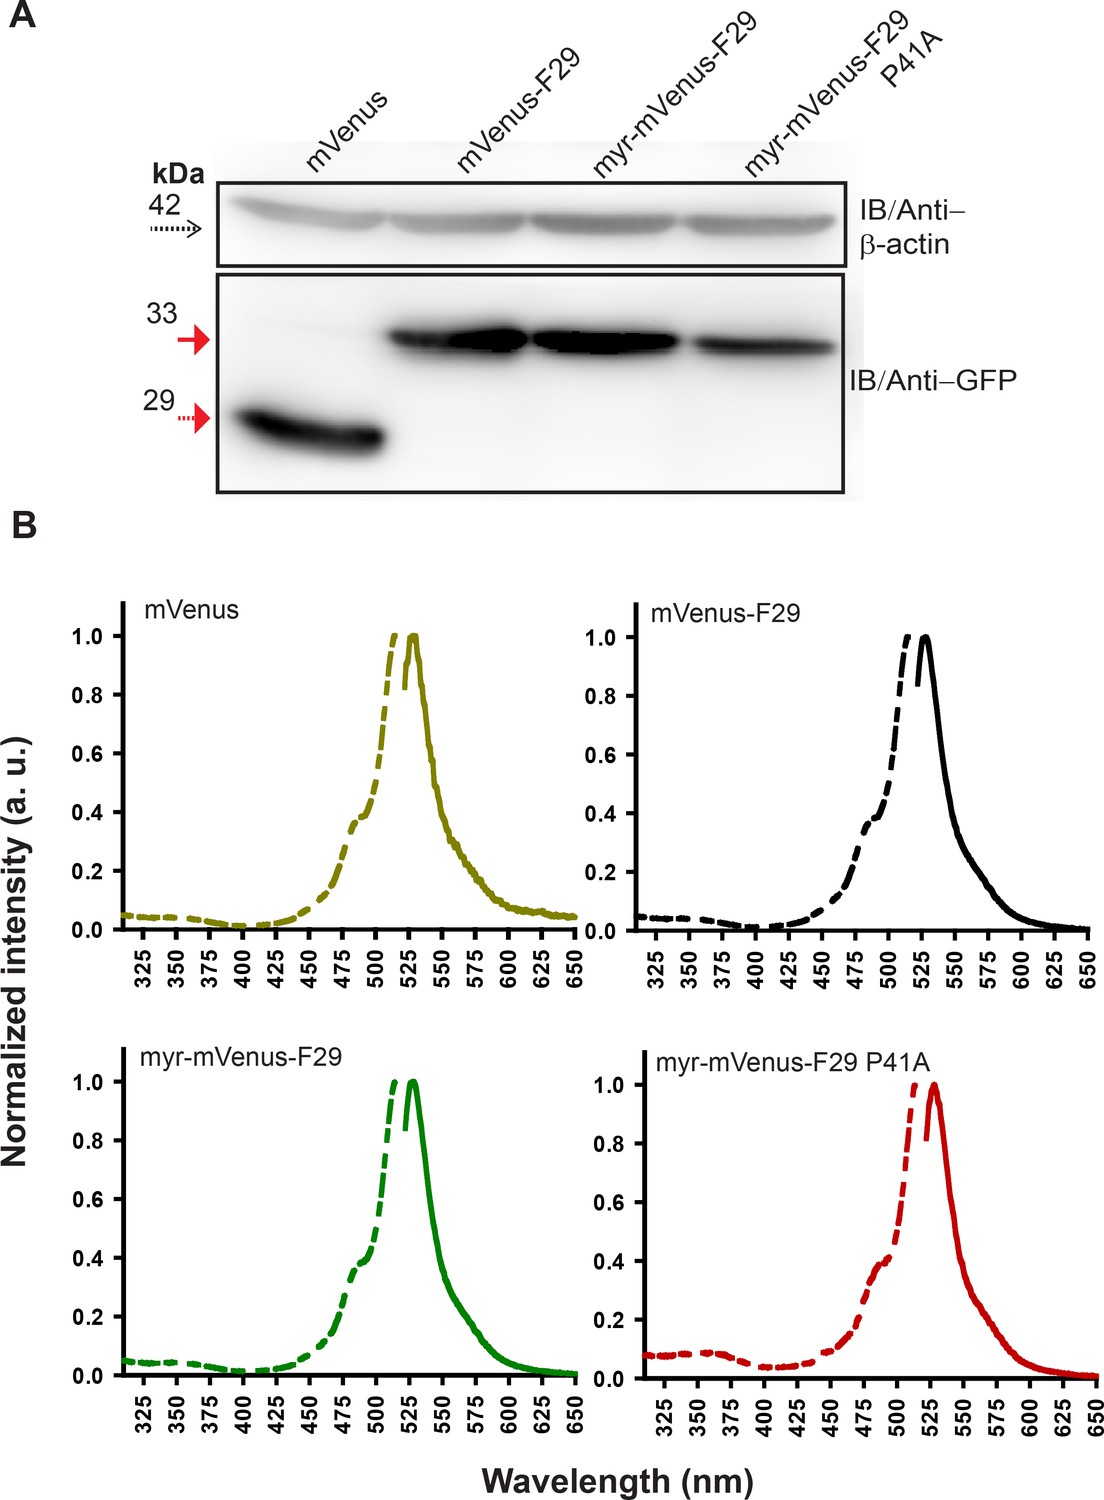
Labeled F29 expressed in cells is resistant to proteolysis, shows expected fluorescence in cells.
(A) Immunoblot analysis of FRET acceptor (mVenus-F29 and its variants) expressed in HEK-293T cells. β-actin serves as loading control (dotted arrow). mVenus (29 kDa) alone or FRET-acceptor variants (~35 kDa) probed with GFP antibody. (B) Whole cell fluorescence excitation (dotted line) and emission (solid line) spectral measurements of HEK-293T cells expressing either labeled mVenus F29, mVenus F29 with a myristoyl tag (myr-mVenus-F29), myr-mVenus-F29 P41A (non-binding control) or mVenus alone. In case of cells expressing each labeled F29 variant, the fluorescence spectra were virtually identical to the spectra observed from cells expressing untagged mVenus with λex = 515 nm and λem = 525 nm.
Figure 3—figure supplement 4
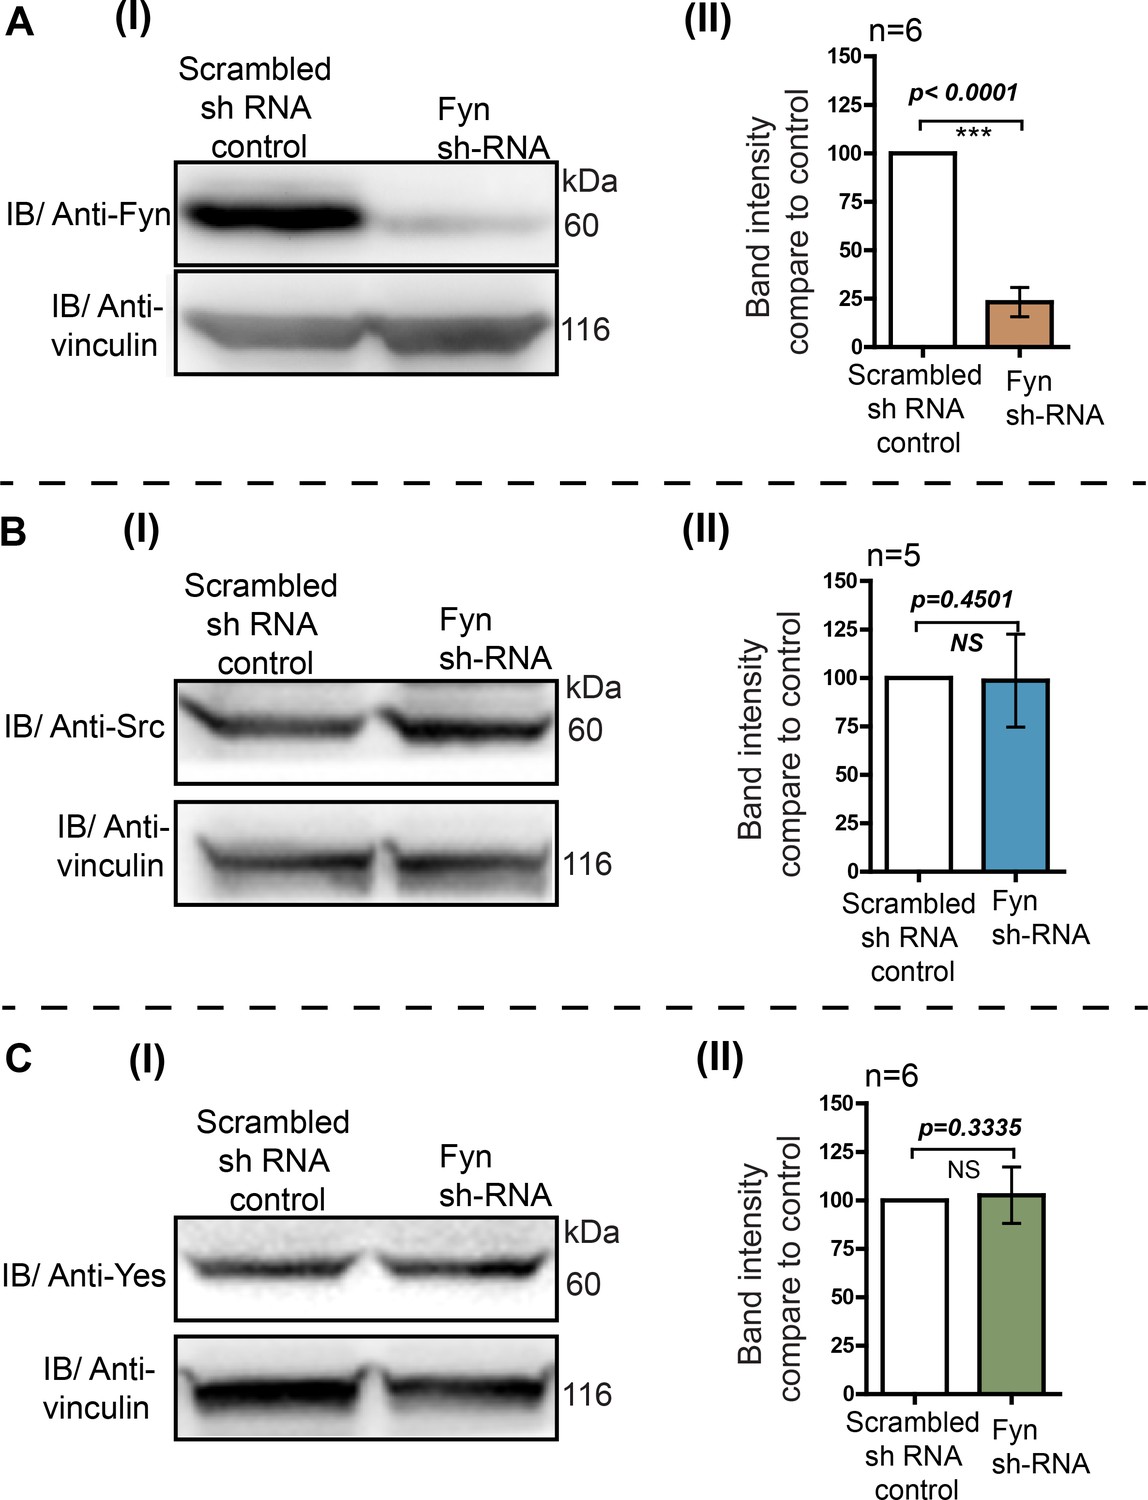
Knockdown of endogenous Fyn kinase expression using RNA interference in HEK293T cells.
RNA interference leads to a substantial reduction in Fyn levels while levels of c-Src and c-Yes are not affected. The HEK293T cells were transduced with retroviral construct having Fyn 3’UTR targeting Sh-RNA. The transduced cells were selected using puromycin. No target Sh-RNA (scrambled) was used as control (see Materials and methods). The cells were grown and cell lysate were analysed using immunoblot assay to measure the total levels of endogenous Src family members (A) Fyn, (B) c-Src and, (C) c-Yes kinases using specific antibodies. In each of the cases, (I) immunoblots were probed with specific antibodies (Src, Yes or Fyn) as well as vinculin as loading control. (II) Quantitative analysis of more than five such blots (n≥5) showing the normalized expression level of respective kinases compared to scrambled sh-RNA control cells. Fyn protein levels show a substantial reduction while levels of c-Src and c-Yes do not show any significant change. The data was analyzed using Student’s unpaired one tailed-t-test on Graph-pad Prism and corresponding p values are shown on respective panels. Values are mean ± s.d.
-
Figure 3—figure supplement 4—source data 1
Quantification of protein levels of Fyn, c-Src and c-Yes in HEK293T Fyn knockdown cells.
- https://cdn.elifesciences.org/articles/50571/elife-50571-fig3-figsupp4-data1-v1.xlsx
Figure 3—figure supplement 5
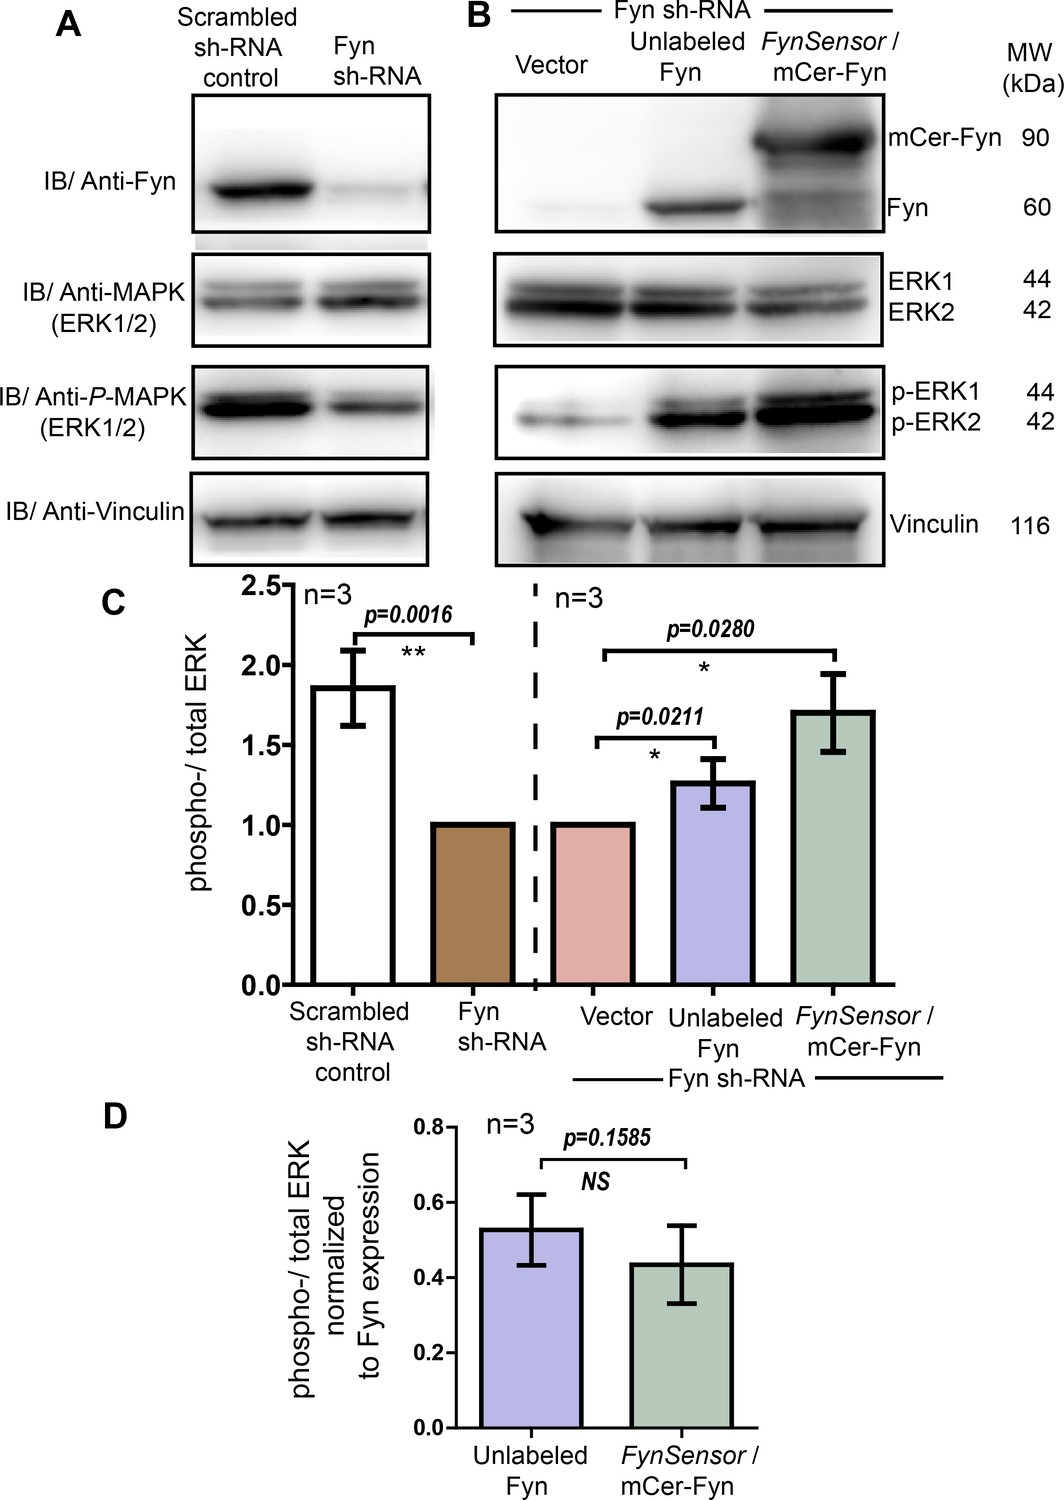
FynSensor (mCerulean labeled) Fyn is signaling competent and rescues ERK phosphorylation in Fyn knockdown cells similar to unlabeled Fyn.
(A) Cellular Fyn levels regulate downstream signaling, as measured through levels of ERK phosphorylation. Immunoblots showing levels of Fyn kinase (60 kDa), total-ERK as well as phospho-ERK (42–44 kDa) in control (scrambled sh RNA control) as well as stable Fyn knockdown HEK293T cells (Fyn KD cells generated through RNAi). Reduction in cellular Fyn levels causes a reduction in extent of ERK phosphorylation. Vinculin (116 kDa) has been used as loading control. (B) FynSensor (mCerulean labeled) mCer-Fyn is able to rescue downstream signaling in Fyn-knockdown cells. Specifically, expression of mCer-Fyn in Fyn-knockdown-HEK293T (FynKD) cells is able to reverse the reduction in ERK phosphorylation, that is otherwise observed in FynKD cells. This rescue is similar to that observed with unlabeled wild-type Fyn. Briefly, FynKD cells were transiently transfected with either vector control, unlabeled Fyn kinase (wt) or labeled FynSensor-Fyn (mCer-Fyn), and the extent of ERK phosphorylation probed. Immunoblot showing the levels of Fyn, total-ERK as well as phospho-ERK. Vinculin was used as loading control. (C) Ectopic expression of FynSensor-Fyn in FynKD cells causes a significant enhancement in levels of ERK phosphorylation. Bar graph showing extent of ERK phosphorylation (ratio of phospho-/total-ERK) in RNAi control as well Fyn knockdown cells (left panel, also see A). There is a significant reduction in ERK phosphorylation (ratio of phospho-/total-ERK) in FynKD cells. Further, in this FynKD background, the recovery of ERK phosphorylation (ratio of phospho-/total-ERK) by expressing either labeled Fyn (mCer-Fyn) or unmodified/unlabeled, WT Fyn is quantified (right panel, also see B). (D) Extent of ERK phosphorylation induced by ectopic Fyn rescue (in Fyn-knockdown cells) is similar for unlabeled and labelled (FynSensor) Fyn. Bar graph showing ratio of phospho-/total-ERK, when normalized for Fyn expression levels, for labeled-Fyn (FynSensor) as well as unlabeled-wt-Fyn transiently expressed in Fyn knockdown cells (as shown in B). No significant difference is observed between labeled and unlabeled kinase. For C and D, immunoblot band intestines from three independent experiments each (n=3) were analysed using Student’s unpaired one tailed-t-test on Graph-pad Prism and corresponding p values are shown on respective panels. Values are mean ± s.d.
-
Figure 3—figure supplement 5—source data 1
Quantification of phosphorylated and total ERK levels in HEK293T cells.
- https://cdn.elifesciences.org/articles/50571/elife-50571-fig3-figsupp5-data1-v1.xlsx
-
Figure 3—figure supplement 5—source data 2
Quantification of phosphorylated and total ERK levels as a function of Fyn expression in HEK293T cells.
- https://cdn.elifesciences.org/articles/50571/elife-50571-fig3-figsupp5-data2-v1.xlsx
Figure 3—figure supplement 6
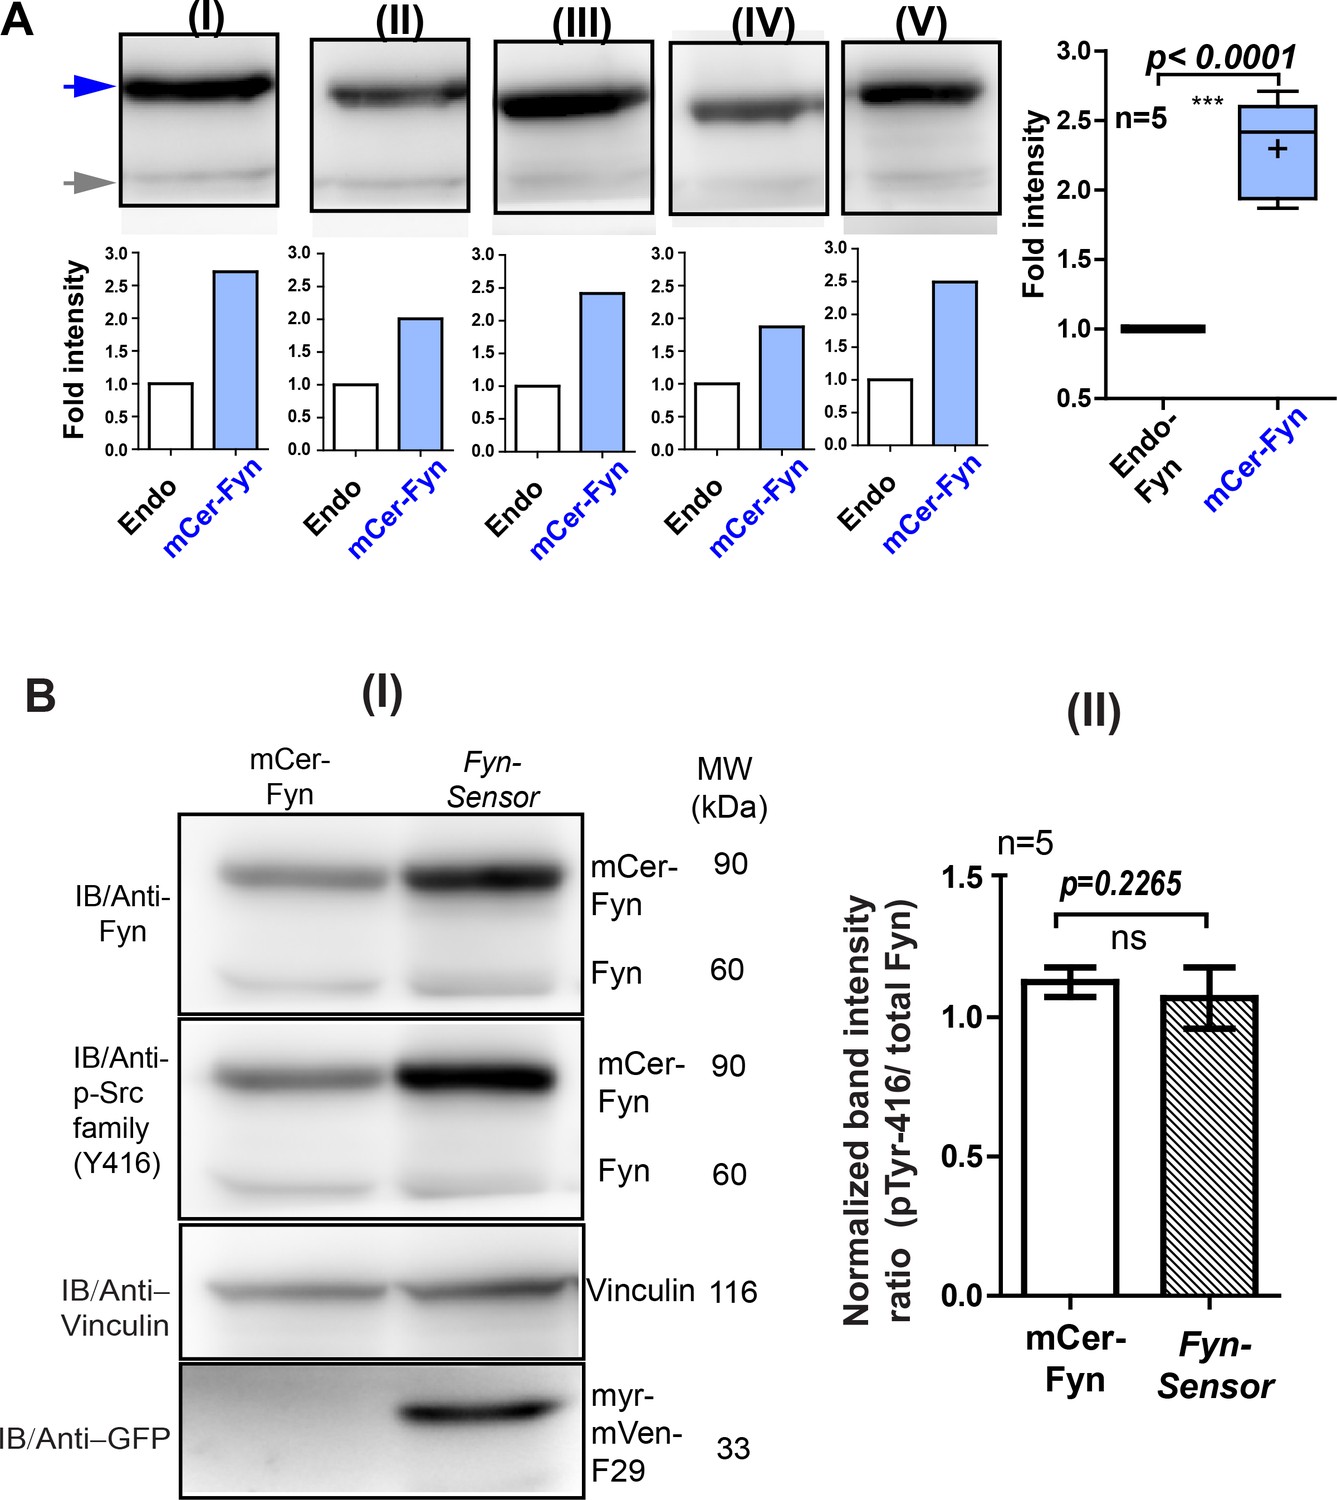
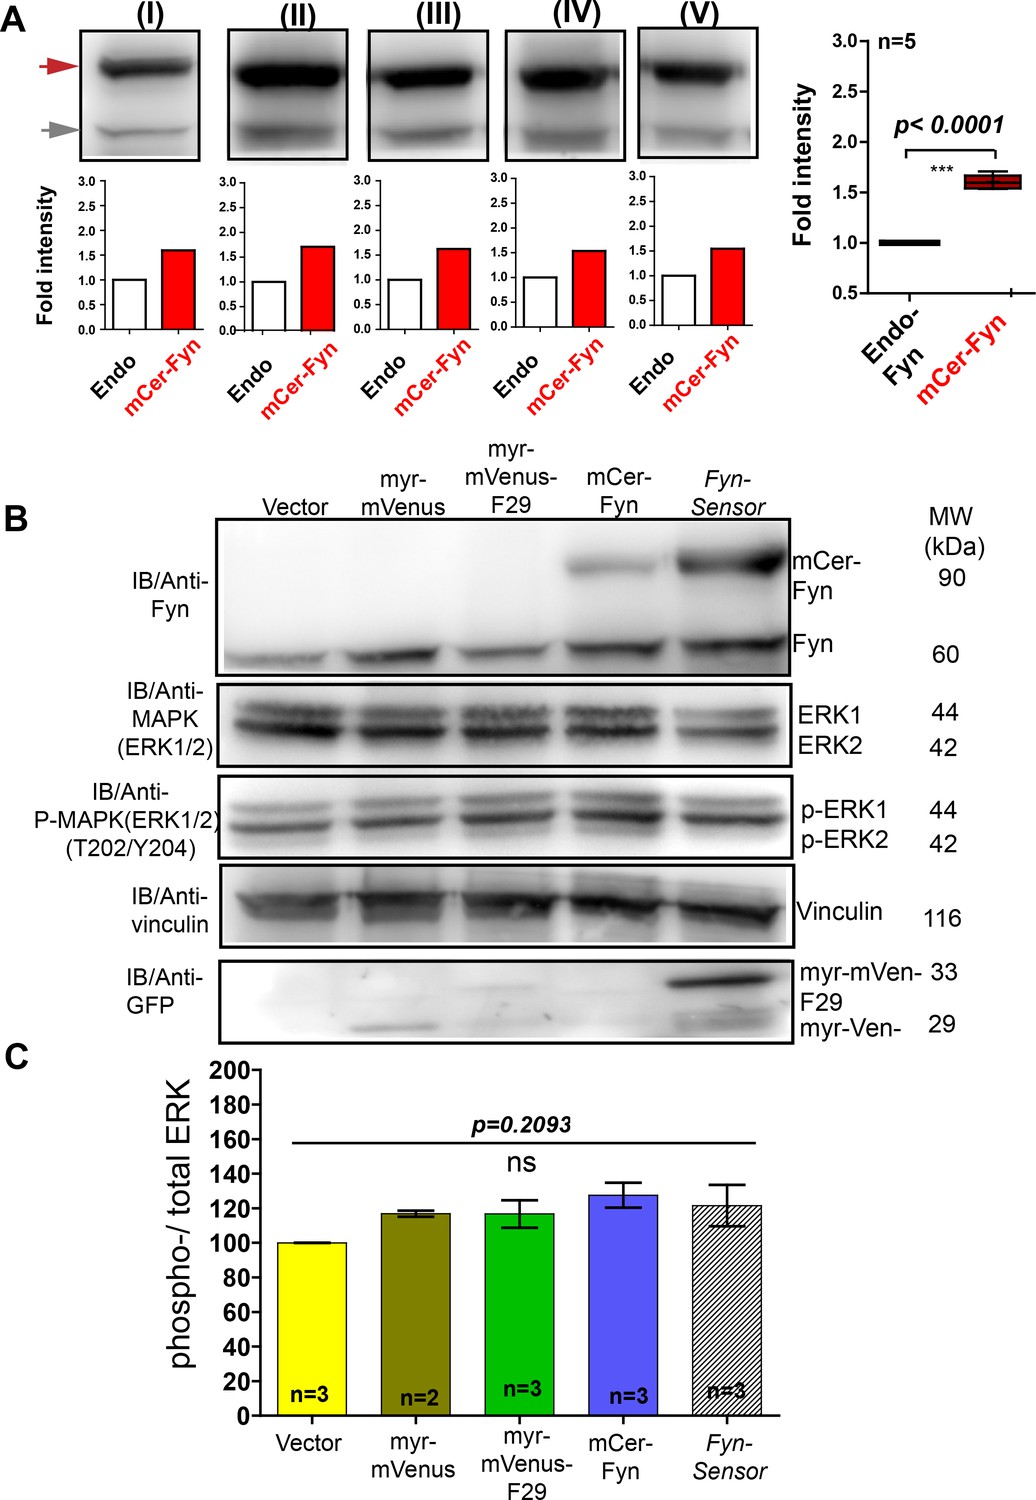
Expression of labeled F29 at levels used for FynSensor imaging does not cause artefactual activation of kinase.
Under expression conditions used for biosensor imaging quantified here in U2OS cells, the FynSensor-labeled F29 (myr-mVenus-F29) does not cause artefactual activation of kinase. (A) Immunoblot assay performed on cells transiently transfected with the FynSensor DNA constructs (same as used for biosensor imaging; donor: acceptor ratio, 1:2) and probed with Anti-Fyn antibody. Here, five immunoblots (I–V) are shown where mCer-Fyn (90 kDa) band has been marked with blue arrowhead and endogenous Fyn band is marked with grey arrowhead. For each case (I–V) the band intensity mCer-Fyn was compared with endogenous Fyn and plotted using GraphPad Prism and shown in a Box-and-Whisker plot. Data from five blots (I–V) analysed using Student’s unpaired one tailed t-test on GraphPad Prism (respective p values are indicated on panel). Average from FIVE independent experiments (n=5) show that mCer-Fyn is expressed at levels LESS THAN 2.5 times that of the endogenous Fyn kinase. Imaging data in manuscript (see Figures 5, 6C, 7A and 8) show that Fyn activity patterns revealed by FynSensor remain the same, independent of mCer-Fyn expression in this current expression range. (B) Expression of labeled F29 at levels used for biosensor imaging do not perturb autocatalytic activity of kinase. (I) Immuno-blot analysis of U2OS cells expressing either FynSensor (mCer-Fyn + myr-mVen-F29) or labeled Fyn alone (mCer-Fyn) shows identical level of active Fyn. Blot was probed with anti-Fyn antibody, anti-phospho-Src family (Tyr416) antibody as well as anti-GFP antibody (to confirm expression of myr-mVenus F29 protein,~33 kDa). Also shown is a loading control, vinculin (~116 kDa). In each case, the band intensity was normalized with their loading controls. (II) The ratios of active Fyn (pTyr416) to total Fyn has been plotted for both labeled Fyn alone and FynSensor expressing cells (with F29) from five such blots (n = 5). Data sets were compared using Student’s unpaired one tailed-t-test on GraphPad Prism. The extent of autophosphorylation for both labeled Fyn (mCer-Fyn) alone or for cells expressing FynSensor (with F29) were virtually identical (p-value=0.2265). Values are mean ± s.d.
-
Figure 3—figure supplement 6—source data 1
Quantification of levels of total and active Fyn in U2OS cells.
- https://cdn.elifesciences.org/articles/50571/elife-50571-fig3-figsupp6-data1-v1.xlsx
Figure 3—figure supplement 7
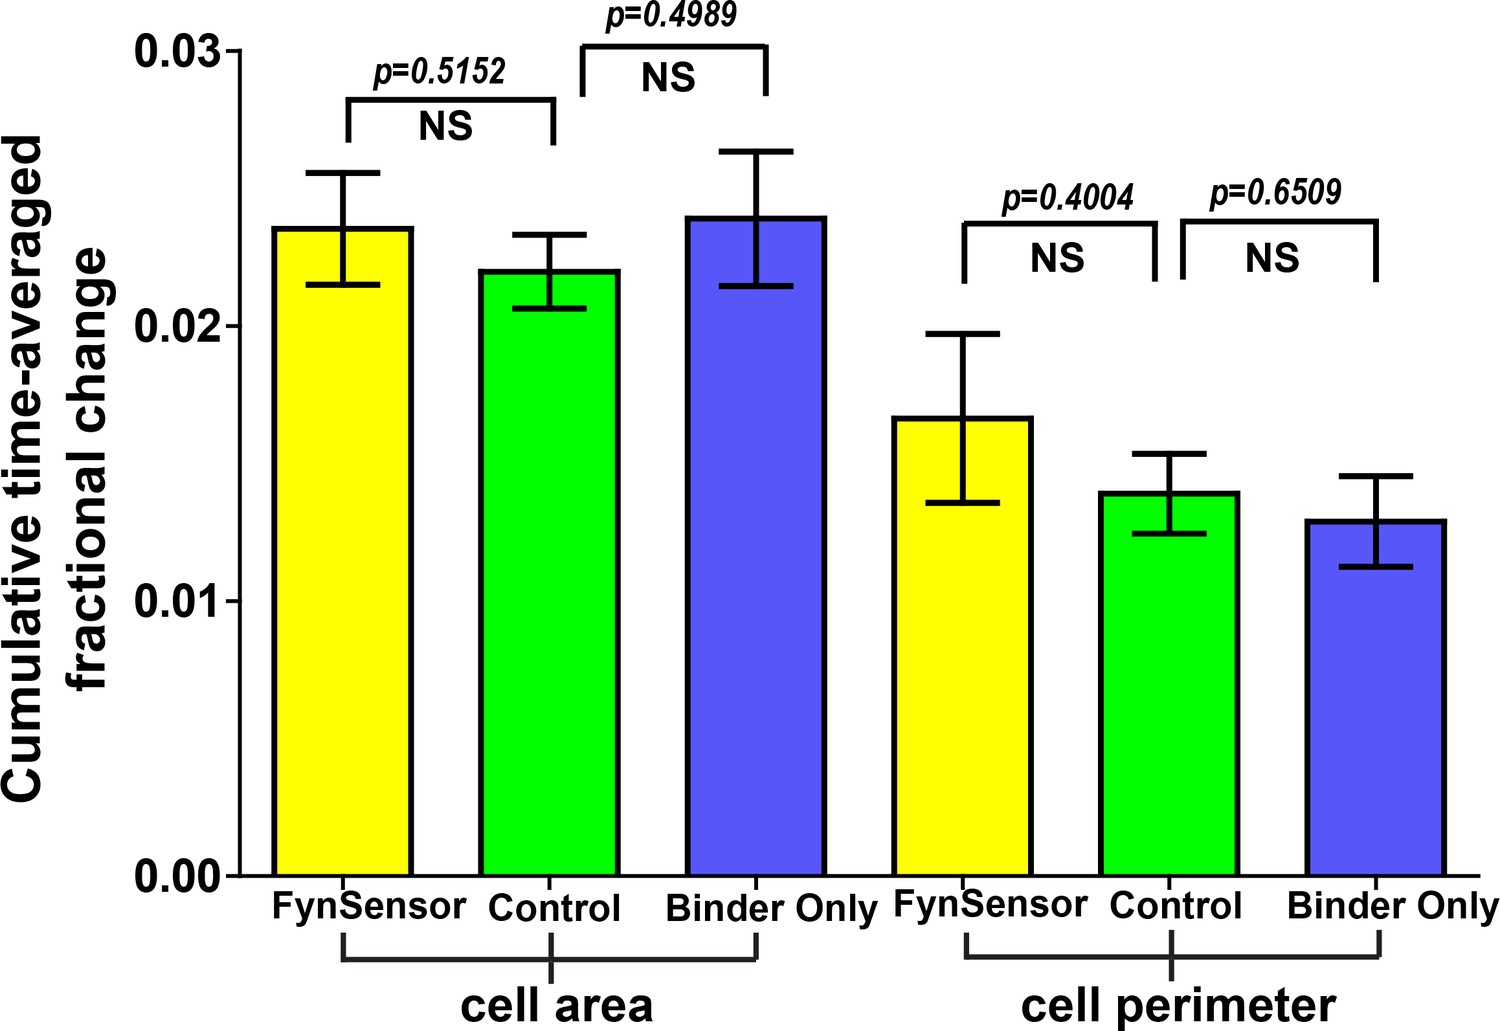
Cellular expression of FynSensor or Fyn binder ‘F29’ does not perturb cellular morphodynamics.
U2OS cells transiently expressing either FynSensor (mCer-Fyn + myr-mVenus-F29) or just myr-mVenus-F29 binder alone or a control fluorescent protein construct (myr-mVenus) were imaged and two morphodynamic parameters, namely, cumulative time-averaged change in cell area and cell perimeter were calculated through computer-aided quantitative image analysis. Details of the analysis are provided in the Materials and methods section. Under the imaging conditions used in this manuscript, the three image sets show no statistically significant differences, suggesting that the expression of FynSensor or the F29 binder has no measurable effect on cell morphodynamics. Values are mean ± s.e.m. Student’s two-tailed unpaired t-test has been used to determine the p-value. N = 8 cells for FynSensor, n = 11 for control cells and n = 10 for binder only.
-
Figure 3—figure supplement 7—source data 1
Quantification of cell-perimeter and area in FynSensor expressing cells.
- https://cdn.elifesciences.org/articles/50571/elife-50571-fig3-figsupp7-data1-v1.xlsx
Figure 3—figure supplement 8
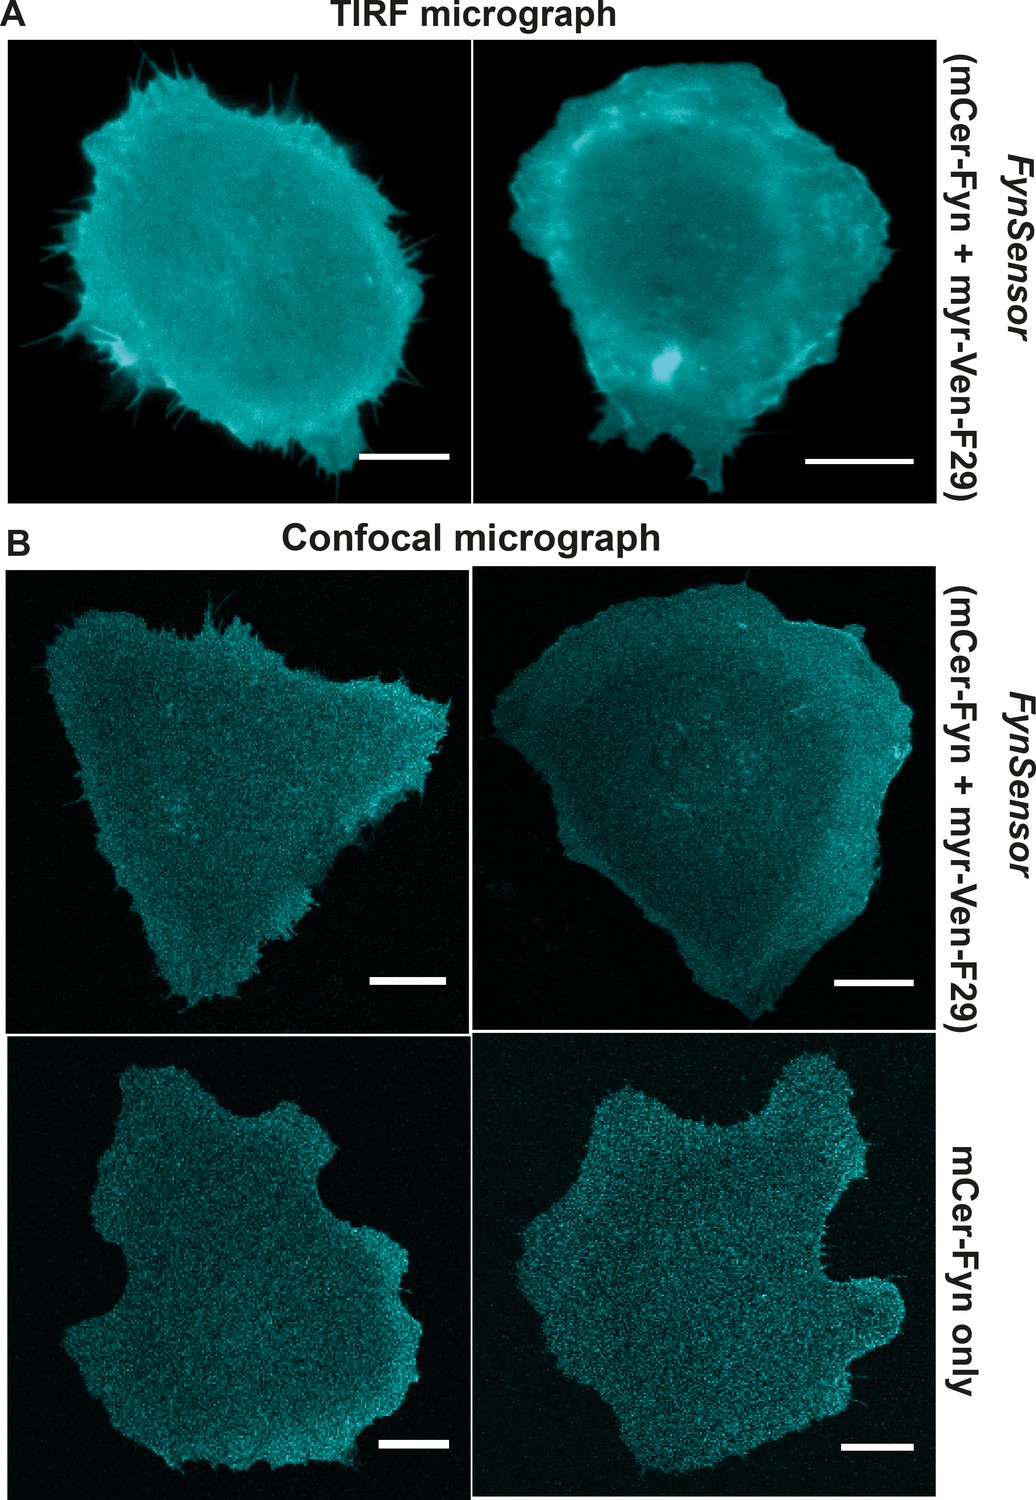
Labeled Fyn localization is unaffected by F29 binder.
Labeled FynSensor-Fyn (mCer-Fyn) kinase localizes to the plasma membrane in cells and the localization is not affected by presence of F29 binder. (A) Total internal reflection microscopy (TIRFM) micrographs of U2OS cells transiently transfected with FynSensor (mCer-Fyn and myr-mVenus-F29, FRET donor and acceptor) confirming plasma membrane localization of labeled mCer-Fyn. (B) Labeled Fyn localization is not effected by expression of binder (myr-mVenus-F29). Shown here are confocal micrographs depicting labeled Fyn localization with or without labeled F29 binder. U2OS cells were transiently transfected with either FynSensor (mCer-Fyn and myr-mVenus-F29, FRET donor and acceptor) or mCer-Fyn alone. (Scale bar = 10 µm).
Figure 3—figure supplement 9
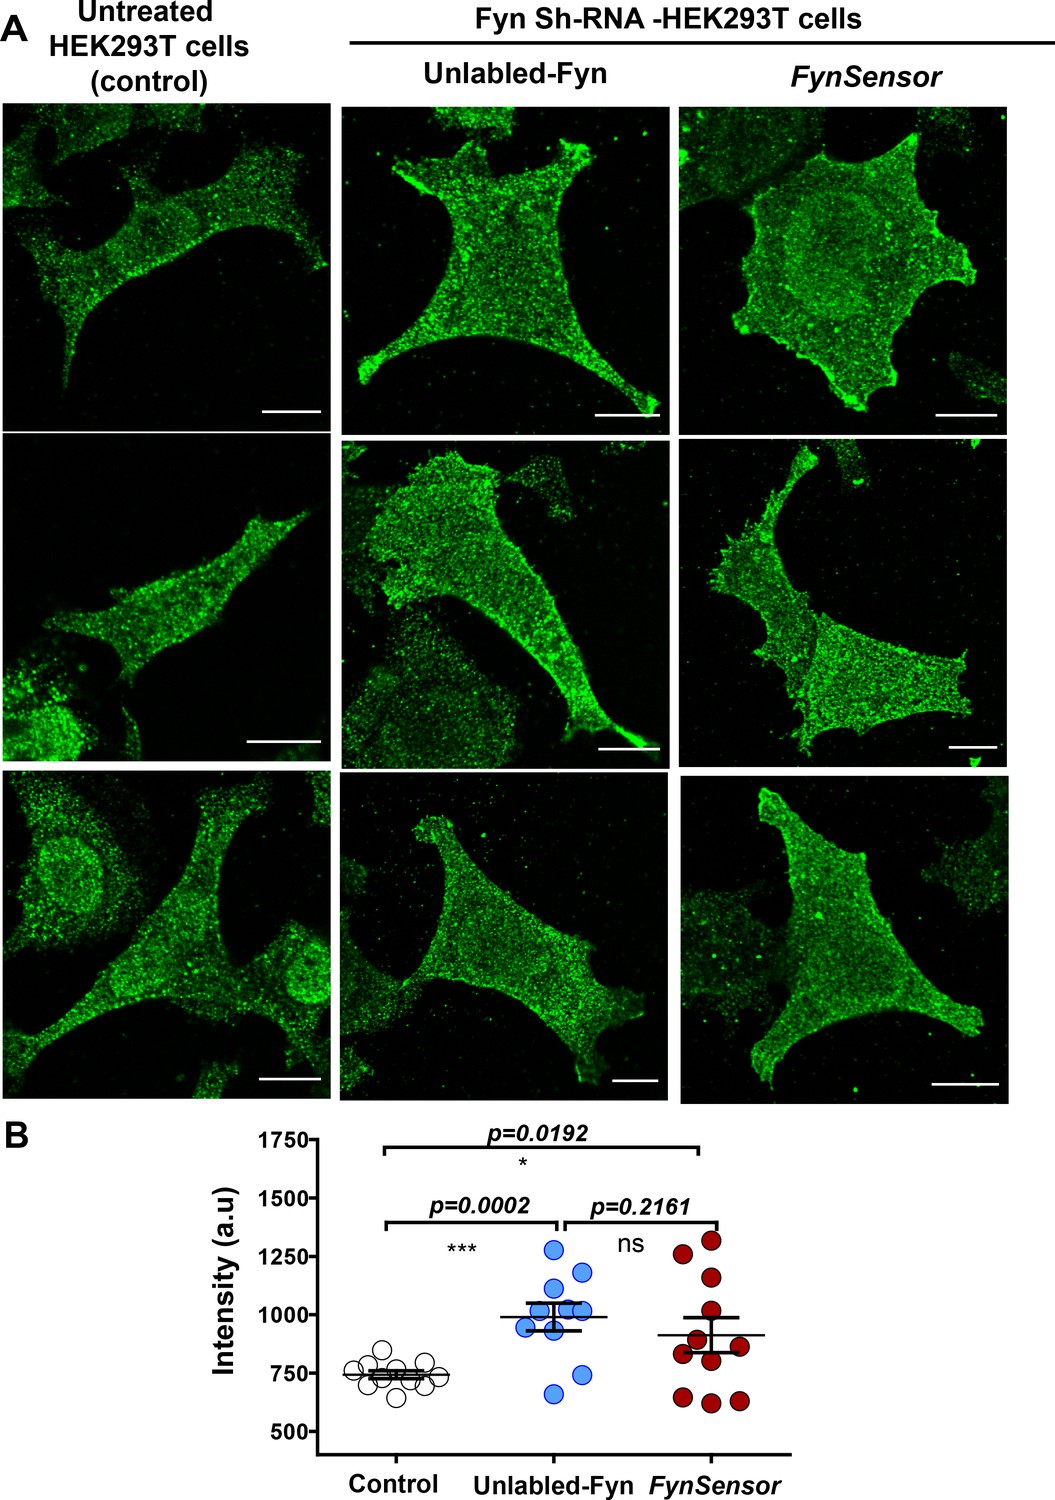
Ectopically expressed, labeled Fyn localization is similar to endogenous kinase.
Moderately overexpressed labeled Fyn (FynSensor) shows localization patterns similar to endogenous Fyn kinase. Levels and intracellular localization patterns of labeled Fyn (FynSensor) as well as wild-type, unlabeled Fyn ectopically expressed in Fyn-deficient HEK-293T cells were compared to endogenous Fyn in untreated HEK-293T cells. (A) Immunofluorescence confocal micrographs (green LUT) showing Fyn expression/localization (anti-Fyn) in untreated cells, Fyn-KD HEK293T cells transiently transfected with either FynSensor (mCer-Fyn + myr-mVen-F29) or unlabeled Fyn kinase (wt). Expression and plating conditions used are identical to those used for FynSensor imaging, see Materials and methods. Cells were stained with Anti-Fyn (mouse) primary antibody as well as Alexa Flour-647 conjugated anti-mouse secondary antibodies. (B) Scatter-plot showing the levels of Fyn immunofluorescence from multiple single cells. Values are mean ± s.e.m. Student’s unpaired one-tailed t-test has been used to determine the p-value. Scale bar = 10 µm.
-
Figure 3—figure supplement 9—source data 1
Quantification of labeled Fyn expression levels in Fyn-KD HEK 293 T cells relative to endogenous kinase levels in control cells.
- https://cdn.elifesciences.org/articles/50571/elife-50571-fig3-figsupp9-data1-v1.xlsx
Figure 3—figure supplement 10
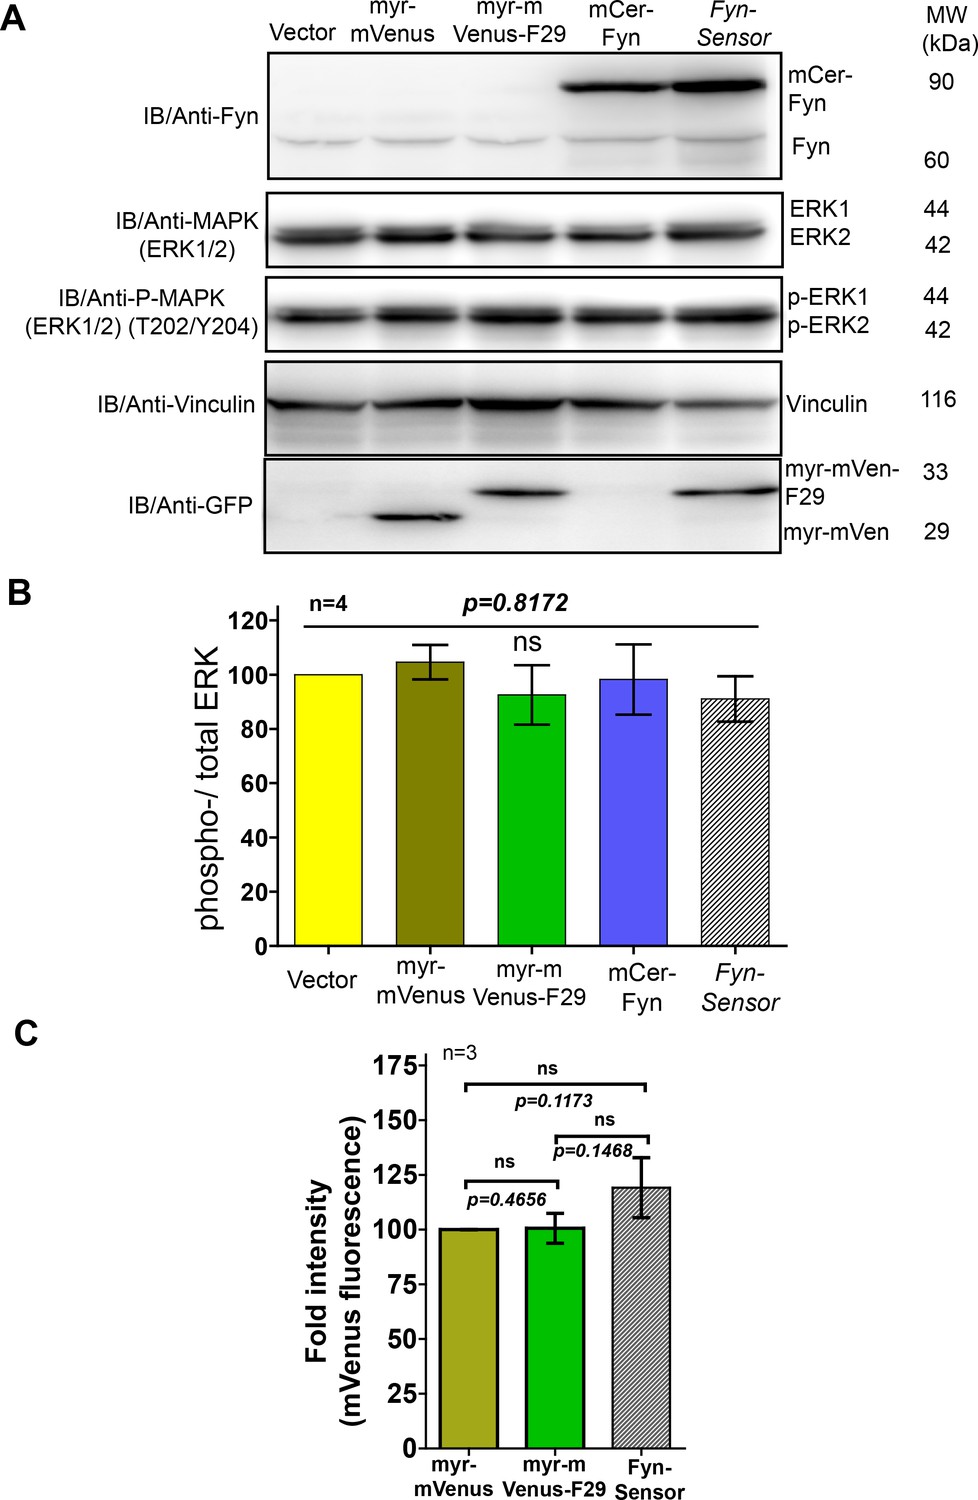
FynSensor, labeled Fyn and F29 binder do not perturb downstream signalling at the expression levels used for FynSensor imaging in U2OS cells.
Expression of neither FynSensor (mCer-Fyn + myr-mVenus-F29), labeled Fyn (mCer-Fyn) nor labeled F29 (myr-mVenus-F29) alone perturb downstream signaling in U2OS cells, as measured through ERK phosphorylation levels. (A) Immunoblot showing levels of phosphorylated (anti-p-ERK) and total ERK (anti-ERK) in U2OS cells expressing either FynSensor, labeled Fyn (mCer-Fyn), labeled F29 (myr-mVenus-F29), a myristoyl-tagged-mVenus or a vector control. Also shown are levels of Fyn (anti-Fyn) and vinculin (anti-vinculin, control) as well as levels of myr-mVenus-F29 and myr-mVenus (anti-GFP). (B) Measurement of levels of ERK phosphorylation in cells expressing either FynSensor, labeled Fyn, labeled F29, a myristoyl-tagged-mVenus or a vector control. Graphs showing ratios of phospho-/total-ERK from immunoblot band densities from three independent experiments (n=3). No significant changes were seen in ERK phosphorylation levels. The pairs of means were tested using Newman-Keuls test in one-way ANOVA. The corresponding p values are shown on respective panels. Values are mean ± s.e.m. (C) F29 binder levels were similar in all conditions where the binder was expressed. Bar graph shows mVenus fluorescence from transiently transfected U2OS cells expressing either myr-mVenus, myr-mVenus-F29 or FynSensor. Average intensities of four different user-defined ROIs from three independent experiments (n=3) have been plotted using GraphPad Prism. Values are mean fluorescent intensity ± s.e.m. Student’s unpaired one-tailed t-test has been used to determine the p-value.
-
Figure 3—figure supplement 10—source data 1
Quantification of phophorylated and total ERK levels in FynSensor expressing U2OS cells.
- https://cdn.elifesciences.org/articles/50571/elife-50571-fig3-figsupp10-data1-v1.xlsx
Figure 3—figure supplement 11
FynSensor, labeled Fyn and F29 binder do not perturb downstream signaling in C2C12 cells.
Under expression levels (carefully quantified here) used for biosensor imaging in C2C12 cells, the FynSensor labeled Fyn (mCer-Fyn) does not perturb downstream signalling as measured through ERK phosphorylation. (A) Immuno blot assay performed on cells transiently transfected with the FynSensor DNA constructs (same as used for biosensor imaging; donor: acceptor ratio, 1:2) and probed with Anti-Fyn antibody. Here, five immunoblots (I–V) are shown where mCer-Fyn (90 kDa) band has been marked with blue arrowhead and endogenous Fyn band is marked with grey arrowhead. For each case (I–V), the band intensity mCer-Fyn was compared with endogenous Fyn and plotted using GraphPad Prism and shown in a Box-and-Whisker plot. Data from five blots (I–V) analysed using Student’s unpaired one tailed t-test on GraphPad Prism (respective p values are indicated on panel). Average from FIVE independent experiments (n=5) show that mCer-Fyn is expressed at levels ~ 1.8 fold compared to the endogenous Fyn kinase. Imaging data in manuscript (see Figures 6B and 7B, (E) show that Fyn activity patterns revealed by FynSensor remain the same, independent of mCer-Fyn expression in this current expression range. Expression of neither FynSensor (mCer-Fyn + myr-mVenus-F29), labelled Fyn (mCer-Fyn) nor labeled F29 (myr-mVenus-F29) alone perturb downstream signaling in C2C12 myoblast cells, as measured through ERK phosphorylation levels. (B) Immunoblot showing levels of phosphorylated (anti-p-ERK) and total ERK (anti-ERK) in C2C12 cells expressing either FynSensor, labeled Fyn (mCer-Fyn), labeled F29 (myr-mVenus-F29), a myristoyl-tagged-mVenus or a vector control. Also shown are levels of Fyn (anti-Fyn) and vinculin (anti-vinculin, control) as well as levels of myr-mVenus-F29 and myr-mVenus (anti-GFP). (C) Measurement of levels of ERK phosphorylation in cells expressing either FynSensor, labelled Fyn, labeled F29, a myristoyl-tagged-mVenus or a vector control. Graphs showing ratios of phospho-/total-ERK from immunoblot band densities from three independent experiments (n=3). No significant changes were seen in ERK phosphorylation levels. The pairs of means were tested using Newman-Keuls test in one-way ANOVA. The corresponding p values are shown on respective panels. Values are mean ± s.e.m.
-
Figure 3—figure supplement 11—source data 1
Quantification of phosphorylated and total ERK levels in FynSensor expressing C2C12 cells.
- https://cdn.elifesciences.org/articles/50571/elife-50571-fig3-figsupp11-data1-v1.xlsx
Figure 4 with 1 supplement
FynSensor allows direct visualization of spatially localized active Fyn in cells.
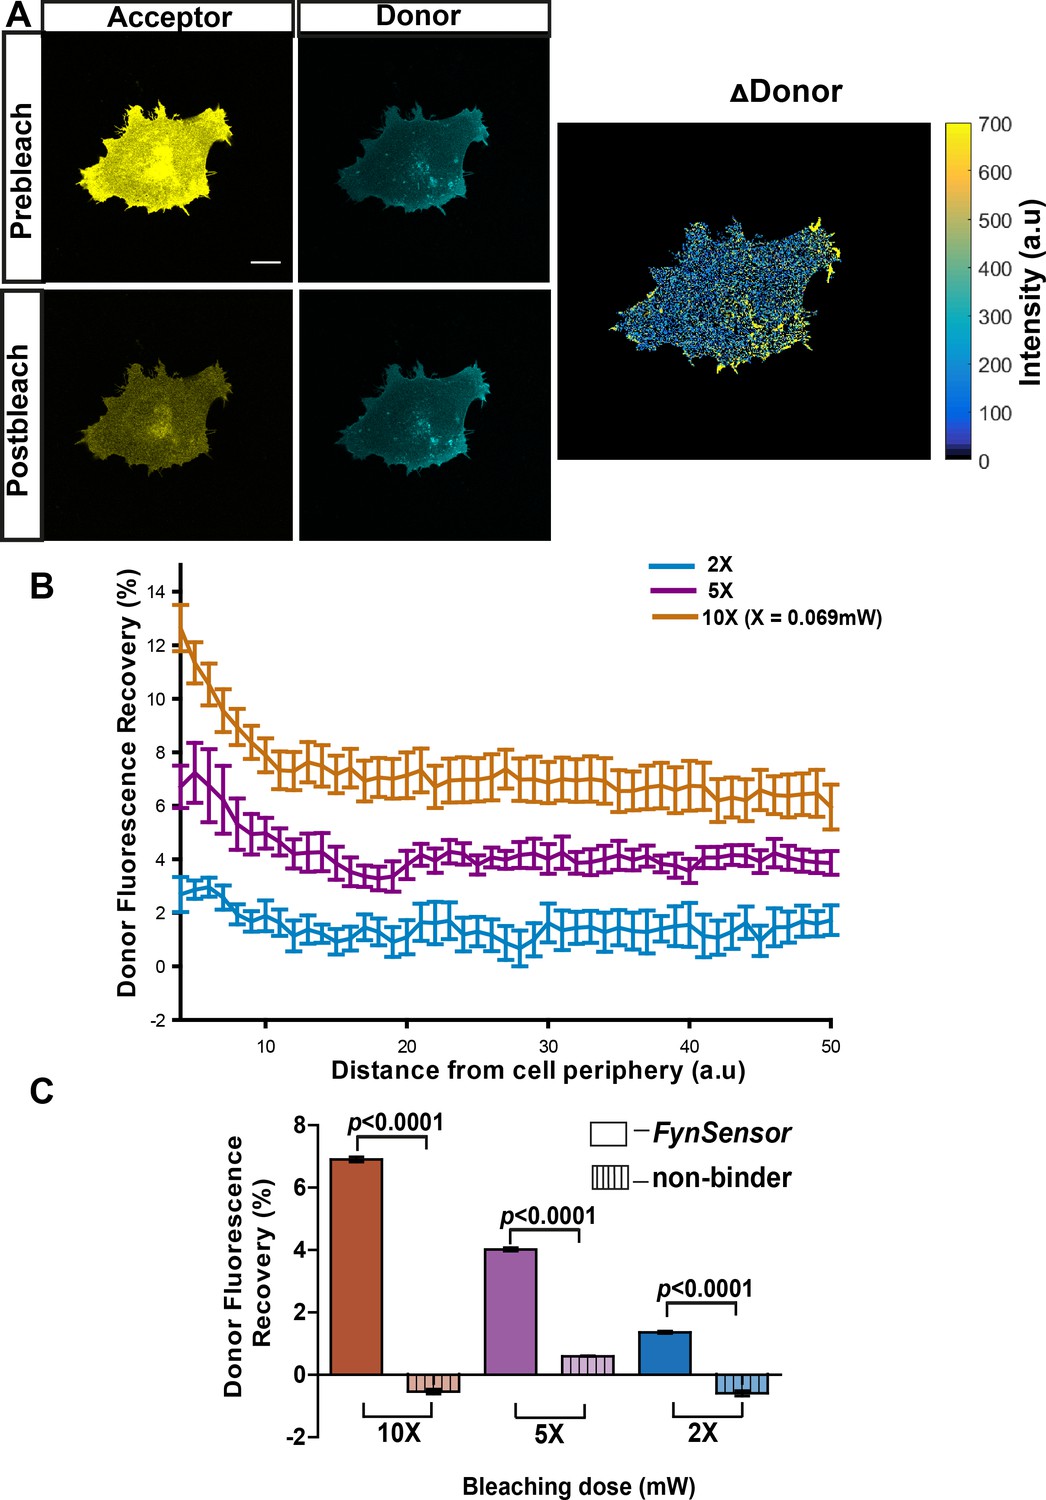
Acceptor photo-bleaching (APB) experiment for visualizing active Fyn in U2OS cells co-expressing FRET donor (Fyn WT) and acceptor (myr-mVenus-F29) FynSensor constructs. (A) APB shows cellular FRET and localized Fyn activity. Representative figure shows donor and acceptor fluorescence images, prior to and after laser-based bleaching of acceptor with 514 nm laser pulse. Also shown is the corresponding ∆Donor image (see Materials and methods) (Scale bar = 10 μm). APB experiments reveal areas showing greater recovery of donor fluorescence after APB indicating spatially localized Fyn activity (B) APB-induced recovery of donor fluorescence is greater at the cell periphery and sensitive to bleaching light dosage. Percentage recovery of donor fluorescence in FynSensor-expressing cells, after acceptor photobleaching at different light dosage (using Equation 2, see Materials and methods), plotted as a function of distance from the cell edge. Extent of recovery also shown at different light dosage. Bleaching is carried out for 10 s using the 514 nm laser line at 2X, 5X and 10X doses (X = 0.069 mW). Lines represent mean of n = 14 cells for 10X, n = 9 cells for 5X, n = 7 cells for 2X, respectively. Values are mean ± s.e.m. (C) FRET signal measured through the APB method is specific (binding dependent) as well as sensitive to APB light doses. Cumulative APB-induced percentage recovery of donor fluorescence observed at the cell periphery in FynSensor-expressing cells (as in B), plotted as a function of light dosage (solid bars). Also, shown extent of recovery when donor-labeled Fyn is used with acceptor-labeled non-binding P41A mutant of F29 (dashed bars). Extent of recovery with non-binding control is minimal and significantly lower than observed for F29 FynSensor. Bars represent mean of n = 14 cells for 10X, n = 9 cells for 5X and n = 7 cells for 2X when binder/F29 is used and n = 14 cells for 10X, n = 10 cells for 5X and n = 8 cells for 2X when non-binder/F29P41A is used, respectively. Student’s unpaired one-tailed t-test was used to determine the p-value. Graph was made using GraphPad Prism. Values are mean ± s.e.m.
-
Figure 4—source data 1
Light dosage-dependence of donor fluorescence recovery in acceptor photo-bleaching experiment with F29 biosensor.
- https://cdn.elifesciences.org/articles/50571/elife-50571-fig4-data1-v1.xlsx
-
Figure 4—source data 2
Light dosage-dependence of donor fluorescence recovery in acceptor photo-bleaching experiment with F29 biosensor and non-binding mutant.
- https://cdn.elifesciences.org/articles/50571/elife-50571-fig4-data2-v1.xlsx
Figure 4—figure supplement 1

FynSensor FRET readout is sensitive to kinase activity of Fyn.
FynSensor FRET signal is significantly attenuated when FynSensor expressing cells are treated with an inhibitor of Fyn (SFK) activity. Plotted here is the recovery of donor (mCer-Fyn) fluorescence (425–500 nm) when FynSensor expressing cells are subject to photobleaching at 514 nm, corresponding to absorption wavelength of the acceptor (mVenus-F29 binder). The extent of this recovery is measured as a function of distance from cell periphery. Acceptor-photobleaching (APB) of FynSensor expressing U2OS cells causes a recovery in donor fluorescence showing clear FRET in live cells. This FRET signal (Fyn activity) is observed to be higher at the cell periphery. However, cells treated with 2 µM of SU6656 inhibitor (n = 3 cells) fail to show a similar pattern of recovery of donor fluorescence after APB. Therefore, the FynSensor cellular FRET signal is significantly attenuated on inhibitor treatment. On the contrary, cells treated with DMSO (vehicle control) (n = 4 cells) show an APB-induced recovery of donor fluorescence similar to untreated cells (n = 3 cells). Values are mean ± s.e.m.
-
Figure 4—figure supplement 1—source data 1
Quantification of donor fluorescence recovery after acceptor photo-bleaching in cells treated with SFK inhibitor.
- https://cdn.elifesciences.org/articles/50571/elife-50571-fig4-figsupp1-data1-v1.xlsx
Figure 5 with 6 supplements
FynSensor reveals integrin-dependent Fyn activity to be spatially compartmentalized.
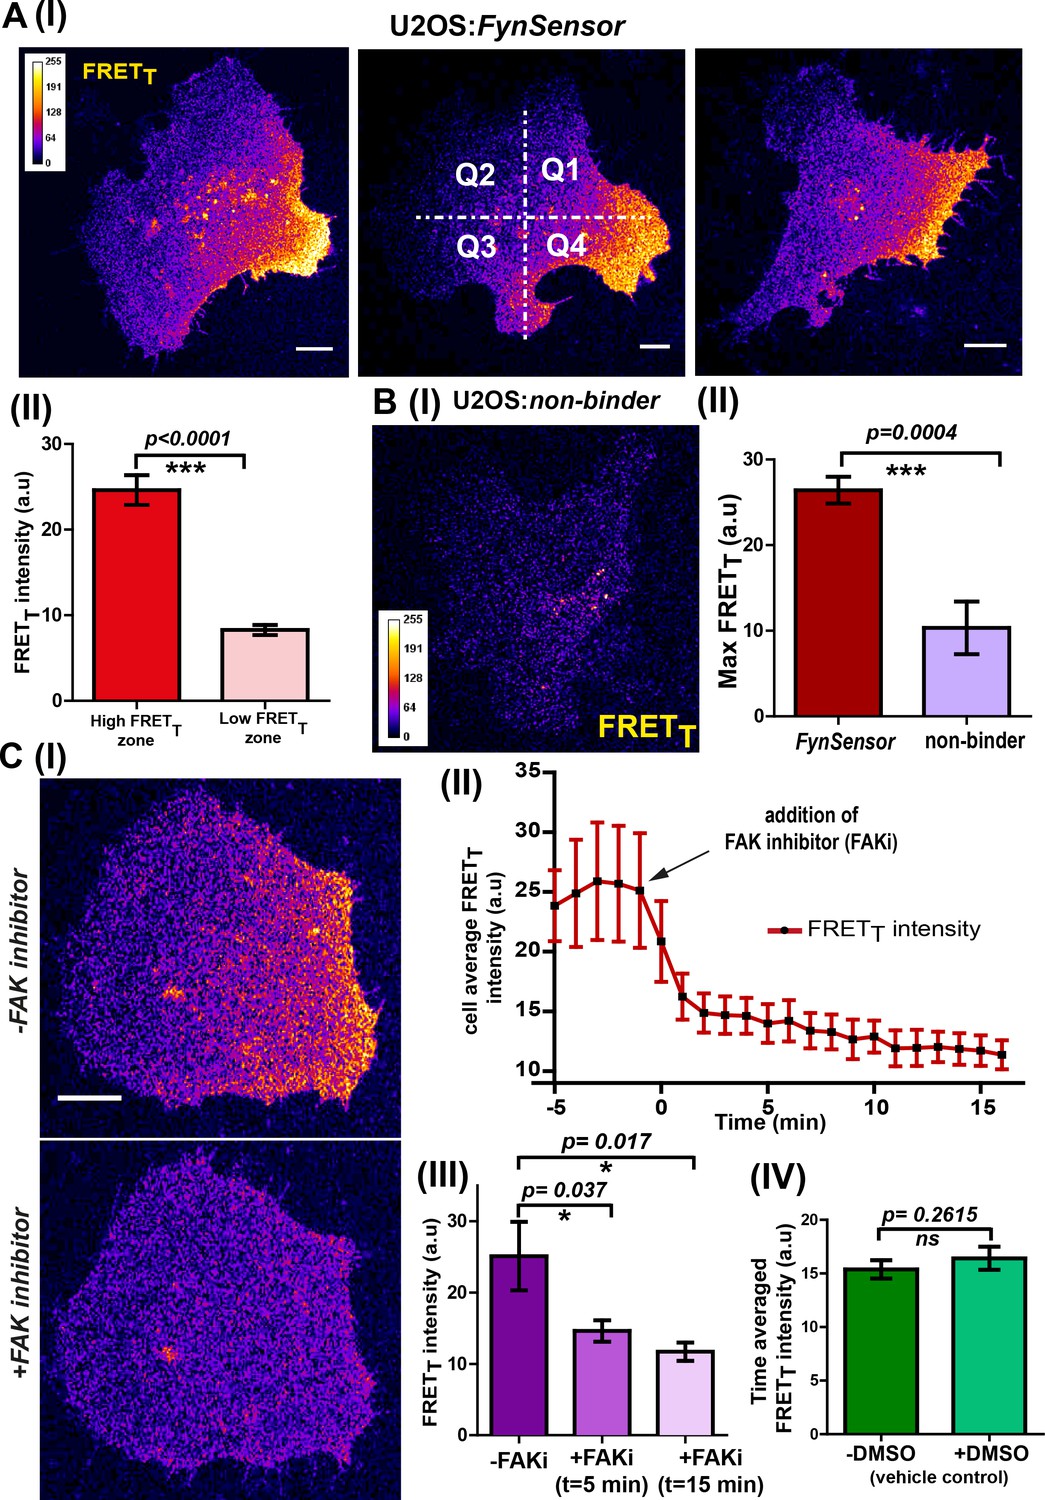
(A) Spontaneous formation of zones enriched in active Fyn is seen in serum starved cells plated on fibronectin (FN). (I) Representative confocal fluorescence micrographs showing sensitized emission (total FRET: FRETT) levels indicative of active Fyn in serum starved-U2OS cells expressing FynSensor (Scale bar = 10 μm). For quantitative image analysis of compartmentalized Fyn activity, we have divided the cell into quadrants labelled as Q1-Q4 as shown. (II) Bar graph comparing FynSensor FRET levels in distinct cellular zones. The mean of Max-FRETT-HFQ (HFQ: high-FRET quadrant, Q4 in panel I) and Max-FRETT-LFQ (LFQ: low-FRET quadrant, Q2 in I) values (see Materials and methods) are plotted. Values are mean ± s.e.m. Student’s paired one-tailed t-test has been used to determine the p-value (n = 37 cells). (B) FynSensor FRET readout is dependent on F29 binding Fyn, with the non-binding control mutant of F29 (P41A) showing no or significantly reduced FRETT signal compared to FynSensor. (I) Confocal fluorescence micrographs showing sensitized emission (total FRET: FRETT) levels for cells expressing mCer-Fyn and non-binding control binder mVenus-F29 P41A. (II) Comparison of FRETT levels for FynSensor with non-binding control. The bar graph shows the average maximum FRETT obtained (Max-FRETT-HFQ) for non-binder (n = 5 cells) and FynSensor (n = 37 cells). Values are mean ± s.e.m. Student’s unpaired one tailed-t-test was used to determine the p-value. (C) Fyn activity levels are sensitive to inhibition of focal adhesion kinase (FAK), a known mediator of integrin signaling. (I) Confocal fluorescence micrographs showing FynSensor FRETT levels before and after treatment with 10 μM of FAK inhibitor (PF 562271). Loss of basal Fyn activity is observed in cells when treated with inhibitor but not with DMSO (vehicle control). (II) Time course of Fyn activity in response to FAK inhibition. Average fluorescence intensity profile (FRETT) of FynSensor cells (n = 5) over time, before and after addition of FAK inhibitor. (Scale bar = 10 μm). (III) Quantifying FynSensor FRET on FAK inhibition. Bar graph shows the average FRETT intensity of cells before FAK inhibitor treatment (-FAKi), five mins after FAKi treatment and 15 mins after FAKi treatment (n = 5 cells). Values are mean ± s.e.m. Student’s paired one tailed-t-test was used to determine the p-value. (IV) FAK-inhibitor induced reduction in FynSensor FRET levels is NOT seen with vehicle control. Bar graph shows time-averaged, mean cell FRETT intensity before and after treatment with the vehicle control (n = 8 cells). Values are mean ± s.e.m. Student’s paired one tailed-t-test was used to determine the p-value.
-
Figure 5—source data 1
Quantification of FynSensor FRET levels in low and high activity zones in U2OS cells.
- https://cdn.elifesciences.org/articles/50571/elife-50571-fig5-data1-v1.xlsx
-
Figure 5—source data 2
Quantification of FynSensor non-binding control FRET levels in low and high activity zones in U2OS cells.
- https://cdn.elifesciences.org/articles/50571/elife-50571-fig5-data2-v1.xlsx
-
Figure 5—source data 3
Quantification of FynSensor FRET levels in cells in treated with FAK inhibitor.
- https://cdn.elifesciences.org/articles/50571/elife-50571-fig5-data3-v1.xlsx
Figure 5—figure supplement 1
FynSensor FRET readout is highly sensitive to F29 binding to Fyn kinase in cells. Non-binding mutant of FynSensor fails to show significant FRET response.
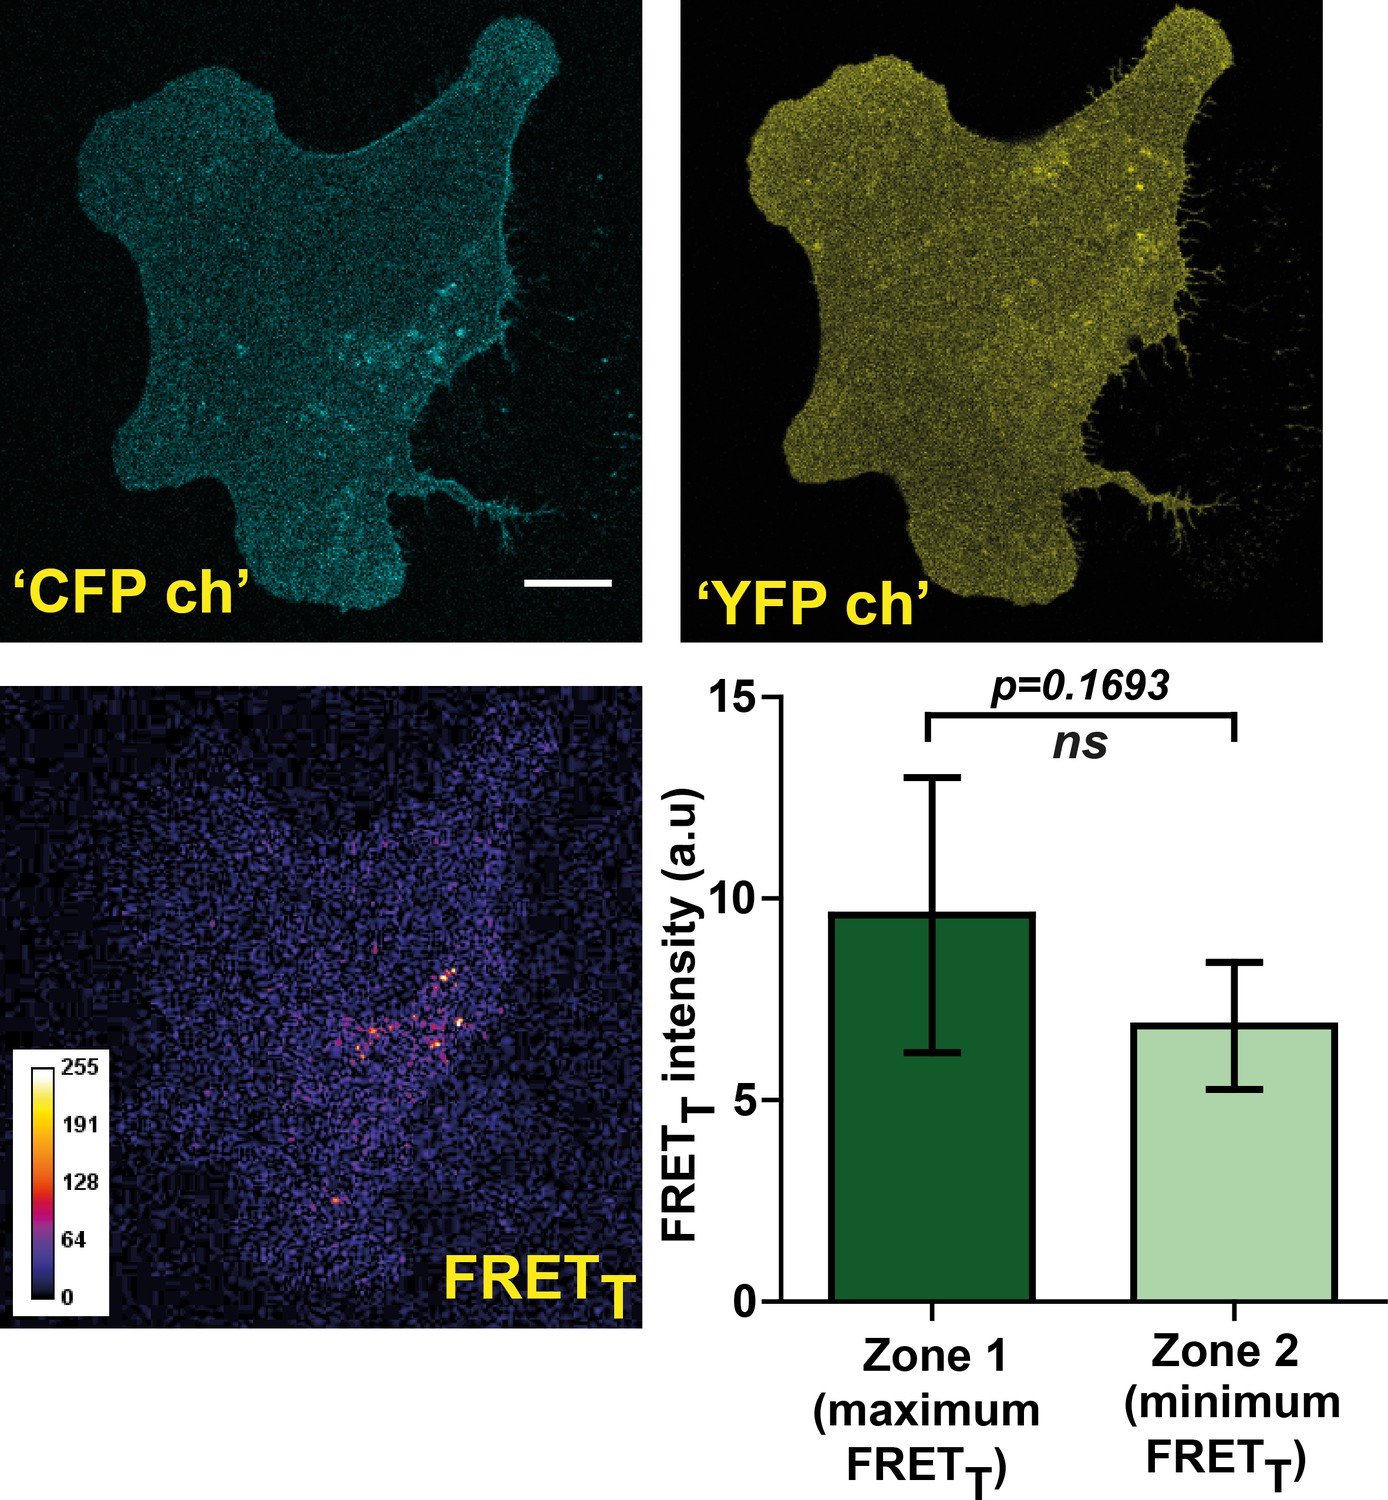
FynSensor FRET readout is dependent on F29 binding Fyn, with the non-binding control mutant of F29 (P41A) showing no or significantly reduced FRETT signal. Confocal fluorescence micrographs showing Donorex-Donorem, Acceptorex-Acceptorem and corresponding FRETT (sensitized emission) images for U2OS cells expressing mCer-Fyn and non-binding control binder mVenus-F29 P41A (marked as ‘CFP ch’, ‘YFP ch’ and ‘FRETT’ respectively). These images confirm that mCer-Fyn and non-binding control constructs are co-expressed in these cells and show expected ‘CFP’ and ‘YFP’ fluorescence on direct excitation. However, for non-binding control cells little or no FRET (sensitized emission) is seen. This lack of FRET shows that the FynSensor response is indeed specific and is dependent on F29 binding to activated Fyn. Also, plotted here is the average difference in FRETT levels between intracellular zones showing maximum and minimum FRETT (bottom right panel). Unlike the cells expressing FynSensor, non-binder expressing U2OS cells (n = 5 cells) do not show any discernible spatially compartmentalized kinase activity pattern. Values are mean ± s.e.m. Student’s paired one tailed-t-test was used to determine the p-value.
-
Figure 5—figure supplement 1—source data 1
Quantification of F29 non-binding mutant FRET levels across cell zones.
- https://cdn.elifesciences.org/articles/50571/elife-50571-fig5-figsupp1-data1-v1.xlsx
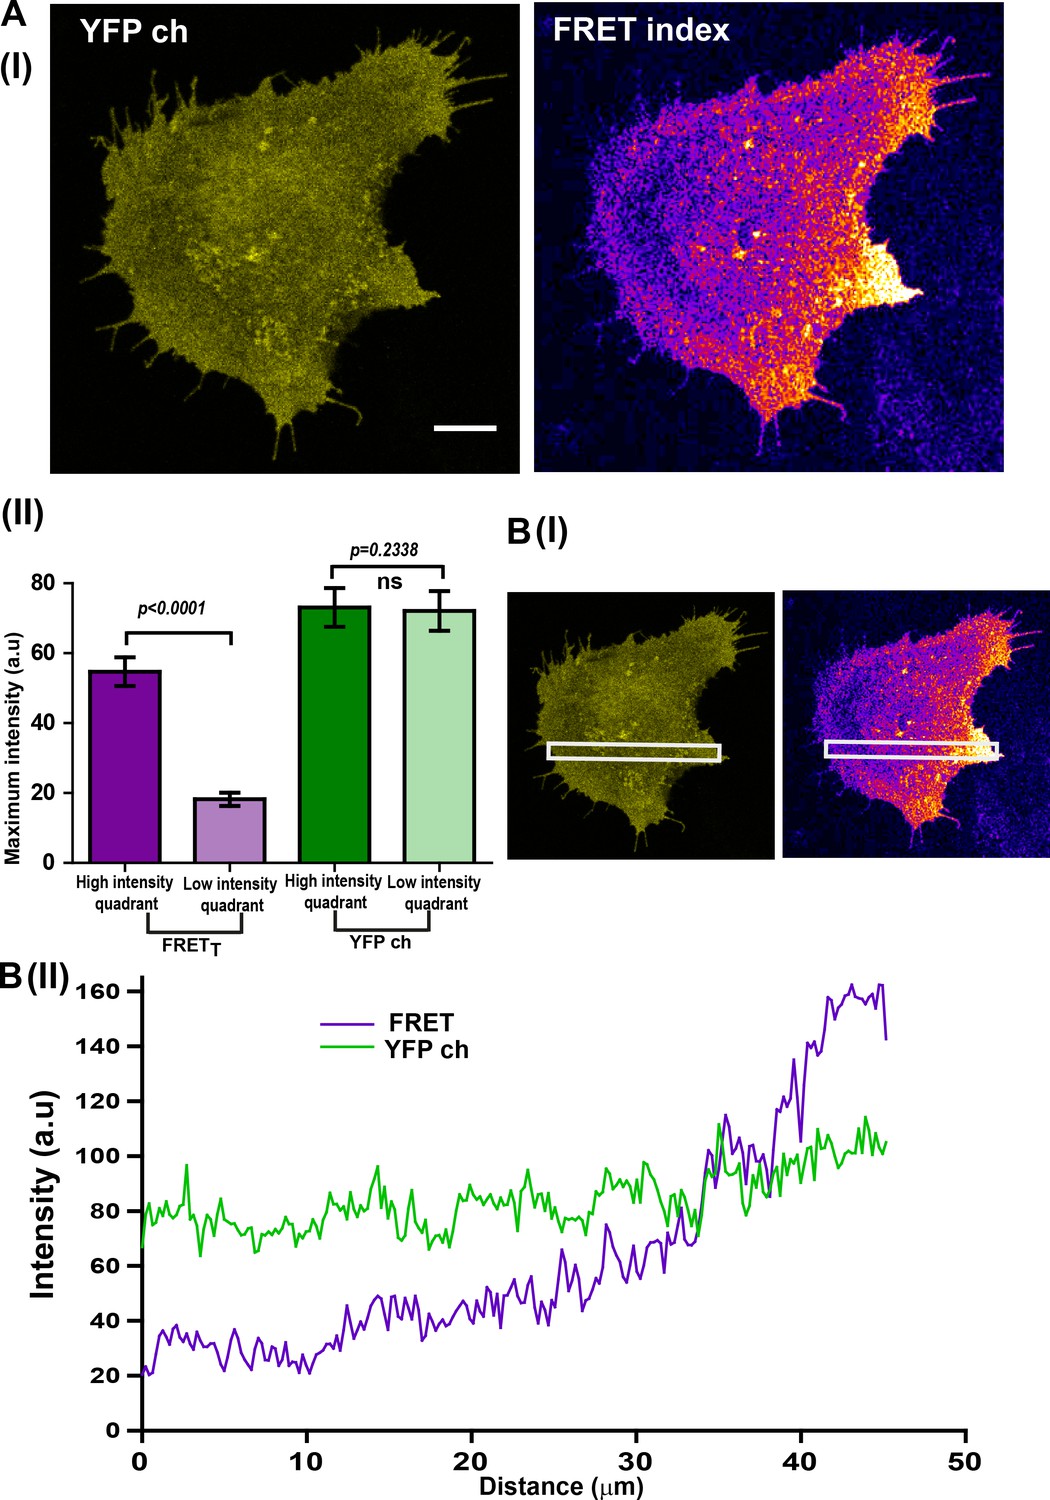
Figure 5—figure supplement 2
Localized Fyn activity (spatially localized FynSensor FRET) is not an artifact of binder localization.
(A) C2C12 cells showing localized Fyn activity (spatially localized FynSensor FRET), show a spatially uniform binder localization. Therefore, localized FRETT patterns are not determined by binder localization (I) Fluorescent confocal micrograph shows that while labeled F29 binder (myr-mVenus-F29; ‘YFP ch’) localizes nearly uniformly in cells, the FynSensor FRET index image clearly reveals a spatially-localized pattern of Fyn activity. (II) Quantitative comparison of average FRETT and ‘YFP ch’ (labeled F29) intensities in two distinct intracellular zones (quadrants). Quadrant analysis performed on both the YFP channel image and the FRET index image for each cell (refer to Materials and methods section for details) yielded the maximum ‘fluorescence intensity’ values from the ‘high FRETT quadrant (HFQ)’ and the ‘low FRETT quadrant (LFQ)’ in FRET index and ‘YFP ch’ images. Bar graph shows the average of these values from n = 32 cells. Student’s paired one tailed-t-test was used to determine the p-value. While there is a clear and significant difference in the FRETT levels across two intracellular zones (quadrants), fluorescence due to the binder across the cell (‘YFP ch’) remains constant. (B) Illustration of uniform binder localization in regions showing localized FRETT. (I) Fluorescent intensity scan across FRET and ‘YFP ch’ confocal micrographs to determine uniformity of signal. (II) Plots of average intensity values scanned across an extended cellular area (white box) for FRET index and ‘YFP ch’/binder alone images. While FRETT is spatially modulated, binder localization is uniform.
-
Figure 5—figure supplement 2—source data 1
Quantification of FynSensor and F29 localization levels across cell.
- https://cdn.elifesciences.org/articles/50571/elife-50571-fig5-figsupp2-data1-v1.xlsx
Figure 5—figure supplement 3
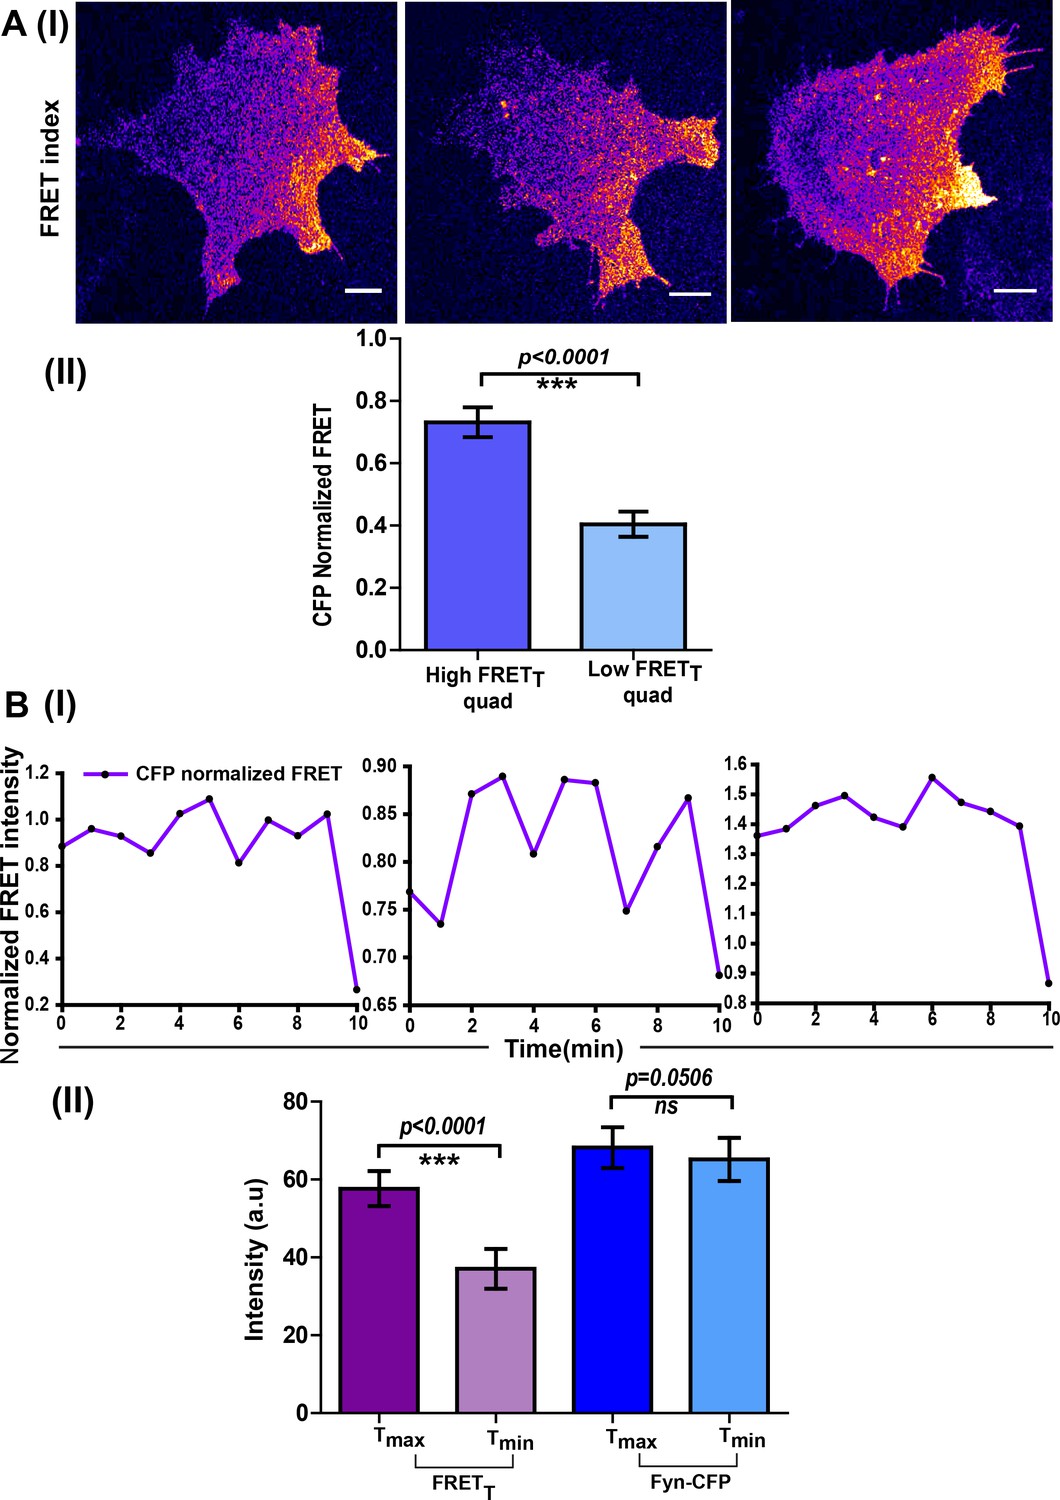
Spatio-temporal modulations in Fyn activity are not simply due to changes in local Fyn protein concentration.
(A) Spatially enhanced Fyn activity patterns are observed even when activation levels are normalized for any changes in local protein concentrations. This shows localized protein activation cannot simply be ascribed to increased protein accumulation. (I) FynSensor FRET index images (confocal micrographs) of 3 representative FynSensor expressing C2C12 cells showing localized Fyn activity. Specifically, intracellular zones with enhanced levels of active Fyn can be observed. (II) Bar graphs comparing the mean of maximum ‘CFP-normalized FRET’ intensity values (see Materials and methods) in both the high FRETT quadrant and low FRETT quadrant in serum starved. For mean, ‘CFP-normalized FRET’ values were averaged across the specified quadrant in a single cell and then across cells. ‘CFP normalized FRET’ quantifies Fyn activity normalized for changes in levels of labeled mCer-Fyn (protein concentration). For each cell, time point showing max FRETT was chosen. Values are mean ± s.e.m. Student’s one-tailed t-test has been used to determine the p-value (n = 32 cells). (B) Oscillations in Fyn activity oscillations are not due to fluctuations in local protein levels. (I) Normalized FynSensor FRET temporal profiles (FRETT normalized to mCerulean intensity/protein levels) also show the characteristic pulsatile signals as seen with FRETT. (II) While significant temporal oscillations are observed in Fyn activity, Fyn protein levels do not fluctuate similarly. Shown here is the extent of oscillations in FRETT (cell averaged differences between maximum and minimum FRETT levels observed over time, in the high-FRET cellular quadrant, HFQ). While significant changes in FRETT levels are observed, mCerulean (‘CFP ch’) fluorescence in the corresponding cellular zones remains largely constant over time. (n = 9 cells). Values are mean ± s.e.m. Student's paired one-tailed t-test has been used to calculate the p-value.
-
Figure 5—figure supplement 3—source data 1
Quantification of donor-normalized FRET levels in low and high activity zones.
- https://cdn.elifesciences.org/articles/50571/elife-50571-fig5-figsupp3-data1-v1.xlsx
-
Figure 5—figure supplement 3—source data 2
Comparison of FynSensor FRETT levels and Fyn kinase localization at different time points.
- https://cdn.elifesciences.org/articles/50571/elife-50571-fig5-figsupp3-data2-v1.xlsx
Figure 5—figure supplement 4
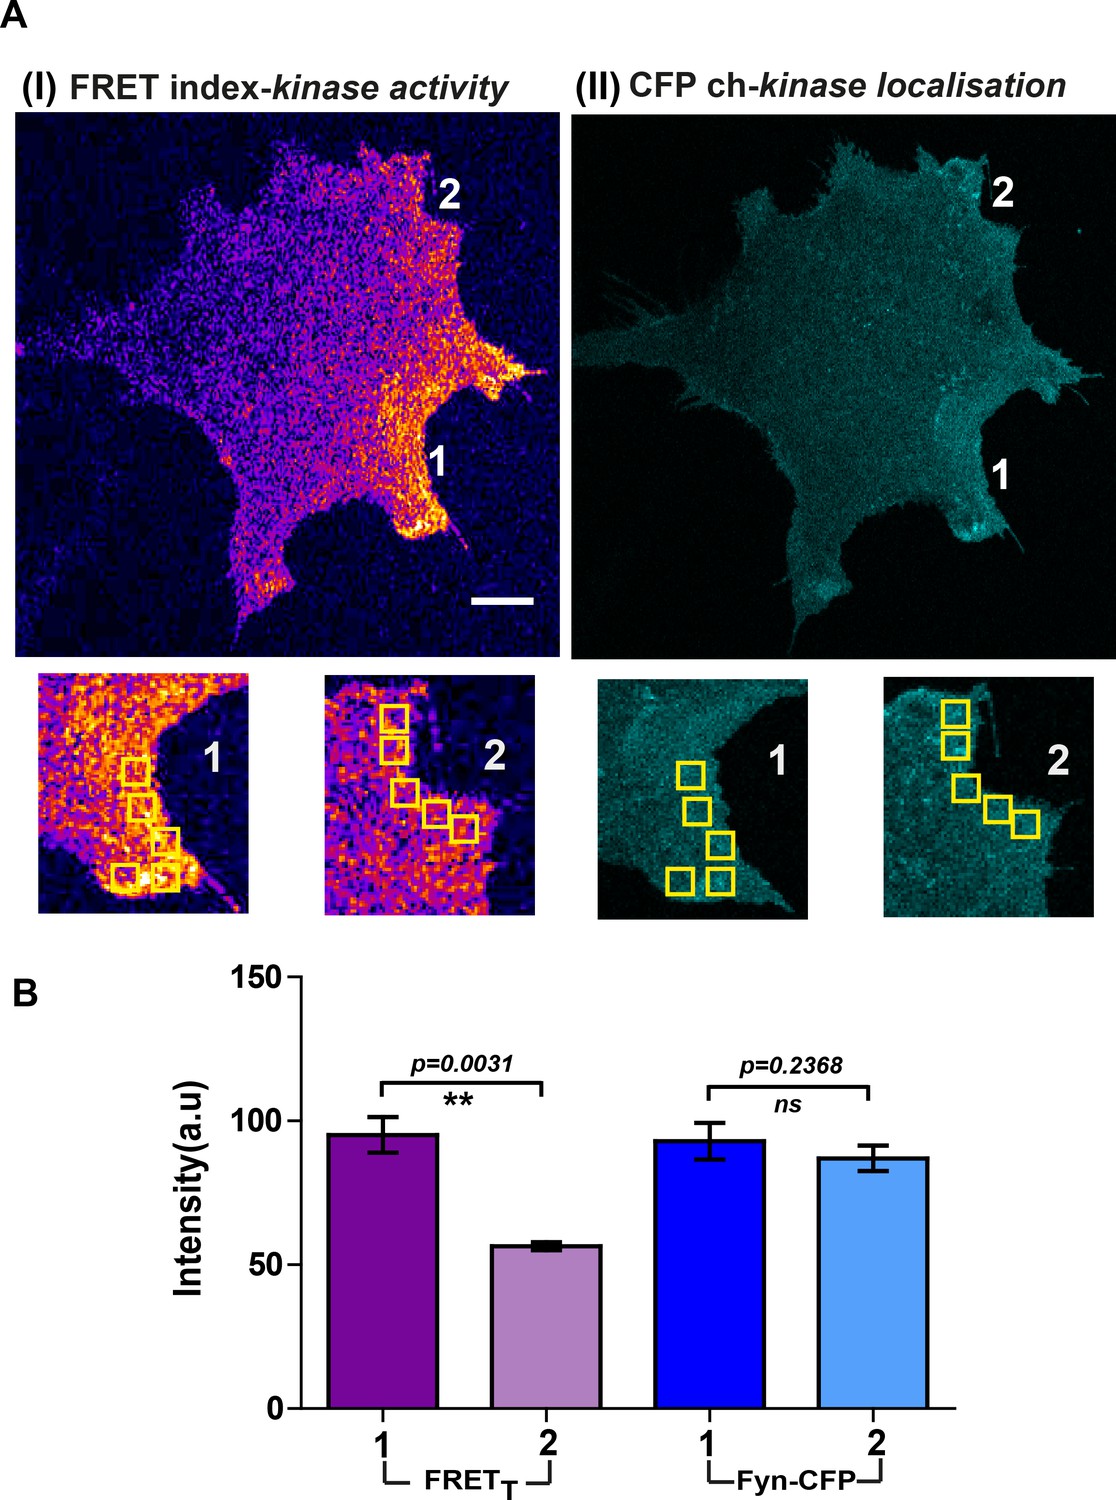
Localized Fyn activity patterns are distinct from patterns of Fyn localization.
Fyn localization does not equate with Fyn activity. (A) Confocal micrograph of FynSensor FRET index (Fyn activity, I) and ‘CFP ch’ (mCer-Fyn localization, II). Images showing intracellular zones (zones 1 and 2, enlarged and marked) with differing levels of FRETT (Fyn activity) but similar levels of labeled Fyn protein. (B) Plots quantifying and comparing levels of FRETT (activity) and mCerulean fluorescence (‘CFP ch’/protein concentration) between the highlighted intracellular zones 1 and 2 (bar represent mean of the 5 ROIs drawn in each zone, see A). Values are mean ± s.e.m. Student's paired one-tailed t-test has been used to calculate the p-value. Intracellular zones have significantly different FRETT levels but similar local concentrations of Fyn.
-
Figure 5—figure supplement 4—source data 1
Quantification of FRETT levels and kinase localization across selected cellular zones.
- https://cdn.elifesciences.org/articles/50571/elife-50571-fig5-figsupp4-data1-v1.xlsx
Figure 5—video 1
FRET response in human osteosarcoma cell-line, U2OS cells expressing non-binder mutant of FynSensor.
Live cell imaging of U2OS cells transfected with non-binder mutant of FynSensor before and after PDGF stimulation. Panel shows FRET index image using Fire LUT (Fiji) scaled appropriately for ease of visualization. Individual images were acquired at 60X at an interval of 30 s and then stitched together to make a video (played at 5 frames/second). Time stamp indicates elapsed time, ‘+PDGF’ label shows the point at which PDGF was added to the cells. Color bar shows intensity of FRET signal. No/very little FRET signal is seen from these cells and this FRET signal is not ‘enhanced’ post PDGF stimulation. Scale bar = 10 µm.
Figure 5—video 2
Effect of FAK inhibition on Fyn activity in human osteosarcoma cell-line, U2OS cells.
Live cell imaging of U2OS cells transfected with FynSensor before and after inhibition of FAK. Panel shows FRET index image using Fire LUT (Fiji) scaled appropriately for ease of visualization. Individual images were acquired at 60X at an interval of 60 s as part of a multi-point-time-lapse imaging regime and then stitched together to make a video (played at 3 frames/second). Time stamp indicates elapsed time, ‘+FAK inhibitor’ label shows the point at which FAK inhibitor was added to the cells. Colour bar shows intensity of FRET signal. Basal level of Fyn activity (unstimulated state) is highly localized in space. Post addition of inhibitor the Fyn activity in the cell is drastically attenuated. Scale bar = 10 µm.
Figure 6 with 2 supplements
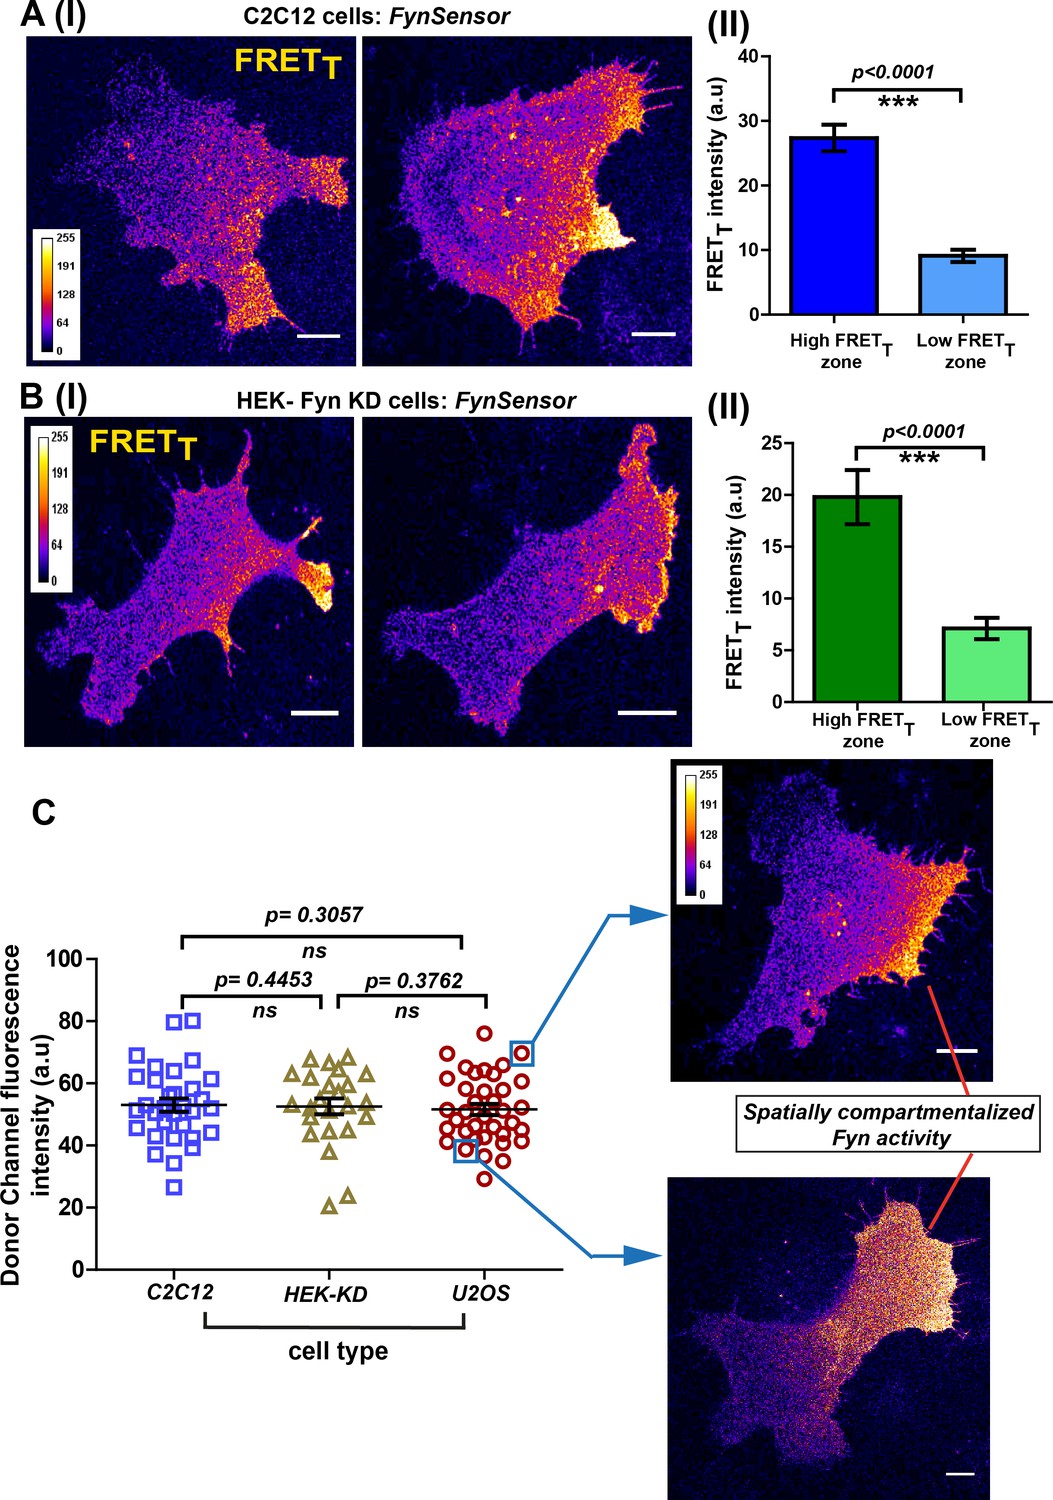
Conserved spatial pattern of Fyn activity in distinct cell-types.
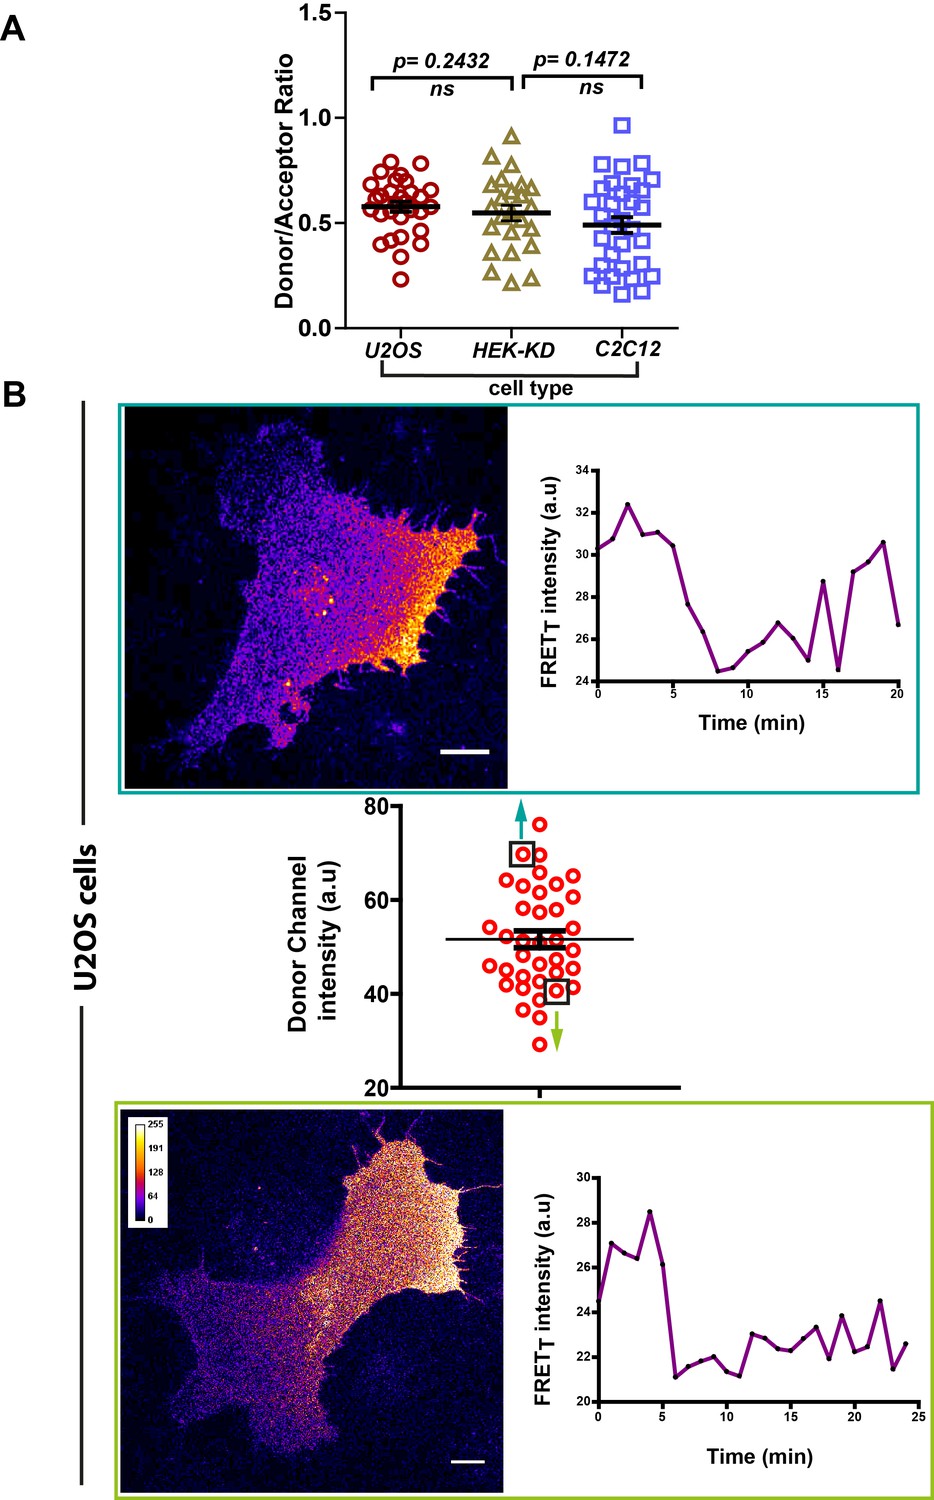
(A) FynSensor in mouse myoblast C2C12 cells reveals spontaneously compartmentalized Fyn activity, similar to that observed in U2OS cells. (I) Representative confocal fluorescence micrographs of serum-starved cells showing intracellular zones enriched with active Fyn when plated on FN (Scale bar = 10 μm). Quantitative image analysis, as previously described, yielded zones of high FRETT and low FRETT. (II) Bar graph comparing FynSensor FRET levels in distinct cellular zones. Graph compares the mean of Max-FRETT-HFQ and Max-FRETT-LFQ in serum-starved cells. Values are mean ± s.e.m. Student’s paired one-tailed t-test has been used to determine the p-value (n = 32 cells). (B) FynSensor imaging reveals spatially localized Fyn activity patterns when FynSensor is ectopically expressed in HEK293T Fyn-knockdown cells. (I) Confocal micrographs show zones of high and low FRETT, showing spatially localized Fyn activity, similar to that seen with U2OS and C2C12 myoblasts. (II) Bar graphs comparing the mean of Max-FRETT-HFQ and Max-FRETT-LFQ in serum-starved cells confirm differential FRET levels across intracellular zones. Values are mean ± s.e.m. Student’s paired one-tailed t-test has been used to determine the p-value (n = 24 cells). (C) Spatial patterns of locally enhanced Fyn activity revealed by FynSensor imaging are unaffected by FynSensor expression levels. FynSensor imaging reveals locally enhanced, compartmentalized Fyn activity independent of sensor expression levels. To assess the effect of kinase expression on the FRET patterns observed in all the distinct cell types, we quantified the donor (m-Cerulean) fluorescence intensity for all the cells used in our study. Scatter-plot comparing donor fluorescence across different cell types, n = 32 cells for C2C12, 37 for U2OS and 24 for HEK-KD cells. Mean ± s.e.m is denoted. Student’s unpaired one-tailed t-test has been used to determine the p-value. Representative cells from the U2OS data set, having either relatively ‘high’ (above the mean value of 51.61 ± 1.805 fluorescence intensity units, denoted by teal box) or ‘low’ (below the mean value, teal box) FynSensor expression (donor/m-Cer fluorescence intensities), show very similar spatially compartmentalized Fyn activity pattern, suggesting that the activity patterns observed in different cells are not subject to expression artifacts.
-
Figure 6—source data 1
Quantification of FynSensor FRET levels in low- and high-activity zones in C2C12 cells.
- https://cdn.elifesciences.org/articles/50571/elife-50571-fig6-data1-v1.xlsx
-
Figure 6—source data 2
Quantification of FynSensor FRET levels in low- and high-activity zones in Fyn-KD HEK293T cells.
- https://cdn.elifesciences.org/articles/50571/elife-50571-fig6-data2-v1.xlsx
-
Figure 6—source data 3
Quantification of expression of FynSensor-Fyn (mCer-Fyn) in different cell-types showing similar activity patterns.
- https://cdn.elifesciences.org/articles/50571/elife-50571-fig6-data3-v1.xlsx
Figure 6—figure supplement 1
Ectopic FynSensor expression in Fyn knockdown HEK-293T cells for ‘knockdown rescue’ biosensor imaging.
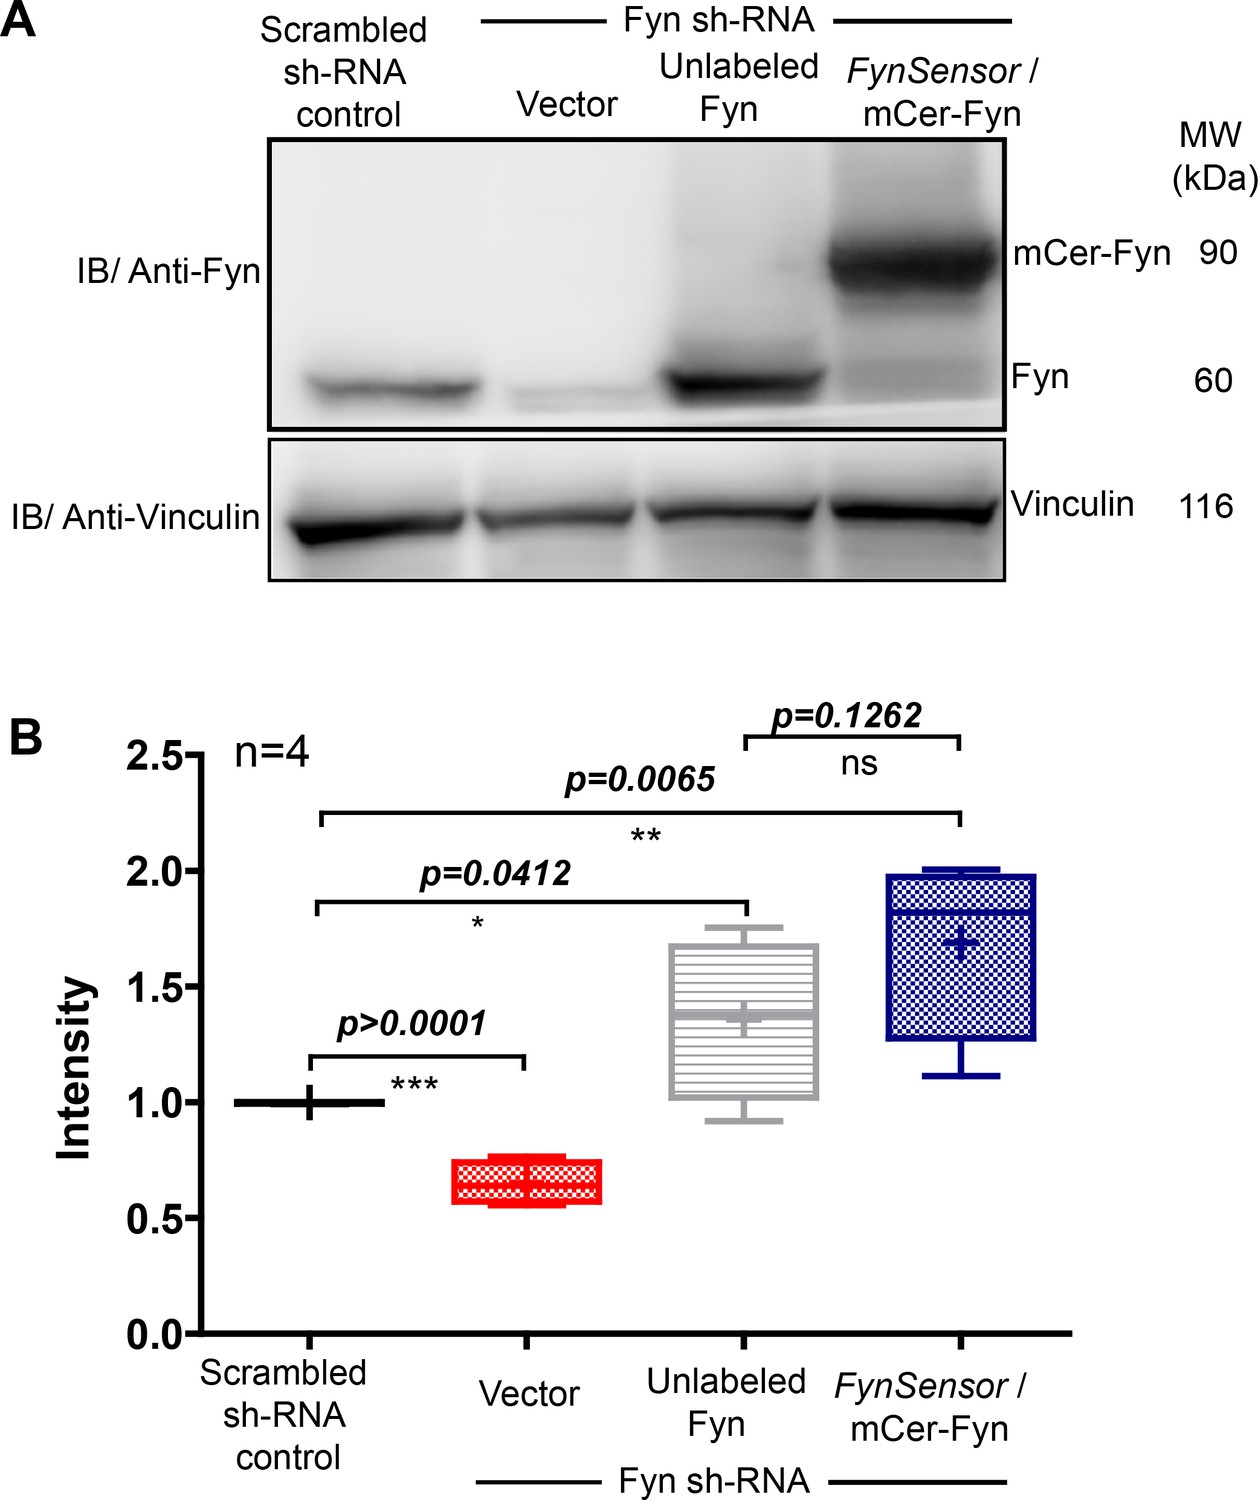
(A) Immunoblot showing Fyn protein levels in either control HEK293T cells (harbouring scrambled sh RNA), Fyn knockdown cells (stable Fyn sh RNA cells along with an empty vector), Fyn knockdown cells expressing wild type, unlabeled Fyn or Fyn knockdown cells expressing FynSensor. Blot probed using Anti-Fyn antibody, with vinculin as a loading control. (B) The Box-and-Whisker plot quantifying Fyn protein levels in each of these cellular conditions from four independent experiments (n=4). The band intensities as obtained using ImageJ software, were first normalized to their respective loading controls (vinculin protein) and then used for plotting relative Fyn protein levels by further normalizing sample values to levels of endogenous Fyn in control HEK293T cells. Plot confirms that knockdown cells showed significant reduction in endogenous Fyn kinase levels. Expression of FynSensor caused a recovery of total Fyn levels, with resulting protein levels moderately higher as compared to the levels of endogenous Fyn in control cells. Data was analyzed using Student’s unpaired one tailed t-test on GraphPad Prism (respective p values are indicated on panel).
-
Figure 6—figure supplement 1—source data 1
Quantifying the expression of Fyn kinase (labeled or unlabeled) in Fyn KD-HEK293T cells relative to control cells.
- https://cdn.elifesciences.org/articles/50571/elife-50571-fig6-figsupp1-data1-v1.xlsx
Figure 6—figure supplement 2
FynSensor FRET spatial patterns and oscillations observed are independent of expression levels of labeled (FynSensor) Fyn.
FynSensor expression levels (as well as donor to acceptor ratios) in the distinct cell-types used for imaging are quantified here. Overall, the distributions across cell types are found to be similar. Also see Figure 6C. (A) Scatter plot showing the distribution of donor/acceptor fluorescence ratios (mCer-Fyn/mVenus-F29) in the different cell types where FynSensor constructs have been ectopically expressing and used for biosensor imaging. n = 32 cells for C2C12, 30 for U2OS and 24 for HEK-KD cells. Distributions of donor/acceptor ratios are similar across cell types showing expression levels are carefully controlled and imaging conditions are comparable. (B) Consistent FynSensor spatio-temporal patterns are observed independent of precise levels of labeled Fyn. Confocal micrograph and time traces showing FRET patterns and temporal changes from representative U2OS cells from the data set, having either relatively ‘high’ (above the mean value of 51.61 ± 1.805 fluorescence intensity units, denoted by black box) or ‘low’ (below the mean value, black box) FynSensor expression (donor m-Cer fluorescence intensities). Data and images confirm very similar spatially compartmentalized and pulsatile Fyn activity patterns from two example cells expressing different amounts of labeled Fyn. This demonstrates that the conserved Fyn activity patterns revealed here in individual cells are independent of precise expression levels, within the specified ranges.
-
Figure 6—figure supplement 2—source data 1
Quantification of donor:acceptor ratios in different cell types used for FynSensor imaging experiments.
- https://cdn.elifesciences.org/articles/50571/elife-50571-fig6-figsupp2-data1-v1.xlsx
-
Figure 6—figure supplement 2—source data 2
Analysis of spatio-temporal Fyn activity patterns in U2OS cells expressing different levels of Fyn kinase.
- https://cdn.elifesciences.org/articles/50571/elife-50571-fig6-figsupp2-data2-v1.xlsx
Figure 7 with 4 supplements
FynSensor imaging reveals spatially-compartmentalized temporal bursts of kinase activity across distinct cell types.
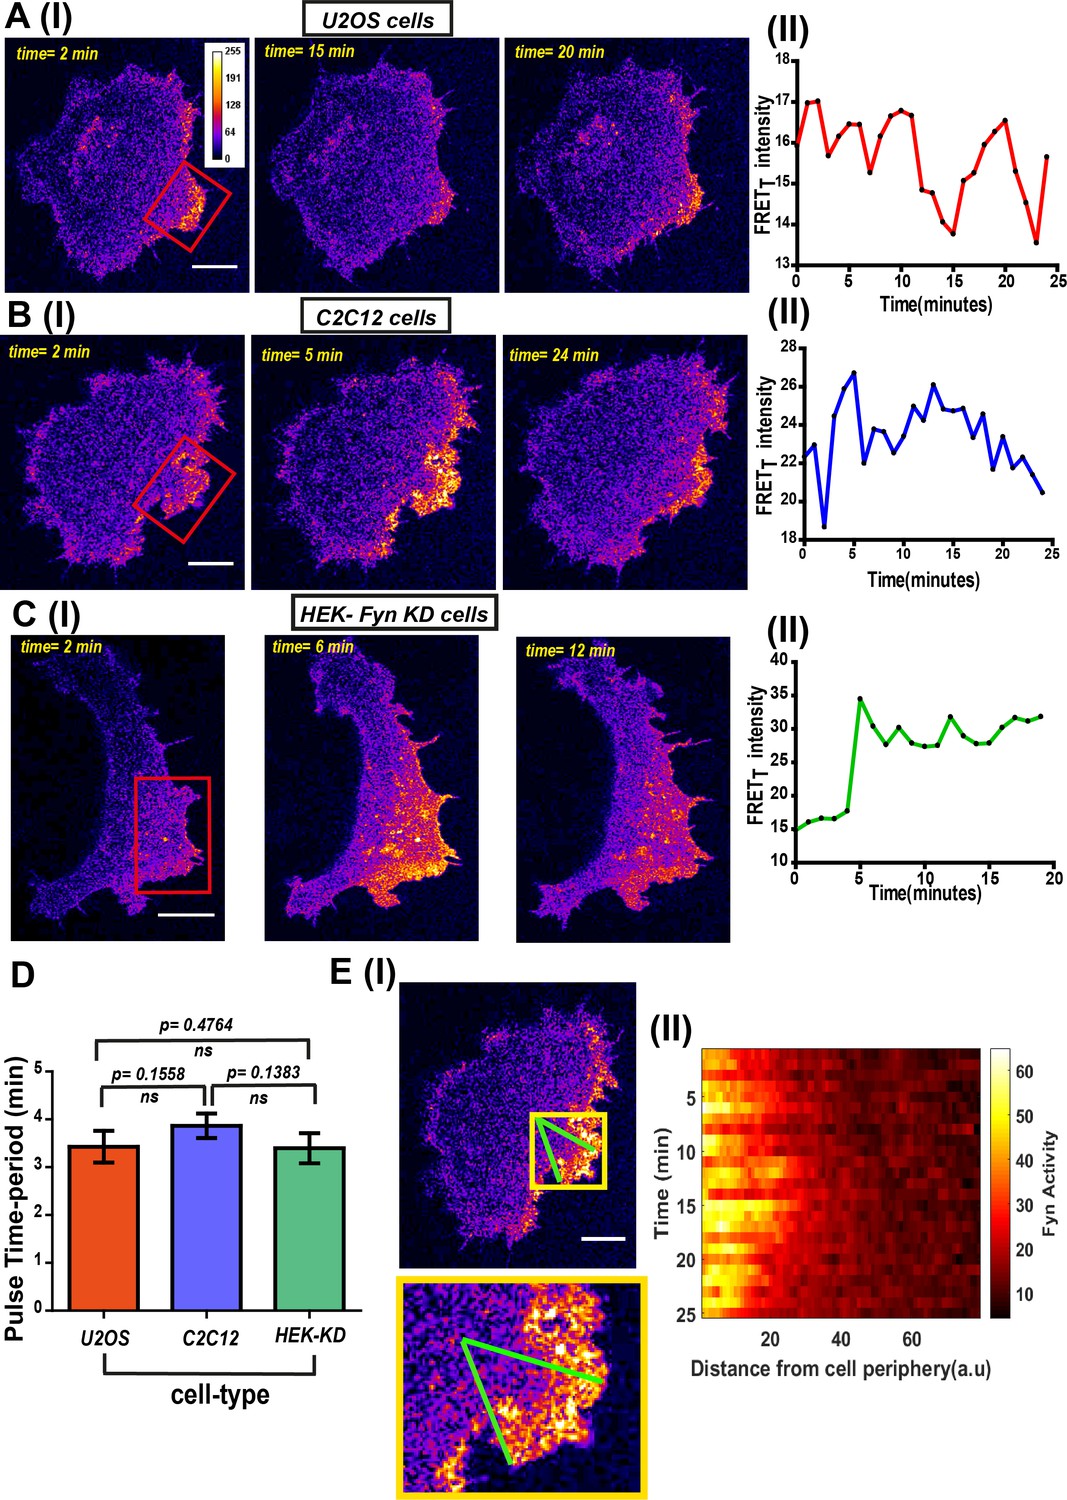
(A) A striking feature revealed by FynSensor is the pulsatile nature of Fyn activation. (I) Representative confocal micrographs of a U2OS cell at different time points after being plated on FN, as indicated, reveal significant oscillations in the FRETT intensity (area marked by red box) (Scale bar = 10 μm). (II) Time-traces of the FRETT signal showing temporal pulses of Fyn activity. (B) FynSensor imaging in C2C12 mouse myoblast cells, a cell-type distinct from the U2OS human osteosarcoma cells, also show an oscillating Fyn activity profile. (I) Confocal micrographs from a C2C12 cell transiently expressing FynSensor, at different time-points post FN plating, shows temporal bursts of kinase activity (area marked by red box). (II) Time-trace showing the pulsatile temporal pattern in FRETT signal in the cell shown. (C) FynSensor imaging reveals pulsatile activity patterns in Fyn knockdown cells that have been ‘rescued’ with labeled Fyn (mCer-Fyn). Fyn activity pulses are similar to those observed in U2OS and C2C12, showing temporal patterns are robust and conserved. (I) Representative cell confocal micrograph of RNAi-Fyn knockdown HEK-293 (KD) cells expressing FynSensor show temporal oscillations in FRETT levels (area marked by red box). (II) Time-trace of FRETT signal from individual cell revealing pulsatile Fyn signal. (D) Oscillatory/pulsatile behavior in levels of active Fyn in the different cell-types studied reveal a consistent major time period. Plotted here is the mean of the dominant time-period of FynSensor FRET pulses in U2OS C2C12 and HEK-KD cells expressing the sensor, determined through power spectrum density (PSD) analysis on the time-traces of single-cell quadrant averaged total FRET. The PSD analysis reveals the mean of dominant time-period to be ~3.5 min in distinct cell types. N = 37 for U2OS, 32 for C2C12 and 16 for HEK-KD cells. Values are mean ± s.e.m. Student’s two-tailed unpaired t-test has been used to determine the p-value. See Materials and methods for details of the analysis. (E) Pulsatile Fyn activity is spatially constrained. Intracellular zones of elevated Fyn activity also show clear oscillations over time. (I) Confocal fluorescence micrograph of a C2C12 cell shows a zone of high FRET signal (indicated by yellow box). For plotting temporal oscillations over distance from edge, an arc (of arbitrary length units) was suspended on the membrane encompassing this zone. A smaller sector was then created on the cell (indicated by green lines). (II) Plot shows a heat map of FRETT intensity values in this sector, over time, as a function of distance from the cell- membrane. Data reveals that active kinase to be spatially constrained and oscillating over time. See Materials and methods for details of the analysis.
-
Figure 7—source data 1
Analysis of temporal patterns of Fyn activity in U2OS cell.
- https://cdn.elifesciences.org/articles/50571/elife-50571-fig7-data1-v1.xlsx
-
Figure 7—source data 2
Analysis of temporal patterns of Fyn activity in C2C12 cell.
- https://cdn.elifesciences.org/articles/50571/elife-50571-fig7-data2-v1.xlsx
-
Figure 7—source data 3
Analysis of temporal patterns of Fyn activity in Fyn-KD HEK 293 T cell.
- https://cdn.elifesciences.org/articles/50571/elife-50571-fig7-data3-v1.xlsx
-
Figure 7—source data 4
Quantification of Fyn activity pulse time-period across different cell-types.
- https://cdn.elifesciences.org/articles/50571/elife-50571-fig7-data4-v1.xlsx
-
Figure 7—source data 5
Quantification of Fyn activity relative to distance from cell membrane in C2C12 cell.
- https://cdn.elifesciences.org/articles/50571/elife-50571-fig7-data5-v1.xlsx
Figure 7—figure supplement 1
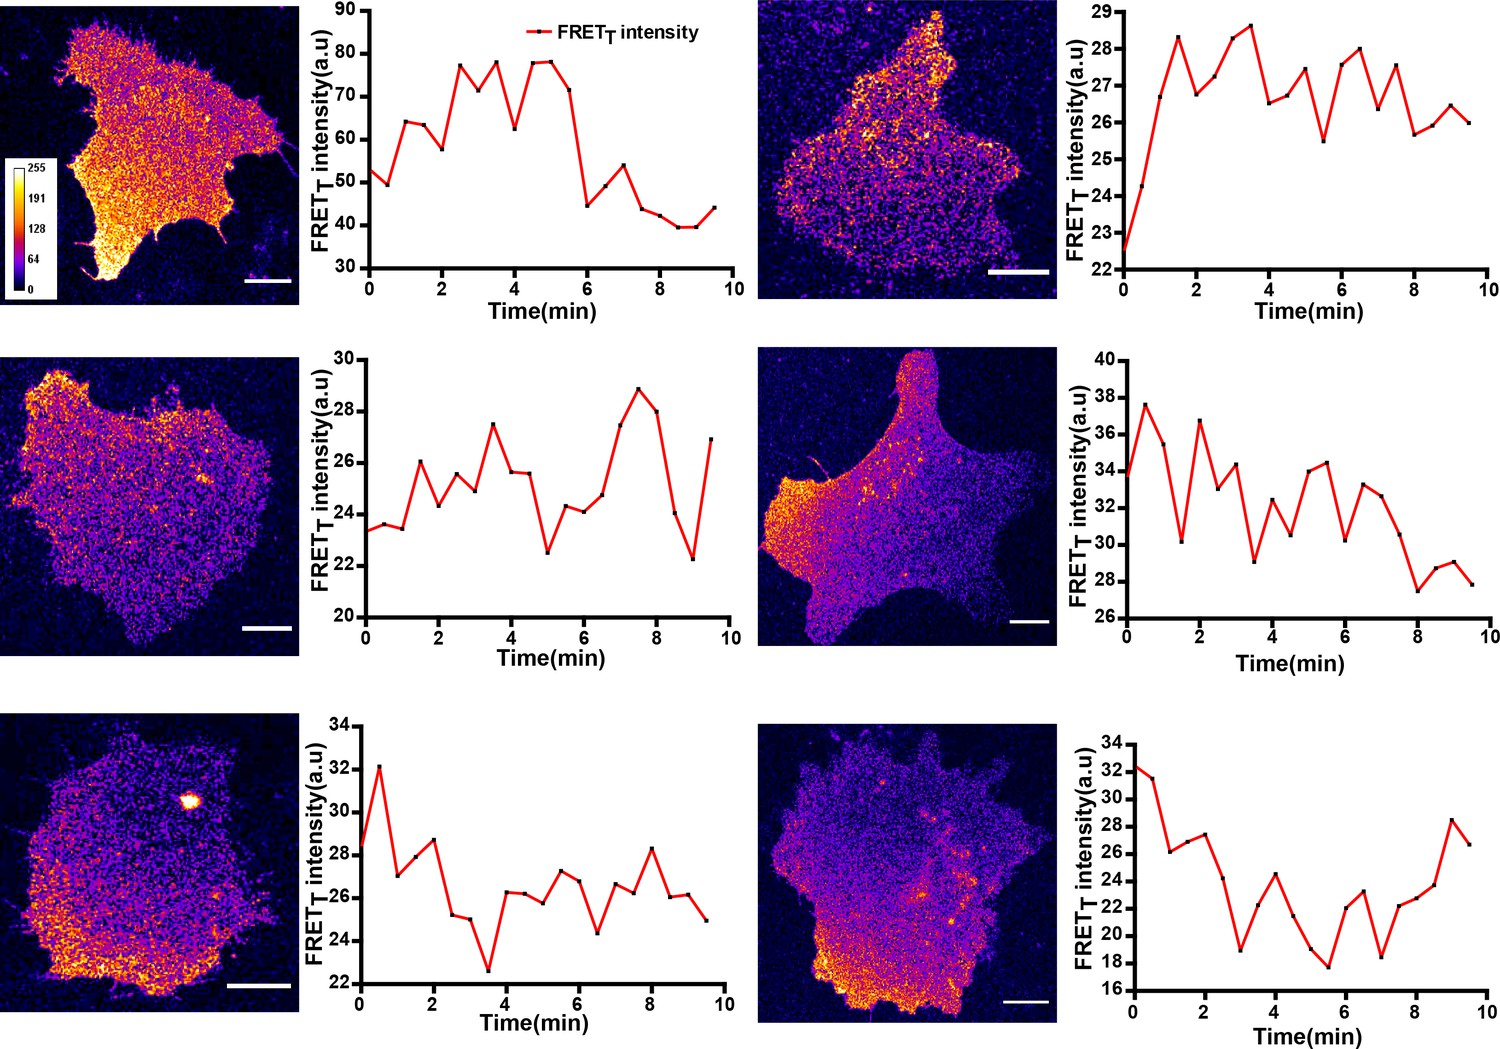
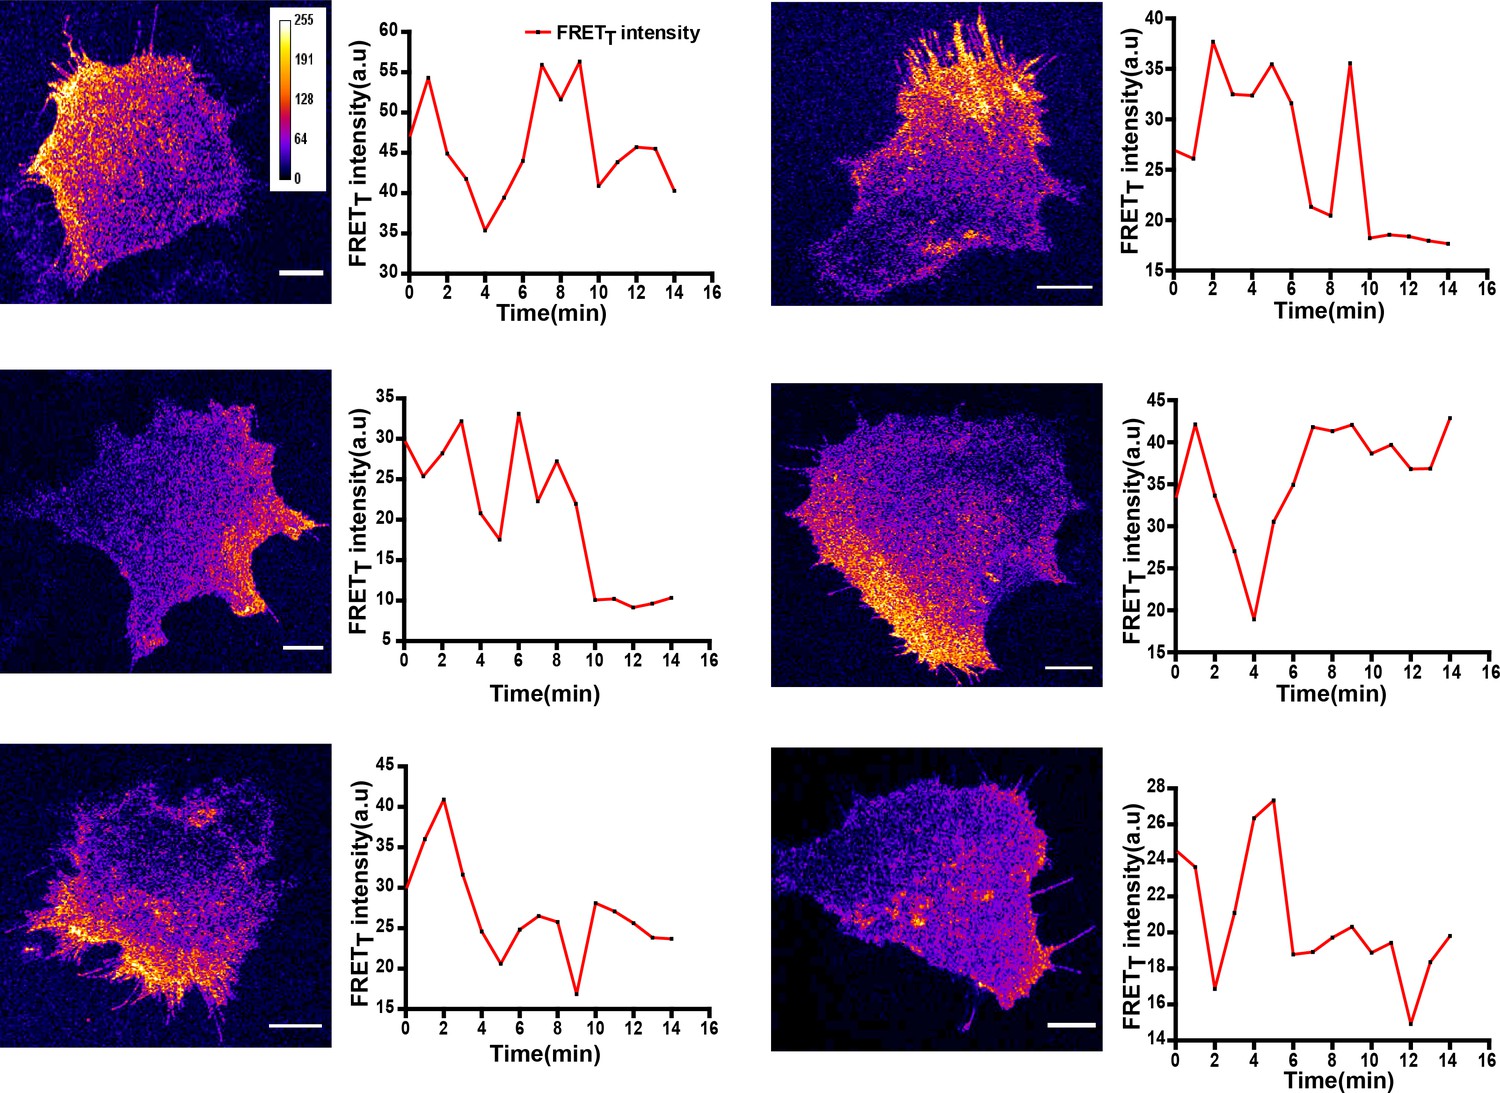
FynSensor reveals spatially localized active Fyn, pulsatile Fyn activity in U2OS osteosarcoma cells.
Quantitative image analysis of donor sensitized emission in U2OS cells transiently expressing FynSensor reveals spatially constrained and temporally dynamic Fyn activity. Shown here are the FRETT profile of six cells over time. Scale bar = 10 µm.
-
Figure 7—figure supplement 1—source data 1
Quantification of FRETT signal over time in multiple U2OS cells.
- https://cdn.elifesciences.org/articles/50571/elife-50571-fig7-figsupp1-data1-v1.xlsx
Figure 7—figure supplement 2
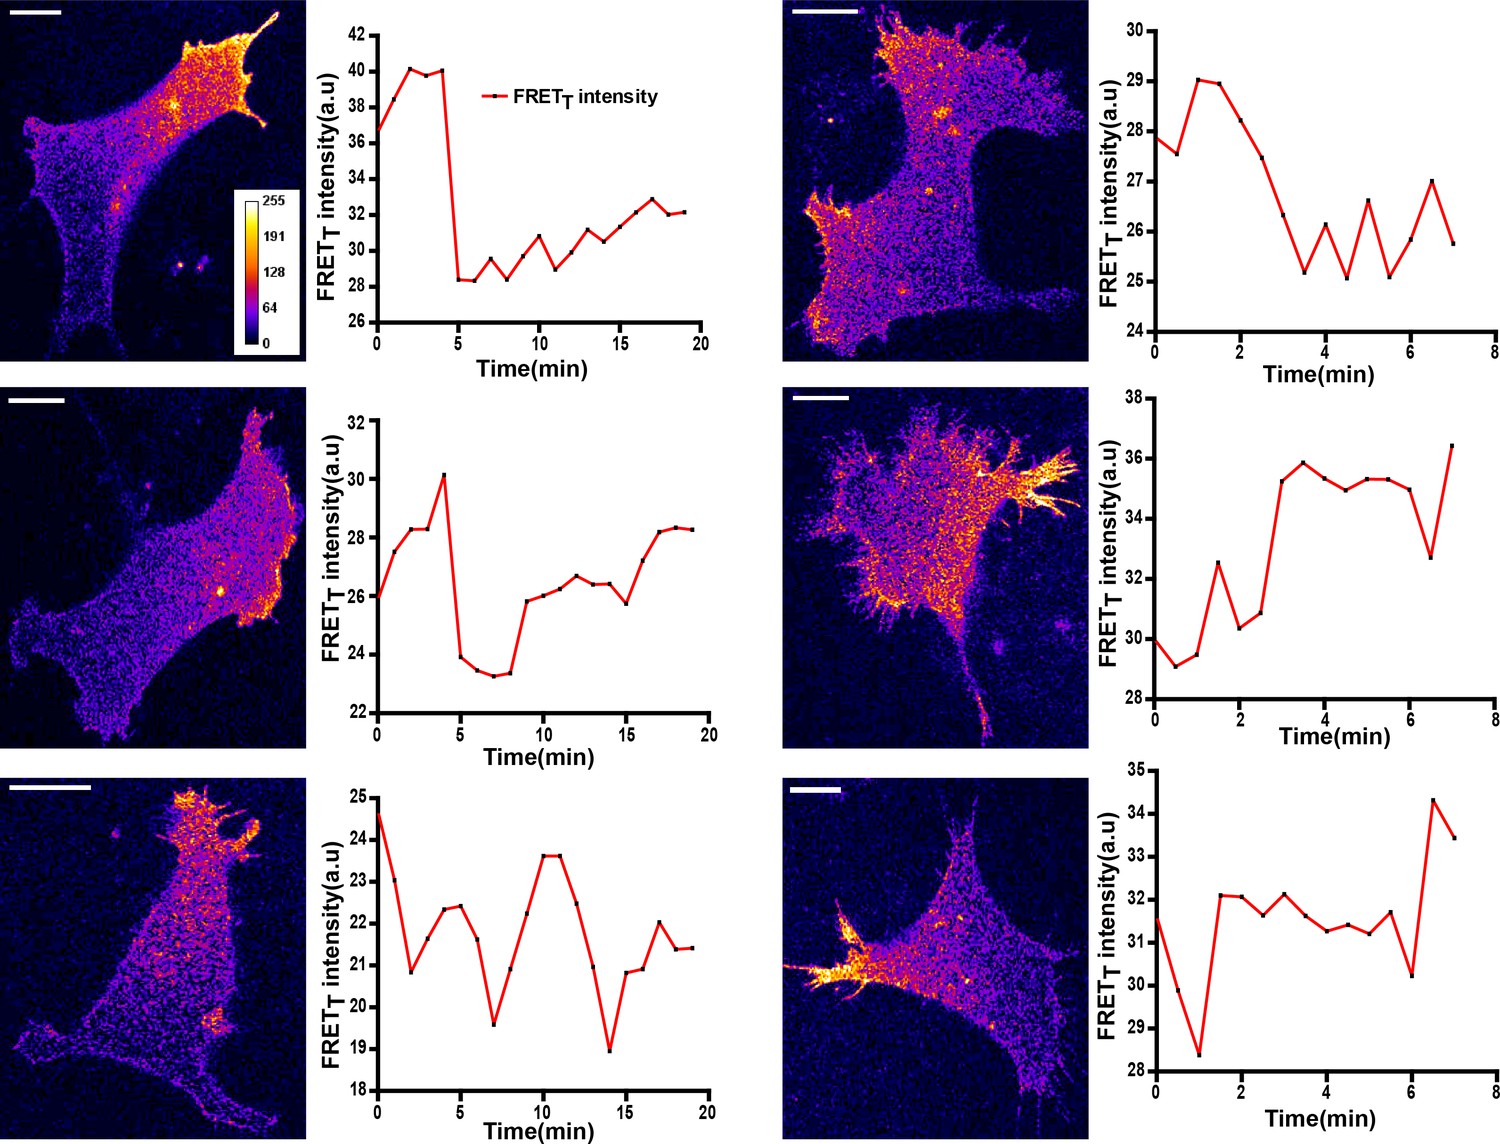
Localized and dynamic kinase activity patterns in C2C12 mouse myoblast cells.
FynSensor imaging in C2C12 mouse myoblast cells, a non-cancerous cell-line also reveals activity patterns similar to those seen in the human osteosarcoma cell line, U2OS suggesting that these activity patterns are not an artefact of the cell-line used. Representative of FRETT profiles over time from six cells transiently expressing FynSensor. Scale bar = 10 µm.
-
Figure 7—figure supplement 2—source data 1
Quantification of FRETT signal over time in multiple C2C12 cells.
- https://cdn.elifesciences.org/articles/50571/elife-50571-fig7-figsupp2-data1-v1.xlsx
Figure 7—figure supplement 3
FynSensor imaging in HEK-293T cells lacking endogenous Fyn kinase shows activity patterns similar to those seen in U2OS and C2C12 cells.
FynSensor imaging in HEK-293T cells lacking endogenous Fyn kinase shows activity patterns similar to those seen in U2OS and C2C12 cells. HEK-293T cells in which the endogenous kinase has been knocked-down using RNA-i were transfected with FynSensor. Representative confocal micrographs shown here, have kinase activity patterns very similar to those seen in U2OS and C2C12 cells. Also shown here are the FRETT profiles over time of six such cells. Scale bar = 10 µm.
-
Figure 7—figure supplement 3—source data 1
Quantification of FRETT signal over time in multiple Fyn-KD HEK 293 T cells.
- https://cdn.elifesciences.org/articles/50571/elife-50571-fig7-figsupp3-data1-v1.xlsx
Figure 7—video 1
Fyn activation in human osteosarcoma cell-line, U2OS cells.
Live cell imaging of U2OS cells transfected with FynSensor plated on Fibronectin (FN). Panel shows FRET index image using Fire LUT (Fiji) appropriately scaled for ease of visualization. Individual images were acquired at 60X at an interval of 60 s and then stitched together to make a video (played at 3 frames/second). Time stamp indicates elapsed time. Color bar shows intensity of FRET signal. Basal level of Fyn activity (caused by integrin engagement) is spatially compartmentalized and shows temporal bursts of signals (activity pulses). Scale bar = 10 µm.
Figure 8 with 3 supplements
Integrin-dependent, spatially compartmentalized, pulsatile Fyn activity can be modulated by growth factor suggesting signaling crosstalk.
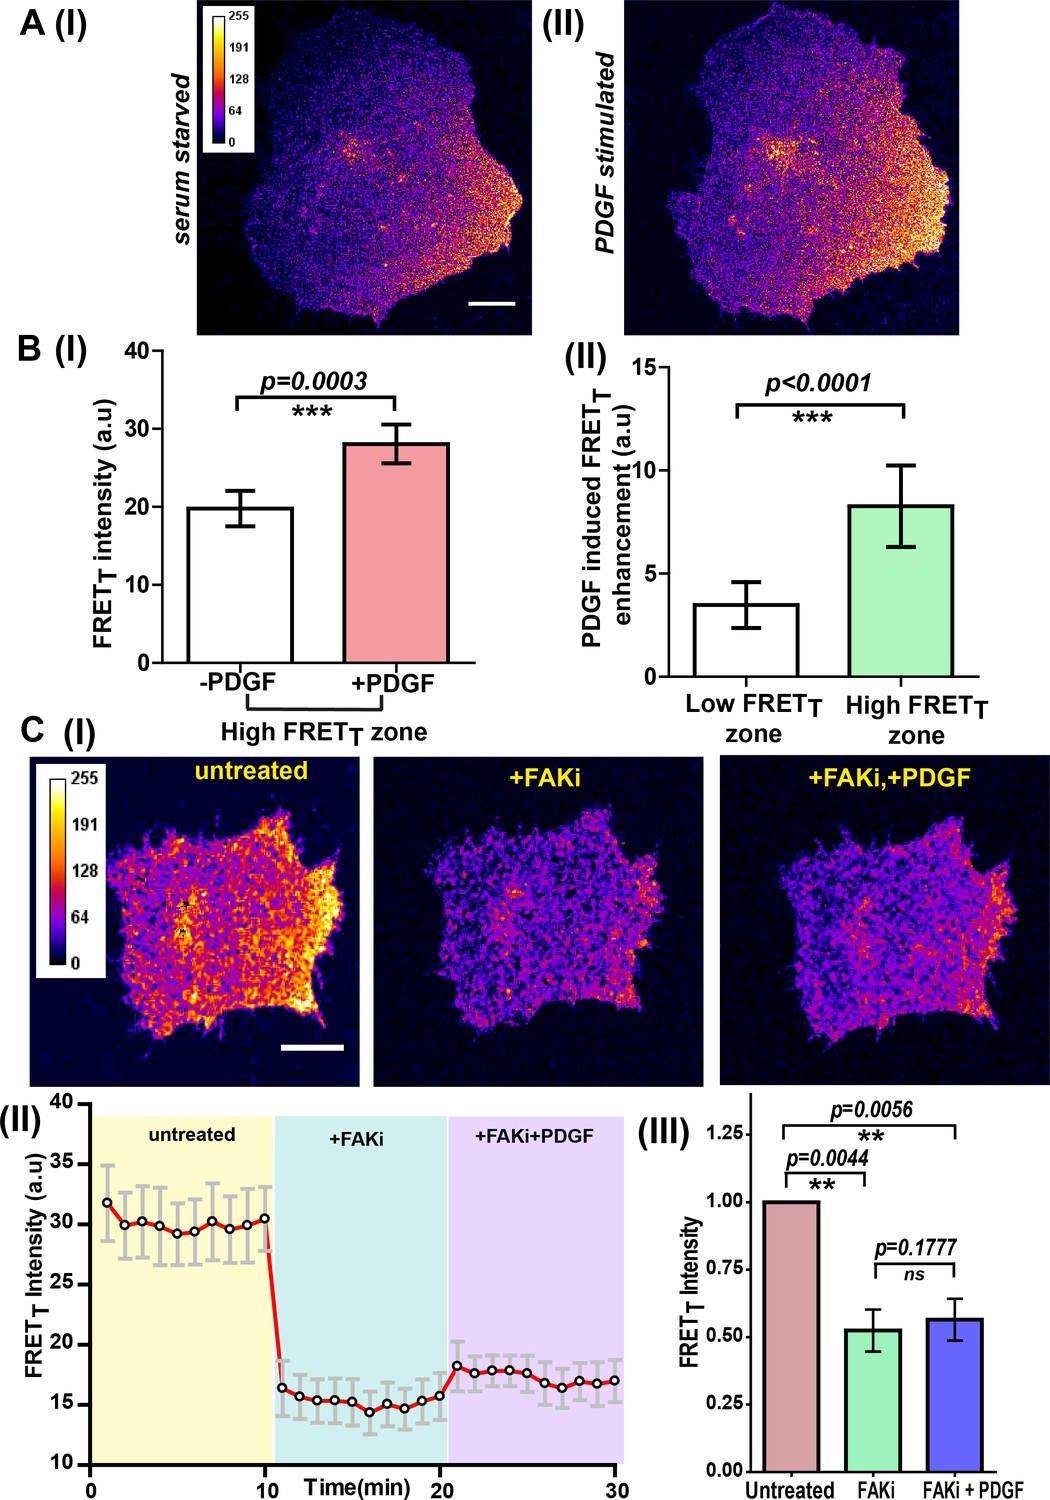
(A) Spontaneously formed zones of active Fyn in serum-starved cells plated on FN can be further modulated by Platelet-derived growth factor (PDGF). Representative confocal fluorescence micrographs showing sensitized emission (FRETT) levels indicative of active Fyn in serum-starved (I) and PDGF-stimulated U2OS cells (II) (Scale bar = 10 μm). (B) Quadrant analysis of cells reveal that on a global PDGF stimulation of serum-starved cells, the increase in Fyn activity observed was spatially localized (I) Bar graph comparing the mean of Max-FRETT-HFQ before and after addition of PDGF (10 ng/ml) indicates the FRETT intensity increase in the high FRET zone on addition of PDGF. Values are mean ± s.e.m. Student’s paired one-tailed t-test has been used to determine the p-value (n = 18 cells). (II) PDGF-induced enhancement in Fyn activity is greater in pre-activated intracellular zones. Bar graph show the difference in the mean intensities of the maximum FRETT (Max-FRETT) obtained before and after PDGF addition for both ‘high FRET’ as well as ‘low FRET’ quadrants/zones across single cells. Quadrants were designated as ‘HFQ’ or ‘LFQ’ in FN-plated cells, prior to PDGF stimulation (n = 18 cells). Values are mean ± s.e.m. Student’s paired one-tailed t-test has been used to determine the p-value. (C) Focal adhesion kinase (FAK) activity not only regulates Fyn activity but is required for the modulation/enhancement of Fyn activity by PDGF. (I) Confocal fluorescence micrographs showing sensitized emission (FRETT) levels in untreated/serum starved cells, after treatment with FAK inhibitor (FAKi, PF-562271 and then followed by further treatment with PDGF. Scale bar = 10 µm. FAK inhibition attenuates FRET levels (active Fyn levels) in FN-plated serum-starved cells AND abolishes the enhancement and modulation of Fyn activity by PDGF. FAKi treated cells fail to respond to PDGF as measured through FynSensor FRET levels. (II) The mean FRETT intensity profile for the high FRETT quadrant in 5 cells plotted over time. Also, marked in color are experimental condition or the treatments; serum starved cells (yellow, t = 0–10 mins), + FAKi (cyan, t = 10–20 mins) AND +FAKi+PDGF (lavender, t = 20–30 mins). Values are mean ± s.e.m. (III) Whole cell FRETT data from all the cells (n = 5) for untreated cells, +FAKi, and +FAKi+PDGF. The mean intensity value of untreated cells has been used to normalize the data. Student’s two-tailed paired t-test has been used to determine the p-value. Values are mean ± s.e.m. Data show no significant enhancement is seen in Fyn activity by PDGF stimulation, if cells are pre-treated with FAKi.
-
Figure 8—source data 1
Quantification of PDGF-induced enhancement in Fyn activity across different cellular zones.
- https://cdn.elifesciences.org/articles/50571/elife-50571-fig8-data1-v1.xlsx
-
Figure 8—source data 2
Quantification of FRETT levels in untreated cells, followed by FAK inhibitor treatment and further treatment with PDGF.
- https://cdn.elifesciences.org/articles/50571/elife-50571-fig8-data2-v1.xlsx
Figure 8—figure supplement 1
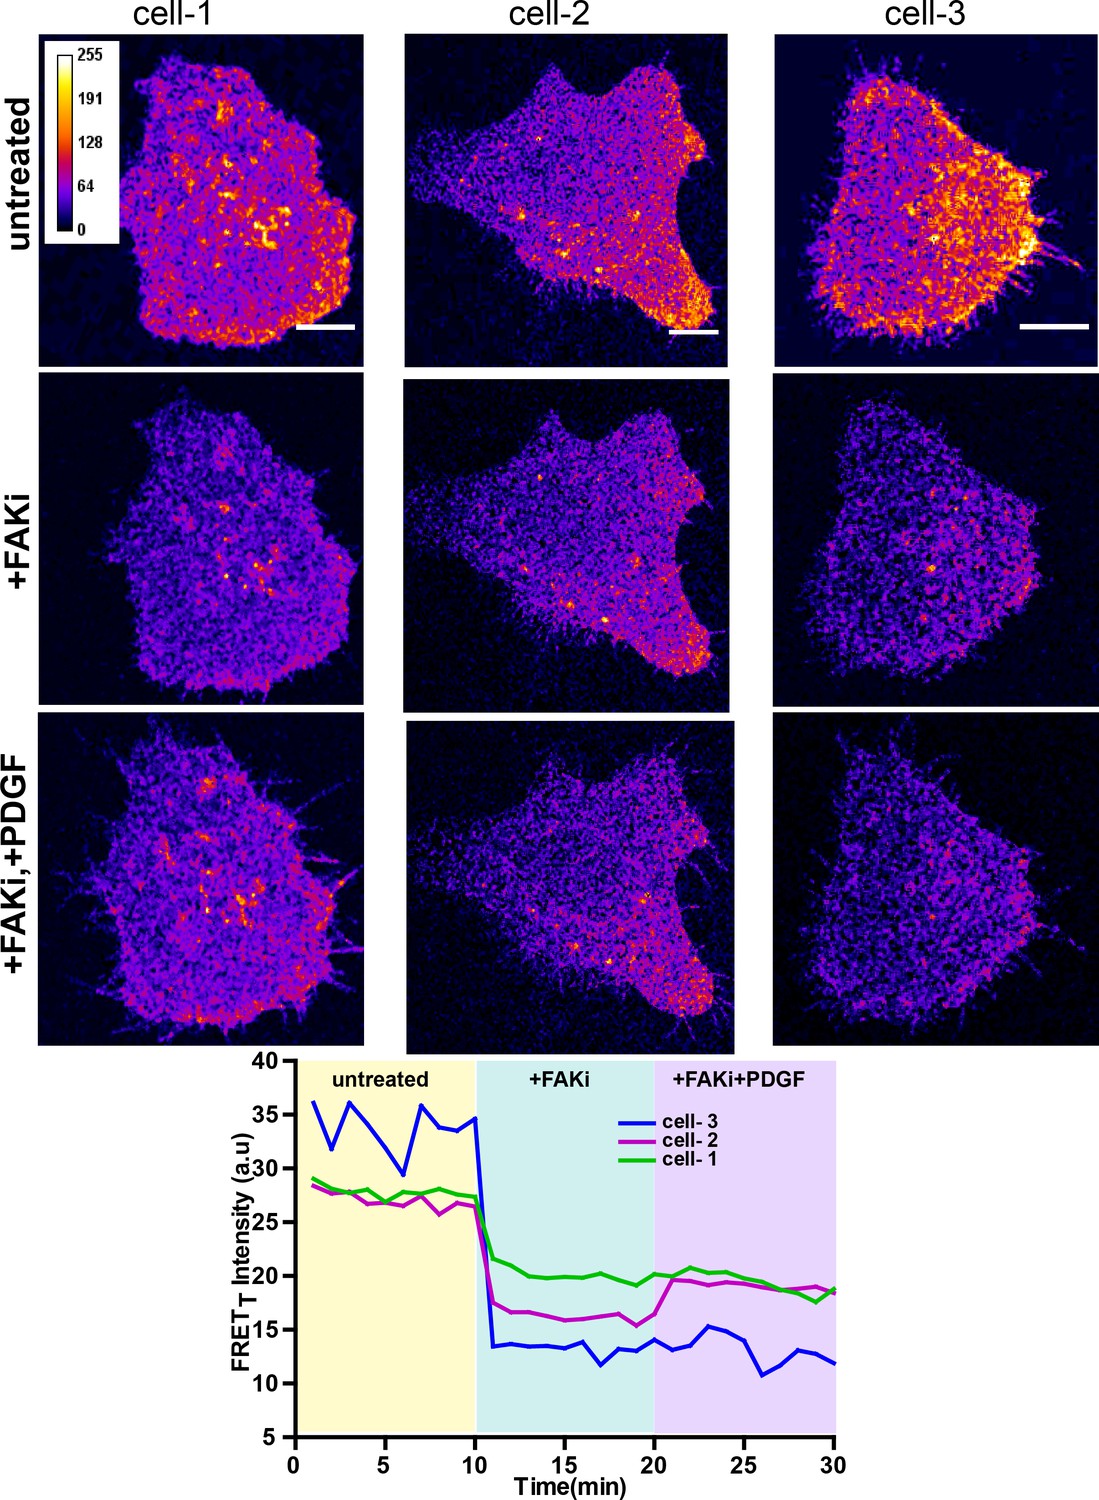
FAK activity is required for modulation of Fyn activity by PDGF.
Confocal fluorescence micrographs showing sensitized emission (FRETT) levels in untreated/serum starved cells, after treatment with FAK inhibitor (FAKi, PF-562271 and then followed by further treatment with PDGF. Scale bar = 10 µm. Individual FRETT intensity profile for the high FRETT quadrant in the three cells plotted shown above over time. Also, marked in color are experimental condition or the treatments; serum starved cells (yellow, t = 0–10 mins), +FAKi (cyan, t = 10–20 mins) AND +FAKi+PDGF (lavender, t = 20–30 mins).
-
Figure 8—figure supplement 1—source data 1
Quantification of FRETT levels in untreated cells, followed by FAK inhibitor treatment and further treatment with PDGF.
- https://cdn.elifesciences.org/articles/50571/elife-50571-fig8-figsupp1-data1-v1.xlsx
Figure 8—video 1
Fyn activity in U2OS cells is modulated by PDGF.
Live cell imaging of U2OS cells transfected with FynSensor before and after PDGF stimulation. Panel shows FRET index image using Fire LUT (Fiji) appropriately scaled for ease of visualization. Individual images were acquired at 60X at an interval of 60 s and then stitched together to make a video (played at 3 frames/second). Time stamp indicates elapsed time, ‘+PDGF’ label shows the point at which PDGF was added to the cells. Colour bar shows intensity of FRET signal. Basal level of Fyn activity (un-stimulated state) is spatially compartmentalized and post PDGF addition, FRET response is strengthened significantly from this ‘compartment/zone’ and continues to be pulsatile. Scale bar = 10 µm.
Figure 8—video 2
FAK inhibitor treated, U2OS cells fail to respond to PDGF as reported through FynSensor.
Live cell imaging of U2OS cells transfected with FynSensor was treated with FAK inhibitor and then stimulated with PDGF. Panel shows FRET index image using Fire LUT (Fiji) appropriately scaled for ease of visualization. Individual images were acquired at 60X at an interval of 60 s and then stitched together to make a video (played at 5 frames/second). Time stamp indicates elapsed time, ‘+FAKi’ label shows the point at which FAK inhibitor was added and ‘+PDGF’ indicates the point at which PDGF was added to the cells. Color bar shows intensity of FRET signal. Localized activity of Fyn is greatly attenuated after treatment with FAK inhibitor. These cells also fail show any increase in FRET response after stimulation by PDGF. Scale bar = 10 µm.
Figure 9
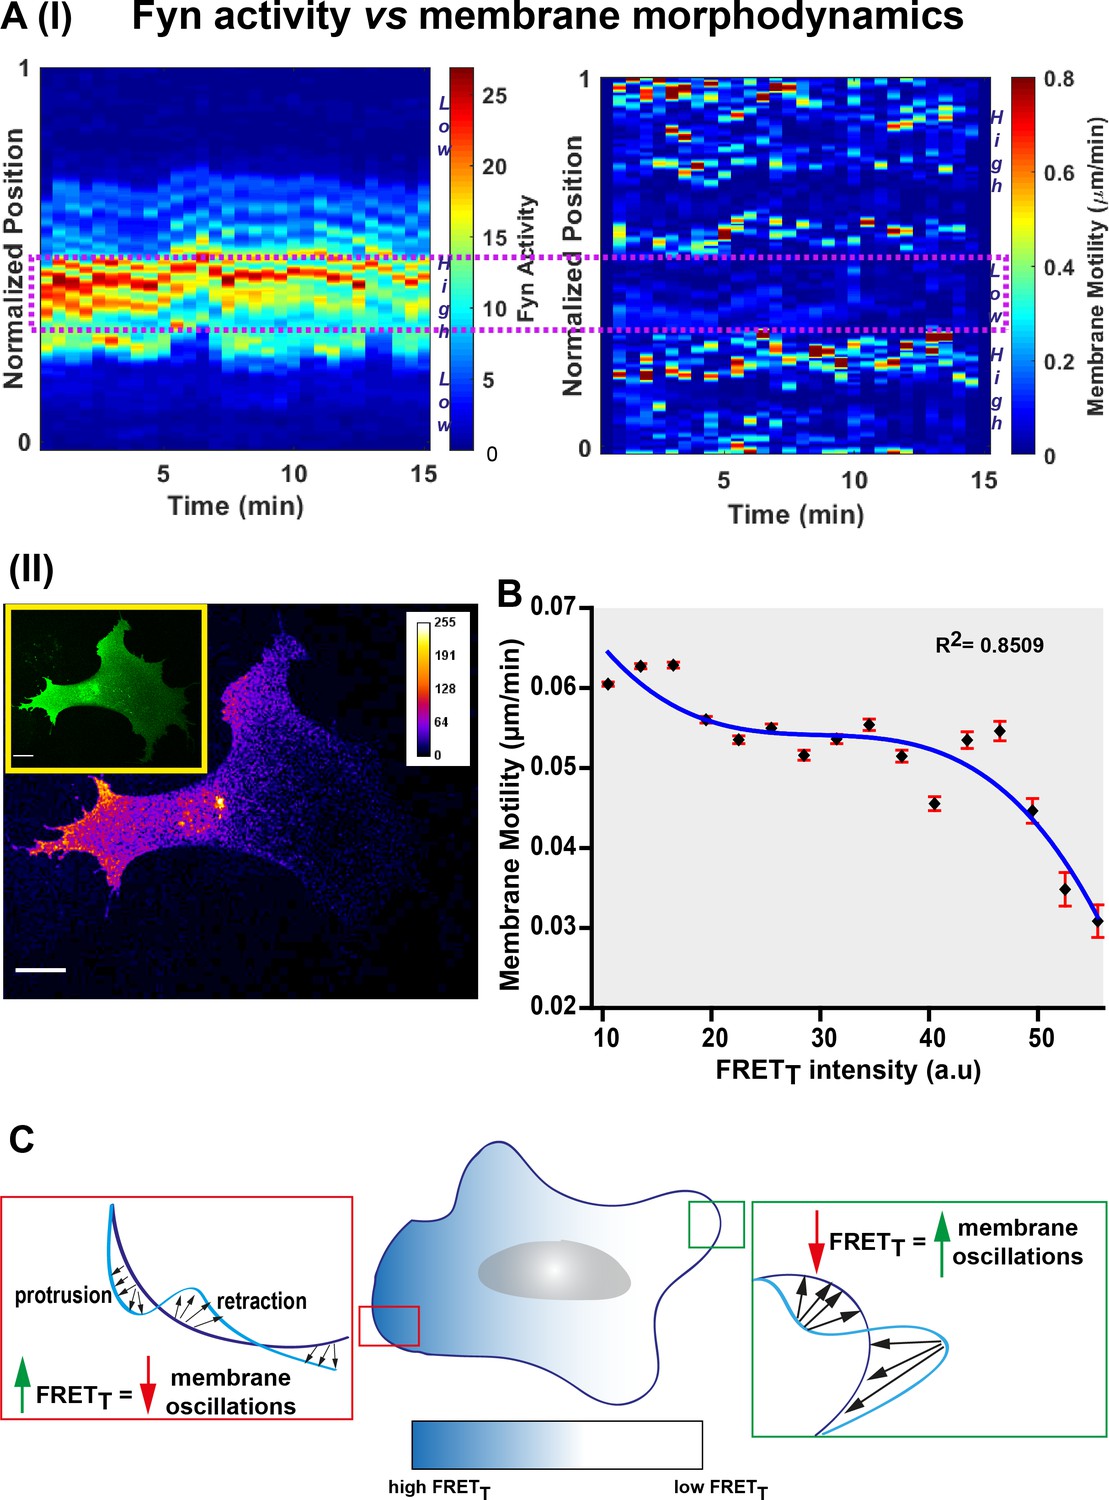
Fyn activity couples to cellular morphodynamics.
(A) Fyn activity correlates with reduced amplitudes of membrane protrusion-retraction as revealed by simultaneous measurement of membrane motility and FynSensor FRETT. Quantitative image analysis was performed using the ADAPT plugin [J Cell Biol (2015) 209 (1): 163–180]. (I) Representative 3D plots correlating Fyn activity (left) and membrane motility (right) for a single U2OS cell. Area within the dotted box marks region of high FRETT and low membrane motility. (II) A representative confocal micrograph (FRETT image) of the same U2OS cell showing Fyn activity to be spatially constrained (Inset: FRET channel image for clearly depicting the whole cell). (B) Graph shows the net membrane motility changes occurring over time, plotted against FRETT intensity for U2OS cells (n = 15 cells). FRETT levels are inversely correlated to membrane motility (Plot fitted using the equation f = y0+a*x+b*x^2+c*x^3; R (2) value = 0.8509). Values are mean ± s.e.m. (C) An illustration of Fyn activity being negatively correlated to membrane dynamics wherein, cellular zones showing higher Fyn activity (high FRETT) show reduced overall changes in membrane motility (lesser constitutive protrusion/retraction cycles).
-
Figure 9—source data 1
Quantification of correlation between membrane motility and Fyn activity across multiple U2OS cells.
- https://cdn.elifesciences.org/articles/50571/elife-50571-fig9-data1-v1.xlsx
Figure 10
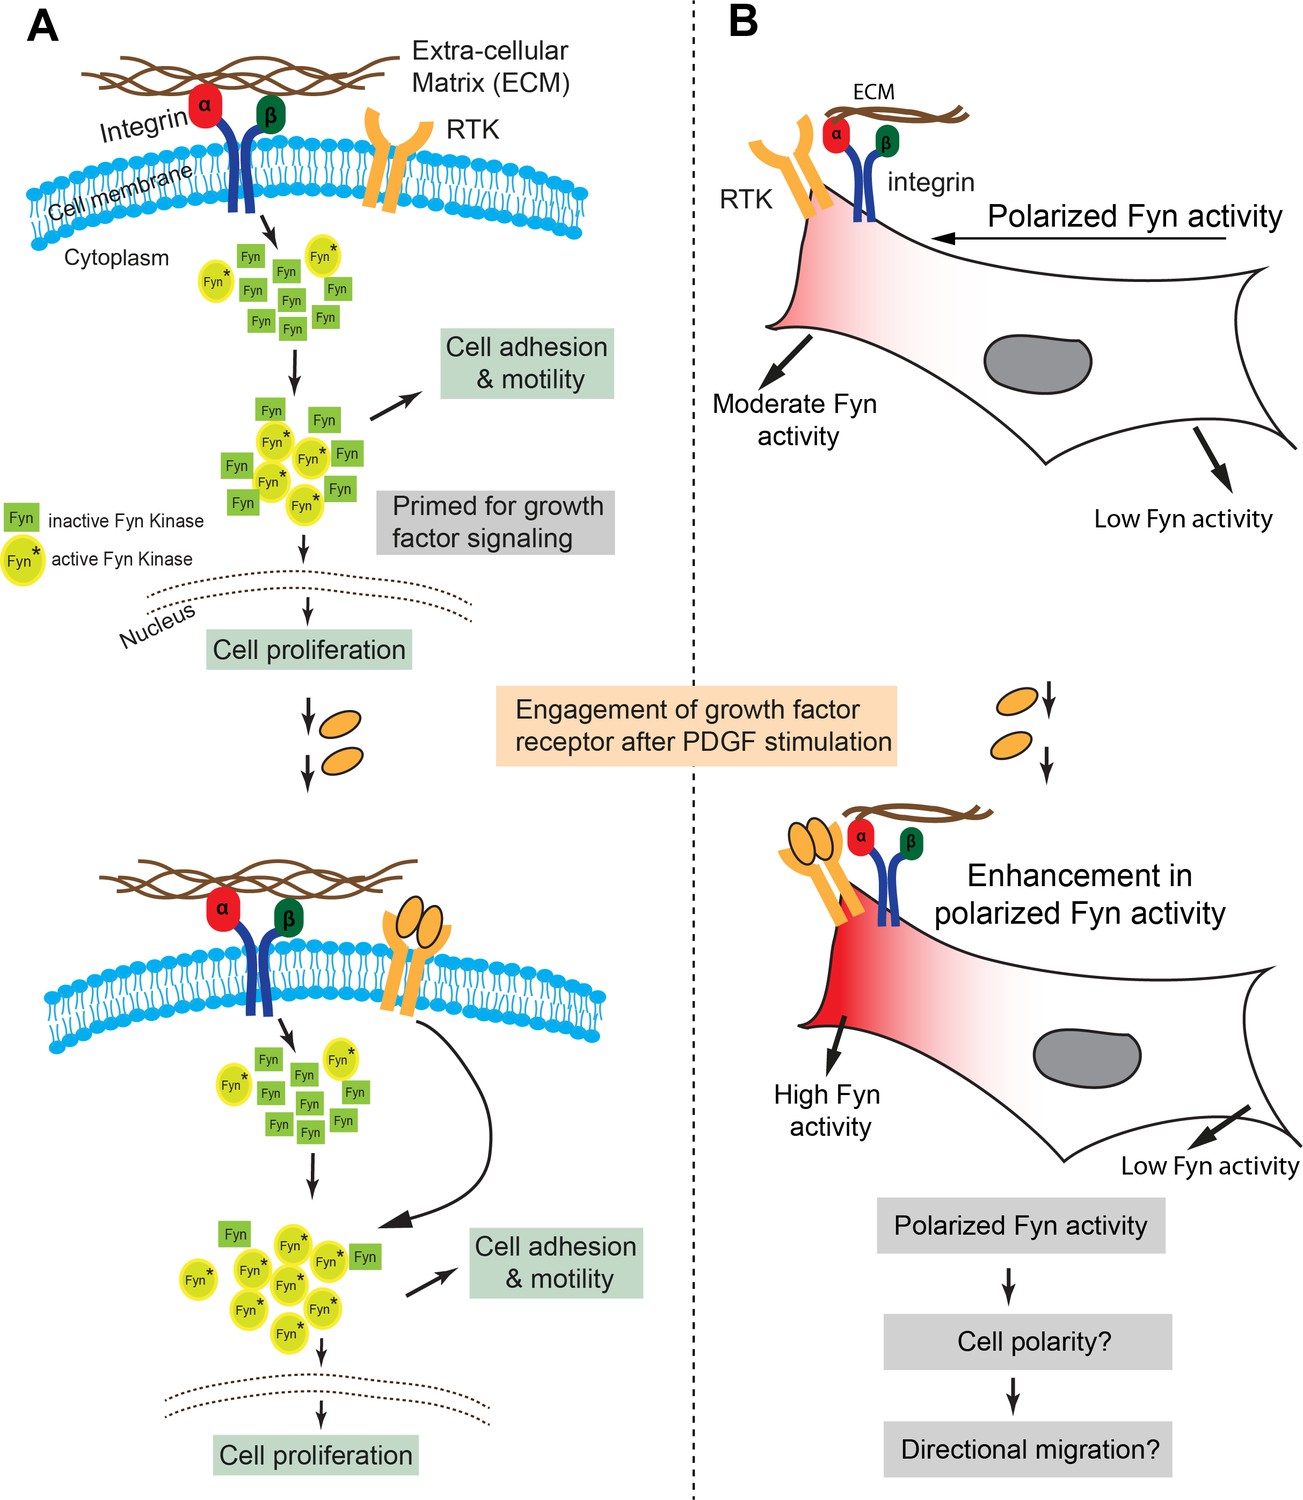
Model representing how Fyn activity helps mediate spatio-temporally localized signaling crosstalk.
(A) Src kinases have been long known to associate with the integrin receptor and growth factor receptor (RTK) signaling, thereby placing these kinases at nodal spots for signal integration. We provide the first visual proof for Fyn's involvement in integrating signals from these two receptor classes and see that the cell is highly polarized with respect to Fyn kinase activity. FynSensor shows that integrin receptor engagement results in formation of ‘zones’ of active Fyn in the cell, causing the cell to become polarized with respect to the activity of the kinase, even in serum-starved, FN-plated cells. PDGF stimulation further increases Fyn activity preferentially in these pre-sensitized regions only, thereby strengthening the spatially localized response. (B) Spatio-temporally localized Fyn activity; specifically, set-up through signal integration offers a quantitative picture of how Fyn activity may help regulate cell fate in certain situations. Fyn is known to be crucial for context-dependent cell migration and cell state switching in normal as well malignant cells, therefore, a spatio-temporally polarized response may be important for setting up cell output, especially for processes like that of directional cell migration and adhesion dependent cell switching. Pulsatile Fyn activity further suggests pre-organized signaling clusters with negative and positive feedback loops sensitive to both integrin and growth factor signaling.
Additional files
-
Supplementary file 1
Structural statistics and list of interactions observed in the Fyn-SH3:F29 complex.
- https://cdn.elifesciences.org/articles/50571/elife-50571-supp1-v1.docx
-
Supplementary file 2
List of constructs and primers used in the study.
- https://cdn.elifesciences.org/articles/50571/elife-50571-supp2-v1.docx
-
Supplementary file 3
Key Resources Table.
- https://cdn.elifesciences.org/articles/50571/elife-50571-supp3-v1.docx
-
Transparent reporting form
- https://cdn.elifesciences.org/articles/50571/elife-50571-transrepform-v1.docx
Download links
A two-part list of links to download the article, or parts of the article, in various formats.
Downloads (link to download the article as PDF)
Open citations (links to open the citations from this article in various online reference manager services)
Cite this article (links to download the citations from this article in formats compatible with various reference manager tools)
A Fyn biosensor reveals pulsatile, spatially localized kinase activity and signaling crosstalk in live mammalian cells
eLife 9:e50571.
https://doi.org/10.7554/eLife.50571


